Embed Size (px)
Citation preview


Outline Model capabilities
Introduction Physics and Chemistry Biology Fate and Effects of
Chemicals Interface and Output
Example Applications Tenkiller Reservoir, OK Lake Hartwell, GA/SC
Wrap-up and model future

Acknowledgements Dr. Richard Park, Eco Modeling: model creator and
developer Jonathan Clough, Warren Pinnacle Consulting: chief
programmer


What is AQUATOX? Mechanistic simulation model for
aquatic ecosystems Streams, rivers, lakes, reservoirs, estuaries
Fate and effects of multiple stressors Nutrients Organic toxicants Suspended and bedded sediments Flow Temperature

AQUATOX Structure Time-variable
usually daily reporting time step can run from few days to decades
Spatially simple, but: thermal stratification salinity stratification can link multiple segments together
Modular and flexible model only what is necessary simple to complex food web
Control vs. perturbed simulations
1
23
4
5
6
6b
7 8 9
10
12
13 14
11
x
y
Feedback Seg.
Cascade Seg.
Feedback Link
Cascade Link
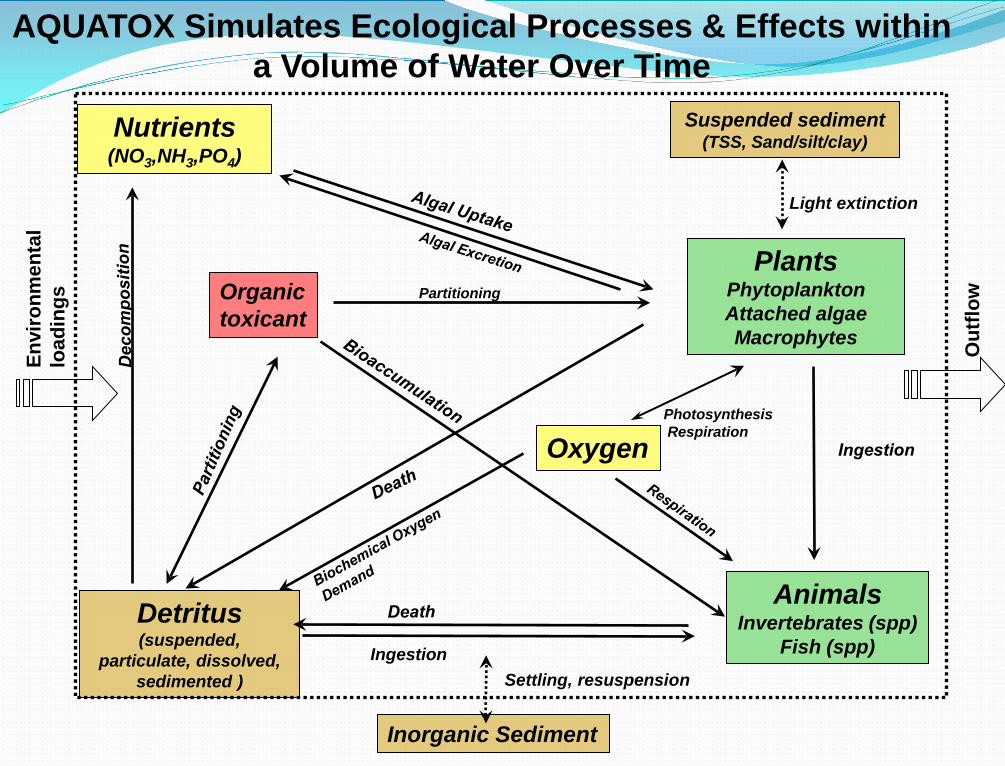
AQUATOX Simulates Ecological Processes & Effects within a Volume of Water Over Time
Inorganic Sediment
Nutrients (NO3,NH3,PO4)
Organic toxicant
Detritus (suspended,
particulate, dissolved, sedimented )
Oxygen
Plants Phytoplankton Attached algae Macrophytes
Suspended sediment (TSS, Sand/silt/clay)
Ingestion
Photosynthesis Respiration
Light extinction
Animals Invertebrates (spp)
Fish (spp) Settling, resuspension
Partitioning
Envi
ronm
enta
l lo
adin
gs
Out
flow

• Site characteristics • Biological characteristics default or • Chemical characteristics user-supplied • Environmental loadings
• Multiple sources • Variable or constant
• Watershed loads from BASINS (opt.) • Library or user-supplied
• Biomass • Pollutant concentrations • Tissue concentrations & BAFs • Process rates • Direct & indirect effects • Time variable
AQUATOX Inputs
AQUATOX Outputs

Why AQUATOX? A truly integrated eutrophication, contaminant fate
and effect model “is the most complete and versatile model described in the
literature” (Koelmans et al. 2001)
Comparison with other models Includes more biological components than water quality models
such as WASP7 or QUAL2K CASM models toxic effects but not fate
Comprehensive bioaccumulation model

One model, many questions Many waters are impaired, with multiple stressors To restore them we need to know:
Relative importance of stressors? Combined effects? Predicted effects of management actions?
Better water quality Fewer and/or smaller algae blooms More oxygen
Restore fisheries Will the fish be safe to eat?
What is the best management scenario? Which combinations of measures will work best? Any unintended consequences?
How long will recovery take?

Worldwide applications TMDL for TP
(ID)
Biomagnification of toxics (Three Gorges ,China)
Eco effects of climate change
(NY)
Eco effects of groundwater
contamination (Denmark)
Algae control in DW reservoir (FL)
Eutrophication of DW reservoir
(Mexico)
Watershed TMDL – multi-parameter
(MN)
Eutrophication in DW reservoir
(Turkey)
Eco effects of climate change
(MS)
Nutrient WQC (NV)
Nutrient WQC (VA)


Physical Characteristics of a Site
Modeled Waterbody
Deeply Buried Sediment
Sediment Active Layer (Well Mixed)
Water Inflow Water Discharge
Evaporation
Water Balance and Sediment Structure

detritus
dissolved in water
NH4 NO3
nitrification
denitrification
Plants*
animals
assimilation
mortality
mortality, defecation, gamete loss
Loadings Washout
excretion
N in pore waters (not in model domain
unless diagenesis model included)
macrophyte root uptake
free nitrogen (not in model domain)
decomp.
ingestion
ingestion
Nitrogen Cycle in AQUATOX
* : includes nitrogen fixation by cyanobacteria


Plant biomass Outflow
Metabolism Grazing Mortality Sinking
Photosynthesis
Turbulent diffusion Loading
How AQUATOX Models Plants
Habitat

Multiple plant groups Phytoplankton
greens, cyanobacteria, diatoms or “other”
Periphyton greens, diatoms, cyanobacteria, or “other” include live material and detritus snails & other animals graze it heavily subject to sloughing, even at relatively low velocity
Macrophytes benthic, rooted-floating, or free-floating heavy growths have significant effect on light climate may act as refuge from predation for animals leaves can provide significant surface area for periphyton growth

Periphyton Controlled by Multiple Independent Factors
0
1
2
3
4
5
6
7
8
Periphyton Observed Periphyton-grazed Observed-grazed
Grazers vs no grazers (high nutrients, low light)
One important factor is grazing by snails another is sloughing
Snails removed
Snails present
Time
Sloughing

Modeling Animals in AQUATOX
Loadings Washout
Vertical migration Consumption - maximum feeding rates - availability & preferences - reductions due to stress
Metabolism - defecation - excretion - respiration
Mortality - predation - natural mortality - toxicity
Reproduction - gamete loss - promotion - emergence

Multiple Animal Groups Zooplankton Benthic invertebrates Benthic insects Fish, with multiple year classes

Foodweb Model specified as Trophic Matrix

Modeling Toxicity Organic toxicants ≤ 20 chemicals simultaneously Lethal and sublethal effects Acute and chronic toxicity Effects based on total internal concentrations Option to model external toxicity
Useful if uptake and depuration are very fast (as with herbicides)
Ecological effects – direct and indirect Non-target organisms Food web disturbances Unintended consequences?

Toxicant in water: • ionization • volatilization • hydrolysis • photolysis • microbial degradation
Losses of toxicant: • predation • mortality • depuration • biotransformation • spawning • promotion • emergence
Uptake through gill: • respiration rate • assimilation efficiency
Uptake from diet • consumption rates • assimilation efficiency • growth rates • toxicity • lipid content
Fate and Bioaccumulation in AQUATOX
Toxicant in food sources
• Organic sediments • Algae
• nutrient cycling • loss of predation
Partitioning


AQUATOX Interface: Main Screen
Run simulations
Examine Output
Setup screen
Help feature
List of state variables

Output: Animals decline at different rates following single dose of chlorpyrifos
Chironomid (g/m2 dry)Green Sunfish, (g/m2 dry)Shiner (g/m2 dry)Green Sunfish2 (g/m2 dry) Daphnia (mg/L dry)
CHLORPYRIFOS 6 ug/L (PERTURBED)Run on 11-7-08 11:36 AM
9/10/19868/26/19868/11/19867/27/19867/12/19866/27/1986
g/m
2 dr
y
0.36
0.32
0.28
0.24
0.20
0.16
0.12
0.08
0.04
0.00
mg/L dry
0.9
0.8
0.7
0.6
0.5
0.5
0.4
0.3
0.2
0.1
0.0
Single dose of pesticide
Chironomids die immediately
Shiners lose food supply

% Difference Graph shows relative differences
DiatomsBlue-greensDaphniaStigeoclonium,CharaChironomidGreen Sunfish,ShinerGreen Sunfish2
CHLORPYRIFOS 6 ug/L (Difference)
9/10/19868/26/19868/11/19867/27/19867/12/19866/27/1986
% D
IFFE
REN
CE
400.0
350.0
300.0
250.0
200.0
150.0
100.0
50.0
0.0
-50.0
-100.0
Shiner
Chironomid

T1Chironomid(ppb) (ug/kg wet)T1Daphnia(ppb) (ug/kg wet)T1Shiner(ppb) (ug/kg wet)T1Diatoms(ppb) (ug/kg wet)T1Stigeoclonium,(ppb) (ug/kg wet)T1Blue-greens(ppb) (ug/kg wet)T1Chara(ppb) (ug/kg wet) T1 H2O (ug/L)
CHLORPYRIFOS 6 ug/L (PERTURBED)Run on 11-7-08 12:13 PM
8/26/19867/27/19866/27/1986
ug/k
g w
et
24300.0
21600.0
18900.0
16200.0
13500.0
10800.0
8100.0
5400.0
2700.0
0.0
ug/L
6.3
5.6
4.9
4.2
3.5
2.8
2.1
1.4
.7
.0
Track concentrations in tissues and water
Dissolved chlorpyrifos
Chlorpyrifos in shiners
Chlorpyrifos in Daphnia
Chlorpyrifos in phytoplankton

Process Rates Concentrations of state variables are solved using
differential equations Equation for periphyton concentrations is:
Individual terms of these equations can be saved and graphed
SloughSedPredationMortality
ExcretionnRespiratioesisPhotosynthLoadingdt
dBiomass
Peri
Peri
−+−−
−−+=
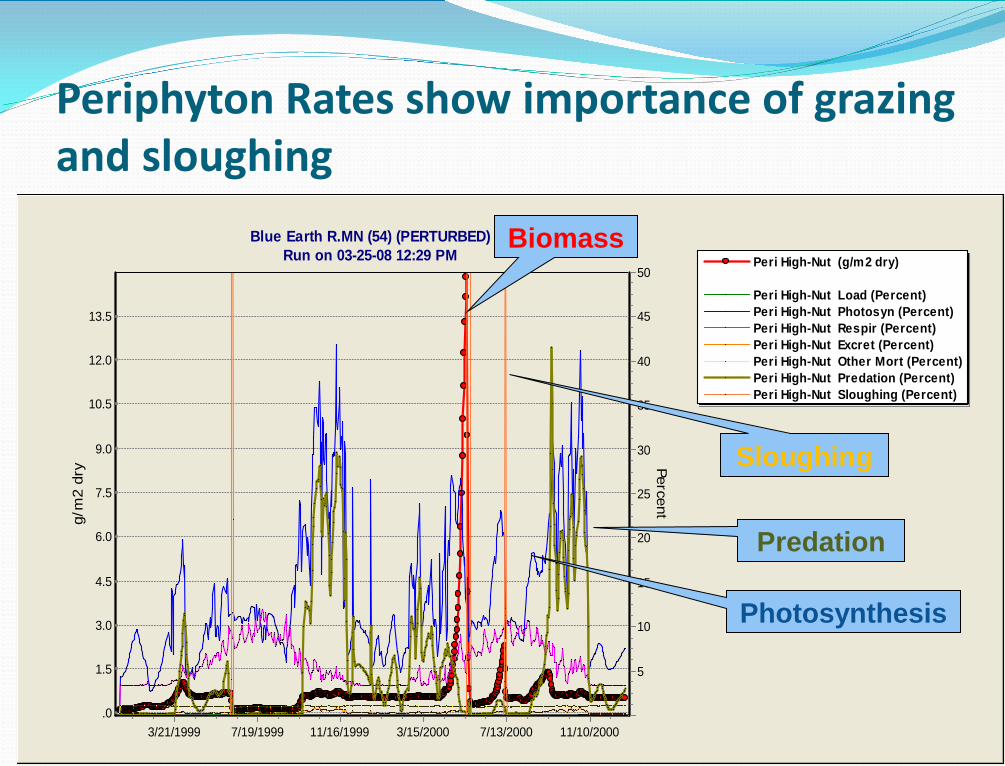
Periphyton Rates show importance of grazing and sloughing
Peri High-Nut (g/m2 dry) Peri High-Nut Load (Percent)Peri High-Nut Photosyn (Percent)Peri High-Nut Respir (Percent)Peri High-Nut Excret (Percent)Peri High-Nut Other Mort (Percent)Peri High-Nut Predation (Percent)Peri High-Nut Sloughing (Percent)
Blue Earth R.MN (54) (PERTURBED)Run on 03-25-08 12:29 PM
11/10/20007/13/20003/15/200011/16/19997/19/19993/21/1999
g/m
2 dr
y
13.5
12.0
10.5
9.0
7.5
6.0
4.5
3.0
1.5
.0
Percent
50
45
40
35
30
25
20
15
10
5
Biomass
Sloughing
Predation
Photosynthesis

Limitations to Photosynthesis can also be Graphed
Peri High-Nut Lt_LIM (frac)Peri High-Nut Nutr_LIM (frac)Peri High-Nut Temp_LIM (frac)
Blue Earth R.MN (54) (PERTURBED)Run on 03-25-08 12:29 PM
10/11/20007/13/20004/14/20001/15/200010/17/19997/19/19994/20/19991/20/1999
frac
1.0
0.9
0.8
0.7
0.6
0.5
0.4
0.3
0.2
0.1
0.0
Light Limit
Nutrient Limit
Temp. Limit

Automated Sensitivity Analysis Sensitivity of Tubifex tubife (g/m2 dry) to 20% change in tested parameters
3/28/2008 3:31:16 PM
Tubifex tubife (g/m2 dry)20191817161514131211
5.45% - Daphnia: Maximum Temperature (deg. C)
6.82% - Susp&Diss Detr: Multiply Loading by
12.6% - Daphnia: Temperature Response Slope
13.1% - Cyclotella nan: Maximum Temperature (deg. C)
16.3% - Daphnia: Max Consumption (g / g day)
16.5% - Cyclotella nan Min. Sat. Light (Ly/d)
19.7% - Daphnia: Optimal Temperature (deg. C)
23.1% - Water Vol: Multiply Loading by
40.8% - Cyclotella nan: Temp Response Slope
51.2% - Cyclotella nan: Optimal Temperature (deg. C)
62.4% - Cyclotella nan: Max Photosynthetic Rate (1/d)
66.6% - TSS: Multiply Loading by
83.2% - Water Vol: Mult. Inf low Load by
135% - Temp: Multiply Loading by

Integrated Uncertainty Analysis Capability
MeanMean - StDevMean + StDevDeterministic
NH3 & NH4+ (mg/L)3/28/2008 4:42:28 PM
11/10/20007/13/20003/15/200011/16/19997/19/19993/21/1999
0.07
0.06
0.05
0.04
0.03
0.02
0.01
0.0
-0.01

• Eutrophication in TenKiller Lake Reservoir, OK
• PCB bioaccumulation in Lake Hartwell, SC/GA
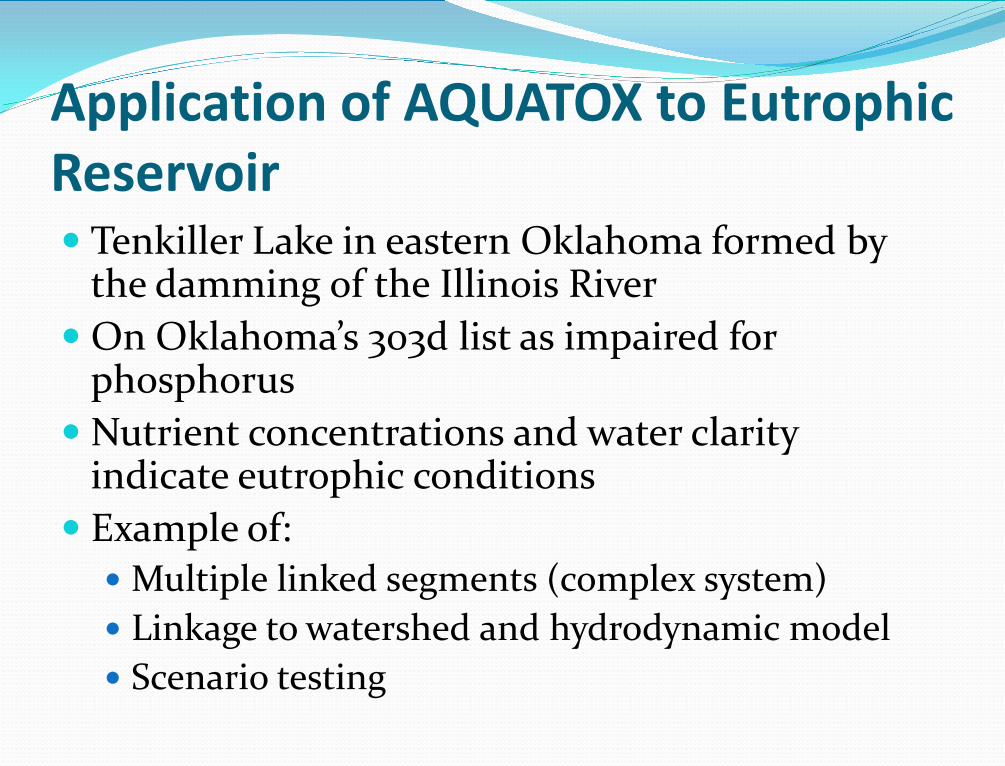
Application of AQUATOX to Eutrophic Reservoir Tenkiller Lake in eastern Oklahoma formed by
the damming of the Illinois River On Oklahoma’s 303d list as impaired for
phosphorus Nutrient concentrations and water clarity
indicate eutrophic conditions Example of:
Multiple linked segments (complex system) Linkage to watershed and hydrodynamic model Scenario testing
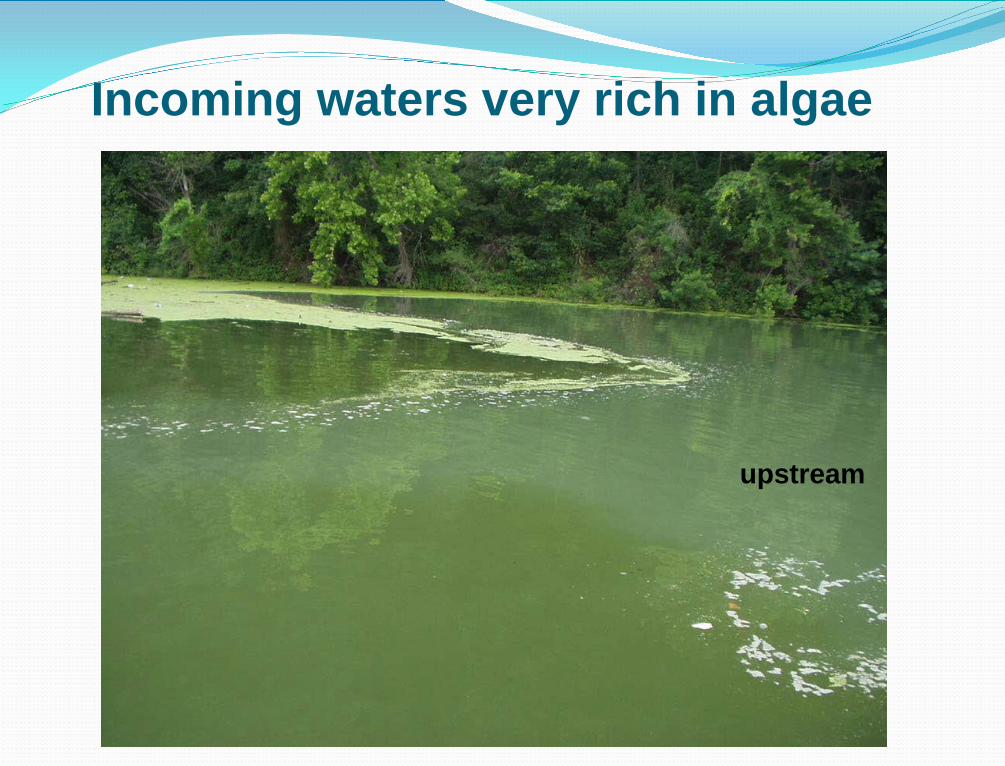
Incoming waters very rich in algae
upstream

Tenkiller Lake Application River-reservoir system
divided into nine segments Riverine Vertically stratified transition
zone Three vertically stratified
lacustrine segments AQUATOX linked to HSPF
(watershed) and EFDC (in-lake hydrology) models
Tested scenarios to predict chlorophyll a levels based on different nutrient, BOD and sediment loadings (BMPs)

Simulated & observed chlorophyll a
Phyto. Chlorophyll (ug/L)Obs chl a 5 (ug/L)
Lake A Epi. (CONTROL)Run on 07-8-09 10:17 AM
12/17/19938/19/19934/21/199312/22/19928/24/19924/26/199212/28/1991
ug/L
57
51
46
40
34
28
23
17
11
6
Diatom bloom
Cyanobacteria bloom

Simulated & observed algal composition

Predicted chl a levels under increasing load reductions of TP
Phyto. Chlorophyll (ug/L)LAE Chl 90 reduction (ug/L)LAE Chl 30 reduction (ug/L)
Lake A Epi. (CONTROL)Run on 07-8-09 10:17 AM
12/17/19938/19/19934/21/199312/22/19928/24/19924/26/199212/28/1991
ug/L
57
51
46
40
34
28
23
17
11
6

Steinhaus Similarity Index illustrates increasingly dramatic changes in algal community
0 0.2 0.4 0.6 0.8
1 1.2
Baseline vs 90% TP Reductions Plants
0 0.2 0.4 0.6 0.8
1 1.2
Baseline vs 30% TP reduction Plants
0 0.2 0.4 0.6 0.8
1 1.2
Baseline vs 60% TP Reduction Plants 30% reduction in TP
has relatively minor effect on the composition of the algal community

Trophic State Indices show differences between lake segments

Ecosystem Modeling for PCBs in Lake Hartwell

Study Site
Sangamo-Weston Superfund Site discharged 400,000 lbs of PCBs in creek from 1955-1990s
Creek/lake treated via Monitored Natural Recovery
PCBs have declined since 1995 in lake sediment but not in all fishes (5-10ppm)

N, P, oxygen, TSS (EPA STORET)
Flow (USGS gage) Climate (NOAA)
Algae Invertebrates Fish
www.epa.gov/ost/models/aquatox/
Based on data
Largemouth bass
Green Algae Diatoms
Daphnia Mayfly
Chaoborus
Detritus
Chironomid
Bluegill Shad

Predicted fish biomass is calibrated to observed values
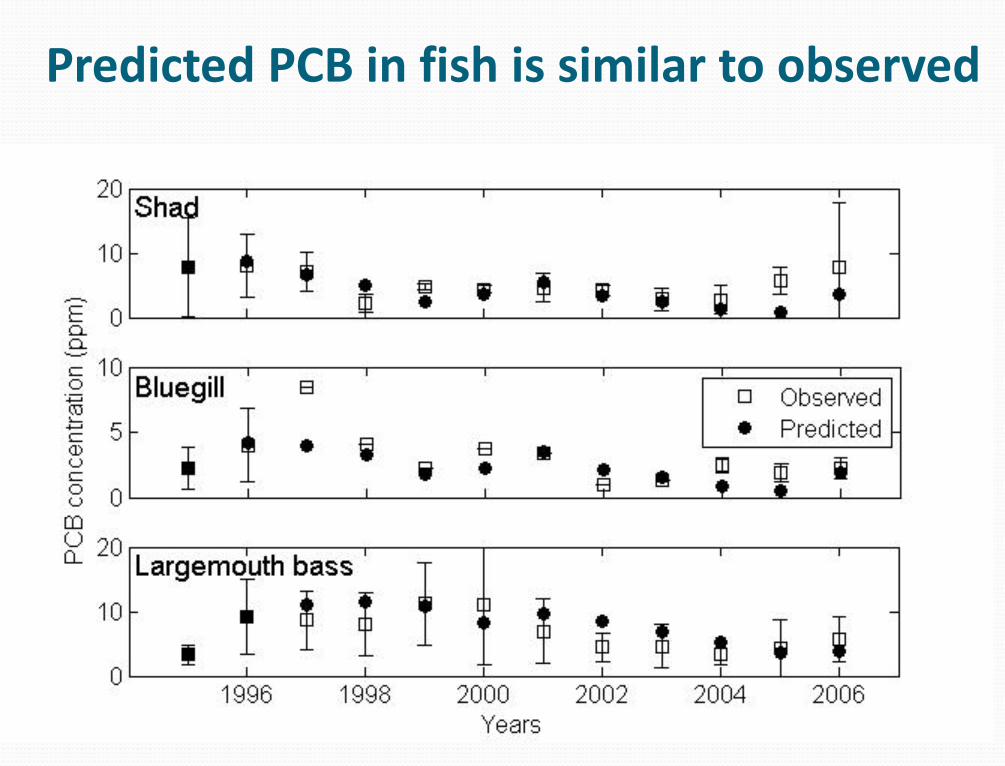
Predicted PCB in fish is similar to observed

Future Prediction with Uncertainty
Target recovery level (2ppm) PC
B in
Lar
gem
outh
Bas
s
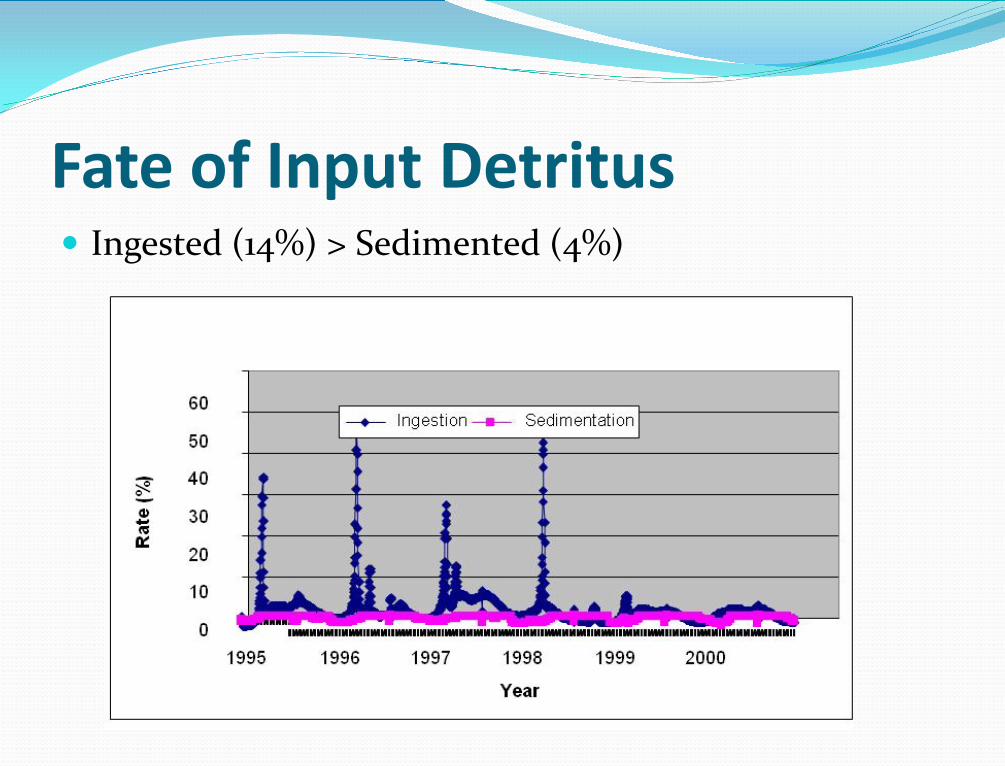
Fate of Input Detritus Ingested (14%) > Sedimented (4%)

Results When will fish recover? Summer/Fall 2013
Why are fish still contaminated while sediment is recovering? Due to contaminated input detritus

30 20 10 0 -10 -20 -30
Largemouth Bass
Bluegill
Shad
Percent Change in PCB (ug/kg)
Sensitivity of PCB Concentration in Fish to 10% ↑Temperature


User Support Technical support materials on web site
http://water.epa.gov/scitech/datait/models/aquatox/index.cfm
Technical notes Data sources Workshop materials Annotated bibliography (newly updated) Sensitivity analysis report (new) Set up guide (in draft)
AQUATOX listserver (>350 subscribers) One-on-one technical support available (subject to future
funding)

Applicability to Sustainable and Healthy Communities Research Program Contaminated sites Nitrogen plus climate
change Ecosystem Services
Food and Recreation Biodiversity and
Wildlife habitat Aesthetic

Thanks For Your Attention Marjorie Coombs Wellman, Office of Water, US EPA,
[email protected] Brenda Rashleigh, Office of Research and Development,
US EPA, [email protected] http://water.epa.gov/scitech/datait/models/aquatox/index.cfm


![Defecation Reflex [Compatibility Mode]](https://img.dokumen.tips/doc/110x75/5451cb86af795908308b4af3/defecation-reflex-compatibility-mode.jpg)
