Embed Size (px)
Citation preview

Biological Conservation 174 (2014) 93–100
Contents lists available at ScienceDirect
Biological Conservation
journal homepage: www.elsevier .com/ locate /biocon
Modeling effects of conservation grassland losses on amphibian habitat
http://dx.doi.org/10.1016/j.biocon.2014.04.0010006-3207/Published by Elsevier Ltd.
⇑ Corresponding author. Tel.: +1 701 253 5558; fax: +1 701 253 5553.E-mail address: [email protected] (D.M. Mushet).
David M. Mushet ⇑, Jordan L. Neau, Ned H. Euliss Jr.U.S. Geological Survey, Northern Prairie Wildlife Research Center, 8711 37th Street SE, Jamestown, ND 58401, USA
a r t i c l e i n f o a b s t r a c t
Article history:Received 14 November 2013Received in revised form 24 March 2014Accepted 1 April 2014
Keywords:AmphibiansConservation Reserve Program (CRP)Grassland conservationHabitat modelingInVESTLand-use changePrairie Pothole Region
Amphibians provide many ecosystem services valued by society. However, populations have declinedglobally with most declines linked to habitat change. Wetlands and surrounding terrestrial grasslandsform habitat for amphibians in the North American Prairie Pothole Region (PPR). Wetland drainage andgrassland conversion have destroyed or degraded much amphibian habitat in the PPR. However,conservation grasslands can provide alternate habitat. In the United States, the Conservation ReserveProgram (CRP) is the largest program maintaining grasslands on agricultural lands. We used an ecosystemservices model (InVEST) parameterized for the PPR to quantify amphibian habitat over a six-year period(2007–2012). We then quantified changes in availability of amphibian habitat under various land-coverscenarios representing incremental losses (10%, 25%, 50%, 75%, and 100%) of CRP grasslands from 2012levels. The area of optimal amphibian habitat in the four PPR ecoregions modeled (i.e., Northern GlaciatedPlains, Northwestern Glaciated Plains, Lake Agassiz Plain, Des Moines Lobe) declined by approximately22%, from 3.8 million ha in 2007 to 2.9 million ha in 2012. These losses were driven by the conversionof CRP grasslands to croplands, primarily for corn and soybean production. Our modeling identified anadditional 0.8 million ha (26%) of optimal amphibian habitat that would be lost if remaining CRP landsare returned to crop production. An economic climate favoring commodity production over conservationhas resulted in substantial losses of amphibian habitat across the PPR that will likely continue into thefuture. Other regions of the world face similar challenges to maintaining amphibian habitats.
Published by Elsevier Ltd.
1. Introduction
Amphibians perform a variety of supporting, provisioning,regulating, and cultural services valued by society as defined bythe Millenium Ecosystem Assessment (2003). Within aquaticecosystems, amphibians affect algal communities, invertebratepopulations, predator dynamics, and nutrient cycling (Seale,1980; Vanni, 2002; Davic and Welsh, 2004). Their ectothermicphysiology provides for the efficient transfer of ingested energy toother trophic levels of an ecosystem (Pough, 1980). As larvalamphibians metamorphose to adults and leave aquatic habitats,they move nutrients from aquatic to terrestrial ecosystems(Regester et al., 2006). In addition to being critical components ofimportant ecosystems (Lannoo, 2012), amphibians provideadditional benefits through their use in scientific research andteaching (O’Rourke, 2007). Cultural services (MilleniumEcosystem Assessment, 2003) also arise from the diversity ofshapes, colors, and rich vocalizations of amphibians (Cox et al.,2008). Preserving amphibian biodiversity has many positive bene-fits to society, some of which relate simply to morals and values.
Despite the societal benefits of maintaining amphibians, theyare disappearing from global ecosystems at a rate estimated to beover 200 times greater than the background amphibian extinctionrate (McCallum, 2007). Within the United States, amphibian occu-pancy of ponds and comparable habitats declined 3.7% annuallyfrom 2002 to 2011 (Adams et al., 2013). With approximately onethird of all amphibian species being listed as globally threatenedand over 43% experiencing population declines (Stuart et al.,2004), amphibians as a group are far more threatened than eitherbirds or mammals (Stuart et al., 2004) and have extinction ratesexceeding those of all other vertebrates (Regan et al., 2001). Whilethe potential causes of amphibian declines are diverse and includeimportant issues such as the spread of chytrid fungus, the majorcontributing factor to amphibian declines globally is habitatdestruction and/or degradation, affecting an estimated 63% of allamphibian species (Chanson et al., 2008).
Many amphibians are biphasic in that they rely on both aquaticand terrestrial habitats to complete their life cycle (Harper et al.,2008). In the Prairie Pothole Region (PPR) of North America, theneed for aquatic habitats for breeding and subsequent larvaldevelopment is typically met through the use and availability ofpalustrine wetlands (Mushet et al., 2012a). After metamorphosis,adults use surrounding grassland habitats for foraging, cover, and

94 D.M. Mushet et al. / Biological Conservation 174 (2014) 93–100
overwintering (Semlitsch, 2000; Mushet et al., 2012a), a notableexception being the northern leopard frog (Lithobates pipiens),which returns to aquatic habitats for overwintering (Merrell,1970). Thus, habitat for PPR amphibians is composed of both wet-land habitats and surrounding areas of terrestrial habitat(Semlitsch and Bodie, 2003).
To offset the loss of native habitats and the services they pro-vide, both governmental and nongovernmental organizations havemade significant monetary investments in the PPR to restore andprotect both grassland and wetland habitats. Given the promi-nence of agriculture throughout the PPR, the most wide reachingconservation efforts have been associated with various programsof the U.S. Department of Agriculture (USDA). Within the USDA,the Conservation Reserve Program (CRP) has had the largest impactin terms of total area affected (Table 1; USDA, 2013). Like manyother conservation programs, CRP is a voluntary program that pro-vides producers with a monetary incentive to establish and main-tain perennial cover on upland areas enrolled in the program. Inthe PPR, this perennial cover is typically grass species intermixedwith various forbs, especially legumes. When combined withextant natural or restored wetlands, these CRP grassland habitatsmay mitigate habitat losses associated with agricultural produc-tion. However, payments to farmers participating in conservationprograms have failed to keep pace with rising values of agriculturalcommodities and profits that can be realized through their produc-tion (Rashford, 2011). In addition, warmer growing season temper-atures, recent increases in summer precipitation, and availability ofnew varieties of pesticide tolerant and drought resistant crops hasfacilitated the production of higher valued row crops (e.g., corn andsoy beans) in areas previously dominated by small grain produc-tion. The disparity of profits that can be realized through participa-tion in a conservation program versus the production ofagricultural commodities has resulted in a recent exodus of PPRfarmers from conservation programs. This exodus has resulted inthe return of vast tracts of grasslands created through these pro-grams to agricultural production, primarily row crops (Eulisset al. 2010; Classen et al. 2011; Rashford et al. 2011). With CRPcontracts on significant amounts of land expiring in the next fiveyears and high commodity prices likely to continue, loss of addi-tional conservation grasslands to crop production will most likelyoccur (Wright and Wimberly, 2013).
The objectives of our research were: (1) to quantify amphibianhabitat within the U.S. portion of the PPR over a time period inwhich a significant amount of conservation grasslands werereturned to crop production and (2) to investigate how continuedlosses of these grassland habitats might affect the availability ofhabitat needed by amphibians. In previous work, we developed aconceptual model depicting relationships among amphibians andspecific components of the PPR landscape important for maintain-ing amphibians (Mushet et al., 2012a). We also performed habitatsuitability mapping to further identify species-specific habitatcomponents used by amphibians (Mushet et al., 2012b). Here weincorporate knowledge gained through these and other amphibianfocused research efforts (e.g., Balas et al., 2012) into an ecosystemservices modeling framework.
Table 1Area (ha) of land within Minnesota (MN), North Dakota (ND), South Dakota (SD), and Iow2007–2012 (USDA, 2013).
State 2007 2008 2009 2010 20
MN 740,918 718,466 686,395 666,479 63ND 1,372,332 1,205,433 1,155,257 1,076,375 96SD 631,534 527,196 505,804 467,274 44IA 798,047 732,827 690,092 680,700 67Total 3,542,831 3,183,992 3,037,548 2,890,827 2,7
2. Material and methods
2.1. Study area
The PPR covers approximately 820,000 km2 of the United Statesand Canada (Fig. 1). Glacial processes shaped the region andcreated a landscape consisting of innumerable palustrine wetlands(often termed prairie potholes) scattered within a grassland matrix(Kantrud et al., 1989). This intermixed grassland and wetlandlandscape provides habitat for a wide variety of flora and faunaincluding grassland and wetland plants (NGPFAP, 2001), waterfowl(Batt et al., 1989), other wetland dependent birds (Igl and Johnson,1998), grassland birds (Swengel and Swengel, 1998), smallmammals (Fritzell, 1989), aquatic and terrestrial invertebrates(Swengel and Swengel, 1998; Euliss et al., 1999), and amphibians(Larson et al., 1998). In addition to supporting grassland andwetland dependent biota, the combination of the region’s richglacial soils and its temperate climate has made it an ideal areafor agricultural commodity production (Leitch, 1989). To facilitateagricultural production since European settlement, approximately95% of native tall-grass prairie and 60% of native mixed-grassprairie in the PPR have been converted to croplands (Higginset al., 2002). Additionally, 35–89% of the wetlands in portions ofthe United States PPR (Dahl, 1990) and 71% in the Canadian PPR(Environment Canada, 1986) have been drained. In an effort toincrease our understanding of how landcover change affects theavailability of amphibian habitat, we quantified this habitatacross the three Level III ecoregions (Northern Glaciated Plains,Northwestern Glaciated Plains, and Lake Agassiz Plain; USEPA,2013) and one level IV ecoregion (Des Moines Lobe, USEPA,2013) that constitute the United States portion of the PPR (Fig. 1).
2.2. Modeling approach
We used the Biodiversity Module of the Integrated Valuation ofEcosystem Services and Tradeoffs (InVEST) modeling suite version2.4.5 (Natural Capital Project, 2013) to quantify amphibian habitat.InVEST is a suite of spatially based modeling tools used to quantifya variety of services derived from ecosystems, including the main-tenance of biodiversity. The Biodiversity Module of InVEST useshabitat quality as a surrogate for biodiversity (Nelson et al.,2011). Using InVEST, we modeled amphibian habitat over a periodof declining CRP enrollments (2007–2012) and made future projec-tions under various scenarios of continued loss of CRP grasslandsvarying from 0% loss up to a complete (i.e., 100%) loss of CRP grass-lands from the PPR landscape.
We created land-cover data layers for 2007–2012 by combiningNational Agricultural Statistics Service (NASS) cropland data layersfor each year with rasterized National Wetland Inventory (NWI)data. Areas enrolled in CRP were uniquely identified using a shapefile data layer obtained from USDA Farm Service Agency’s Econom-ics and Policy Analysis Staff. We defined amphibian habitat asbeing palustrine wetlands plus a surrounding terrestrial bufferextending 160-m beyond the wetland edge. If all or portions of abuffer were in a cropland or another developed (e.g., urban) cover
a (IA) enrolled in the U.S. Department of Agriculture’s Conservation Reserve Program,
11 2012 Change 2007–2012 % Change 2007–2012
4,496 568,693 �172,295 �239,053 730,595 �641,737 �476,761 396,895 �234,639 �371,500 620,078 �177,969 �2221,809 2,316,191 �1,226,640 �35

Fig. 1. Map of the Prairie Pothole Region of North America (shaded area) and the Northern Glaciated Plains (NGP), Northwestern Glaciated Plains (NWGP), Lake Agassiz Plain(LAP), and Des Moines Lobe (DML) ecoregions (USEPA, 2013) of the United States (enlargement).
D.M. Mushet et al. / Biological Conservation 174 (2014) 93–100 95
type, those portions were not included in the habitat designation.Our 160-m terrestrial buffer width was selected to approximatethe 159-m wide area surrounding wetlands that Semlitsch andBodie (2003) identified as habitat for wetland breeding amphibi-ans. Thus, while many species use terrestrial habitats farther than160-m from a wetland edge, all use the area between the wetlandedge and the outer limit of our 160-m buffer.
For our CRP grassland loss scenarios, we used the 2012 land-cover layer described above to represent current land-cover. Weassigned a random number drawn from an even distribution(0.0000–1.0000) to each CRP field within the PPR. We then con-verted a scenario specific quantity of CRP fields from grassland tocropland to simulate conversion to crop production. As an exam-ple, in our 25% loss scenario, we converted all CRP fields with anassigned random number between 0.00 and 0.25 to cropland. Thus,in our data layer creation we followed the assumption that if afarmer decided to remove land from a conservation program, thisdecision would be made at a field-by-field level, i.e., the farmerwould not remove just a portion of a field from the program. Inour 100% loss scenario, we also assumed that all CRP grasslands
would be returned to crop production. While some CRP grasslandswould undoubtedly remain in perennial cover after contract expi-ration, conversion of other, non-CRP, grasslands to croplands in theregion would likely more than compensate for this disparity. Fol-lowing these procedures and assumptions, we created land-coverlayers representing 0%, 10%, 25%, 50%, 75%, and 100% loss of CRPgrasslands. We compared land-cover layers for each percentageloss scenario to total CRP grassland area in the 0% loss layer to ver-ify that the correct percentage of CRP grassland was converted tocropland.
In InVEST, habitats are influenced by their distance from poten-tial threats and their susceptibility to those threats. We developedGIS layers identifying specific threats to amphibian habitat in thePPR. These threat layers were created through a reclassificationprocess of land-cover layers using ArcGIS. We developed fourthreat layers that included (1) cropland areas, (2) long hydroperi-ods, i.e., lakes and wetlands identified in NWI as having permanentwater regimes, (3) short hydroperiods, i.e., wetlands identified inNWI as having temporary water regimes, and (4) isolation,i.e., wetlands greater than 0.5-km from another wetland. We

96 D.M. Mushet et al. / Biological Conservation 174 (2014) 93–100
considered croplands to be a threat to amphibian habitat qualitydue to the combined effects of increased sedimentation rates,potential for pesticide contamination, and physical alteration ofthe upland plant and insect communities. NWI identifies waterregimes for PPR palustrine wetlands that include, temporary, sea-sonal, semipermanent, and permanent (Cowardin et al., 1979).We identified a temporary water regime as a threat becausewetlands with this water regime often do not contain water overa temporal period long enough for most larval amphibians to sur-vive to metamorphosis. We identified a permanent water regimeas a threat due to the predatory fish communities often harboredin wetlands with this water regime. By incorporating waterregimes in this way, wetlands with intermediate hydroperiods,i.e., seasonal and semipermanent wetlands, would receive higherquality ratings than wetlands with either very short (temporary)or very long (permanent) hydroperiods. Lastly, we identified isola-tion as a threat due to the need of some amphibians to use multiplehabitat types in an interconnected landscape (i.e., landscapecomplementation; Pope et al., 2000). We used a 0.5-km separationdistance to identify ‘‘isolated wetlands’’ based on an averageintrapopulation migration distance (i.e., <1.0 km) as identified bySemlitsch (2008). While there are other threats to amphibian hab-itat quality, the four we identified encompass the major threatsaffecting amphibian habitats in the PPR (Mushet et al., 2012a).
We considered that cropland threats could affect amphibianhabitats up to a maximum distance of 1-km. All other threats wereprimarily restricted to within the wetland itself but also influencedhabitat across a short (0.1-km) distance of the adjacent buffer.We allowed the strength of threats to decay linearly to zero overthe 1-km or 0.1-km distance of influence assigned to specific threattypes. A complete description of our development of GIS land-cover and threat layers used in InVEST runs is provided in onlineAppendix A.
Once land-cover/habitat and threats layers were developed, weused InVEST to quantify amphibian habitat quality and quantityacross years of interest (2007–2012) and among our various sce-narios of CRP loss (0–100% loss). In the InVEST model, we usedan output cell size of 50 m and a half-saturation constant of 70,selected as described in Tallis et al. (2011). In each run (i.e., yearor scenario), the model worked to erode the quality value of iden-tified amphibian habitats (initial value = 1) based on spatial prox-imity to a threat, susceptibility to that threat, and the threat’sstrength (i.e., threat weight). Output data layers from the modelwere then used to create maps depicting changes in amphibianhabitat quality across years and among scenarios of CRP loss. Qual-ity rating ranges from zero (no value to amphibians) to one (great-est value to amphibians). From our habitat quality maps, weproduced summary tables quantifying changes in optimal amphib-ian habitat quantity (ha) by ecoregions. For these tabulations, wedefined optimal amphibian habitat as areas with a habitat ratingP0.8. Our completed InVEST susceptibility and threat tables,including habitat designations, threat weights, decay functions,and susceptibility values, are provided in online Appendix B. Lastly,we varied values used as thresholds and in susceptibility andthreat tables individually over a range of values to explore the
Table 2Optimal amphibian habitat (ha) within Northern Glaciated Plains (NGP), Northwestern Glacof the United States. Optimal amphibian habitat was quantified using the Biodiversity Mo
State 2007 2008 2009 2010 20
NGP 1,453,025 1,297,078 1,409,038 1,585,585 1,5NWGP 1,675,353 1,551,451 1,452,266 1,473,106 1,4LAP 565,202 503,504 489,838 495,409 48DML 90,907 81,115 82,914 69,907 77Total 3,784,486 3,433,146 3,434,056 3,624,006 3,5
sensitivity of our results to values used, thereby providing an indi-cation of the robustness of model results (online Appendix C).
3. Results
From 2007 to 2012, actual amount of CRP lands in the fourstates containing much of the PPR declined from more than3.5 million ha to just over 2.3 million ha, a 35% decline (Table 1).The largest losses (�47%) occurred in the state of North Dakotawhere CRP lands declined from approximately 1.4 million ha in2007 to just over 730,000 ha in 2012. Iowa suffered the smallestlosses, but still lost greater than 20% of its CRP lands. Our modelingresults show that over the same 2007–2012 period, optimalamphibian habitat in the four ecoregions we modeled declinedby approximately 22%, from a high of 3.8 million ha in 2007 to alow of 2.9 million ha in 2012 (Table 2, and Fig. 2). The Northernand Northwestern Glaciated Plains accounted for over 80% of theoptimal amphibian habitat available among the four ecoregionsstudied. The Des Moines Lobe ecoregion supported little optimalamphibian habitat compared to the other three ecoregions; how-ever, it also showed the lowest percent loss (�3.6%) over our six-year study period. While the amount of CRP on the PPR landscapesteadily declined from 2007 to 2012, changes in the availability ofoptimal amphibian habitat (Table 2) did not always track CRPlosses (Fig. 3); for example, optimal amphibian habitat in theNorthern Glaciated Plains ecoregion declined by approximately156,000 ha between 2007 and 2008. However, optimal amphibianhabitat in the same ecoregion increased by over 100,000 habetween 2009 and 2011, a period when the amount of CRP landscontinued to decline. Additionally, between 2011 and 2012 theNorthern Glaciated Plains showed a marked decline in optimalamphibian habitat (�28%) that was out of proportion with CRPlosses between these two years. Optimal amphibian habitat inthe Northwestern Glaciated Plains and the Lake Agassiz Plain eco-regions also showed similar increases or remained fairly stableover the 2009–2011 period, with sharp declines in 2012.
Our scenario based modeling revealed a marked decline in opti-mal amphibian habitat (�9% across the PPR) if 25% of current(2012) CRP lands are returned to agricultural production (Table 3).This loss of optimal habitat increases to 26% (a loss of approxi-mately 0.8 million ha) if all CRP lands within the PPR are returnedto agricultural production. Our modeling also reveals that theNorthern Glaciated Plains would have the greatest loss of optimalamphibian habitat (�32% in our scenario in which all CRP grass-lands are converted to cropland (Table 3)). The Des Moines Lobeecoregion had the smallest amount of amphibian habitat tied toCRP grasslands (17,679 ha), but this represents 20% of the optimalhabitat available to amphibians in this ecoregion where amphibianhabitat is already extremely rare (Fig. 2).
Results of our sensitivity analyses (online Appendix C) revealedthat threshold values used to define optimal amphibian habitathad a significant influence on the amount of habitat so designated.As an example, if a cutoff value of P0.5 was used rather than theP0.8 used in our final model, 2012 optimal amphibian habitat
iated Plains (NWGP), Lake Agassiz Plain (LAP), and Des Moines Lobe (DML) ecoregionsdule of InVEST (Natural Capital Project, 2013) modeling suite.
11 2012 Change 2007–2012 % Change 2007–2012
21,861 1,103,083 �349,942 �2461,618 1,300,099 �375,254 �223,241 451,185 �114,017 �20,980 87,660 �3,247 �3.644,700 2,942,026 �842,460 �22
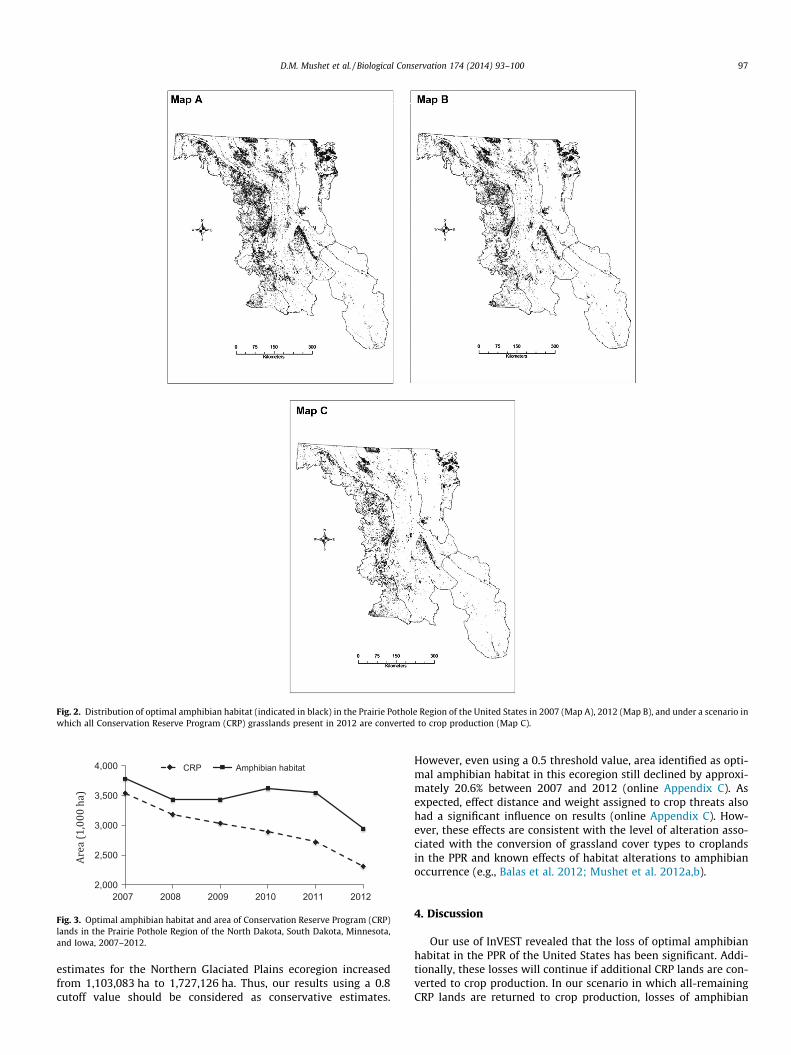
Fig. 2. Distribution of optimal amphibian habitat (indicated in black) in the Prairie Pothole Region of the United States in 2007 (Map A), 2012 (Map B), and under a scenario inwhich all Conservation Reserve Program (CRP) grasslands present in 2012 are converted to crop production (Map C).
2,000
2,500
3,000
3,500
4,000
2007 2008 2009 2010 2011 2012
CRP Amphibian habitat
Fig. 3. Optimal amphibian habitat and area of Conservation Reserve Program (CRP)lands in the Prairie Pothole Region of the North Dakota, South Dakota, Minnesota,and Iowa, 2007–2012.
D.M. Mushet et al. / Biological Conservation 174 (2014) 93–100 97
estimates for the Northern Glaciated Plains ecoregion increasedfrom 1,103,083 ha to 1,727,126 ha. Thus, our results using a 0.8cutoff value should be considered as conservative estimates.
However, even using a 0.5 threshold value, area identified as opti-mal amphibian habitat in this ecoregion still declined by approxi-mately 20.6% between 2007 and 2012 (online Appendix C). Asexpected, effect distance and weight assigned to crop threats alsohad a significant influence on results (online Appendix C). How-ever, these effects are consistent with the level of alteration asso-ciated with the conversion of grassland cover types to croplandsin the PPR and known effects of habitat alterations to amphibianoccurrence (e.g., Balas et al. 2012; Mushet et al. 2012a,b).
4. Discussion
Our use of InVEST revealed that the loss of optimal amphibianhabitat in the PPR of the United States has been significant. Addi-tionally, these losses will continue if additional CRP lands are con-verted to crop production. In our scenario in which all-remainingCRP lands are returned to crop production, losses of amphibian

Table 3Area (ha) of optimal amphibian habitat in the Northern Glaciated Plains (NGP), Northwestern Glaciated Plains (NWGP), Lake Agassiz Plain (LAP), and Des Moines Lobe (DML)ecoregions of the United States under various scenarios reflecting the conversion of 10%, 25%, 50%, 75%, and 100% of Conservation Reserve Program (CRP) grasslands to croplands.Optimal amphibian habitat was quantified using the Biodiversity Module of InVEST (Natural Capital Project, 2013) modeling suite. Values in parentheses represent the percentageof current (2012) optimal amphibian habitat lost under various levels of CRP loss.
Scenario NGP NWGP LAP DML Total
Current (2012) 1,103,083 1,300,099 451,185 87,660 2,942,027�10% CRP 1,053,012 (�5%) 1,265,095 (�3%) 436,341 (�3%) 85,222 (�3%) 2,839,678 (�3%)�25% CRP 974,321 (�12%) 1,216,499 (�6%) 414,887 (�8%) 81,075 (�8%) 2,686,780 (�9%)�50% CRP 870,837 (�21%) 1,136,345 (�13%) 383,126 (�15%) 77,448 (�12%) 2,467,756 (�16%)�75% CRP 800,287 (�27%) 1,076,976 (�17%) 360,605 (�20%) 73,143 (�17%) 2,311,011 (�21%)�100% CRP 750,997 (�32%) 1,030,128 (�21%) 339,250 (�25%) 69,981 (�20%) 2,190,356 (�26%)
98 D.M. Mushet et al. / Biological Conservation 174 (2014) 93–100
habitat would equal approximately 26% of the total optimal habitatavailable across the PPR in 2012. While largely unknown, theeffects on amphibians of losing over one-quarter of their remainingoptimal habitat would likely be significant. In addition to effects onbiodiversity, habitat losses of this magnitude would likely have anegative influence on other ecological attributes (e.g., reproduc-tion, survival, dispersal, recolonization) identified by Mushetet al. (2012a) as being important to the maintenance and viabilityof amphibian populations and biodiversity.
While losses of CRP lands across the PPR landscape have beensignificant (Table 1; USDA, 2013), resulting effects on amphibianhabitat can be masked by fluctuating climate cycles. During theperiod 2009–2011, precipitation in many parts of the PPR wasabove normal. This was especially true in North Dakota where run-off during springtime snowmelt caused flooding and often pre-vented farmers from getting into their fields to plant crops. Thisinability of farmers to work their fields is reflected in ‘‘PreventedPlanting’’ statistics collected by the USDA. Prevented Planting is afederally subsidized crop insurance program that provides pay-ments to participants when extreme weather conditions preventexpected plantings. In North Dakota alone, Prevented Planting pay-ments were made on 2.2 million ha of croplands that wentunplanted in 2011 (Table 4), primarily as a result of springtimeflooding. While less than in 2011, in 2009 and 2010, total areawhere planting was prevented was approximately an order ofmagnitude greater than in 2007 and 2008. These vast areas ofNorth Dakota that went unplanted in 2009, 2010, and 2011 weretypically adjacent to wetland areas (i.e., where fields are mostprone to flooding). As a result, our model results suggest that pre-vented planting areas provided an abundance of habitat foramphibians; habitat that masked losses of optimal habitat result-ing from the conversion of CRP lands to croplands. Drier conditionsreturned to the PPR in 2012, and sharp drops in optimal amphibianhabitat (Fig. 3) occurred as a consequence of not only the addi-tional losses of CRP grasslands that occurred between 2011 and2012, but also due to the loss of habitat that occurred as previouslyflooded croplands areas were returned to production (Table 4).
The Des Moines Lobe ecoregion provided little optimal amphib-ian habitat compared to the Northern and Northwestern GlaciatedPlains. Thus, conservation grasslands within the Des Moines Lobe
Table 4Area (ha) of croplands in North Dakota that were classified as not planted in a givenyear, 2007–2012 (USDA Farm Service Agency Annual Acreage Reporting Summaries –North Dakota).
Year Prevented planting (ha)
2007 90,4202008 12,2522009 793,5292010 698,5882011 2,274,8322012 65,888
region may play an even larger role in terms of amphibian habitatprovisioning in this region of habitat scarcity. Our modeling identi-fied only 87,660 ha of optimal amphibian habitat in the Des MoinesLobe. Of this habitat, approximately 20% was provided by CRP lands.In an area where habitat is already extremely scarce, the loss of anyamount, let alone the loss of the greater than 17,500 ha currentlybeing provided by CRP, could be devastating. Even with these con-servation lands intact, several amphibian species in the region arein decline (e.g., Blanchards cricket frog [Acris blanchardi], northernleopard frog [Lithobates pipiens]; Lannoo et al., 1994; Hemesath,1998). While large, our amphibian habitat loss estimates for theDes Moines Lobe ecoregion are likely conservative as 2012 was awet year in this southern most ecoregion of the PPR. As with theNorthern and Northwestern Glaciated Plains ecoregions from2009 to 2011, some optimal habitat losses due to declines in con-servation lands could be masked by habitat created during thewet conditions. Additionally, while CRP lands have been in decline,other conservation programs have contributed to amphibianhabitat availability in recent years. As an example, over 1900 haof wetlands and adjacent upland habitat has been created in Iowaas part of the USDA Natural Resources Conservation Service’sWetlands Reserve Program (WRP). This habitat is under long-termeasement agreements and not as vulnerable to loss as conservationlands protected solely by short-term contracts (e.g., CRP).
Much like the Des Moines Lobe, the Lake Agassiz Plain ecoregionhas lost most of its natural wetland and grassland habitat due tointensive agricultural development. Of the 451,185 ha of optimalamphibian habitat identified in the Lake Agassiz Plain, over110,000 ha (approximately 25%) is available as a direct result ofCRP grasslands. Again, how loss of this habitat would ultimatelyaffect the region’s amphibians is largely unknown. However, wecan be certain that the trajectory of the effect would not be positive.
The Northern and Northwestern Glaciated Plains each had sig-nificantly more optimal amphibian habitat than the other ecore-gions we modeled. However, of the two, availability of optimalhabitat was more dependent on CRP lands in the Northern Glaci-ated Plains than in the Northwestern Glaciated Plains. Most ofthe Northwestern Glaciated Plains is made up of an area knownas the Missouri Coteau. The topography of the Missouri Coteau isvaried with greater local relief and rockier, less fertile, soils thanin the Northern Glaciated Plains to the east. As a result, croplands,while still the major land-use, are less abundant and native grass-land pastures and rangelands form a larger component of theNorthwestern Glaciated Plains landscape. These pastures andrangelands provide the grassland habitat component used byamphibians and serve to buffer aquatic habitats from the effectsof crop production in adjacent uplands. While CRP still providessignificant areas of amphibian habitat in the Northwestern Glaci-ated Plains, other areas of grassland habitats also contributetowards the maintenance of the region’s amphibian biodiversity.In the Northern Glaciated Plains where these alternate grasslandsare not as abundant, habitat components provided by CRP grass-lands become a more important amphibian habitat component

D.M. Mushet et al. / Biological Conservation 174 (2014) 93–100 99
on the landscape (i.e., providing approximately 32% of the optimalhabitat available to amphibians).
The results of our modeling efforts identify recent past andpotential future amphibian habitat losses in the PPR of the UnitedStates. However, they also identify opportunities for the improve-ment of amphibian habitats if current trends can be reversed,either through gains in CRP or through other conservation pro-grams that lead to increases in grassland and wetland habitatson the PPR landscape (e.g., USDA Natural Resources ConservationService’s Wetlands Reserve Program [WRP] and Grasslands ReserveProgram [GRP]). The potential of conservation grasslands to miti-gate amphibian habitat loss in the PPR has been demonstratedby the amount of optimal habitat that has been created on thelandscape through a single conservation program, CRP. If CRPwas not as successful as it has been in providing amphibian habitaton the PPR landscape, we would not see losses of these lands fromthe landscape resulting in such significant declines in optimalamphibian habitat in our modeled scenarios. Thus, CRP and otherconservation programs can play a significant role in restoringamphibian habitats in the PPR. However, care must be taken to rec-ognize the transitory nature of conservation lands that are not pro-tected through fee-title ownership or through long-termeasements. As seen through recent losses of CRP lands across thePPR landscape, lands protected through short-term contracts willlikely revert to other uses during periods when conservation pay-ments lag behind profits that can be realized through conversionto other uses.
Economic climates favoring commodity production over con-servation has resulted, and will likely continue to result, in a lossof amphibian habitat not just in the PPR, but worldwide. Theresulting impact on amphibians dependent upon habitat providedby conservation lands could be substantial. This is especially trou-bling when considering that one-third of the world’s knownamphibian species are already at high risk of extinction (Norris,2007). However, reversing recent trends in grassland lossesthrough the implementation of additional conservation practicesproviding perennial grassland cover on agricultural lands has greatpotential to mitigate for habitat losses through the creation ofalternate habitats. Our results are applicable beyond the PPR inareas where amphibian habitats consist of wetlands imbedded ina grassland matrix and economic pressures favor the conversionof natural and/or conservation grasslands to cropland. By quantify-ing amphibian habitat through use of scenarios-based models suchas InVEST, insights into potential effects of land-cover change canbe obtained thereby facilitating conservation and mitigationefforts.
Acknowledgments
Financial support for this effort came from the United StatesDepartment of Agriculture’s Natural Resources Conservation Ser-vice (NRCS) through their Conservation Effects Assessment Project(CEAP—Wetlands) and the Farm Service Agency (FSA) Economicsand Policy Analysis Staff. We thank our partners in NRCS and FSAfor their financial support. Additionally, we thank Scott McMurryand four anonymous reviewers for their critical reviews of earlierdrafts of our manuscript. Any use of trade, firm, or product namesis for descriptive purposes only and does not imply endorsementby the U.S. Government.
Appendices. Supplementary material
Supplementary data associated with this article can be found, inthe online version, at http://dx.doi.org/10.1016/j.biocon.2014.04.001.
References
Adams, M.J., Miller, D.A., Muths, E., Corn, P.S., Campbell Grant, E.H., Bailey, L.L.,Fellers, G.M., Fisher, R.N., Sadinski, W.J., Waddle, H., Walls, S.C., 2013. Trends inamphibian occupancy in the United States. PLoS ONE 8 (5), e64347. http://dx.doi.org/10.1371/jpurnal.pone.0064347.
Balas, C.J., Euliss Jr., N.H., Mushet, D.M., 2012. Influence of conservation programs onamphibians using seasonal wetlands in the prairie pothole region. Wetlands 32,333–345.
Batt, B.D., Anderson, M.G., Anderson, C.D., Caswell, F.D., 1989. The use of prairiepotholes by North American ducks. In: van der Valk, A. (Ed.), Northern prairiewetlands. Iowa State University Press, Ames, pp. 204–227.
Chanson, J.S., Hoffmann, M., Cox, N.A., Stuart, S.N., 2008. The State of the World’sAmphibians. In: Stuart, S.N., Hoffman, M., Chanson, J.S., Cox, N.A., Berridge, R.J.,Ramani, P., Young, B.E. (Eds.), Threatened Amphibians of the World, Lynx Edicions,Barcelona; IUCN, Gland; and Conservation International, Arlington, pp. 33–52.
Classen, R., Carriazo, F., Cooper, J.C., Hellerstein, D., Ueda, K., 2011. Grassland tocropland conversion in the Northern Plains: the role of crop insurance,commodity, and disaster programs. US Department of Agriculture, EconomicResearch Service, Washington.
Cowardin, L.M., Carter, V., Golet, F.C., LaRoe, E.T., 1979. Classification of wetlandsand deepwater habitats of the United States, FWS/OBS-79/31, US Fish andWildlife Service; Washington.
Cox, N.A., Berridge, R.J., Church, D., Paul van Dijk, P., Kusrini, M., Lau, M., Oldfield, T.,Rollins-Smith, L., Xie, F., 2008. Why save amphibians. In: Stuart, S.N., Hoffman,M., Chanson, J.S., Cox, N.A., Berridge, R.J., Ramani, P., Young, B.E. (Eds.),Threatened Amphibians of the World, Lynx Edicions, Barcelona; IUCN, Gland;and Conservation International, Arlington, pp. 23–29.
Dahl, T.E., 1990. Wetlands losses in the United States 1780’s to 1980’s. USDepartment of the Interior, Fish and Wildlife Service; Washington.
Davic, R.D., Welsh Jr., H.H., 2004. On the ecological roles of salamanders. Annu. Rev.Ecol. Syst. 35, 405–434.
Environment Canada, 1986. Wetlands in Canada: a valuable resource, Fact Sheet86–4, Lands Directorate, Ottawa.
Euliss Jr., N.H., Smith, L.M., Liu, S., Feng, M., Mushet, D.M., Auch, R.F., Loveland, T.R.,2010. The need for simultaneous evaluation of ecosystem services and land-usechange. Environ. Sci. Technol. 44, 7761–7763.
Euliss Jr, N.H., Wrubleski, D.A., Mushet, D.M., 1999. Wetlands of the prairie potholeregion: invertebrate species composition, ecology, and management. In: Batzer,D.P., Rader, R.B., Wissinger, S.A. (Eds.), Invertebrates in Freshwater Wetlands ofNorth America: Ecology and Management. John Wiley and Sons, New York, pp.471–514.
Fritzell, E.K., 1989. Mammals in prairie wetlands. In: van der Valk, A.G. (Ed.),Northern Prairie Wetlands. Iowa State University Press, Ames, pp. 268–301.
Harper, E.B., Rittenhouse, T.A.G., Semlitsch, R.D., 2008. Demographic consequencesof terrestrial habitat loss for pool-breeding amphibians: predicting extinctionrates associated with inadequate size of buffer zones. Conserv. Biol. 22, 1205–1215.
Hemesath, L.M., 1998. Iowa’s frog and toad survey, 1991–1994. In: Lannoo, M.J.(Ed.), Status & Conservation of Midwestern Amphibians. University of IowaPress, Iowa City, pp. 206–216.
Higgins, K.F., Naugle, D.E., Forman, J.R., 2002. A case study of changing land usepractices in the northern Great Plains, U.S.A.: an uncertain future for waterbirdconservation. Waterbirds 25 (Special Publication 2), 42–50.
Igl, L.D., Johnson, D.H., 1998. Wetland birds in the northern Great Plains. In: Mac,M.J., Opler, P.A., Puckett Haecker, C.E., Doran, P.D. (Eds.), Status and Trends of theNation’s Biological Resources, vol. 2, US Department of the Interior, US GeologicalSurvey; Reston, pp. 454–455.
Kantrud, H.A., Krapu, G.L., Swanson, G.A., 1989. Prairie basin wetlands of theDakotas: A community profile, US Fish and Wildlife Service, Biol Rep, 85(7.28).
Lannoo, M.J., Lang, K., Waltz, T., Phillips, G.S., 1994. An altered amphibianassemblage: Dickinson County, Iowa, 70 years after Frank Blanchard’s survey.Am. Midl. Natl. 131, 311–319.
Lannoo, M.J., 2012. A perspective on amphibian conservation in the United States.Alytes 29, 133–144.
Larson, D.L., Euliss Jr., N.H., Lannoo, M.J., Mushet, D.M., 1998. Amphibians ofnorthern grasslands. In: Mac, M.J., Opler, P.A., Puckett Haecker, C.E., Doran, P.D.(Eds.), Status and Trends of the Nation’s Biological Resources, vol. 2, USDepartment of the Interior, US Geological Survey, Reston, 450–451.
Leitch, J.A., 1989. Politicoeconomic overview of prairie potholes. In: Van der Valk,A.G. (Ed.), Northern Prairie Wetlands. Iowa State University Press, Ames, pp. 2–15.
McCallum, M.L., 2007. Amphibian decline or extinction? Current declines dwarfbackground extinction rates. J. Herpetol. 41, 483–491.
Merrell, D.J., 1970. Migration and gene dispersal in Rana pipiens. Am. Zool. 10, 47–52.
Millenium Ecosystem Assessment, 2003. Ecosystems and human well-being: aframework for assessment. Millenium Ecosystem Assessment, Washington.
Mushet, D.M., Euliss Jr., N.H., Stockwell, C.A., 2012a. A conceptual model to facilitateamphibian conservation in the northern Great Plains. Gt. Plains Res. 22, 45–58.
Mushet, D.M., Euliss Jr., N.H., Stockwell, C.A., 2012b. Mapping anuran habitatsuitability to estimate effects of grassland and wetland conservation programs.Copeia 2012, 322–331.
Natural Capital Project, 2013. InVEST Version 2.4.5, <http://www.naturalcapitalproject.org/download.html>. accessed 04.03.13.

100 D.M. Mushet et al. / Biological Conservation 174 (2014) 93–100
Nelson, E., Cameron, D.R., Regetz, J., Polasky, S., Daily, G.C., 2011. Terrestrialbiodiversity. In: Kareiva, P., Tallis, H., Ricketts, Daily GC, Polasky S, T.H., Daily,G.C., Polasky, S. (Eds.), Natural capital: theory and practice of mappingecosystem services. Oxford University Press, Oxford, pp. 229–245.
Northern Great Plains Floristic Quality Assessment Panel, 2001. Coefficients ofconservatism for the vascular flora of the Dakotas and adjacent grasslands, USGeological Survey, Inform Tech Rep, USGS/BRD/ITR-2001-0001.
Norris, S., 2007. Ghosts in our midst: coming to terms with amphibian extinctions.Biosci 57, 311–316.
O’Rourke, D.P., 2007. Amphibians used in research and teaching. ILAR J. 48, 183–187.
Pough, F.H., 1980. The advantages of ectothermy for tetrapods. Am. Nat. 115, 92–112.
Pope, S.E., Fahrig, L., Merriam, H.G., 2000. Landscape complementation andmetapopulation effects on leopard frog populations. Ecol 81, 2498–2508.
Rashford, B.S., Walker, J.A., Bastian, C.T., 2011. Economics of grassland conversion tocropland in the Prairie Pothole Region. Cons. Biol. 25, 276–284.
Regan, H.M., Lupia, R., Drinnan, A.N., Burgman, M.A., 2001. The currency and tempoof extinction. Am. Nat. 157, 1–10.
Regester, K.J., Lips, K.R., Whiles, M.R., 2006. Energy flow and subsides associatedwith the complex life cycle of ambystomatid salamanders in ponds andadjacent forest in Illinois. Oecologia 147, 303–314.
Seale, D.B., 1980. Influence of amphibian larvae on primary production, nutrientflux, and competition in a pond ecosystem. Ecol 61, 1531–1550.
Semlitsch, R.D., 2000. Principles of management for aquatic breeding amphibians. J.Wild. Manage. 64, 615–631.
Semlitsch, R.D., 2008. Differentiating migration and dispersal processes for pond-breeding amphibians. J. Wild. Manage. 72, 260–267.
Semlitsch, R.D., Bodie, J.R., 2003. Biligical criteria for buffer zones around wetlandsand riparian habitats for amphibians and reptiles. Conserv. Biol. 17, 1219–1228.
Stuart, S.N., Chanson, J.S., Cox, N.A., Young, B.E., Rodrigues, A.S.L., Fischman, D.L.,Waller, R.W., 2004. Status and trends of amphibian declines and extinctionsworldwide. Science 306, 1783–1785.
Swengel, A.B., Swengel, S.R., 1998. Tall-grass prairie butterflies and birds. In: Mac,M.J., Opler, P.A., Puckett Haecker, C.E., Doran, P.D. (Eds.), Status and Trends of theNation’s Biological Resources, vol. 2, US Department of the Interior, US GeologicalSurvey, Reston, pp. 446–447.
Tallis, H.T., Ricketts, T., Guerry, A.D., Wood, S.A., Sharp, R., Nelson, E., Ennaanay, D.,Wolny, S., Olwero, N., Vigerstol, K., Pennington, D., Mendoza, G., Aukema, J.,Foster, J., Forrest, J., Cameron, D., Arkema, K., Lonsdorf, E., Kennedy, C., Verutes,G., Kim, C.K., Guannel, G., Papenfus, M., Toft, J., Marsik, M., Bernhardt, J., 2011.InVEST 2.4.5 User’s Guide. The Natural Capital Project, Stanford.
US Department of Agriculture, 2013. CRP Contract Summary and Statistics: AnnualSummary, <http://www.fsa.usda.gov/FSA/webapp?area=home&subject=copr&topic=crp-st> (accessed 13.11.13).
US Environmental Protection Agency, 2013. Level III and IV ecoregions of thecontinental United States, <http://www.epa.gov/wed/pages/ecoregions/level_iii_iv.htm>. accessed 04.03.13.
Vanni, M.J., 2002. Nutrient cycling by animals in freshwater ecosystems. Annu. Rev.Ecol. Syst. 33, 341–370.
Wright, C.K., Wimberly, M.C., 2013. Recent land use change in the Western CornBelt threatens grasslands and wetlands. Proc. Natl. Acad. Sci. 110, 4134–4139.