Embed Size (px)
Citation preview

©CopyrightJASSS
BirnurÖzbaş,OnurÖzgünandYamanBarlas(2014)
ModelingandSimulationoftheEndogenousDynamicsofHousingMarketCycles
JournalofArtificialSocietiesandSocialSimulation 17(1)19<http://jasss.soc.surrey.ac.uk/17/1/19.html>
Received:07-Apr-2013Accepted:08-Sep-2013Published:31-Jan-2014
Abstract
Thepurposeofthisstudyistomodelandanalyzebysimulationthedynamicsofendogenouslycreatedoscillationsinrealestate(housing)prices.Asystemdynamicssimulationmodelisbuilttounderstandsomeofthestructuralsourcesofcyclesinthekeyhousingmarketvariables,fromtheperspectiveofconstructioncompanies.Themodelfocusesontheeconomicbalancedynamicsbetweensupplyanddemand.Becauseoftheunavoidabledelaysintheperceptionoftherealestatemarketconditionsandconstructionofnewbuildings,pricesandrelatedmarketvariablesexhibitstrongoscillations.Twopoliciesaretestedtoreducetheoscillations:decreasingtheconstructiontime,andtakingintoaccountthehousesunderconstructioninstartingnewprojects.Bothpoliciesyieldsignificantlyreducedoscillations,morestablebehaviors.
Keywords:RealEstateModeling,HousingCycles,PriceOscillations,SystemDynamics,Socio-EconomicSimulation
Introduction
1.1 Realestatemarketingeneral,housinginparticularisoneofthemostdynamicandunpredictableeconomicsectors(Hiang&Webb2007;Muetal.2009).Moreover,therealestatesectorinvolveslargeandinfluentialinvestments,thusaffectingthewholeeconomyandthelabormarketprofoundly.Typically,housingmarketsexhibitoscillatorybehaviors,withcycleperiodsrangingfromafewyearstoafewdecades(Wheaton1999).Aswillbeseenintheliteraturereviewbelow,endogenousstructureofthehousingsectoritselfcanplayasignificantroleinthecreationofsuchcycles:Apositivehousingdemandmovementcausesthepricestorise(Aokietal.2004).Evenafternewconstructions,thepricesmaycontinuetorise,sinceexpectationsareformedbypastmovementsintheprices.Thepricespeakwhenconstructionsovershootthedemand,atwhichpointthepricesstarttodecline.Thisprocesssetsoffarepeatingcycleintheprices,construction,andthestockofhouses.Withinthisdynamicenvironment,constructioncompaniesfaceagreatriskofloss(orachanceofprofit)duetotheoscillatorybehavioroftheprices.Iftheyjustreacttothepricesandstartorphaseouttheirprojectsaccordingly,theymayhaveunsoldhousesinthebusttimesornotenoughhousesintheboomtimes.Becauseoftheunavoidabledelaysinthesystem,companiesmustforeseethedemandmovementsandstarttheirprojectswellbeforethedemandstartsrising.Theincreaseinthepopulationgrowthmakesthemarketevenmorecomplexandhardertopredict(Genta1989;DiPasquale&Wheaton1994;Aokietal.2004;Sæther2008).
1.2 Additionaltoitseconomicdynamics,housingdevelopmentisaprocessthatoperatesasaconnectedsequenceofevents.Theseseriesofevents(i.e.siteidentification,feasibilityanalysis,design,productionandoccupation)transformavacantsiteoraredundantorobsoletepropertyintoanewuse.Throughthisdevelopmentprocessmanydifferentactorsandinstitutionssuchasdevelopers,owners,occupiers,lenders,contractorsandsub-contractors,architects,technologists,localgovernment,consultants,engineersplaydifferentroles(Wyatt2007).Inevitably,theseoperationsandplayersareaffectedbymanydifferentfactorssuchaslong-termsocialtrends,nationalandglobaleconomicconditions,environmentalamenities,andgovernmentpolicies(Wyatt2007;Selim2009).SimilarlyeconomiccrisisandglobaleconomicrecessionshavedifferenteffectsonrealestatemarketsinUSandEurope(Deloitte2010).TheparametersandassumptionsofourstudyarederivedfromTurkeywhererealestatemarketisgrowingwithspeed(Binay&Salman2008).AccordingtoKeskin(2008)housingpricesareaffectedbyhousesize,levelandageofthebuildingandsafety(especiallyearthquakerisk)andsecurityofthesite,averageincome,timespentinthecityandneighborsatisfaction.Inadditiontothesedeterminantsotherhousingmarketvariables,rapidurbanizationandurbanpopulationgrowthstrengthenthehousingmarketinTurkey(Coskun2011).
1.3 Duetothedynamicstock-flownatureofthehousingvariables,stock-flowmodelsofhousingsectorhavebeenwidelyusedsince1960s(DiPasquale&Wheaton1994;Fair1972;Maisel1963).Thecommonfeatureofthesemodelsisthattheyrepresenttherelationshipsbetweenthehousingstocksandtheirflowsbydifference/differentialequations.Mostofthesemodelsareusedtoreflectthephysicalconversionprocessofconstructionstohousesupply.However,thisphysicalprocessisonlyapartofthesystem.Instudiesthatmodelonlyapartofthesystem,thedynamicsandforecastshavetobebasedonvariablesexogenoustothemodel.Themajorityofthestudiesinthehousingliteraturebuildeconometricmodelsbasedonthisstock-flowstructurethatseektoexplainorforecastexogenouslythedynamicsofthesystemvariables.Overtheyears,manyimprovementshavebeenmadeinstock-flowmodeling,byusingevidencefromliteratureandrepresentingmorevariablesendogenouslyinthemodel.Aswillbeseenbelow,thereisathreadofliteraturethatseekstoexplainthemarketbehavioralmostendogenouslybasedonmoreelaboratestock-flowmodels.Ourstudybelongsinthisbranchofliterature,byadoptinga"systems"perspectivetotheproblemofhousingpricecycles.Itmeansthatwefocusonhowsystemcomponents,inthiscase,thesupply,demandandprice,relateddecisionsanddelays,allinteractwitheachother.Insteadofseeingtheproblemasanopensystemthatisdeterminedbyexternalforces,weidentifyfeedbackloopsbetweenthesystemvariables,toexplaintheoscillations.Thesefeedbackloopsincludenotonlythephysicalprocesseslikeconstructionorpriceadjustment,butalsothementalprocessesofdecisionmakers,likeeffectofpriceonnewconstructiondecisionsorperceptionformations.Toformallyrepresenttheseprocesses,weusesystemdynamicsmethodology,amodelingandsimulationdisciplinethatusesmultiplestock-flowstructuresandfeedbackloopstoanalyzecomplexsocio-economicdynamicsystems
http://jasss.soc.surrey.ac.uk/17/1/19.html 1 16/10/2015
(Forrester1961;Sterman2000).
1.4 Systemdynamicsusesstockandflowvariablestodenotetheprocessesthatcanbeexpressedbyadifferential(ordifference)equation:therateofchangeofastockisthenetsumofitsflows.Thestockschangethroughtheirflows,andtheflowscanbefunctionsofanyvariablesinthemodel.Stocksareusedtorepresentnotonlyphysicalaccumulations(likestockofhouses),butalsointangibleaccumulations(likeexpectationsthatdevelopovertime).Oneoftheuniquefeaturesofsystemdynamicsapproachisthatitholdsasystemic(holistic)worldview.Thissystemicperspectivemeansstrivingtobuildmodelsthatincorporateendogenouslyallvariablesthatarerelevanttotheproblem.Thus,theoutputsofthemodelaredrivennotbytheexternalfactors,butbytheinternalstructureofthemodel.Theinternalstructurecomprisesthefeedbackloopsformedbyinterdependenciesbetweenvariables.
1.5 Ourmodelbuildsuponpreviousstock-flowmodelsofhousingmarkets,aswellasgenericstructuresusedinsystemdynamicsliteraturetorepresentcommonphysicalandmentalprocesses.Itisadynamicmodelofthedemandandsupplysidesoftherealestatemarketinamajorandstillgrowingcity.Themodelisagenericoneandlikelytobereasonablyvalidforanydevelopingurbanarea.However,theparametersandassumptionsarebasedonthecityofIstanbul,Turkey.
1.6 InSection2ofthepaper,aliteraturereviewoftherelatedstudiesispresented.Then,themethodologyisdescribedinSection3.InSection4,themodelisexplainedandthevalidationprocessissummarized.Finally,scenarioandpolicyanalysisresultsarepresented.
LiteratureReview
2.1 Ourmodelisacontinuoustime,nonlinear,non-equilibrium,dynamicstock-flowmodelthatconsistsoffeedbacksinbothsupplyanddemandsidesofthesystem.Themodelparticularlyfocusesonendogenouslycreatedcyclesofhousingmarketinthelongtermfromtheconstructorcompanyperspective.Althoughcurrentliteratureincludesmanymodelsthatpossessoneormanyoftheseproperties,ourmodelisuniqueinthesensethatitcombinesalltheseaspects.
2.2 Priceisoneofthekeyvariablesofthehousingsector,aswellasourmodel.Causalmechanismsthatdrivethehousingpricedynamics,whichconstitutethecoreofourmodel,havebeensubjectofmanymodel-basedstudiesinthepast50years.Anas(1978)developsarecursivedynamicmodelofurbanresidentialgrowth.Themodelfocusesonhowconsumption,housingprices,andlandrentsadjustovertime.Inastudythatisnothousing-specific,FershtmanandFishman(1992)usesadynamicsearchmodeltodemonstratethatthepriceofacommoditycanshowcyclicalbehaviorduetoendogenousdynamicinteractionsbetweenbuyersandfirms,withoutanyexternalinterventiontothesystem.ChicagoPrototypeHousingMarketModelpresentedinAnasandArnott(1993)isamulti-dimensional,discrete-time,dynamicequilibriummodelthatreflectsassetbid-price,housingstockadjustmentandmarketclearingprocesses.Itisapolicy-orientedmodelwithamediumtermtimehorizon(10years)focusingmainlyonthedynamicsofthesubcomponentsofthesystem.Meen(2000)developsamathematicalmodelincludinghouseprices,constructions,costandinterestratesandtheirinteractionstoanalyzehousingcyclesoftheUKmarket.Filatovaetal.(2009)developsanagent-basedmodelthatincludesbehavioraldriversofland-markettransactionsonboththebuyerandsellersides.Murphy(2010)presentsadynamicmicro-econometricmodelofhousingsupplytoexplainthevolatilityinpricesintheSanFranciscoBayArea.
2.3 Amongthedynamicmodelsofhousingmarket,thestock-flowmodelsareofparticularinteresttous(asexplainedinSection3).Astudycanbeclassifiedasstock-flowmodelifithasaconceptualizationofthesystembasedonstockandflowsinadynamicperspective.Inoneoftheearlystudies,Maisel(1963)presentsamodelwithtwobasicstocks:stockofdwellingsandinventoryunderconstruction,whichareconnectedthroughcompletionsflow.Theinflow,calledstarts,isdeterminedbybuilders,bytakingintoaccountthestockandsomeexternalfactors.Thisisarathersimpleframeworkfocusingmainlyonthesupplysideofthesystem.Smith(1969)usesasimilarstructureforthehousingmarket,butpresentsamoreelaboratemodelofthemortgagemarketandrelatestothedemandsideofthehousingmarket.However,themodeldoesnotincludeseparatesupplyanddemandequations,meaningthatequilibriumisassumed.Fair(1972)summarizesafewothermodelsthatassumeequilibriumbetweendemandandsupply.
2.4 Weibull(1983)presentsathree-stockstructuretorepresentdemand,supplyandpriceinacontinuous-timedynamicmodel.Themodelaccountsfornonlinearitiespresentinthesystem,butlackstheconstructionandinvestmentsideoftheproblem.Poterba(1984)usesamodelcomposedoftwodifferentialequationsforhousingstockandprice.Althoughthismodelrepresentspriceendogenously,itlackssomerelateddelaysandfeedbackloops.ThepaperbyDiPasqualeandWheaton(1994)providesasummaryofhistoricaldevelopmentofstock-flowbasedhousingmodelsanddevelopsadynamicstock-flowmodelofhousingmarkettounderstanditsaggregatebehavior.Authorsalsoimprovetheearlierstock-flowmodelsbyincludinggradualpriceadjustment,expectationformationandafeedbackloopcontrollingnewconstructions.Althoughthismodelreflectstheessentialbackboneofadynamichousingmodel,thereisonlyonemajorfeedbackloop,whichisfromhousingstocktotheconstructionstartsthroughprice.ThemodeldevelopedbyDiPasqualeandWheaton(1994)hasbeenmodifiedbyTu(2004)andappliedtoSingaporeprivatehousingmarket.Jiangetal.(2010)alsomodifiesthestock-flowmodelofDiPasqualeandWheaton(1994)toanalyzethefactorsdrivinghousingmarketcyclesinChina.Yetthesemodificationsdonotenrichthemodelstructurebutmerelyadaptthemodeltodifferentlocations.
2.5 Althoughtheaforementionedstudiesuseastock-flowstructuretheyareessentiallydata-driven,exogenousmodelsthatseektoexplainandpredictpricefluctuations.Somestudies,ontheotherhand,useendogenousstock-flowstructurestogeneratethedynamicbehaviorofthehousingmarket.Forinstance,Barras(2005)buildsasetofdifferenceequationstoexplainendogenouslythecyclicalbehaviorhousingmarket.Themodelaccountsfortwotypesofdemandcreation:duetogrowthandduetoturnover.Therearedelaystructuresinrent(orprice)adjustment,occupierresponsetorentchanges,constructionstarts,andconstructioncompletions.However,thismodelignorestheeffectofpriceondemandandthematchingprocessbetweensupplyanddemand.Likewise,Eskinazietal.(2011)createsasystemdynamicsmodelfortheNetherlandshousingmarketbasedonDiPasqualeandWheatonmodel.
2.6 Thereareotherexamplesofhousing-relatedstudiesinthesystemdynamicsliterature.J.Forrester'sUrbanDynamicsmodel(1970)isoneofthefirstsystemdynamicsmodelsdealingwiththehousingdynamicsinanurbanarea.Itfocusesontheconnectionsbetweenthelabor,businessandhousingsectors,butdoesnotincludevariablesaboutprice.Recently,Kummerow(1999)presentsasystemdynamicsmodelforcyclicalofficeoversupplyproblem.Hismodelconsistsofasinglebalancingfeedbackloopbetweenvacancyrateandsupply,assumingallotherfactorsexternal.Thepaperassertsthatthesupplylag,theadjustmenttimeandthetendencyofoversupplyareresponsibleforthecyclesandtheycanserveasleveragevariablesforreducingthecycles.Hong-MinhandStrohhecker(2002)presentsasystemdynamicsmodelfortheprivatehousingsupplychainstoassesstheimpactofre-engineeringscenariosonconstructionperformanceandtostudytheimpactofre-engineeringpoliciesondemandamplifications.Hoetal.(2010)presentsamodelofhousingmarketofTaichungCityinTaiwantodeterminetheeffectivenessofvariousgovernmentpolicies.Genta(1989)andSæther(2008)developsystemdynamicsmodelstoexplainthehousingcyclesinBostonandNorway,respectively.
http://jasss.soc.surrey.ac.uk/17/1/19.html 2 16/10/2015

2.7 Onedistinctivepropertyofourmodelisitsendogenousfocus.Inourstudy,likeothersystemdynamics-basedstudies,wemainlyfocusonthedynamicsgeneratedbytheinteractionsbetweenthesystemvariables.Asasystemdynamicsmodel,itsdynamicbehaviorsareendogenouslygenerated,ratherthanbeingexternallydata-driven.Theaimisnottoforecastthehousepricesatspecifictimepoints,buttounderstandhowandwhythepricecyclesoccur.Themodelisnotonlyvalidfortheequilibriumstatebuthasthecapabilitytoreflectthetransientdynamicsinthehousingmarket.
2.8 Unlikethesystemdynamicsmodelscitedabove,ourmodelisbuiltfromtheperspectiveofconstructioncompanies.Theproblemownerisimportantbecauseitdeterminesthemodelboundary.Sinceourmodelisconstructer-oriented,itinvolveseconomicdecision-makingprocessesofthecompanies.Duetothefactthatconstructioncompaniesdonothavedirectinfluenceonhouseholds'buyingdecisions,thedemandsideandthepurchasingpowerofthecustomersaremodeledinlessdetail.Theproblemperspectiveisalsorelevantinidentifyingfeasiblepolicyinterventionsandevaluatingtheiroutcomes.Ourrecommendedpoliciesmodifydecisionparametersthatareundercontrolofconstructionsector,andtheevaluationofthesepoliciesconsiderstheireffectsonprofits.
2.9 Structure-wise,ourmodelalsobringsseveralimprovementstotheexistingmodelsintheliterature.Thetraditionalassumptioninthestock-flowmodelisthatthemarketclearsquickly(DiPasqualeandWheaton1994).However,thepriceadjustmentmechanismandthesearchprocesscancausesignificanttimelagsthatcanaffectthedynamicbehavior.Althoughgradualpriceadjustmentisafeatureofsomeearliermodels(forexample,DiPasquale&Wheaton1994;Barras2005;Eskinazietal.2011),noothermodelthatwereviewedexplicitlymodelsthesearchprocessanditseffectonsalesduration.Moreover,manymodelseitherassumedemandtobeexternal(Maisel1963;Kummerow1999;Sæther2008),orsolelydependentonsupply(Barras2005;Jiangetal.2010),ignoringtheeffectofpriceondemand.Byincludingallthesefeedbackloops,arichstructureiscreatedwhichiscapableofproducingdifferentbehaviorsendogenously.
Methodology
3.1 Systemdynamicsisamodel-basedmethodologytoanalyzecomplexdynamicsystemsinvolvingfeedbackinteractions.Thebasicelementsofasystemdynamicsmodelarestocksandflows.Astockvariablerepresentsanentitythatgraduallyaccumulatesordiminishesovertime.Aflowistherateofchangeofastock.Mathematically,therelationshipbetweenstocksandflowscorrespondstodifferential(ordifference)equations.Apartfromstocksandflows,thereareauxiliaryvariablesthatrepresentthestock-to-flowlinksexplicitly.FeedbackcorrespondstoasituationwhereXinfluencesY,andYinturninfluencesXthroughachainofcausalrelationships.Therearetwotypesoffeedbackloops;apositivefeedbackloopmeansthataninitialchange(increaseordecrease)inavariablewilleventuallycausethesamevariabletochangeinthesamedirection.Onthecontrary,anegativefeedbackloophasabalancingeffect:aninitialchangeinavariablewilleventuallycausethesamevariabletochangeintheoppositedirection(SeeFigure2foranillustrationoffeedbackloops).Sincevariablesinasystemareinterconnectedthroughfeedbackloops,thebehaviorofanyvariableisdependentonthewholesystem.Formoreinformationonsystemdynamicsmethodologysee,forinstance,Barlas(2002)andSterman(2000).
3.2 Themotivationofthisstudyistoinvestigatethestructuralreasonsbehindthecyclicbehaviorofthemainhousingvariables.Themodelboundaryisselectedlargeenoughtomakesurethecausalmechanismsthatdrivethesystembehaviorlieinsidetheboundary,assuggestedinsystemdynamicsliterature(Forrester1987).Thedynamichypothesisispresentedusingacausal-loopdiagram(Figure2),whichexplainshowvariablesarelinkedtoeachother.Thisconceptualmodelisthentranslatedtoaformalmathematicalmodelintheformofastock-flowdiagramandequations(Figure3).Afterverificationandvalidationsteps,thecausesoftheoscillatorybehaviorcanbeidentifiedbyaseriesofsimulationexperiments.Withtheaidofsuchamodel,itispossibletodesignimprovementpoliciestodampentheoscillationsandanalyzetheireffectsonthewholesystem.
3.3 ThemodelisdevelopedandimplementedusingSTELLA9.1.4(iseesystems2009).InSTELLAandmostcomputersimulationapplicationsofsystemdynamicsmodels,thedynamicrelationshipsbetweentheelements,includingvariables,parameters,andexternalinputs,arecapturedintheinterfaceinformsofequations,graphsandfunctions(asgiveninAppendix)usinguser-friendlyvisualtools.Itisaflexiblewayforbuildingsimulationmodelsfromcausalloopsorstocksandflows.Whensimulationrunsarecarriedout,varioustypesofgraphsandtablesaretheoutputsfromSTELLA.Themodelcanbedownloadedfrom:http://www.openabm.org/model/3936/.
TheModel
4.1 Themodelisbuiltfromtheperspectiveoftheconstructioncompanies.Specifically,thedecisionmakercouldbeatradechamber,anassociationoraconsortiumofconstructioncompanies.So,themodelfocusesontheconstructionchainsandthedecision-makingprocessesofthecompanies.Thisdynamicmodelseekstoexplainthestructuralcausesofhousingmarketoscillationsandtestalternativepoliciesthatmayimprovethedecisionmakingprocessoftheconstructioncompanies.
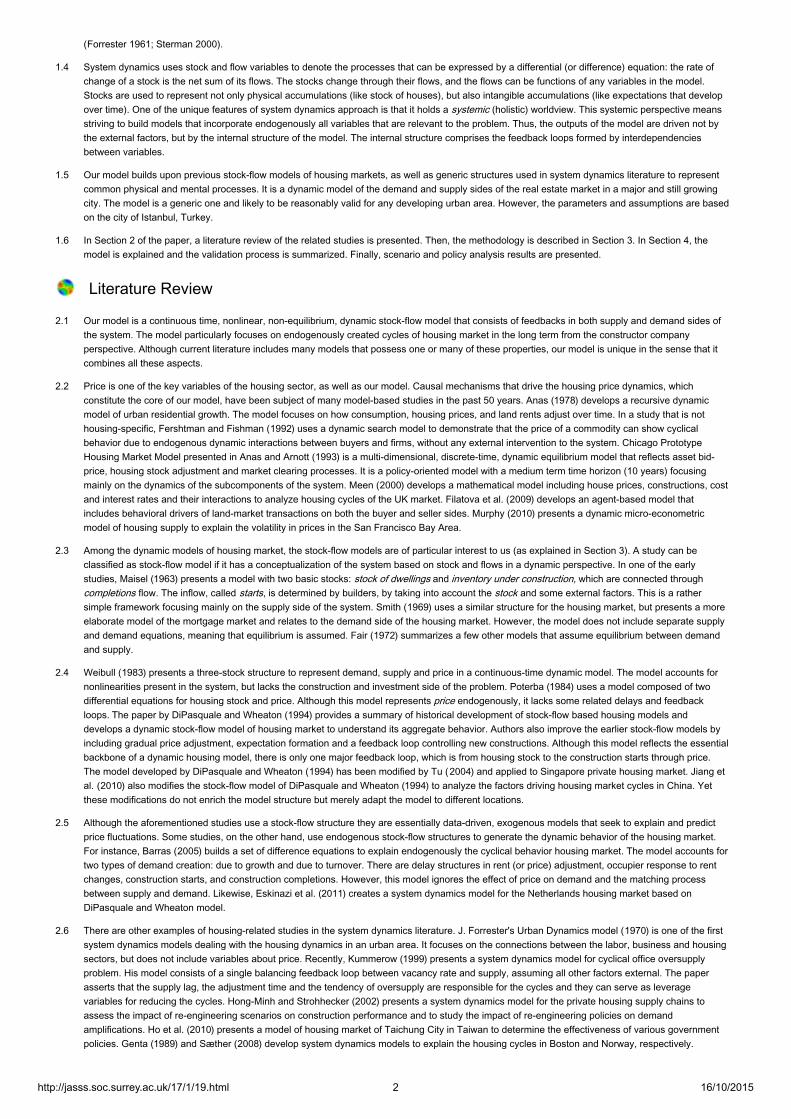
4.2 Therealestatepricesareknowntoexhibitoscillatorybehaviorsinreallife(Wheaton1999).InFigure1,thede-trendedratioofrealestaterentindextotheoverallpriceindexinIstanbulisusedasareferencebehaviorforthemodel.Therentpricesareusedasareferencebecauselong-termhousepricedataseriesforIstanbulisnotavailable.RentandhousepricesinIstanbulareingeneralassumedtobestronglycorrelated,whichlogicallymakessense.Moreoverthestronglinkagebetweenrentsandpricesinhousingisalsoshownintheliterature(Hargreaves2008;Gallin2008).WebelievethatthebehavioroftherentpriceisagoodproxyfortherealestatepricebehaviorforIstanbul.
http://jasss.soc.surrey.ac.uk/17/1/19.html 3 16/10/2015
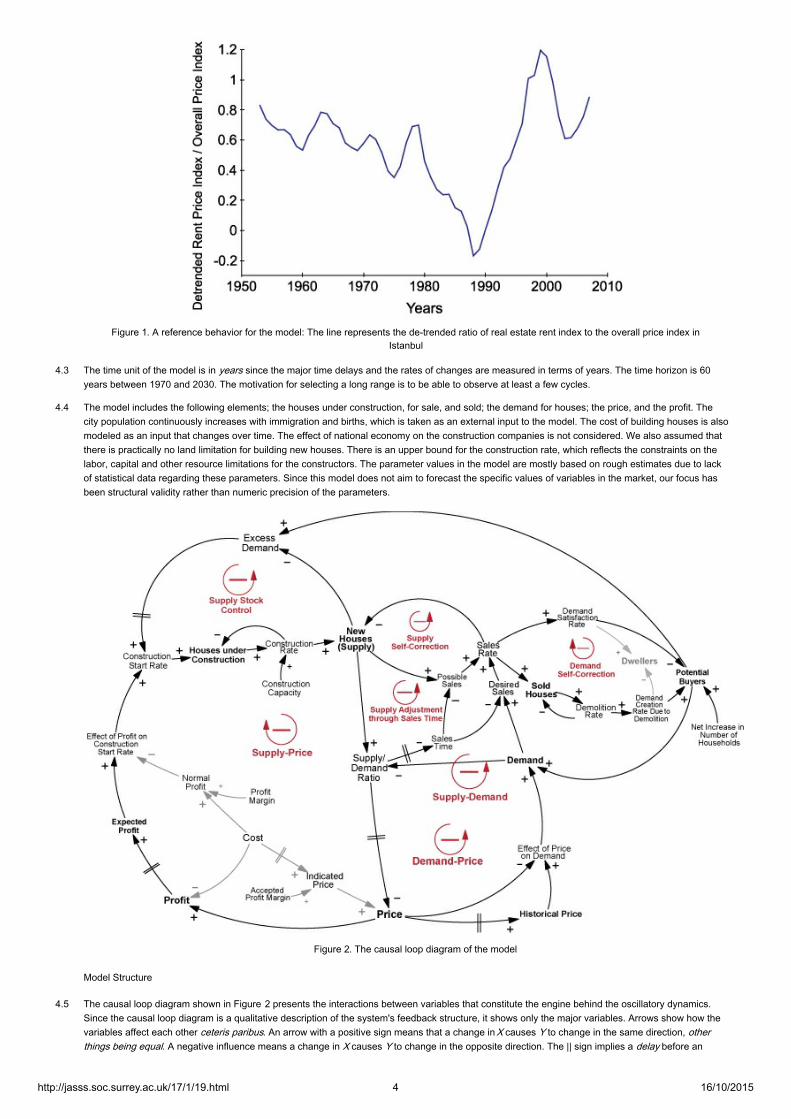
Figure1.Areferencebehaviorforthemodel:Thelinerepresentsthede-trendedratioofrealestaterentindextotheoverallpriceindexinIstanbul
4.3 Thetimeunitofthemodelisinyearssincethemajortimedelaysandtheratesofchangesaremeasuredintermsofyears.Thetimehorizonis60yearsbetween1970and2030.Themotivationforselectingalongrangeistobeabletoobserveatleastafewcycles.
4.4 Themodelincludesthefollowingelements;thehousesunderconstruction,forsale,andsold;thedemandforhouses;theprice,andtheprofit.Thecitypopulationcontinuouslyincreaseswithimmigrationandbirths,whichistakenasanexternalinputtothemodel.Thecostofbuildinghousesisalsomodeledasaninputthatchangesovertime.Theeffectofnationaleconomyontheconstructioncompaniesisnotconsidered.Wealsoassumedthatthereispracticallynolandlimitationforbuildingnewhouses.Thereisanupperboundfortheconstructionrate,whichreflectstheconstraintsonthelabor,capitalandotherresourcelimitationsfortheconstructors.Theparametervaluesinthemodelaremostlybasedonroughestimatesduetolackofstatisticaldataregardingtheseparameters.Sincethismodeldoesnotaimtoforecastthespecificvaluesofvariablesinthemarket,ourfocushasbeenstructuralvalidityratherthannumericprecisionoftheparameters.
Figure2.Thecausalloopdiagramofthemodel
ModelStructure
4.5 ThecausalloopdiagramshowninFigure2presentstheinteractionsbetweenvariablesthatconstitutetheenginebehindtheoscillatorydynamics.Sincethecausalloopdiagramisaqualitativedescriptionofthesystem'sfeedbackstructure,itshowsonlythemajorvariables.Arrowsshowhowthevariablesaffecteachotherceterisparibus.AnarrowwithapositivesignmeansthatachangeinXcausesYtochangeinthesamedirection,otherthingsbeingequal.AnegativeinfluencemeansachangeinXcausesYtochangeintheoppositedirection.The||signimpliesadelaybeforean
http://jasss.soc.surrey.ac.uk/17/1/19.html 4 16/10/2015

effectreachesavariable.Figure3showsthestock-flowdiagramofthemodel.Stock-flowdiagramcorrespondstotheformalquantitativemodelusedinsimulations.EachvariablehasacorrespondingequationintheAppendix.
4.6 Intheremainingpartofthissection,weexplainmajorfeedbackloopsandcriticalformulations.Wereferreaderstothecausal-loopdiagram(Figure2)whenfeedbackloopsarediscussed,andtothestock-flowdiagram(Figure3)whenspecificformulationsarediscussed.
4.7 Threemajorbalancing(negative)feedbackloopsgovernthebehaviorofthesystem,aswillbedescribedbelow:demand-price,supply-priceandsupply-demandloops.Abalancingloopcounteractsanydisturbanceinvariablesintheloop,forcingthesystemtoseekanequilibrium.
Figure3.Thestock-flowdiagramofthemodel.Rectanglesstandforthestocksandpipeswithvalvesstandfortheflows.Othervariablesareauxiliariesorparameters.
Thelifecycleofhouses
4.8 Likemoststock-flowmodels,ourmodelrepresentsthelifecycleofhousesbyaseriesofstocksvariables:housesunderconstruction,newhouses,andsoldhouses(Maisel1963).Twoflowvariablesconnectthestocks:constructionrateandsalesrate.Constructionrateislimitedbyconstructioncapacity,whichisaresultofphysicalresourcelimitations.Thenewprojectsfirstturnintoconstructionsandthentonewhousesafteraconstructiondelay.
4.9 Salesrateisdependentonbothsupplyanddemand.Soldhousesaredemolishedafteranaveragelifetimeof40years.
Demandcreationprocess
4.10 Inthemodel,potentialbuyersisastockvariablethatrepresentsthehouseholdswhoneedahousefordwelling(seeFigure3).Newpotentialbuyersarecreatedbytwoways:demandcreatedduetodemolition(naturalturnover)andincreaseinnumberofhouseholds(demandcreationduetopopulationgrowth)(Barras2005).Potentialbuyersstockdecreasesbydemandsatisfactionrate(whichisequaltothesalesrate).Thisstockanditsflowsarethusdefinedinthefollowingdifferentialequation:
d(PotentialBuyers)/dt=Netincreaseinnumberofhouseholds+Demandcreationrateduetodemolition−Demandsatisfactionrate
(1)
Thedifferentialequationsshowthecontinuousrateofchangeofthestocks.Inordertoevaluatethemincomputersimulation,asmalltimestep(dt)isusedtocomputethevalueofthestock.Itsvalueattimet+dtiscomputediterativelyasfollows:
PotentialBuyerst+dt=PotentialBuyerst+(Netincreaseinnumberofhouseholds+Demandcreationrateduetodemolition−Demandsatisfactionrate)×dt
(2)
http://jasss.soc.surrey.ac.uk/17/1/19.html 5 16/10/2015

Theaboveformofsimulationequationholdsingeneralforallstockequations.
4.11 Netincreaseinnumberofhouseholdsshowsthenumberofnewhousesdemandedbythepopulation(households)annually.ItisanexternalinputasgiveninFigure4,basedonhistorichouseholdincreaseratesofIstanbulundertheassumptionthatonehouseholdcreatesonehousedemandundernormalpriceconditions.Thefuturevaluesareextrapolatedbasedoncurrenttrend.
Figure4.NetIncreaseinNumberofHouseholdsovertime(modelinput).
4.12 Whilevariablepotentialbuyersrepresentsthepopulationneedingahousefordwelling,itisnotnecessarilyequaltotheactualdemandonthemarket.Theprevailingmarketpricehasaneffectonthedemand.Specifically,demandisdependentoneffectofpriceondemandandpotentialbuyersasshownEquation3.
Demand=Potentialbuyers×Effectofpriceondemand (3)
4.13 EffectofpriceondemandisadecreasingfunctionofpriceandhistoricalpriceasillustratedinFigure5.Whentheaveragehousepriceishigherthanhistoricalprice,peopletendtodecreasethedemandorviceversa.Whenpriceisequaltohistoricalprice,theeffectfunctiontakesthevalueof1.Thismakesdemandequaltopotentialbuyers,thenormaldemandlevel.
Figure5.EffectofPriceonDemand
4.14 Suchnonlineareffectformulationsareusedthroughoutthemodeltoexpresscausalrelationsbetweenvariables.Theadvantageofusingeffectfunctionsisthefreedomtoexpressanykindofnonlinearrelationwithoutbeinglimitedbycertainhard-to-present/understandmathematicalexpressions.
Demand-Priceloop
4.15 Thisloopreflectstheclassicalbalancingprocessofdemandthroughprice(SeeFigure2).Supposethatatsomegiventimethesystemisinequilibriumanddemandsuddenlyincreases(maybeduetoasuddenimmigration).Thisriseindemanddecreasessupply/demandratio.Sinceittakessometimeformarketactorstoperceiveandrespondtothischange,priceincreases,afteradelay.Weusedafirst-orderinformationdelaystructuretorepresentthisprocess,whichiswidelyusedinsystem-dynamicsliterature(Sterman2000)tomodeldelayedperceptions(seeAppendix).Increasedpricecausesdemandtofallback.Asimilarlogicalsequenceofsuccessiveeffectsalsoholdsforaninitialdecreaseofdemand,aswellasanyothervariableintheloop.
Constructionstartprocess
http://jasss.soc.surrey.ac.uk/17/1/19.html 6 16/10/2015

4.16 Costistakentobeanexternalinputthatchangeswitheconomicconditions,whicharenotexplicitlyincludedinthemodel,asgivenbyFigure6.
Figure6.Averagecostofdwellingunits(modelinput)
4.17 Thecostdataarebasedon1970–2008statisticsofaveragecostofdwellingunitsinTurkey,providedbyTurkishStatisticalInstitute.Thedataaredeflatedtoyear2009pricesandsmoothedbynonparametricregressiontoavoidsuddenchangesinthemodel.
4.18 Thedifferencebetweenpriceandcostdeterminesprofit.AsdemonstratedbyKenny(1999),constructioncompaniespassanyincreaseinthecoststothebuyers,inordertomaintainprofitmargins.Thisfactisreflectedinourmodelasnormalprofitthatdependsoncostandprofitmargin.Normalprofitisthebenchmarkvalueforprofit,usedtocomparetheattractivenessoftheprofitobtainablebystartingnewprojects(seeFigure3).Theratioofexpectedprofittonormalprofitdetermineseffectofprofitonconstructionstartrate,whichisaconcaveincreasingfunction,similartoFigure7.Thedifferencebetweennewhousesandpotentialbuyersisexcessdemand,asshownbelow.
ExcessDemand=PotentialBuyers−NewHouses (4)
Thisexcessdemandcannotbeknownaccuratelyandtheconstructionfirmsestimateitbyanexponentialsmoothingprocess.
4.19 WhileBarras(2005)modelstheconstructionprocessasastock-adjustmentstructurewithadesiredlevelofbuildingstock(occupiedornot)thatchangewitheconomicgrowth,ourapproachreflectstheconstructorpointofview.Inourmodel,insteadoftryingtoreachadesiredhousingstock,thefirmsaimtomeetestimatedexcessdemandbystartingnewconstructions.Iftheyexpectahigherprofitthantheirnormalprofits,theirwillingnesstomeetexcessdemandincreases.Thenewprojectsturnintoconstructionsandafteraconstructiondelay,tonewhousesandthendemolishes.Constructionrateislimitedbyconstructioncapacity,whichrepresentstheconstraintsofavailableresources.
Supply-Priceloop
4.20 Anothermajorloopisthesupply-pricefeedbackloop(seeFigure2).Whenpricerises,profitincreases.Increasedprofitgraduallyincreasesexpectedprofit.Companiescomparetheirexpectedprofitwithnormalprofit(sincecompaniescannotknowtheexactprofitthatcanbeobtained,aninformationdelaystructureisusedtorepresenttheprofitexpectationprocessofthefirms).Ifexpectedprofitishigherthannormalprofit,constructionstartraterises.Throughthephysicalprocessofconstruction,housesunderconstructionyieldnewhouses.Theincreasedstockofnewhouses(thesupply)increasesthesupply/demandratio.Theriseofsupply/demandratiocreatesareductioninprice.Thisisanegativefeedbackloopinvolvingseveraldelays.Althougheventuallyanypricechangeiscompensatedbytheeffectofnewconstructions,thedelaysslowdowntheprocessandcausethepricetooscillate.
Supplystockcontrolloop
4.21 Thereisanegativeloopbetweentheexcessdemandandthesupply(seeFigure2).Asexplainedabove,estimatedexcessdemandstimulatesnewconstructionsandthenewhousesforsale.Thisconstructiondecreasestheexcessdemand,whichclosesthebalancingfeedbackloop.Thisloopisanalogoustoaninventorycontrolstructurethattriestokeeptheinventoryconstantatatarget.Inourmodel,inventorycorrespondstonewhousesandtargetisthenumberofpotentialbuyers.
Price
4.22 Priceisanchoredonindicatedcostandadjustedbyeffectofsupply/demandratioonprice(SeeFigure3).Indicatedpriceistheexpectedaveragepriceofahouseundernormalsupply/demandconditions.Itisassumedthat,indicatedpriceis10%higherthantheperceivedcostofbuildingahouse.Perceivedcostisthesmoothedversionoftheaveragebuildingcostinthemarket.Kenny(1999)demonstratedthathousepricesadjustpositivelyinresponsetoanyexcessdemandforhousing.Inlinewiththatobservation,Effectofsupply/demandratioonpriceismodeledasadecreasingS-shapedfunction(seeAppendix)similartotheformulationsavailableintheliterature(Genta1989).
SalesProcess
4.23 Salesoccurwhennewhousesanddemandarebothavailable.Searchtheoryregardsresidentialhousingmarketasasamplingprocessofavailablehouseswithconstantrate,whichcontinueuntilbuyerfindsanacceptablehouse(Haurin1988).Thus,theavailabilityofhousesrelativetothedemanddeterminesthespeedofsales,whichisquantifiedinourmodelasfollows:
http://jasss.soc.surrey.ac.uk/17/1/19.html 7 16/10/2015

Salestime=NormalSalestime×Effectofsupply/demandratioonsalestime
(5)
4.24 Normalsalestime(1year)istheaveragetimespentinmatchingthedemandandthesupplyundernormalmarketconditions.Effectofsupply/demandratioonsalestimeisanincreasingconcavefunctionof1/perceivedsupplydemandratioasgiveninFigure7.Itisassumedthatifperceivedsupply/demandratiodecreases,salestimeincreasessinceittakeslongertimeforpeopletofindanewhousemeetingtheirneeds(astheprobabilityoffindingamatchdecreases).
Figure7.EffectofSupply/DemandRatioonSalesTime
4.25 Possiblesalesistheaveragerateatwhichnewhousescanbesoldincurrentsalestime,withouttakingthedemandintoconsideration.Desiredsales,ontheotherhand,istheaveragerateatwhichdemandcanbemet,ignoringthesupply.Salesrateistherealizedrateofsales,whichistheminimumofdesiredandpossiblesalesrates.
Supply-DemandLoop
4.26 Thislooprepresentsthebalancingprocessbetweensupplyanddemand,throughsalesandprice(SeeFigure2).Asdemandincreasessalesraterises.Thisreducesthesupplyandraisesprice,afteradelay.Therisenpricehasanegativeeffectondemand.
SupplyandDemandSelf-CorrectionLoops
4.27 Theseareminornaturalfeedbackloopsthatareresultsofstockscontrollingtheiroutflows.Increasedsupplyofhousesgivesrisetofastersales,whichinturndecreasesthesupplyitself.Asimilarprocessworksforthedemand.
SupplyAdjustmentthroughSalesTime
4.28 Thisloopconstitutesanextrabalancingprocessforthenewhousesstock(seeFigures2and3).Whenthelevelofnewhousesbecomeslargerthanthedemand,theincreasedavailabilityofnewhousesshortenstheprocessofsupply-demandmatching,thusshortensthesalestime.Decreasedsalestimeleadstoincreaseddesiredsalesandpossiblesales,whichmeanshighersalesrate,whichinturnbalancesofftheriseinthenewhousesstock.Thusanyincreaseinnewhousesstock,otherthingsbeingequal,inducesanincreaseinsalesrate(outflow),whichinturnresultsinanegativemovementinnewhouses(stock).Thisnegativefeedbackloopshowsthebalancingnatureoftheprocess.
ModelBehavior
4.29 Figure8showsthedynamicbehaviorsgeneratedbythebasemodel.Pricefollowsthegeneraltrendofcost(seeFigure8(a)).Duetotheeffectofprofitmargin,theaveragepriceis26%higherthantheaveragecost.Therangeoftherealizedprofitmarginisbetween0%and46%.Moreimportantly,priceexhibitsoscillationswithanaverageperiodof7years.Themainreasonbehindthisoscillationisthenegativeloopandthedelaysbetweendemandcreationandnewhouseconstruction.Thisdelayincludesthetimespentinstartingnewprojectsaswellastheconstructionduration.Duringthisperiod,duetoshortageofsupply,whichcanbeseenasadecreaseinsupply/demandratioinFigure8(b),priceincreases.Theconstructionfirmsdonottakeintoaccounttheconstructionsinprogressandcontinuetostartnewprojectsinordertobenefitfromthehighprofitsinthemarket.Astheconstructionsarecompleted,thedemandhasalreadybeenmet,andanexcesssupplyemerges,whichcausesadecreaseinprice.Thelagbetweenthedemandandthesupply(newhouses)isclearlyseeninFigure8(c).
4.30 AsseeninFigure8(d),effectofprofitontheconstructionstartrateisusuallycloseto1,whichmeansthatthecompaniestrytoconstructnewhousesasmuchasexcessdemand.Sometimes,expectedprofitfallsbelownormalprofitasshowninFigure8(e).Thiscausesadecreaseineffectofprofitonconstructionstartrateandtheconstructioncompaniesdecidetomeetasmallerportionofestimatedexcessdemand.
http://jasss.soc.surrey.ac.uk/17/1/19.html 8 16/10/2015

(a)Behaviourofcost(input)andprice(output)
(b)Behaviourofsupply/demandratioanditseffectonprice
(c)Behaviourofdemandandnewhouses
http://jasss.soc.surrey.ac.uk/17/1/19.html 9 16/10/2015

(d)Behaviourofconstructionstartrateandtheeffectofprofitonit.(Impliedconstructionstartrateisdefinedasestimatedexcessdemanddividedbyconstructionrealizationtime)
(e)Behaviourofprofit-relatedvariablesFigure8.Behaviorsofthebasemodel
Validation
4.31 Sincesystemdynamicsmodelsarelong-termbehavior-orienteddescriptivemodels,theirvaliditycannotbemeasuredbytheircapabilitiesofmakingpointforecasts.Rather,theyareevaluatedintermsoftheirstructuraladequacyandtheirpowerofgeneratingvalidbehaviorpatterns.Validityofthebehaviorscanbecheckedagainstavailablerealbehaviorpatterns,oragainstlogicallypredictedbehaviorsunderextremeconditions.Thus,therearetwomainaspectsofvalidationofsystemdynamicsmodels:structurevalidityandbehaviorvalidity(Barlas1989,1996;Saysel&Barlas2006).Structurevalidityisassuringthatmodelstructureisinagreementwiththerelationsexistinginthereallife.Behaviorvaliditytests,ontheotherhand,assessifthemodelandtherealsystemproducesimilaroutputbehaviorpatterns.ValidationtestsappliedinthisstudyarebasedonthemethodologygiveninBarlas(1996).Oneshouldkeepinmindthatincausal-descriptivemodeling,theessenceofvalidityisstructurevalidity:withoutavalidstructure,outputbehaviorvaliditycanbemeaningless,entirelycoincidental.Behaviorvalidityisusefulandmeaningful,onlyafterstructurevalidityhasbeenestablished.
4.32 Forthestructurevalidity,wemadeuseofrelationsfromliteraturethatareproventobeconsistentwiththerealsystem.Ourmodelmakesuseofmanykeyconceptsandstructuresthatareusedinthehousingeconomicsliterature:achainofstocksrepresentinghousesunderconstructionandnewhouses(Maisel1963);thedependenceofconstructionstartrateonthedifferencebetweensupplyanddemand(DiPasquale&Wheaton1994);gradualpriceadjustment(DiPasquale&Wheaton1994);twotypesofdemandcreation:duetogrowthandduetoturnover(Barras2005);demandamplificationwhenpriceishigh(Kenny1999);anddelaysinpriceformation,demandandprofitestimation,constructionstartsandcompletions(Barras2005).Wealsoincorporatestructurescommonlyusedinsystemdynamicsliteraturetomodelsimilarphenomena:usinginformationdelaystructurestomodeladaptiveexpectations(Sterman2000);'effect'formulationstoexpressnonlinearcausalrelations(Barlas2002);agingchainstorepresentconsecutivematerialdelayswhereflowsareconserved(Forrester1970).
4.33 Additionally,theunitsoftheleftandrighthandsidesofallequationsarecheckedandverifiedthattheyareconsistent.Fortestingthelogicalvalidityofmodelbehavior,wecomparedthemodelbehaviorunderextremeconditionswiththelogicallyexpectedbehaviorinthesameconditions.Forexample,inoneofsuchextremeconditiontest,wesettheinitialvalueofthepotentialbuyersstockandnetincreaseinnumberofhouseholdstozeroandshowedthatthehousesunderconstructionarecompletedbutnonewhousesareconstructed(Figure9(a))andthepriceisonlyaffectedfromchangesinthecostasgiveninFigure9(b).Inanothertest,wesetcosttoaconstantvalue,asgiveninFigure10.Underthiscondition,theoscillatorybehaviorofpricestillexistswhichshowsthattheoscillatorybehaviorofpriceisaresultofthemodel'sinternalstructureitself,notaresultoftheexternalinputs.Thisresultisparticularlyimportant,asitshowsthatthebehaviorvalidityofthemodelisobtainednotbyfine-tunedexternalinputs,butbytheinternalstructureofthemodel('rightbehaviorfortherightreasons'principle).
http://jasss.soc.surrey.ac.uk/17/1/19.html 10 16/10/2015

(a)Behaviourofhousingvariableswhenthereisnodemand
(b)BehaviourofcostandpricewhenthereisnodemandFigure9.Resultsoftheextremeconditionvalidationruns.
Figure10.Behaviorofpricewhencostisconstant.
4.34 Toensurethebehaviorvalidityofthemodel,themodeloutputsshouldbeconsistentwiththerealdata.Itisknownthattherealestatepricestypicallyshowoscillatorybehaviorsinreallife(Figure1andFershtman&Fishman1992;Meen2000;Jiangetal.2010;Genta1989;Sæther2008).AsFigure8(a)shows,thebehaviorofthepricevariablegeneratedbythemodelalsooscillatessimilarly.AnInternationalMonetaryFundstudy(Helbling&Terrones2003)analyzedhousingpricecyclesin14developedeconomiesoverthe1970to2001period.Over75cyclesidentified,thecycleperiodisintherangeof0.5–10.5yearswithanaverageofaround4years.SuchrichdataforIstanbulrealestatemarketisnotavailable.ButasgiveninFigure1,theratioofrealestaterentindextotheoverallpriceindexinIstanbulisavailable,whichcanbeusedforvalidationpurposes.Thisdataseriesshowsoscillationsof6–8years.ThemodeloutputforpricegiveninFigure8(a)shows7-yearpricecycles,whichiswithintherangeofIMFdataandconsistentwithcycleperiodsofIstanbulrealestateindex.
ScenarioandPolicyAnalysis
http://jasss.soc.surrey.ac.uk/17/1/19.html 11 16/10/2015
5.1 Inordertopreventtheundesiredoscillatorybehaviors,weneedtoidentifytheleveragepointsthatcanbeusedtocreatechangesinthesystem.Thismodelprovidesausefulplatformfordeterminationofsuchparameters.Özbaşetal.(2008)performsasensitivityanalysisofanearlierversionofthemodelpresentedinthispaper.Thestudyshowsthattheamplitudeofthepricecyclesissignificantlyaffectedbyconstructiontime.Asconstructiontimefalls,theamplitudeofthepricecyclesalsofalls.Inviewofthisfact,weconductascenarioanalysisthatevaluatesthechangesinthemodelwhentheconstructiontimeisdecreased.
5.2 Finallywealsoanalyzetheeffectsofapolicythatcanbeappliedbytheproblemowner,whichmaybeatradechamber,anassociationoraconsortiumofrealestateconstructioncompanies.Thepoliciesareevaluatedintermsoftheireffectsonthepriceoscillations.
DecreasingConstructionTime
5.3 Ourbasemodelassumesthattheaverageconstructioncompletiontimeisabout550days.Variousfactorsincludinglaborandmaterialshortages,financialdifficulties,poorprojectmanagement,inadequatedesignandtechnologicallimitationscauselongdelaysinconstructionprojects.Withthepressureofincreasingcompetitionandwiththehelpoftechnologicalandmanagerialstrategies,thedelaysinconstructionprojectscanbesignificantlyreduced.Thetechnologicalstrategiesmayincludestandardizationandrepetitionofbuildingelements,increasingphysicalcapabilitiesofmachinery,adoptingmoreefficientconstructionscheduling,orincreaseduseofprecastcomponents.Themanagerialstrategiesmayinvolveeffectivesitemanagement,providingdecisionaids,bettercommunicationandcoordination(Chan&Kumaraswamy2002).
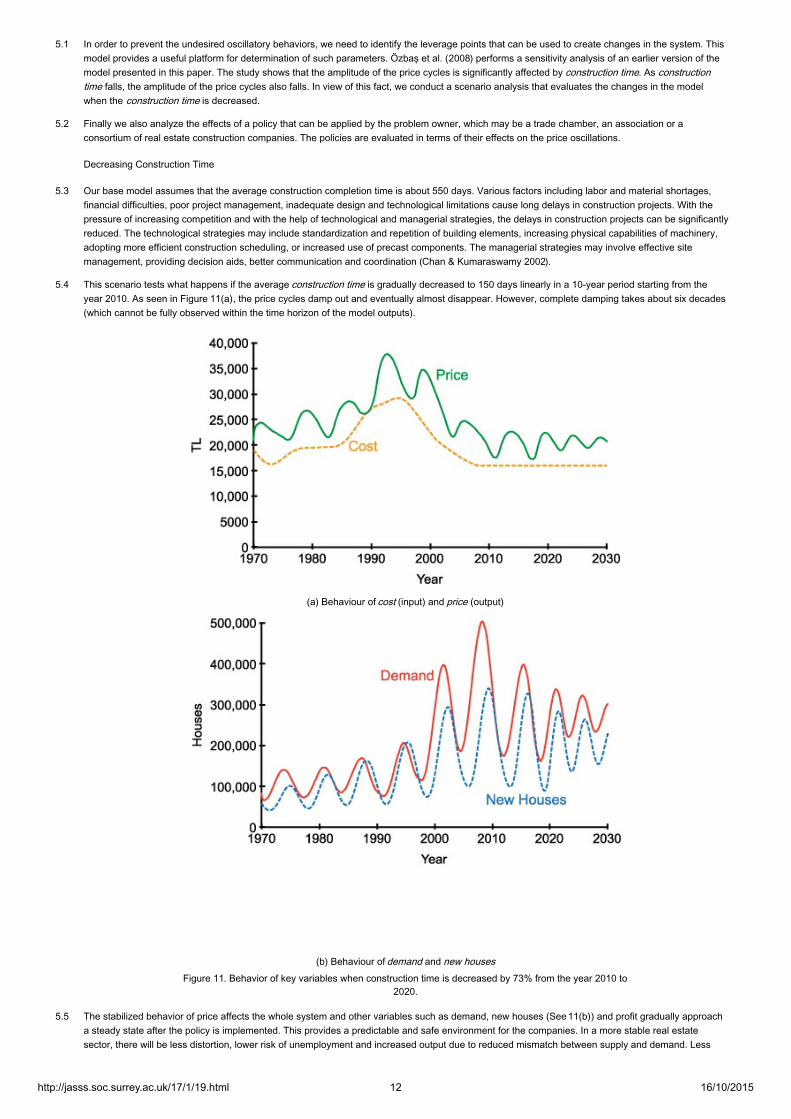
5.4 Thisscenariotestswhathappensiftheaverageconstructiontimeisgraduallydecreasedto150dayslinearlyina10-yearperiodstartingfromtheyear2010.AsseeninFigure11(a),thepricecyclesdampoutandeventuallyalmostdisappear.However,completedampingtakesaboutsixdecades(whichcannotbefullyobservedwithinthetimehorizonofthemodeloutputs).
(a)Behaviourofcost(input)andprice(output)
(b)BehaviourofdemandandnewhousesFigure11.Behaviorofkeyvariableswhenconstructiontimeisdecreasedby73%fromtheyear2010to
2020.
5.5 Thestabilizedbehaviorofpriceaffectsthewholesystemandothervariablessuchasdemand,newhouses(See11(b))andprofitgraduallyapproachasteadystateafterthepolicyisimplemented.Thisprovidesapredictableandsafeenvironmentforthecompanies.Inamorestablerealestatesector,therewillbelessdistortion,lowerriskofunemploymentandincreasedoutputduetoreducedmismatchbetweensupplyanddemand.Less
http://jasss.soc.surrey.ac.uk/17/1/19.html 12 16/10/2015

volatilesectorcreatesamuchpredictablefinancialenvironment,whichresultsinlowercreditriskassessment.
CompaniesTakeintoAccountHousesunderConstruction
5.6 Normallycompaniesdonothaveenoughinformationaboutothercompanies'housesunderconstruction.Inthispolicy,weassumethatacentralassociationofcompaniesgathersdataonthenumberofhousesunderconstruction,providesthecompanieswiththisinformationandpromotestheapplicationofthepolicyatleastbythemajorityofthecompanies.Previously,excessdemandwascomputedwithouttakinghousesunderconstructionintoaccountasgiveninEquation4.Inthenewpolicy,thecompaniesusetheinformationabouthousesunderconstructioninestimatingexcessdemandasshowninEquation6.
ExcessDemand=Potentialbuyers−NewHouses−Housesunderconstruction (6)
Thisway,theunnecessaryhouseconstructionisavoided,whichwasthemaincauseofthepriceoscillations.Figure12(a)showsbehaviorofpricewhenthispolicyisappliedaftertheyear2010.Thispolicymakesthepricecyclesdisappearalmostimmediately,buttheequilibriumpricelevelofthispolicyishigherthanthatofthepreviousscenario.
(a)Behaviourofcost(input)andprice(output)
(b)BehaviourofprofitFigure12.Behaviorofkeyvariableswhencompaniesstartconsideringhousesunderconstructionintheirdecisionsaftertheyear
2010.
5.7 Likeprice,profitoscillatesuntilnewpolicyisadoptedintheyear2010.Afterthenewpolicy,profitcomestoasteadybehavior(seeFigure12(b)).Whenwecomparetheaverageyearlyprofitsofpre-policyandpost-policyperiods,a13%increaseisobserved.Thatis,consideringhousesunderconstructioninconstructiondecisionsmakesthemarketstableandalsoincreasestheprofits.Inastabilizedmarketthecompanieswillalsoenjoythepreviouslymentionedbenefits.Finallynotethatinrealityperfectinformationabouthousesunderconstructionwouldnotbeavailabletothedecisionmakers.Amorerealisticversionofthisidealscenariocanbeeasilyimplementedinourmodel,byincorporatingandestimationdelayandestimationerrorinhousesunderconstructioninthedecisionequation.Inthiscase,theoscillatorybehaviorswouldagainbestabilized,butnottotheextremeextentobtainedintheidealizedpolicy(SeeFigure13).
http://jasss.soc.surrey.ac.uk/17/1/19.html 13 16/10/2015

Figure13.Behaviorofcostandpricewhencompaniesstartconsideringhousesunderconstructionwithaone-yeardelayand10%erroraftertheyear2010.
5.8 Realisticcombinationoftheabovetwopolicies;Amildreductionoftheconstructiondelaysandanimperfect/delayedaccesstothe"numberofhousesunderconstruction"informationwouldhavemorereal-liferelevance.Inthiscase,theoscillatorybehaviorofthebasemodelisagainstabilized(SeeFigure14).
Figure14.Behaviorofcostandpricewhenconstructiontimeisdecreasedby42%fromtheyear2010to2020,andcompaniesstartconsideringhousesunderconstructionwithaone-yeardelayand10%erroraftertheyear2010.
Conclusion
6.1 Thepurposeofthisstudyistomodelandanalyzebysimulationthedynamicsofendogenouslycreatedoscillationsinrealestate(housing)prices.Asystemdynamicssimulationmodelisbuilttounderstandsomeofthestructuralsourcesofcyclesinthekeyhousingmarketvariables,fromtheperspectiveofconstructioncompanies.Themodelfocusesontheeconomicbalancedynamicsbetweensupplyanddemand.Becauseoftheunavoidabledelaysintheperceptionoftherealestatemarketconditionsandconstructionofnewbuildings,pricesandrelatedmarketvariablesexhibitstrongoscillations.Twopoliciesaretestedtoreducetheoscillations:decreasingtheconstructiontime,andtakingintoaccountthehousesunderconstructioninstartingnewprojects.Bothpoliciescreatesignificantlyreducedoscillations,morestablebehaviors.
6.2 Realestatemarketsexhibitcyclicbehaviorsworldwide.Themainreasonbehindthesecyclesistheimbalancebetweenthedemandandthesupply,whichiscausedbythedelaysinvolvedinconstructiondecisionsandincompletingtheconstructions.Eventhoughconstructioncompaniesknowabouttheoscillatorybehaviorsofthemarket,theytrytotakeautonomousactionstoincreasetheirprofitsintheboomtimes.Additionallydecisionstakenduringboomandboosttimesalterthepricecycles.Inotherwords,priceoscillationsaretoalargeextentproducedbytheveryactionsthatthesecompaniestake.Themainparadoxisthatcompaniesdoknowaboutthecycles,buttheydonotchangetheirmainstrategiestoeliminatethem,becausetheybelievethatthesecyclesareexogenouslycreated,notasaresultoftheirveryownpolicies.Thisparadoxisdemonstratedbythemodelandisoneofthemainmotivationsbehindthestudy.Theresultingcomplexatmospherecreatesavolatileandunstableenvironmentforthecompanies.Inordertocreateamorestableenvironment,thecompaniesshouldactincoordination,sincenosinglecompanyhasenoughpowertocontrolthemarket.
6.3 Wedevelopasystemdynamicssimulationmodelofhousingmarkettounderstandthecausalmechanismsthatresultincyclicbehaviorofthemarket.Themodelisbuiltfromtheperspectiveofanassociationofconstructionofcompaniesinacity,whichhasenoughpowertoguidethehousingmarket.ThestructureofthemodelisgenericfordevelopingcitiesandtheparametersarechosenfromthecityofIstanbul.Threemajorbalancingfeedbackloopsdeterminethebehaviorofthemodel:demand-price,supply-priceandsupply-demandloops.Thesebalancingfeedbackloopsimplythatthereisanaturaltendencytowardsstabilizationofthesystem.However,significantdelaysintheseloopsresultinanoscillatorybehavioroftheprice.Thus,
http://jasss.soc.surrey.ac.uk/17/1/19.html 14 16/10/2015

weseethatdelaysarethecriticalcomponentsofthissystemthatcanbeusedasaleveragetoreduceundesiredoscillations.Basedonthisobservation,weproposealternativepoliciestoreducetheoscillationsbydecreasingdelaydurations.
6.4 Inonesimulationscenario,theconstructiondelaysarereducedbytechnologicalandmanagerialstrategies.Agradualdecreaseofconstructiontimesby73%in10yearseventuallycausespricecyclestodampenovertime.However,thecompleteeliminationofcyclestakesplaceina60-yearperiod,beyondthetimehorizonofthebasesimulations.Sincethefulltransitiontakesalongtime,theadaptationoftheconstructioncompaniestothechangingenvironmentshouldnotbedifficult.Ontheotherhand,thesystemmustbepatientenoughtoenjoythefullbenefitsofthispolicy,and60yearsmaybetoolongtoberealisticinthissense.
6.5 Inanalternativepolicy,weassumethattheconstructioncompanieshaveaccesstothe"numberofhousesunderconstruction"informationwhentheystartnewprojects.Thisinformationcanpreventcompaniesbuildingmorehousesthannecessary,whichwasyieldingexcesssupplyandoscillationsinthebasescenario.Withthenewpolicy,thepriceoscillationsareeliminatedinamuchshorterperiodoftimecomparedtothefirstpolicy.Suchaquickchangeinthemarketbehaviormaybehardtoadopt,butitresultsina13%increaseintheyearlyprofitswhenthepolicyshowsitsfulleffect.Realisticcombinationoftheabovetwopolicies;Amildreductionoftheconstructiondelaysandanimperfect/delayedaccesstothe"numberofhousesunderconstruction"informationwouldhavemorereal-liferelevance.Inthiscase,theoscillatorybehaviorofthebasemodelismoderatelystabilized.
6.6 Sincethemodelrepresentsthemaincausalrelationshipsthatarerelevanttothehousingmarketcycles,itcanalsoserveasabasisforforeseeingthereactionofthemarkettootherchangesinthesystem.Withthehelpofthismodel,itwillbepossibletoanalyzehowsensitivetheoscillationsaretochangesinsomeparameterssuchassalestime,constructiontimeandprofitmargin.Variousotherpolicyalternativescanbetestedbyminormodificationsinthemodel.Itisalsopossibletomodifyandadaptthemodeltodifferentspecificcitiesandregionsaroundtheworld.
Appendix:ModelEquations
ConstructionRealizationTime=0.4yearsConstructionStartRate[houses/yr]=EstimatedExcessDemand×EffectofProfitonConstructionStartRate/ConstructionRealizationTimeHousesunderConstruction(t)[houses]=HousesunderConstruction(t−dt)+(ConstructionStartRate−ConstructionRate)×dtHousesunderConstruction(1970)=40000housesConstructionTime=1.5yearsPotentialConstructionRate[houses/yr]=(HousesunderConstruction/ConstructionTime)ConstructionCapacity[houses/yr]=GRAPH(t)
Figure15.ConstructionCapacity
EffectofCapacityonConstructionRate[Unitless]=GRAPH(ConstructionCapacity/PotentialConstructionRate)
http://jasss.soc.surrey.ac.uk/17/1/19.html 15 16/10/2015

Figure16.EffectofCapacityonConstructionRate
ConstructionRate[houses/yr]=PotentialConstructionRate×EffectofCapacityonConstructionRateNewHouses(t)[houses]=NewHouses(t−dt)+(ConstructionRate−SalesRate)×dtNewHouses(1970)=60000housesSalesRate[houses/yr]=MIN(Possiblesales,DesiredSales)SoldHouses(t)[houses]=SoldHouses(t−dt)+(SalesRate−DemolitionRate)×dtSoldHouses(1970)=600000housesHouseLife=40yearsDemolitionRate[houses/yr]=SoldHouses/HouseLifeNetIncreaseinNumberofHouseholds[households/yr]=GRAPH(t)
Figure17.NetIncreaseinNumberofHouseholds
PotentialBuyers(t)[households]=PotentialBuyers(t−dt)+(NetIncreaseinNumberofHouseholds+DemandCreationDuetoDemolition−DemandSatisfactionRate)×dtPotentialBuyers(1970)=60000householdsDwellers(t)[households]=Dwellers(t−dt)+(DemandSatisfactionRate−DemandCreationDuetoDemolition)×dtDwellers(1970)=600000householdsDemandSatisfactionRate[households/yr]=SalesRate/DemandperHouseholdDemandCreationDuetoDemolition[households/yr]=DemolitionRateRate/DemandperHouseholdDemand[houses]=Potentialbuyers×DemandperHousehold×EffectofPriceonDemandDemandperHousehold=1house/householdCost[TL]=GRAPH(t)
http://jasss.soc.surrey.ac.uk/17/1/19.html 16 16/10/2015

Figure18.Cost
PerceivedCost(t)[TL]=PerceivedCost(t−dt)+(PerceivedCostAdjustmentRate)×dtPerceivedCost(1970)=19100TLPerceivedCostAdjustmentTime=0.5yearsPerceivedCostAdjustmentRate[TL/yr]=(Cost−PerceivedCost)/PerceivedCostAdjustmentTimeAcceptedProfitMargin=0.1Indicatedprice[TL]=PerceivedCost×(1+AcceptedProfitMargin)Price[TL]=IndicatedPrice×EffectofSupply/DemandonPriceHistoricalPrice(t)[TL]=HistoricalPrice(t−dt)+(HistoricalPriceAdjustmentRate)×dtHistoricalPrice(1970)=25000TLHistoricalPriceAdjustmentRate[TL/year]=(Price−HistoricalPrice)/HistoricalPriceAdjustmentTimeHistoricalPriceAdjustmentTime=5yearsSupply/DemandRatio[Unitless]=Newhouses/DemandPerceivedSupply/DemandRatio(t)[unitless]=PerceivedSupply/DemandRatio(t−dt)+(PerceivedSupply/DemandRatioAdjustmentRate)×dtPerceivedSupply/DemandRatioAdjustmentRate[Unitless]=(Supply/DemandRatio−PerceivedSupply/DemandRatio)/PerceivedSupply/DemandRatioAdjustmentTimePerceivedSupply/DemandRatioAdjustmentTime=0.2yearsEffectofSupply/DemandonPrice[Unitless]=GRAPH(PerceivedSupply/DemandRatio)
Figure19.EffectofSupply/DemandonPrice
EffectofPriceonDemand[Unitless]=GRAPH(Price/HistoricalPrice)
Figure20.EffectofPriceonDemand
http://jasss.soc.surrey.ac.uk/17/1/19.html 17 16/10/2015

EffectofSupply/DemandonSalesTime[Unitless]=GRAPH(1/PerceivedSupplyDemandRatio )
Figure21.EffectofSupply/DemandonSalesTime
NormalSalesTime=1yearSalesTime[years]=NormalSalesTime×EffectofSupply/DemandonSalesTimePossiblesales[houses/yr]=Newhouses/SalesTimeDesiredSales[houses/yr]=Demand/SalesTimeProfit[TL]=Price−CostExpectedProfit(t)[TL]=ExpectedProfit(t−dt)+(ExpectedProfitAdjustmentRate)×dtExpectedProfit(1970)=4000TLExpectedProfitAdjustmentTime=5yearsExpectedProfitAdjustmentRate[TL/yr]=(Profit−ExpectedProfit)/ExpectedProfitAdjustmentTimeProfitMargin=0.25NormalProfit[TL]=Cost×ProfitMarginEffectofProfitonConstructionStartRate[Unitless]=GRAPH(ExpectedProfit/NormalProfit)
Figure22.EffectofProfitonConstructionStartRate
ExcessDemand[houses]=PotentialBuyers−NewhousesEstimatedExcessDemand(t)[houses]=EstimatedExcessDemand(t−dt)+(ExcessDemandAdjustmentFlow)×dtEstimatedExcessDemand(1970)=10000housesExcessDemandEstimationTime=1yearExcessDemandAdjustmentFlow[houses/yr]=(ExcessDemand−EstimatedExcessDemand)/ExcessDemandEstimationTime
References
http://jasss.soc.surrey.ac.uk/17/1/19.html 18 16/10/2015

ANAS,A.(1978).Dynamicsofurbanresidentialgrowth.JournalofUrbanEconomics,5(1),66–87.[doi:10.1016/0094-1190(78)90037-2]
ANAS,A.,&Arnott,R.J.(1993).DevelopmentandtestingoftheChicagoprototypehousingmarketmodel.JournalofHousingResearch,4(1),73–130.
AOKI,K.,Proudman,J.,&Vlieghe,G.(2004).Houseprices,consumption,andmonetarypolicy:afinancialacceleratorapproach.JournalofFinancialIntermediation,13(4),414–435.[doi:10.1016/j.jfi.2004.06.003]
BARLAS,Y.(1989).Multipletestsforvalidationofsystemdynamicstypeofsimulationmodels.EuropeanJournalofOperationalResearch,42(1),59–87.[doi:10.1016/0377-2217(89)90059-3]
BARLAS,Y.(1996).Formalaspectsofmodelvalidityandvalidationinsystemdynamics.SystemDynamicsReview,12(3),183–210.[doi:10.1002/(SICI)1099-1727(199623)12:3<183::AID-SDR103>3.0.CO;2-4]
BARLAS,Y.(2002).Systemdynamics:systemicfeedbackmodelingforpolicyanalysis.InKnowledgeforSustainableDevelopment-AnInsightintotheEncyclopediaofLifeSupportSystems,(pp.1131–1175),Paris,Oxford:UNESCO-EOLSS.
BARRAS,R.(2005).Abuildingcyclemodelforanimperfectworld.JournalofPropertyResearch,22(2–3),63–96.[doi:10.1080/09599910500453905]
BINAY,S.,&Salman,F.(2008).AcritiqueonTurkishrealestatemarket.DiscussionPaper2008/8.Ankara:TurkishEconomicsAssociation.
CHAN,D.W.M.,&Kumaraswamy,M.M.(2002).Compressingconstructiondurations:lessonslearnedfromHongKongbuildingprojects.InternationalJournalofProjectManagement,20(1),23–35.[doi:10.1016/S0263-7863(00)00032-6]
COSKUN,Y.(2011).HousingmarketinTurkey:anoverview.InJ.Gimber(Ed.)EuropeanMortgageFederation:MortgageInfo.October2011.
DELOITTE.(2010).Türkiyegayrimenkulsektörüraporu.TechnicalReport.RepublicofTurkeyPrimeMinistryInvestmentSupportandPromotionAgency.
DIPASQUALE,D.,&Wheaton,W.C.(1994).Housingmarketdynamicsandthefutureofhousingprices.JournalofUrbanEconomics,35(1),1–27.[doi:10.1006/juec.1994.1001]
ESKINAZI,M.,Rouwette,E.,&Vennix,J.(2011).Houdini:asystemdynamicsmodelforhousingmarketreforms.Proceedingsofthe29thInternationalConferenceoftheSystemDynamicsSociety,Washington,DC,USA.
FAIR,R.C.(1972).Disequilibriuminhousingmodels.TheJournalofFinance,27(2),207–221.[doi:10.1111/j.1540-6261.1972.tb00955.x]
FERSHTMAN,C.,&Fishman,A.(1992).Pricecyclesandbooms:dynamicsearchequilibrium.TheAmericanEconomicReview,1221–1233.
FILATOVA,T.,Parker,D.,&vanderVeen,A.(2009).Agent-BasedUrbanLandMarkets:Agent'sPricingBehavior,LandPricesandUrbanLandUseChange.JournalofArtificialSocietiesandSocialSimulation,12(1).
FORRESTER,J.W.(1961).IndustrialDynamics.Cambridge,MA:M.I.T.Press.
FORRESTER,J.W.(1970).Systemsanalysisasatoolforurbanplanning.IEEETransactionsonSystemsScienceandCybernetics,6(4),258-265.[doi:10.1109/TSSC.1970.300299]
GALLIN,J.(2008).TheLong-RunRelationshipbetweenHousePricesandRents.RealEstateEconomics,36(4),635–658.[doi:10.1111/j.1540-6229.2008.00225.x]
GENTA,P.J.(1989).UnderstandingtheBostonrealestatemarket:asystemdynamicsapproach.UnpublishedDiplomathesis:MassachusettsInstituteofTechnology.
HARGREAVES,B.(2008).Whatdorentstellusabouthouseprices?InternationalJournalofHousingMarketsandAnalysis,1(1),7–18.[doi:10.1108/17538270810861120]
HAURIN,D.(1988).ThedurationofMarketingTimeofResidentialHousing,AREUEAJournal,16(5),396–410.[doi:10.1111/1540-6229.00463]
HELBLING,T.,&Terrones,M.(2003).IdentifyingAssetPriceBoomsandBusts.WorldEconomicOutlook,April2003.InternationalMonetaryFund.
HIANG,L.K.,&Webb,J.R.(2007).Areinternationalrealestatemarketsintegrated:evidencefromchaoticdynamics.TechnicalReport,October2007.Hartford:RealEstateResearchInstitute.
HO,Y.F.,Wang,H.L.,&Liu,C.C.(2010).DynamicsModelofHousingMarketSurveillanceSystemforTaichungCity.Proceedingsofthe28thInternationalConferenceoftheSystemDynamicsSociety,Seoul,Korea.
HONG-MINH,S.,&Strohhecker,J.(2002).AsystemdynamicsmodelfortheUKprivatehousebuildingsupplychain.Proceedingsofthe20thInternationalConferenceoftheSystemDynamicsSociety,Palermo,Italy.
ISEEsystems.(2009).STELLA.Version9.1.
JIANG,Y.,Feng,L.,Dan,M.,&Tan,X.-q.(2010).HousingmarketcycleinChina:Anempiricalstudybasedonstock-flowmodel.Proceedingsofthe2010InternationalConferenceonManagementScience&Engineering,Melbourne,Australia.
KENNY,G.(1999).Modellingthedemandandsupplysidesofthehousingmarket:evidencefromIreland.EconomicModelling,16(3),389–409.[doi:10.1016/S0264-9993(99)00007-3]
KESKIN,B.(2008).HedonicanalysisofpriceintheIstanbulhousingmarket.InternationalJournalofStrategicPropertyManagement,12(2),125–138.[doi:10.3846/1648-715X.2008.12.125-138]
MU,L.,Ma,J.,&Chen,L.(2009).A3-dimensionaldiscretemodelofhousingpriceanditsinherentcomplexityanalysis.JournalofSystemsScienceandComplexity,22(3),415–421.[doi:10.1007/s11424-009-9174-6]
KUMMEROW,M.(1999).Asystemdynamicsmodelofcyclicalofficeoversupply.JournalofRealEstateResearch,18(1),233–256.
http://jasss.soc.surrey.ac.uk/17/1/19.html 19 16/10/2015

MAISEL,S.J.(1963).Atheoryoffluctuationsinresidentialconstructionstarts.TheAmericanEconomicReview,53(3),359–383.
MEEN,G.(2000).Housingcyclesandefficiency.ScottishJournalofPoliticalEconomy,47(2),114–140.[doi:10.1111/1467-9485.00156]
MURPHY,A.(2010).Adynamicmodelofhousingsupply.WorkingPaper.
ÖZBAŞ,B.,Özgün,O.,&Barlas,Y.(2008).SensitivityAnalysisofaRealEstatePriceOscillationsModel.Proceedingsofthe26thInternationalConferenceoftheSystemDynamicsSociety,Athens,Greece.
POTERBA,J.M.(1984).Taxsubsidiestoowner-occupiedhousing:anasset-marketapproach.TheQuarterlyJournalofEconomics,99(4),729.[doi:10.2307/1883123]
SAYSEL,A.K.,Barlas,Y.(2006)ModelSimplificationandValidationwithIndirectStructureValidityTests,SystemDynamicsReview,22(3),241–262.[doi:10.1002/sdr.345]
SÆTHER,J.P.(2008).FluctuationsinHousingMarkets,CausesandConsequences.UnpublishedDiplomathesis:UniversityofBergen.
SELIM,H.(2009).DeterminantsofhousepricesinTurkey:Hedonicregressionversusartificialneuralnetwork.ExpertSystemswithApplications,36(2),2843–2852.[doi:10.1016/j.eswa.2008.01.044]
SMITH,L.B.(1969).AmodeloftheCanadianhousingandmortgagemarkets.TheJournalofPoliticalEconomy,77(5),795–816.[doi:10.1086/259563]
STERMAN,J.(2000).Businessdynamics:SystemsThinkingandModelingforaComplexWorld.Irwin-McGraw-Hill.
TU,Y.(2004).ThedynamicsoftheSingaporeprivatehousingmarket.UrbanStudies,41(3),605.[doi:10.1080/0042098042000178708]
WEIBULL,J.W.(1983).Adynamicmodeloftradefrictionsanddisequilibriuminthehousingmarket.TheScandinavianJournalofEconomics,373–392.[doi:10.2307/3439598]
WHEATON,W.C.(1999).Realestate"cycles":somefundamentals.RealEstateEconomics,27(2),209–230.[doi:10.1111/1540-6229.00772]
WYATT,P.(2007).Realestatedevelopment.WorkingPaper.UniversityofReading,HenleyBusinessSchool,SchoolofRealEstateandPlanning.
http://jasss.soc.surrey.ac.uk/17/1/19.html 20 16/10/2015