Embed Size (px)
Citation preview
Modeling and Control of Batch Pulsed
Top-spray Fluidized bed Granulation
PhD Thesis
Huolong Liu
This thesis is submitted in partial fulfillment of the requirements
of De Montfort University for the award of Doctor of Philosophy
June 2014
Faculty of Health and Life Sciences
De Montfort University
Leicester
I dedicate this thesis to my
grandmother
Mrs Xiuzhen Wei
Contents
I
Contents
Contents ...................................................................................................................................... I
Declaration ............................................................................................................................... VI
Abstract ................................................................................................................................... VII
Publications ............................................................................................................................ VIII
Acknowledgements .................................................................................................................... X
List of figures ........................................................................................................................... XI
List of tables.......................................................................................................................... XIV
Abbreviations and symbols ..................................................................................................... XV
Chapter 1 Introduction ............................................................................................................... 1
1.1 Fluidized bed spray granulation ........................................................................................... 1
1.2 Research aim and objectives ................................................................................................ 4
1.3 Novelty of research .............................................................................................................. 5
1.4 Thesis structure .................................................................................................................... 6
Chapter 2 Literature review ....................................................................................................... 8
2.1 Chapter overview ................................................................................................................. 8
2.2 Granulation mechanism ....................................................................................................... 8
2.2.1 Nucleation ......................................................................................................................... 9
2.2.2 Growth and consolidation ............................................................................................... 10
2.2.3 Attrition and breakage ..................................................................................................... 12
2.3 Experimental study ............................................................................................................ 13
2.3.1 Effect of process-related variables .................................................................................. 14
2.3.1.1 Variables related to fluidization ................................................................................... 14
2.3.1.2 Variables related to binder spraying ............................................................................. 15
2.3.2 Effect of binder and material properties ......................................................................... 17
2.3.2.1 Effect of powder properties.......................................................................................... 18
2.3.2.2 Effect of binder properties ........................................................................................... 18
2.4 Population balance modeling ............................................................................................. 19
2.4.1 Population balance equation ........................................................................................... 19

Contents
II
2.4.2 Nucleation kernel ............................................................................................................ 20
2.4.3 Growth kernel ................................................................................................................. 21
2.4.4 Aggregation kernel .......................................................................................................... 21
2.4.5 Breakage kernel .............................................................................................................. 23
2.4.5.1 Breakage selection rate ................................................................................................ 23
2.4.5.2 Fragments size distribution function ............................................................................ 24
2.4.6 Numerical Solutions of population balance model ......................................................... 25
2.4.6.1 Discrete method ........................................................................................................... 25
2.4.6.2 Method of moment ....................................................................................................... 27
2.4.6.3 Monte Carlo method .................................................................................................... 29
2.5 Combination of computational fluid dynamic (CFD) and PBM for study of fluidized bed
granulation ............................................................................................................................... 31
2.5.1 Hydrodynamics study ..................................................................................................... 31
2.5.2 Eulerian-Eulerian multi-phase flow model (EEMFM) ................................................... 32
2.5.2.1 Governing equations .................................................................................................... 32
2.5.2.2 Kinetic theory of granular flow (KTGF)...................................................................... 35
2.5.2.3 Constitutive equations .................................................................................................. 37
2.5.2.4 Gas-solid interaction .................................................................................................... 40
2.5.2.5 Turbulence model ........................................................................................................ 41
2.5.3 Coupled CFD-PBM model ............................................................................................. 44
2.5.4 Multi-compartmental PBM model .................................................................................. 45
2.6 Control of fluidized bed granulation .................................................................................. 46
2.6.1 Model based control ........................................................................................................ 47
2.6.2 Un-model based control .................................................................................................. 48
2.7 Quality by design (QbD) application to study fluidized bed granulation .......................... 49
2.7.1 QbD implementation ....................................................................................................... 49
2.7.2 Role of model in Process understanding by QbD ........................................................... 51
2.7.3 Design of experiments (DoE) ......................................................................................... 52
2.8 Study of pulsed top-spray fluidized bed granulation ......................................................... 56
2.9 Chapter conclusions ........................................................................................................... 57

Contents
III
Chapter 3 Experimental study of pulsed spray fluidized bed granulation ............................... 58
3.1 Chapter overview ............................................................................................................... 58
3.2 Materials and methods ....................................................................................................... 58
3.2.1 Materials ......................................................................................................................... 58
3.2.2 Experimental equipment ................................................................................................. 59
3.2.3 Sampling and granule size measurement ........................................................................ 60
3.2.4 Granule physical property characterization .................................................................... 61
3.3 Experimental design .......................................................................................................... 62
3.3.1 JMP software .................................................................................................................. 62
3.3.2 Box-Behnken experimental design ................................................................................. 63
3.3.3 Validation experiments design ........................................................................................ 64
3.3.4 Pulsed top-spray fluidized bed Granulation .................................................................... 65
3.4 Results and discussion ....................................................................................................... 66
3.4.1 Overview of results ......................................................................................................... 66
3.4.2 Fitting data to model ....................................................................................................... 67
3.4.3 Response contour plots ................................................................................................... 71
3.4.4 Determination of a design space ..................................................................................... 80
3.4.5 Validation for process model........................................................................................... 82
3.4.6 Other granule physical properties ................................................................................... 83
3.5 Chapter conclusions ........................................................................................................... 85
Chapter 4 Population balance modeling and multi-stage optimal control of a pulsed spray
fluidized bed granulation ......................................................................................................... 86
4.1 Chapter overview ............................................................................................................... 86
4.2 Population balance model .................................................................................................. 86
4.2.1 Selection of aggregation model ...................................................................................... 87
4.2.2 Selection of breakage model ........................................................................................... 88
4.2.3 Determination of the parameters of aggregation and breakage models .......................... 89
4.3 PBM based multi-stage optimal strategy to determine the optimal operating conditions of
binder solution spray ................................................................................................................ 91
4.4 Experimental data processing ............................................................................................ 94

Contents
IV
4.5 Results and discussion ....................................................................................................... 95
4.5.1 Determination of PBMs for a pulsed top spray fluidized bed granulation ..................... 95
4.5.2 Multi-stage optimal control of a pulsed top spray fluidized bed granulation ............... 105
4.6 Chapter Conclusions ......................................................................................................... 111
Chapter 5 Three-dimensional computational fluid dynamics (CFD) study of the gas-solid
circulation pattern in a fluidized bed granulator ..................................................................... 113
5.1 Chapter overview .............................................................................................................. 113
5.2 CFD software packages .................................................................................................... 113
5.2.1 ANSYS ICEM CFD ....................................................................................................... 113
5.2.2 ANSYS Fluent ............................................................................................................... 115
5.3 CFD modeling strategy ..................................................................................................... 117
5.4 Design of CFD simulations .............................................................................................. 124
5.5 Results and discussion ..................................................................................................... 125
5.5.1 Convergence to quasi-steady state and verification of CFD model .............................. 125
5.5.2 Particle flow characteristics .......................................................................................... 128
5.5.3 Particle circulation time ................................................................................................ 138
5.6 Chapter conclusions ......................................................................................................... 140
Chapter 6 Two-compartmental population balance modeling and control of a pulsed spray
fluidized bed granulation based on computational fluid dynamics (CFD) analysis .............. 141
6.1 Chapter overview ............................................................................................................. 141
6.2 Two-compartmental population balance model (TCPBM) .............................................. 141
6.2.1 Two-compartmental modeling strategy......................................................................... 141
6.2.2 Continuous TCPBM ...................................................................................................... 144
6.2.3 Numerical solution of TCPBM ..................................................................................... 146
6.2.4 Selection of aggregation model and breakage model ................................................... 148
6.3 Results and discussion ..................................................................................................... 150
6.3.1 Determination of the TCPBM parameters based on the CFD simulation ..................... 150
6.3.2 Determination of TCPBM for a pulsed top spray fluidized bed granulation ................ 152
6.3.3 Multi-stage optimal control of a pulsed top spray fluidized bed granulation based on the
TCPBM .................................................................................................................................. 162
Contents
V
6.4 Chapter conclusions ......................................................................................................... 167
Chapter 7 Conclusions and future work ................................................................................. 169
7.1 Summary of the presented work ...................................................................................... 169
7.2 Conclusions ...................................................................................................................... 170
7.3 Limitations and future work ............................................................................................. 172
References .............................................................................................................................. 174
Appendixes ............................................................................................................................ 188
A1 Figures for chapter 3 ........................................................................................................ 188
A1.1 Figures of 15 experiments ............................................................................................. 188
A1.2 Figures of validation experiments ................................................................................. 195
A2 Figures for chapter 4 ........................................................................................................ 198
A2.1 Figures of 15 experiments ............................................................................................. 198
A2.2 Figures of validation experiments ................................................................................. 205
Declaration
VI
Declaration
I declare that the word described in this thesis is original work undertaken by myself for
the Doctor of Philosophy degree, at the Pharmacy School, Faculty of Healthy and Life
Sciences, De Montfort University, Leicester, United Kingdom.
No part of the material described in this thesis has been submitted for the award of any
other degree or qualification in this or any other university or college of advanced
education.
Huolong Liu

Abstract
VII
Abstract
In this thesis, a thorough study of the batch top-spray fluidized bed granulation was
carried out including experimental study, population balance model (PBM),
computational fluid dynamic (CFD) study and control strategy development.
For the experimental study, the influence variables of pulsed frequency, binder spray
rate and atomization pressure of a batch top-spray fluidized bed granulation process
were studied using the Box-Behnken experimental design method. Different
mathematical models were developed to predict the mean size of granules, yield,
relative width of granule distribution, Hausner ratio and final granule moisture content.
Validation experiments have shown the reliability and effectiveness of using the Box-
Behnken experimental design method to study a fluidized bed granulation process.
The one-dimensional population balance models (ODPBMs) have been developed to
model a pulsed top-spray fluidized bed granulation, linking the operating factors of the
pulsed frequency, the binder spray rate, and atomization air pressure with the granule
properties to predict granule growth behavior at different operating conditions. A multi-
stage open optimal control strategy based on the developed ODPBMs was proposed to
reduce the model and process mismatch through adjusting the trajectory of the evolution
of the granule size distribution at predefined sample intervals. The effectiveness of the
proposed modeling and multi-stage open optimal control strategy has been validated by
experimental and simulation tests.
In addition, an Eulerian-Eulerian two-fluid model (EETFM) was developed to describe
the gas-particle two-phase flow in the fluidized bed granulator. By computational fluid
dynamic analysis, it has been proven that the fluidized bed granulation system is not
homogeneous, based on which a two-compartmental population balance model
(TCPBM) was developed to describe the particle growth in the fluidized bed
granulation. Validation experiments have shown the effectiveness and superior accuracy
of the TCPBM comparing with the ODPBM in predicting the final particle size
distribution.

Publications
VIII
Publications
Journal publications
[1] Huolong Liu, Ke Wang, Walkiria Schlindwein, Mingzhong Li, Using the Box-
Behnken experimental design to optimize operating parameters in pulsed spray
fluidized bed granulation. International Journal of Pharmaceutics, 2013. 448(2): p. 329-
338.
[2] Huolong Liu, Mingzhong Li, Population balance modelling and multi-stage optimal
control of a pulsed spray fluidized bed granulation. International Journal of
Pharmaceutics, 2014. 468(1-2): p. 223-233.
[3] Huolong Liu, Mingzhong Li, Two-compartmental population balance modeling of a
pulsed spray fluidized bed granulation based on computational fluid dynamics (CFD)
analysis. International Journal of Pharmaceutics, 2014. 475(1–2): p. 256-269.
[4] Huolong, Liu, Mingzhong Li, Computational Fluid Dynamics (CFD) study of the
influence of particle size and inlet air velocity on the gas-solid flow pattern in a small-
scale fluidized bed granulator. Publication in preparation.
Conference publications
[1] Huolong Liu, Mingzhong Li, Box-Behnken design for the optimization of operation
variables of a small-scale top-spray fluidized bed granulation, Proceeding 6th
International Granulation Workshop, Sheffield, UK, 26th
-28th
June 2013.
[2] Huolong Liu, Mingzhong Li, Population balance modeling and control strategy
development for a lab-scale batch pulsed spray fluidized bed granulation, Proceeding

Publications
IX
2014 APS Pharmsci Conference, Hatfield, UK, 8th
-10th
2014.
[3] Huolong Liu, Modeling and control of batch pulsed top-spray fluidized bed
granulation based on one-dimensional population balance model. Proceeding 12th
UK
Particle Technology Forum, 16th
-17th
September, 2014, Manchester Conference Centre,
Manchester, UK.
Oral presentations
[1] Huolong Liu, Population balance modeling and multi-stage optimal control of a
pulsed spray fluidized bed granulation, Doctoral Training Programme presentation,
Hawthorn Building, De Montfort University, Leicester, UK, 22th May 2014.
[2] Huolong Liu, Modeling and control of batch pulsed top-spray fluidized bed
granulation based on one-dimensional population balance model, 12th UK Particle
Technology Forum 2014, Manchester Conference Centre, Manchester, 17th September,
2014.

Acknowledgements
X
Acknowledgements
I would like to express my sincere appreciation to my supervisors Dr Mingzhong Li, Dr
Walkiria Schlindwein and Dr. Michael Goodman for their invaluable advice and skillful
supervision throughout my PhD study. Your profound knowledge, creativeness,
encouragement and unfaltering patience provide me courage in completing my PhD
research. Your pursuit of truth and endless enthusiasm for research inspire me deeply.
I am very grateful to all technicians in the faculty of Health and Life Sciences who
provide me technical support and equipment support for my experiments.
I would also like to thank all my colleagues in Health and Life Science Faculty, for their
valuable suggestions and discussions, for their encouragement and support, and for the
productive working environment.
In addition, I would like to thank the Graduate School Office at De Montfort University for
the outstanding management.
Finally, I wish particularly to thank my beloved parents, my dearest brother for their
endless love, caring and encouragement throughout my entire life. I am also thankful to
my girlfriend for her patience, love, and understanding.

List of figures
XI
List of figures
Figure 1.1 Summary of wet granulation methods ......................................................................... 1
Figure 1.2 Batch mode top-spray fluidized bed granulator .......................................................... 3
Figure 1.3 Structure of multi-compartment population balance model (MCPBM) ...................... 5
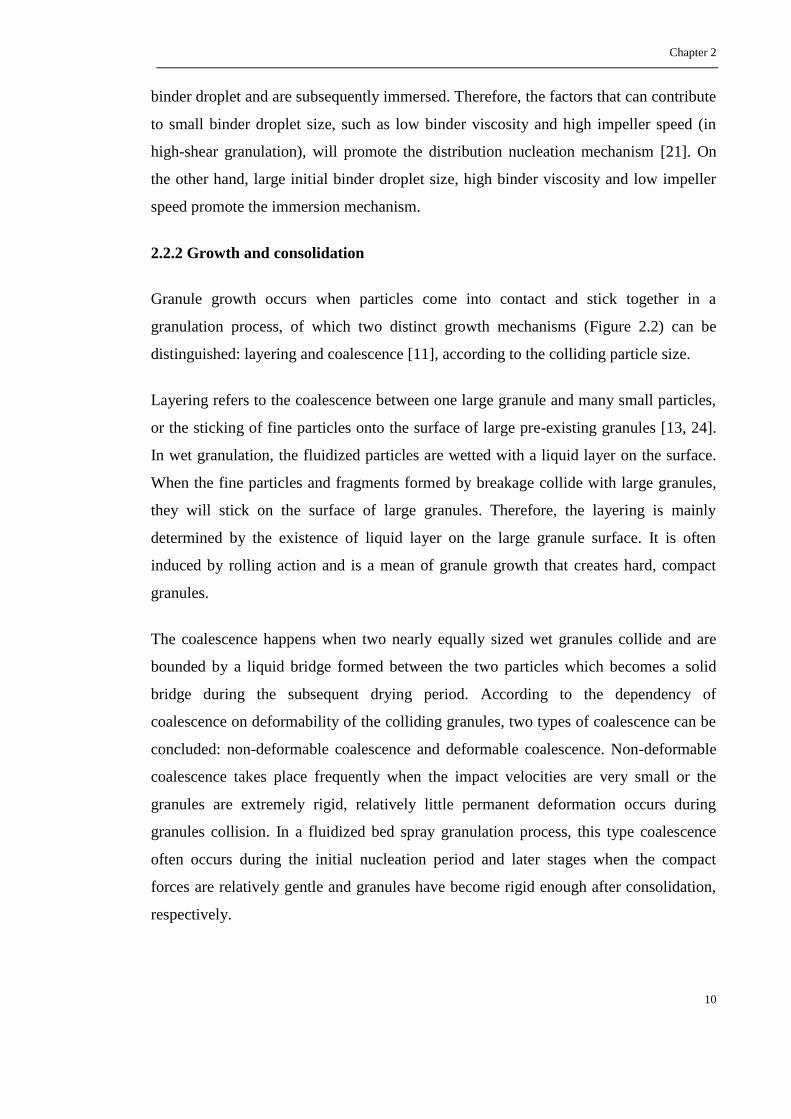
Figure 2.1 Nucleation mechanisms ............................................................................................... 9
Figure 2.2 Particle growth mechanisms ...................................................................................... 11
Figure 2.3 Regime map of quality by design (QbD) ................................................................... 49
Figure 2.4 Response surface methodology methods. (a) Circumscribed design (b) Inscribed
design (c) Faced design (d) Box-Behnken design ...................................................................... 54
Figure 3.1 Top-spray fluidized bed granulator setup .................................................................. 60
Figure 3.2 Response contour plots showing effect of pulsed frequency (X1) and binder spray rate
(X2) on mean size of final granules (Y1) (a) at low level of atomization pressure (X3); (b) at
medium level of atomization pressure (X3); (c) at high level of atomization pressure (X3) ........ 74
Figure 3.3 Effects of independent variables on the mean particle size Y1: (a) standard Pareto
chart showing the effects of independent variables and their combined effects on the mean size
of granules; (b) interaction plot showing the quadratic effects of interactions between factors on
the mean size of granules ............................................................................................................ 75
Figure 3.4 Contour plots showing effect of pulsed frequency (X1) and binder spray rate (X2) on
final granule yield (Y2): (a) at low level of atomization pressure; (b) at medium level of
atomization pressure; (c) at high level of atomization pressure ................................................. 77
Figure 3.5 Effects of independent variables on the granule yield Y2: (a) standard Pareto chart
showing the effects of independent variables and their combined effects on the granule yield; (b)
interaction plot showing the quadratic effects of interactions between factors on the granule
yield ............................................................................................................................................. 78
Figure 3.6 Contour plots showing effect of pulsed frequency (X1) and binder spray rate (X2) on
moisture content of granules (Y7): (a) at a low level of atomization pressure; (b) at a medium
level of atomization pressure; (c) at a high level of atomization pressure .................................. 80
Figure 3.7 Design space for the FDG process: (a) operating ranges of pulsed frequency and
binder spray rate at low level of atomization pressure; (b) operating ranges of pulsed frequency
and binder spray rate at medium level of atomization pressure; (c) operating ranges of pulsed
frequency and binder spray rate at high level of atomization pressure ...................................... 82
Figure 3.8 Hauser ratio as a function of granule size ................................................................ 84
Figure 3.9 Relationship between mean size of final granules and moisture content .................. 85
Figure 4.1 Schematic diagram of modeling approach to determine the optimal set of parameters
for PBM ....................................................................................................................................... 90
Figure 4.2 Multi-stage optimal control strategy ......................................................................... 94
Figure 4.3 Comparison of SSEs for different aggregation and breakage kernels ...................... 98
Figure 4.4 Comparison of experimental data with the predictions by the PBMs (red square:
experimental data; blue diamond: prediction value): (a) the kernel orders of p=3 and q=0; (b)
Kernel order of p=2; and q=0; (c) mean size. .......................................................................... 101
List of figures
XII
Figure 4.5 Validation of predictions of granule distribution by the PBMs with the kernel orders
of p =3 and q=0 and the kernel order of p=2and q=0 at the operating condition of x1=0.2; x2 =
0.333; x3 = -0.2: (a) at 30% binder sprayed; (b) at 70% binder sprayed; (c) at 100% binder
sprayed; (d) evolution of prediction errors. .............................................................................. 103
Figure 4.6 Validation of predictions of granule distribution by the PBMs with the kernel orders
of p=3 and q=0 and the kernel order of p=2 and q=0 at the operating condition of x1=0.6; x2 =
0; x3 = 0.4: (a) at 30% binder sprayed; (b) at 70% binder sprayed; (c) at 100% binder sprayed;
(d) evolution of prediction errors. ............................................................................................. 105
Figure 4.7 Comparison of evolution of the granule mean sizes of granulation process and
process model at random operating conditions: (a) x1=0, x2=0, x3=0; (b) x1=-1, x2=0.5,
x3=0.8; (c) x1=1, x2=1, x3=0.2. .............................................................................................. 108
Figure 4.8 Actual mean size evolution and size trajectory using different stages of optimization
and optimal operating conditions: (a) one-stage optimization results; (b) two-stages
optimization results; (c) three-stages optimization results......................................................... 111
Figure 5.1 The geometry and mesh strategy of the fluidized bed granulator: (a) the fluidized bed
granulator overview; (b) the X-Y cross-sectional plane; (c) the inlet (blue) and outlet (red)
cross-sectional plane. ................................................................................................................. 115
Figure 5.2 The geometry and boundary conditions used in the simulations ............................ 121
Figure 5.3 Mesh sensitivity study results; (a) solid volume fraction on cross-sectional plane XY;
(b) solid volume fraction on cross-sectional plane YZ; (c) pressure drop with time; (d) bed
height with time. ........................................................................................................................ 123
Figure 5.4 Convergence to quasi-steady state and validation studies for CFD simulation: (a)
bed pressure drop; (b) Bed height; (c) distribution of solid volume fraction on the cross section
of the XY plane .......................................................................................................................... 127
Figure 5.5 The time-averaged upward and downward solid velocity along the bed height ..... 129
Figure 5.6 Time-averaged static pressure contour of mixture on vertical plane XY ................. 130
Figure 5.7 The particle Y velocity vector on horizontal cross-section plane at different bed
heights ....................................................................................................................................... 132
Figure 5.8 Time-averaged solid volume fraction at cross-sectional plane on different bed heights
.................................................................................................................................................. 133
Figure 5.9 Particle volume flow rate through plane: (a) h=0.0344m; (b) h=0.0688m; (c)
h=0.1032m. ............................................................................................................................... 136
Figure 5.10 Time-averaged particle volume fraction for all the simulations at the plane XY. . 137
Figure 5.11 Particle circulation time with inlet air velocity under different particle size ........ 140
Figure 6.1 Schematic diagram of the TCPBM of a top spray fluidized bed granulation. ........ 145
Figure 6.2 CFD simulation results: (a) time-averaged distribution of particle volume fractions
at plane XY across the center of the bed; (b) time-averaged particle flow pattern at plane XY
across the center of the bed; (c) time-averaged distribution of particle volume fractions on the
cross section between wetting and drying compartments; (d) time-average particle flow pattern
on the cross section between wetting and drying compartments. ............................................. 151
Figure 6.3 Comparison of experimental data with the predictions by the TCPBMs (red square:
experimental data; blue diamond: predicted value) ................................................................. 155
Figure 6.4 Comparison of the TCPBM and single PBM: (a) mean size; (b) comparison of the
List of figures
XIII
sum square of error for each experiment .................................................................................. 157
Figure 6.5 Validation of predictions of granule distribution by the TCPBM at the operating
condition of x1=0.2; x2 = 0.333; x3 = -0.2: (a) at 30% binder sprayed; (b) at 70% binder
sprayed; (c) at 100% binder sprayed. ....................................................................................... 159
Figure 6.6 Validation of predictions of granule distribution by the TCPBMs at the operating
condition of x1=0.6; x2 = 0; x3 = 0.4: (a) at 30% binder sprayed; (b) at 70% binder sprayed; (c)
at 100% binder sprayed. ........................................................................................................... 161
Figure 6.7 Comparison of evolution of the granule mean sizes of granulation process and its
process model at three different random operating conditions: (a) x1=0, x2=0, x3=0; (b) x1=-1,
x2=0.1, x3=1; (c) x1=0.8, x2=-0.1, x3=0.1. ............................................................................ 163
Figure 6.8 Mean size evolution and size trajectory using different stages of optimization and
optimal operating conditions: (a) one-stage optimization results; (b) two-stage optimization
results; (c) three-stage optimization results. ............................................................................. 167

List of tables
XIV
List of tables
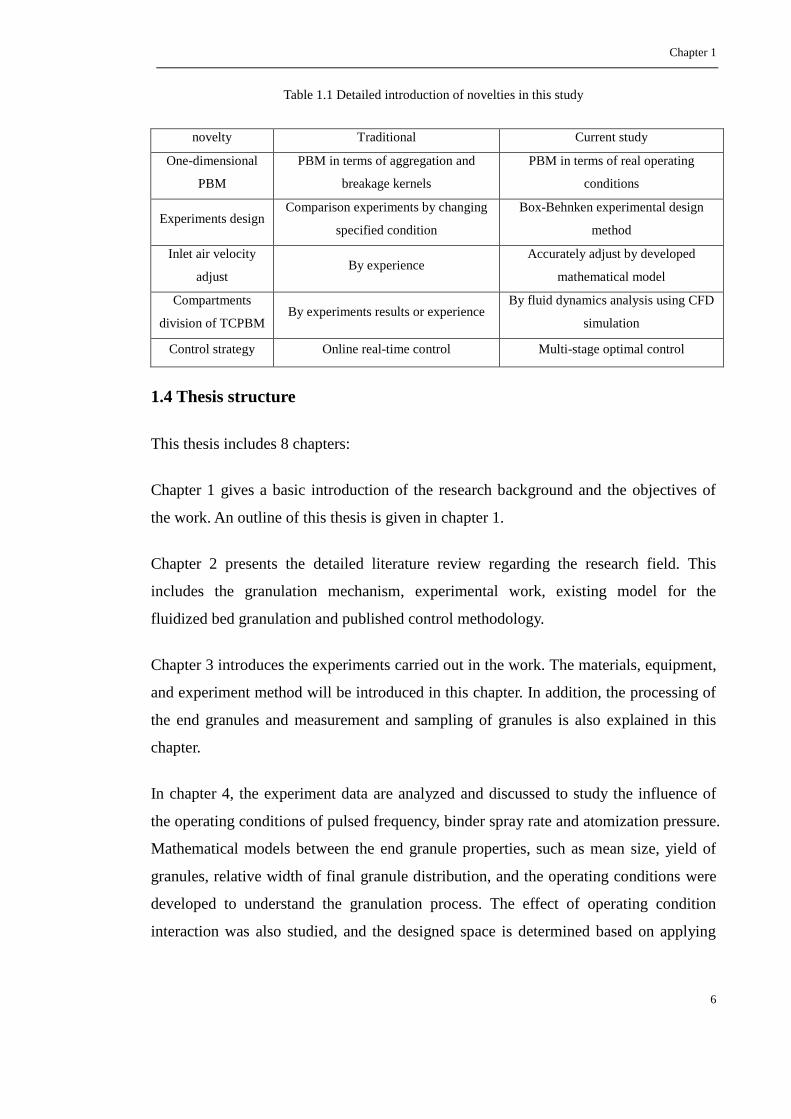
Table 1.1 Detailed introduction of novelties in this study ............................................................. 6
Table 2.1 Summary of nucleation kernels in literature ............................................................... 20
Table 2.2 A summary of proposed aggregation kernels in the literature .................................... 22
Table 2.3 Breakage selection rates in literature ......................................................................... 23
Table 2.4 Fragments size distribution functions in literature ..................................................... 24
Table 2.5 Drag model correlations [166] ................................................................................... 41
Table 2.6 Experiment table by the Box-Behnken experimental design ....................................... 55
Table 3.1 Variables and levels in the Box-Behnken experimental design ................................... 64
Table 3.2 Validation results for FBG process ............................................................................. 65
Table 3.3 The Box-Behnken experimental design and responses ................................................ 67
Table 3.4 Regression coefficients and associated probability values (P-value) for Responses of
Y1, Y2, and Y3 ............................................................................................................................... 68
Table 3.5 Regression coefficients and associated probability values (P-value) for .................... 71
Table 3.6 Validation results for FBG process ............................................................................. 83
Table 4.1 Fitted aggregation and breakage models .................................................................... 97
Table 5.1 Models used for CFD simulations .............................................................................. 117
Table 5.2 All the parameters used in the CFD simulation ........................................................ 120
Table 5.3 The full factorial experimental design and responses ............................................... 125
Table 6.1 Parameters of the TCPBM based on the CFD simulation ........................................ 152
Table 6.2 Fitted aggregation kernel in wetting compartment and breakage kernel in drying
compartment ............................................................................................................................. 154

Abbreviations and symbols
XV
Abbreviations and symbols
Abbreviations
API active pharmaceutical ingredient
CFD computational fluid dynamic
CQAs critical quality attributes
CPPs critical process parameters
CS control space
DEM discrete element model
DoE design of experiment
DDPM dense discrete phase model
DPM discrete phase model
DQMOM direct quadrature method of moment
DS design space
EETFM Eulerian-Eulerian two fluid model
EKEK equipartition of kinetic energy kernel
ETMK equipartition of translational momentum kernel
FBRs fluidized bed reactors
HPMC hydroxy propyl methyl cellulose
ICH International Conference on Harmonization
KTGF kinetic theory of granular flow
MAs material attributes
MC Monte Carlo
MCC microcrystalline cellulose
MCPBM multi-compartmental population balance model
MZPBM multi-zonal population balance model
MPC model predictive control
ODEs ordinary differential equations
ODPBM one-dimensional population balance model
PBEs population balance equations
Abbreviations and symbols
XVI
PBMs population balance models
PD Product-Difference
PID proportional-integral-derivative control
PL positive large
PM positive medium
PS positive small
PSD particle size distribution
QbD quality by design
QbT quality by testing
QMOM quadrature method of moment
QTPP quality target product profile
RSM response surface methodology
RW relative width of granule distribution
SMM standard method of moment
SQMOM sectional quadrature method of moment
SSEs sum of square errors
Stv stokes number
TCPBM two-compartmental population balance model
VOF volume-of-fluid
ZR zero
Symbols
surface area ( )
area of the ith cell ( )
length based fragment size distribution ( )
nucleation rate ( )
drag coefficient
, , coefficients in turbulence model
geometrical mean of ith size interval
particle mean diameter (m)
particle diameter (m)
Abbreviations and symbols
XVII
, granule size at 10% and 90% cumulative particle size distribution
mass mean diameter (m)
desired mean diameter (m)
particle-particle collision restitution coefficient
mass fraction of ith size interval
lift force of phase q (N)
external body force of gas phase q (N)
virtual mass force of phase q (N)
radial distribution function
gravitational acceleration ( )
particle growth rate ( )
, production of turbulent kinetic energy
maximum bed height particles can explore
minimum bed height particles can explore
the second invariant of the deviatoric stress tensor
identity matrix
turbulence kinetic energy tensor
turbulence kinetic energy tensor of phase q
diffusion coefficient for granular energy
interaction force coefficient between phase p and s ( )
particle size (m)
the bed height at minimum fluidization velocity (m)
abscissas of the quadrature approximation ( )
kth moment of number density ( )
mass transfer from gas to solid ( )
mass transfer from solid to gas ( )
n particle number density ( )
, particle number density inlet and outlet of drying zone ( )
particle number density in drying zone ( )
total number of size intervals
Abbreviations and symbols
XVIII
particle number density in spraying zone ( )
, particle number density inlet and outlet of spraying zone ( )
total number of phases
number of solid phases
number of species
grid number on the surface particle flow downward
number of particles in ith size interval
order of the quadrature approximation
grid number on the surface particle flow upward
pressure (chapter 2), parameter in aggregation kernel (chapter 4)
solid phase pressure (Pa)
pressure drop (Pa)
parameter in breakage kernel
r ratio of the upper and lower bounds of a size interval
R particle volume flow rate ( )
particles Reynolds number
length based breakage kernel ( )
breakage kernel in drying zone ( )
mass source term for phase q ( )
breakage kernel constant ( )
breakage kernel constant in drying zone ( )
circulation time (s)
particle size (m)
phase-weighted gas velocity
phase-weighted velocity of phase l
phase-weighted velocity of phase q
inlet air velocity ( )
time-averaged downward particle velocity at bed height y ( )
time-averaged upward particle velocity at bed height y ( )
solid Y velocity ( )

Abbreviations and symbols
XIX
gas phase velocity ( )
mixture velocity ( )
velocity vector of phase q ( )
solid phase velocity ( )
solid phase fluctuating velocity ( )
total particle volume in drying zone ( )
total particle volume in spraying zone ( )
total particle volume in granulator ( )
weights of the quadrature approximation
, lower and upper constraints of pulsed frequency
, lower and upper constraints of binder spray rate ( )
, lower and upper constraints of atomization pressure (psi)
pulsed frequency
binder spray rate ( )
atomization pressure (psi)
mean size of final granules (m)
yield of final granules
relative width of final granule distribution
Hausner ratio
Moisture content at 30% of binder solution sprayed
Moisture content at 70% of binder solution sprayed
Moisture content at 100% of binder solution sprayed
Greeks
portion of entire particle volume in spraying zone
volume fraction of gas phase
volume fraction of phase q
volume fraction of solid phase
length based aggregation kernel ( )
aggregation kernel in spraying zone ( )
Abbreviations and symbols
XX
aggregation rate constant ( )
aggregation rate constant in spraying zone ( )
adjusting parameter in control
collisional dissipation of energy ( )
turbulence dissipation rate ( )
the bed voidage at minimum fluidization velocity
turbulence dissipation rate of phase q ( )
effectiveness factor
angle of internal friction (degree)
solid bulk viscosity ( )
viscosity of gas phase ( )
solid shear viscosity ( )
solid collisional viscosity ( )
solid frictional viscosity ( )
solid kinetic viscosity ( )
frictional viscosity of gas phase ( )
frictional viscosity of system m ( )
gas density ( )
density of system m ( )
density of mixture system ( )
density of phase q ( )
solid density ( )
effective density of phase q ( )
, granular kinetic theory parameter ( )
gas phase stress strain tensor (Pa)
particulate relaxation time (s)
solid phase stress strain tensor (Pa)
system parameters
granular temperature ( )
dissipation of granular energy resulting from fluctuation in
Abbreviations and symbols
XXI
particle velocity from phase p to phase s
physical property parameters of powder mixtures
Subscripts
g gas phase
s solid phase
p, q phase p, q
Chapter 1
1
Chapter 1 Introduction
1.1 Fluidized bed spray granulation
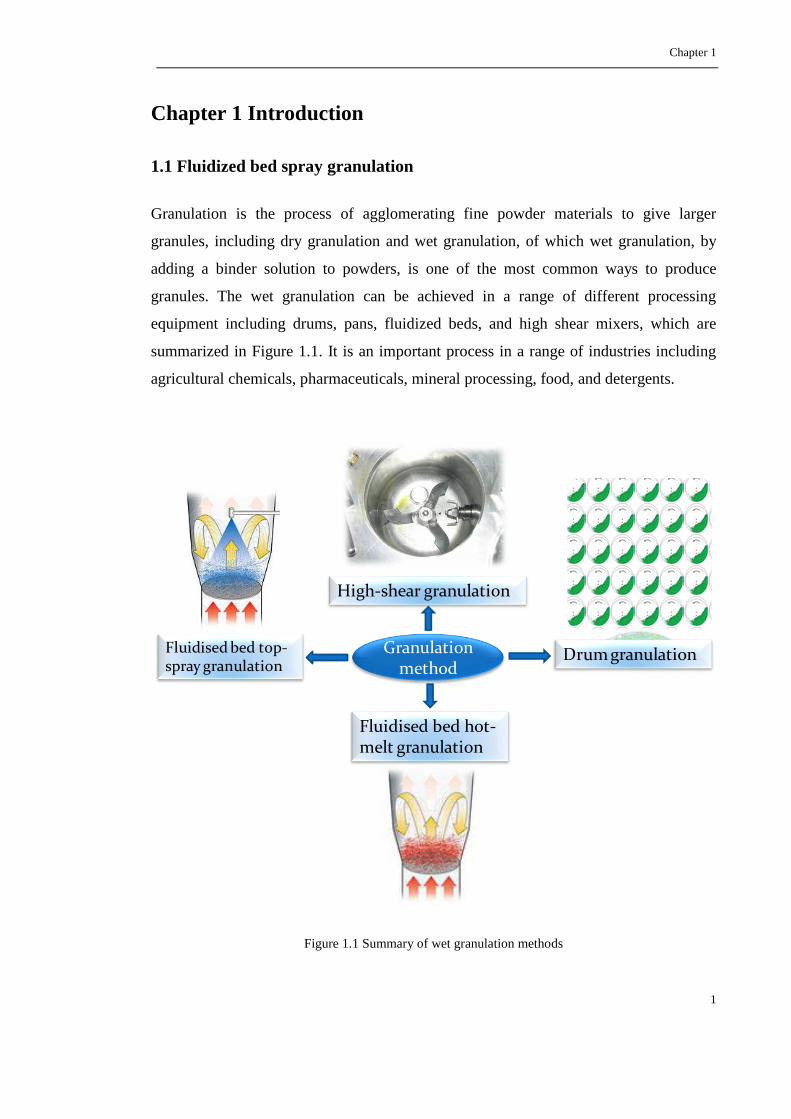
Granulation is the process of agglomerating fine powder materials to give larger
granules, including dry granulation and wet granulation, of which wet granulation, by
adding a binder solution to powders, is one of the most common ways to produce
granules. The wet granulation can be achieved in a range of different processing
equipment including drums, pans, fluidized beds, and high shear mixers, which are
summarized in Figure 1.1. It is an important process in a range of industries including
agricultural chemicals, pharmaceuticals, mineral processing, food, and detergents.
Figure 1.1 Summary of wet granulation methods
Fluidised bed top-spray granulation
High-shear granulation
Drum granulation
Fluidised bed hot-melt granulation
Granulation method

Chapter 1
2
Of the wet granulation methods shown in Figure 1.1, fluidized bed spray granulation is
well known method to produce granules by spraying binder solution over the solid
powder in a fluidized bed. A main advantage of this technique is that several steps can
be completed, compared with other methods, in the same piece of equipment including
pre-blending of the solid powder, granulation with a suitable liquid binding agent,
followed by drying of the granules to a predetermined moisture content level. In
addition, this technique also provides various advantages, i.e. well materials mixing,
high heat and mass transfer rates, uniform binder distribution, and fine particle control.
Due to the interests above, fluidized bed spray granulation is extensively adopted in the
pharmaceutical, food and chemical industries and has a long history more than 40 years.
The initial investigation of the fluidized bed spray granulation began from Wurster in
his work on air suspension coating [1]. In the following decades, fluidized bed spray
granulation was investigated widely and developed quickly [2-5].
To start with, it is necessary to have a basic knowledge of the definition: fluidization. A
definition utilized by Khoshtaghaza and Chayjan [6] is that fluidization is an operation
that suspends solid particles in a gas. Generally, four stages are identified in the process
of fluidizing a bed of solid particles based on the velocity of gas flow through the bed:
fixed bed, expanded bed, bubbling bed, and pneumatically conveying. When a gas is
passed through a bed of solid particles at a low velocity, the gas liquid first percolates
through the void spaces between the particles and this is called the fixed bed. When the
fluidizing air velocity is increased, particles begin to vibrate and an insignificant
increase in the void fraction in the bed is then observed [7]. This is the expanded bed
and at this stage, the bed height becomes higher but still has a similar performance with
the fixed bed. During this period, when the weight of the bed is counterbalanced by the
frictional force of the upward flowing gas, the velocity is called the minimum
fluidization velocity ( ). As the fluidizing velocity increased continuously, the
bubble formation and transportation state occurs. Another classification method is
proposed by Geldart [8] to characterize fluidization behavior, focusing on the physical
properties of the particle. In the Geldart classification method, four distinct groups of
particles (group A: aeratable materials, group B: sand-like solids, group C: cohesive and
fine powders, group D: spoutable large particles) are identified, which can result

Chapter 1
3
different performance of fluidization.
The fluidized bed spray granulation is a complicated process involving multiple process
variables and several simultaneous rate processes. According to the position of the spray
nozzle, three patterns of the fluidized bed granulation are characterized: top spray,
bottom spray and tangential spray, of which the top-spray granulation is the most
commonly used method where binder solution is sprayed from a nozzle positioned
above the fluidized bed [9, 10]. Usually, fluidized bed granulators can be divided into
batch operating mode and continuous mode, of which the batch mode is popularly used
(Figure 1.2). For batch mode fluidized bed granulation, powder is initially charged into
the fluidized bed with air being forced into the granulator from a distributor at the
bottom of the bed. A mesh keeps powder from leaving at the bottom, while filters at the
top of the column allow air to pass, but keep solid particles from leaving. These filters
are periodically shaken to dislodge any particles and to return them back to the fluidized
bed. Once the powder is fluidized and mixed, a binder agent is pumped and
subsequently atomized into fine droplets by nozzles positioned in the top of the
fluidized bed before being added to the powder. Nucleation and agglomeration process
occur subsequently with the addition of the binder. Once the granules are grown to the
desired size, the binder addition is terminated and the granules are then allowed to dry
by continuously fluidizing hot air into the bed.
Figure 1.2 Batch mode top-spray fluidized bed granulator
Fluidizing air
Distributor
Fluidized bed
Binder
solution
Spraying
nozzle
Air outlet
Chapter 1
4
1.2 Research aim and objectives
The aim of the proposed research project is to develop accurate mathematical models to
predict the evolution of granule size and granule size distribution (GSD) in a top-spray
fluidized bed granulation process and to design control strategies to minimize time and
effort to achieve the desired granule properties. It is expected that the batch pulsed top-
spray granulation can be better understood.
The specific objectives of this research are briefly listed as follows:
Objective 1: Review the background, mechanism, experimental study, modeling
approach and control strategy of fluidized bed spray granulation and give a
comprehensive literature review.
Objective 2: Design experiments using Box-Behnken experimental design method to
investigate the influence of three operating parameters: pulsed frequency, binder spray
rate, and atomization pressure on the final granule properties. Especially, study the
capability of the pulsed binder spray in controlling fluidized bed spray granulation.
Objective 3: Develop a one-dimensional population balance model (ODPBM) to predict
the evolution of granule size and granule size distribution. Propose a multi-stage
optimal control strategy to control the fluidized bed granulation process. Validate both
process model and control strategy using experiments and simulations.
Objective 4: Study the influence of particle size and inlet air velocity on the gas-solid
fluid dynamics within the fluidized bed granulator using computation fluid dynamics
(CFD) simulation and finally determine the solid flow pattern.
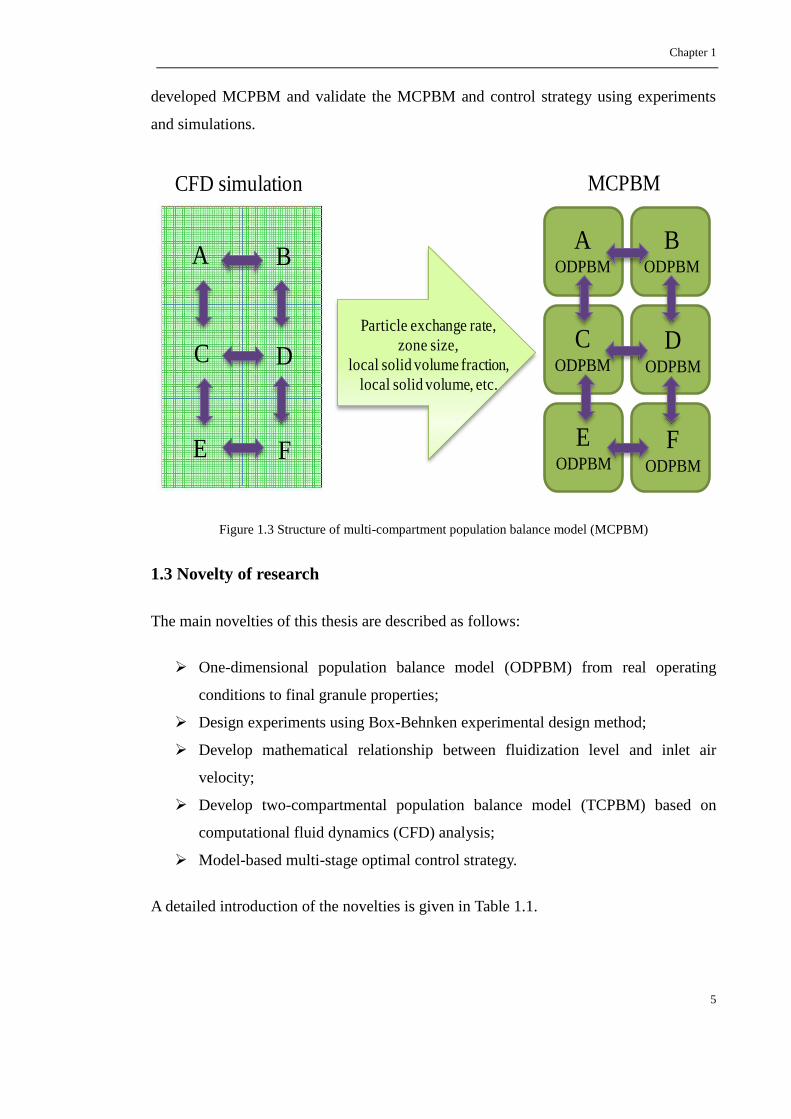
Objective 5: Develop a multi-compartmental population balance model (MCPBM) to
simulate the fluidized bed spray granulation process, in which the fluidized bed
granulator is divided into different zones according to the hydrodynamics study using
computation fluid dynamics (CFD) simulation, as described in Figure 1.3. Apply
homogeneous ODPBM on each zone and obtain exchange and local zone information
from CFD simulation. Apply the proposed multi-stage optimal control on the new
Chapter 1
5
developed MCPBM and validate the MCPBM and control strategy using experiments
and simulations.
Figure 1.3 Structure of multi-compartment population balance model (MCPBM)
1.3 Novelty of research
The main novelties of this thesis are described as follows:
One-dimensional population balance model (ODPBM) from real operating
conditions to final granule properties;
Design experiments using Box-Behnken experimental design method;
Develop mathematical relationship between fluidization level and inlet air
velocity;
Develop two-compartmental population balance model (TCPBM) based on
computational fluid dynamics (CFD) analysis;
Model-based multi-stage optimal control strategy.
A detailed introduction of the novelties is given in Table 1.1.
Particle exchange rate,
zone size,
local solid volume fraction,
local solid volume, etc.
AODPBM
BODPBM
CODPBM
DODPBM
EODPBM
FODPBM
MCPBM
A B
DC
FE
CFD simulation
Chapter 1
6
Table 1.1 Detailed introduction of novelties in this study
novelty Traditional Current study
One-dimensional
PBM
PBM in terms of aggregation and
breakage kernels
PBM in terms of real operating
conditions
Experiments design Comparison experiments by changing
specified condition
Box-Behnken experimental design
method
Inlet air velocity
adjust By experience
Accurately adjust by developed
mathematical model
Compartments
division of TCPBM By experiments results or experience
By fluid dynamics analysis using CFD
simulation
Control strategy Online real-time control Multi-stage optimal control
1.4 Thesis structure
This thesis includes 8 chapters:
Chapter 1 gives a basic introduction of the research background and the objectives of
the work. An outline of this thesis is given in chapter 1.
Chapter 2 presents the detailed literature review regarding the research field. This
includes the granulation mechanism, experimental work, existing model for the
fluidized bed granulation and published control methodology.
Chapter 3 introduces the experiments carried out in the work. The materials, equipment,
and experiment method will be introduced in this chapter. In addition, the processing of
the end granules and measurement and sampling of granules is also explained in this
chapter.
In chapter 4, the experiment data are analyzed and discussed to study the influence of
the operating conditions of pulsed frequency, binder spray rate and atomization pressure.
Mathematical models between the end granule properties, such as mean size, yield of
granules, relative width of final granule distribution, and the operating conditions were
developed to understand the granulation process. The effect of operating condition
interaction was also studied, and the designed space is determined based on applying
Chapter 1
7
constraints on the mean size of granules.
In chapter 5, a process model for the spray fluidized bed granulation process based on
the one-dimensional population balance model (ODPBM) has been developed. The
developed PBMs have linked the key binder solution spray operating factors of the
binder spray rate, atomizing air pressure and pulsed frequency of spray with the granule
properties to predict granule growth behavior in the pulsed spray fluidized bed
granulation process at. A multi-stage open optimal control strategy based on the
developed PBMs was proposed to reduce the model mismatch, in which through
adjusting the trajectory of the evolution of the granule size to determine the optimal
operating variable.
Chapter 6 investigates the multiphase flow dynamics within the spray fluidized bed
granulator modeled based on the granulator equipment in our lab using the
Computational Fluid Dynamics (CFD) software ANSYS Fluent 13.0. Three dimensional
simulations were carried out to study the influence of particle size and inlet air velocity
on the fluid dynamics. Finally, a mathematical model describing the relationship
between particle circulation time and particle size and inlet air velocity was developed.
Based on the fluid dynamic study, the granulator domain was divided into different
compartments, which is assumed as homogeneous for the multi-compartment modeling
study.
In chapter 7, a two-compartment PBM (TCPBM) model is developed. The same control
strategy developed in chapter 5 was applied on the proposed TCPBM. The TCPBM was
compared with the one-dimensional PBM (ODPBM) model, which has shown that the
TCPBM is more superior in predicting the final particle size distribution.
Chapter 8 summarizes the research results and objectives obtained in this study. In
addition, further work that can be carried or modified based on this study is described in
this chapter.
Chapter 2
8
Chapter 2 Literature review
2.1 Chapter overview
In this chapter, a brief and systematic literature review of the spray fluidized bed
granulation is presented. To start with, the knowledge of granulation mechanisms
including nucleation, growth and consolidation, attrition and breakage are briefly
introduced, which gives a detailed understanding of the granulation process. Then, in
order to understand the mechanisms happen during the granulation, the experimental
studies up to date are reviewed mainly from two aspects: influence of process-related
parameters and effect of binder and material properties. The modeling investigation of
fluidized bed granulation including population balance modeling (PBM) and
computational fluid dynamics (CFD) are subsequently summarized, which replenish the
knowledge of fluidized bed granulation. The study of control of fluidized bed
granulation process is also illustrated. Finally, the application of quality by design (QbD)
concept recently to study the fluidized bed granulation is presented. As an important
parameter to control the granulation process, the binder solution pulsed spraying is
especially introduced at the end of present chapter.
2.2 Granulation mechanism
Thorough understanding of the hydrodynamics and the mechanism prevailing in the
granulation process is necessary for understanding the process and further modelling
and control. The mechanism of granulation process has been extensively studied. To
date, several literature reviews focusing on fluidized bed granulation have been
published [11-15]. A review critically evaluating the current understanding of the three
key areas of wet granulation processes: wetting and nucleation, consolidation and
growth, and breakage and attrition was provided by Iveson et al. [11]. Bouffard et al.
[12] provided an overview of process-related variables and physicochemical properties
in fluidized bed granulation and discussed their influence on granulation mechanism.
The breakage behaviors in granulation were reviewed from the process scale down to
the single granule scale by Reynolds et al. [16], with large amount of experimental and

Chapter 2
9
modeling results discussed. Basically, the mechanisms of granulation are often
distinguished as nucleation, growth and consolidation, and breakage and attrition [11],
which may happen simultaneously in the granulation process.
2.2.1 Nucleation
Nucleation means the formation of the initial nuclei by clumping primary particles
together after bringing liquid binder into contact with dry powder. As an important
stage of the granulation, nucleation plays a crucial role as the initial nuclei size
distribution obtained will influence the resulting granule size distribution and the need
to study nucleation mechanism has been identified [17, 18]. To date, there are several
publications focusing on the nucleation mechanisms [19-22].
Nucleation occurs when the binder droplet penetrates the powder mass and nucleates
particles in its immediate vicinity to form a granule nucleus. This process is mainly
influenced by the ability of the liquid binder to spread over the solid surface. Through
extensively experimental studies, two distinct nucleation mechanisms (Figure 2.1):
immersion mechanism and distribution mechanism, depending on the ratio of particle
size to droplet size were proposed by Schaefer and Mathiesen [19].
Figure 2.1 Nucleation mechanisms
In the distribution mechanism, binder is distributed on the surface of the powder
particles, and the formation of nuclei occurs by coalescence between the wetted
particles [23]. In the immersion mechanism where the binder droplet size is larger than
the size of the powder particles, the primary particles are captured on the surface of the
Immersion Distribution
Chapter 2
10
binder droplet and are subsequently immersed. Therefore, the factors that can contribute
to small binder droplet size, such as low binder viscosity and high impeller speed (in
high-shear granulation), will promote the distribution nucleation mechanism [21]. On
the other hand, large initial binder droplet size, high binder viscosity and low impeller
speed promote the immersion mechanism.
2.2.2 Growth and consolidation
Granule growth occurs when particles come into contact and stick together in a
granulation process, of which two distinct growth mechanisms (Figure 2.2) can be
distinguished: layering and coalescence [11], according to the colliding particle size.
Layering refers to the coalescence between one large granule and many small particles,
or the sticking of fine particles onto the surface of large pre-existing granules [13, 24].
In wet granulation, the fluidized particles are wetted with a liquid layer on the surface.
When the fine particles and fragments formed by breakage collide with large granules,
they will stick on the surface of large granules. Therefore, the layering is mainly
determined by the existence of liquid layer on the large granule surface. It is often
induced by rolling action and is a mean of granule growth that creates hard, compact
granules.
The coalescence happens when two nearly equally sized wet granules collide and are
bounded by a liquid bridge formed between the two particles which becomes a solid
bridge during the subsequent drying period. According to the dependency of
coalescence on deformability of the colliding granules, two types of coalescence can be
concluded: non-deformable coalescence and deformable coalescence. Non-deformable
coalescence takes place frequently when the impact velocities are very small or the
granules are extremely rigid, relatively little permanent deformation occurs during
granules collision. In a fluidized bed spray granulation process, this type coalescence
often occurs during the initial nucleation period and later stages when the compact
forces are relatively gentle and granules have become rigid enough after consolidation,
respectively.

Chapter 2
11
Figure 2.2 Particle growth mechanisms
There are many coalescence models available in literature describing the coalescence
mechanisms, which include a variety of formulation and process parameters, such as the
mechanical properties of the granules, the properties of the liquid binder, and the
granule collision velocity. Basically, these models consider whether the particle
rebound or stick together during their collision [11, 25-27]. In these models, the
coalescence happens if the particles do not possess sufficient kinetic energy to rebound.
For example, Ennis et al. [25] studied the non-deformable coalescence by considering
the colliding of two solid particles both of which were surrounded by a thin viscous
binder layer. In their model, the viscous force was considered, then, coalescence
happened successfully only if the kinetic energy of particles was totally dissipated by
the viscous dissipation in the binder layer. During the rebounding stage, the liquid
bridge was assumed to rapture at the same distance at which the two binder layers first
contacted (i.e. 2h, Figure 2.2). A dimensionless binder stokes number (Stv) has been
used to determine whether coalescence between two particles occurs, which is a
measure of the ratio of granule collision kinetic energy to the viscous dissipation
brought about by interstitial binder.
Granule consolidation occurs when collision happens between granules, between
granules and wall or between granules and impellers in high shear granulator.
Consolidation can reduce granules size and porosity, squeeze out entrapped air or even
squeeze liquid binder to the granule surface. Granules with high porosity are weak and
friable, whereby those with lower porosity are strong to resist breakup. Hence,
consolidation has an effect on the mechanical properties of granules. Because granule
Layering
uu
h
ha2h
2r
Coalescence

Chapter 2
12
yield stress generally increases as granule porosity decreases [28], consolidation
decreases the amount of deformation when two granules collide, which decreases the
likelihood of coalescence. However, consolidation also increases the pore saturation,
and this in turn increases granule plasticity and the availability of liquid binder at the
granule surface, both of which will contribute to coalescence. Therefore, how the
consolidation will influence the granule growth may be probably determined by the
formulation and binder properties.
As a complex process in granulation, consolidation can be affected by several variables:
binder content, binder viscosity, binder surface tension, particle size, and operating
conditions [29-34]. Three forces are often utilized to analyse the consolidation process:
capillary force, viscous force, and friction force. Interestingly, the effects of viscosity
and liquid content are highly interactive. Increasing binder content reduces inter-particle
friction due to lubrication but increases viscous forces since there is more binder to be
squeezed between particles as they rearrange. Therefore, Increasing the liquid content
increases the degree of consolidation when lower viscosity binder is used [32], and as
high viscosity binder is used the effect of binder content on consolidation reverses.
Decreasing binder surface tension is found to increase the rate of consolidation, but to
decrease the extent of consolidation [29]. The rate of consolidation decreases as particle
size decreases. As the particle size decreases, the capillary, viscous force in liquid
binder and friction forces between granules which resist to granule deformation all
increase [29]. In addition, the effect of equipment type or equipment speed on
consolidation have also been studied by some researchers in pan granulation [33] and
high shear mixer [34].
2.2.3 Attrition and breakage
Attrition and breakage means the wet granules breakage in the granulation process and
the attrition in drying process [11]. As an important process in granulation, breakage
and attrition of granules can influence the final granule size distribution. From the
product quality perspective, they help to improve granule homogeneity and flowability
[35]. Hence, a good knowledge of breakage and attrition can well contribute to the
design and modeling of the granulation system, as well as control of granulation.

Chapter 2
13
However, wet granules breakage and dry granules attrition in granulator is less well
understood than coalescence [36-39].
Wet granule breakage is the process by which granules, comprising liquid binder and
primary particles, are broken up into smaller granules. The literature on identifying and
quantifying the breakage kinetics during fluidized bed granulation is extremely limited
[39-41]. A granule will breakage if the external stress during an impact exceeds the
intrinsic strength of the granule [41]. In a wet granule, a granule yield strength mainly
depends on the liquid bridges forces, which are in turn made up of capillary forces,
viscous forces and frictional forces [42]. Therefore, all the factors that have effect on the
granule yield strength and external dynamic energy will influence the breakage behavior,
such as the formulation properties and operating conditions. The formulation properties
including the binder viscosity, binder saturation, and binder surface tension as well as
primary particle size have been shown to have a large influence on the granule breakage
behavior [29, 35, 38, 43]. The extent of breakage is found to decrease with the increase
of binder saturation, binder viscosity, and binder surface tension, and increase with
primary particle size [38]. The operating conditions, such as impact velocity and angle,
are also studied, in which a high extent of breakage was reported with high impact
velocity [37, 44-47].
Attrition is caused by normal forces of small magnitude mainly happening in the drying
process, by which the sharp edges and surface asperities are removed and fine dust is
formed. Granule shape also becomes more spherical and smoother due to attrition [48].
Formation of fines by attrition is actually an important parameter because it can affect
flowability of the granule product. Although unwanted size reduction of pharmaceutical
granules during fluidized bed granulation drying [49] or high shear granulation [35] has
been reported, attrition has received relatively little attention.
2.3 Experimental study
In order to well understand the complex mechanisms happened during the granulation
process, experimental design becomes an effective method and many research results
based on experimental study have been published [12, 50-64]. It has been shown that

Chapter 2
14
the granulation results can be significantly influenced by operating parameters such as
inlet air relative humidity, binder feed rate, fluidizing air velocity, inlet air temperature,
spray atomizing pressure, and granulation time. In addition, both primary powder
properties and the binder properties have a great effect on the quality of final product,
especially on the granule size distribution.
2.3.1 Effect of process-related variables
2.3.1.1 Variables related to fluidization
Fluidizing air relative humidity
The inlet air relative humidity is known to have an effect on agglomerate growth and
the particle size of the end product, and has been addressed by a number of researchers.
It has been found that larger granules are formed as relative humidity of inlet air
increases during granulation [50-54], because the water evaporation capacity of the inlet
air is decreased and the formation of liquid and solid bridges is increased. The relative
air humidity is also found to influence the granule growth and the mixing behaviour by
influencing the inter-particle cohesion when it exceeds a critical value [50, 54]. Besides,
the relative humidity has an effect on the minimum fluidization velocity ( ), which
shows a proportional increase with relative humidity of inlet air. Experiments focusing
on the effect of relative air humidity on final granule size were also carried out and the
results indicated that the relative humidity had a positive linear contribution to the final
granule size [51-53]. By using a humidifying system, the relative air humidity is
available to be controlled to avoid improper granulation modes [65]. The bed
temperature increases with the relative air humidity because of the high heat capacity of
high relative air humidity, and the final moisture content is found to increase when the
humidity content of air [66].
Fluidizing air velocity
Fluidizing inlet air velocity is an important operating parameter affecting both
fluidization hydrodynamics and granule growth, and it plays a key role in producing
high powder mixing uniformity. Fluidizing inlet air velocity can affect the granulation

Chapter 2
15
behavior and final granule size distribution by affecting the drying capacity [54]. At the
initial stage of the granulation, it is reported that higher air velocity produces a higher
growth rate because of the higher frequency and energy of collisions between granules,
while larger granules were finally obtained from lower fluidizing air velocity due to the
small shear force provided by the lower fluidizing air velocity [12]. Besides, the higher
fluidizing gas velocity was found to reduce operation efficiency, and agglomerates
fraction [12]. Increasing fluidizing air velocity was found to produce a smaller granule
size [12, 54], and the granules obtained at low gas velocity were less friable than those
produced at high gas velocity [54, 67]. If the fluidizing air velocity is lower than some
critical value, defluidization can happen [54]. In addition to the effect on growth rate,
Tan et al. [55] reported a narrower granule size distribution produced by increasing
fluidizing air velocity. In another study [68], the effect of fluidizing air velocity on bed
humidity was studied, which has found that the bed humidity decreased with increasing
air flow rate.
Fluidizing air temperature
Inlet air temperature is a key parameter affecting the fluid bed temperature and moisture
evaporation [50, 53, 56, 57]. Higher inlet air temperature can dry the wet granules
quickly and makes a lesser granulation time. The bed temperature is found to be
dependent on the inlet air temperature and the granule diameter decreased when
fluidising air temperature was increased [53, 56]. The inlet temperature was also found
to affect the granule growth [50], and it was observed experimentally that at lower
temperature, the granules grew to their final size faster than those of higher temperature.
In addition, the inlet air temperature has an influence on bed humidity [68]. The higher
the inlet air temperature is, the lower the bed humidity is because of the faster
evaporation rate. The inlet air temperature is pointed as an important parameter for
controlling the fluidized bed granulation process due to its influence on the bed
moisture content [57].
2.3.1.2 Variables related to binder spraying
Atomizing pressure
Chapter 2
16
In the fluidized bed granulation, binder solutions are sprayed into the solid bed through
an atomizer in order to produce evenly fine droplets. Thus, the atomizing pressure plays
a really important role in the granulation. The atomizing pressure influences the angle of
sprayed liquid jet and the speed and diameter of the sprayed liquid droplets [56]. As the
atomizing air pressure increased, smaller value of the jet angle, the liquid droplets
diameter and higher value of the droplets speed are obtained, leading to reduction of the
final granule size [12, 51, 56]. As mentioned before, two nucleation mechanisms were
classified as: the immersion mechanism and the distribution mechanism according to
the droplet and particle size ratio [55]. Therefore, the atomizing pressure has a
significant effect on the granulation process through influencing the droplet size. The
effect of binder droplet size on granulation mechanisms was also investigated
extensively [12, 55, 61-64]. Droplet size was found to impact the nucleation mechanism
and the granule growth [61]. A larger droplet size may promote the granule growth
because of a higher liquid saturation in the agglomerate surface due to the immersion
nucleation. With increasing the droplet size, the granules become more spherical and
dense [62]. However, if the binder to solid content ratio is constant, larger droplet size is
found to produce a large fraction of un-granulated fines [63]. The results obtained by
Tan et al. [55] demonstrated that the droplet size can influence the growth rate of
different granulation stage: the smaller droplets was prone to promote a faster initial
growth while the larger droplets seemed to induce a faster secondary growth stage.
Liquid binder feed rate
The binder spray rate is one of the most widely studied parameters, which can affect
granule size, bed moisture content and product quality [57]. Generally, increasing the
binder spray rate enhances granule growth and produces granules with larger mean size
[12, 52, 56, 58-60]. The granule growth increases with the higher binder spray rate
because of its significant enhancement on droplet size and moisture content [68].
However, the binder spray rate was reported to have no influence on the granule growth
rate when it was lower than a critical value [54]. This phenomenon can be interpreted
that lower binder spray rate has too smaller influence on the relative humidity to affect
the granule growth. In another literature [56], it was reported the liquid feed rate
Chapter 2
17
influenced both the angle of the sprayed jet and the droplets size, and changed the
drying conditions within the fluidized bed. When the liquid feed rate increased, the
liquid jet angle and the diameter of the liquid droplets increased therefore it was more
difficult to dry the granules.
Granulation time
As expected, longer granulation time produces larger granules. With increasing
granulation time, the mass of un-granulated particles decreases. It is observed that the
mass fraction of large size granules increased initially, while the mass fraction of larger
granules decreases at the later stage of granulation [62]. This indicates the phenomenon
of breakage of large unconsolidated granules. In addition, it has been reported that at the
early stage of granulation process, the growth rate of the granules is higher [69].
Spray nozzle position
The influence of the atomizer position has been studied, and it is found that decreasing
the height of the spraying nozzle gives rise to an increase of mean granule size and a
decrease of friability of the granules [54, 60]. This phenomenon can be explained by the
fact that when nozzle is located at lower position, the distance of the droplet traveling to
meet particle becomes shorter, which decreases the probability of the spray evaporation
and enhances the binder potential to wet the particles. However, a lower position of the
spray nozzle may cause the clogging due to the sub-merge by fluidizing particles.
Therefore, it is recommended that an appropriate height of the spraying nozzle is that
the tip of the nozzle coincides with the surface of the packed bed [54].
2.3.2 Effect of binder and material properties
There are several physicochemical variables of the binder and material properties that
affect the granulation process. The most regularly studied variables include primary
powder particle size, wettability of the liquid on solid, solubility [54, 56, 61, 62, 70-73]
and binder properties of binder concentration, viscosity [54, 56, 61-64, 69, 71, 73].
Chapter 2
18
2.3.2.1 Effect of powder properties
The properties of the primary material have an important effect on the granulation
process and final granule properties. Usually, the most frequently studied powder
properties include primary powder particle size, wettability of the binder liquid on solid,
solubility, and particle shape factor [57].
It was shown that as the primary mean particle size decreased, the particle growth rate
increased, and the final granule mean size decreased [54, 61, 62]. An increasing growth
rate is observed when the solubility of primary powder increases [56, 70, 71]. The
particle surface wettability can be indicated by the contact angle between the binder
droplet and solid particle and the experiments results show that the agglomeration
kinetics becomes more important as the contact angle decreases [54, 62, 72, 73].
Furthermore, when the contact angle is similar, the growth is determined by the particle
shape factor with larger shape factor causing slow growth [54, 73].
2.3.2.2 Effect of binder properties
During the granulation process, liquid binder is sprayed into the powder in the bed, and
particles are bonded with the liquid bridge. Therefore, the properties of binder have a
key influence on granulation. The most important binder properties include the binder
viscosity, binder concentration, and the binder content.
Generally, the growth rate, maximum median granule diameter, and the final granule
porosity are found to increase as the binder concentration increases [54, 56, 61, 64, 69,
71, 73]. The low viscosity binder is proved to promote the granulation and the growth
rate [69], due to the high probability of viscous binders being forced to the surface
during collision. The percentage of un-granulated fines is found to decrease with
increasing the binder content and granule growth also depended on the binder content
[62, 69]. However, Ansari and Stepanek [63] have proved that the mean size of pure
granules (excluding the un-granulated fines) is independent on the binder content,
instead of on the droplet size. Besides, there should be a limitation for the binder
content, above which the over-wetting or defluidization could occur [74].

Chapter 2
19
2.4 Population balance modeling
2.4.1 Population balance equation
In order to develop a better design method and tight control strategy, an accurate
mathematical model of the fluidized bed granulation process is needed. The population
balance model (PBM) has been used for describing the change of particle size
distribution of fluidized bed granulation in a large number of works for decades [39, 67,
75-85]. To date, several literature reviews have been published [13, 86-88].
A general length-based population balance equation in batch mode that describes the
rate of change in particle length number density function n(t,L) is given as follows [89,
90]:
Nucleation
Growth
Aggregation
Breakage
(2.1)
Where, is the number density function in terms of the particle diameter ,
is the length-based aggregation kernel that describes the frequency that
particles with diameter and collide to form a particle of volume , is
the fragments distribution function that describe the frequency of formation of particles
of diameter from the breakup of particle of diameter , is the length-based
breakage selection rate that is the frequency of disruption of a particle of diameter ,

Chapter 2
20
is nucleation rate, and is the growth rate.
The terms on the right hand side of equation (2.1) have different meanings as follows
(the number corresponds to the terms):
(1) The appearance of new particles of diameter because of nucleation.
(2) The birth of particle of diameter due to the growth of smaller particles.
(3) The birth of particles of diameter due to aggregation of two smaller particles of
diameter
and .
(4) The death of particles of diameter due to aggregation of particle of diameter and
particle of any diameter .
(5) The birth of particle of diameter due to the breakage of larger particles of diameter
.
(6) The death of particle of diameter due to breakage.
2.4.2 Nucleation kernel
Up to date, a limited number of nucleation kernels have been proposed based on the
mechanism of nucleation discussed in section 2.2.1. For population balance model, a
brief summary of the nucleation kernels is given in Table 2.1. A nucleation kernel based
on the immersion nucleation mechanism is proposed [91, 92] and should be very
popular in population balance formulating. In this kernel, the binder droplet size is
bigger than the particle size and one droplet can form one nucleus. When the spray
droplets dry entirely before they hit any other particles, they do not contribute to growth,
but to nucleation [82].
Table 2.1 Summary of nucleation kernels in literature
Nucleation kernel Comments reference
: adjustable parameter, Q: liquid binder spray rate, R:
ideal gas constant, T: operating temperature, is the
spreading coefficient, :work of adhesion. , :
works of cohesion for a solid and liquid, respectively.
Suitable for immersion mechanism nucleation.
[91, 92]
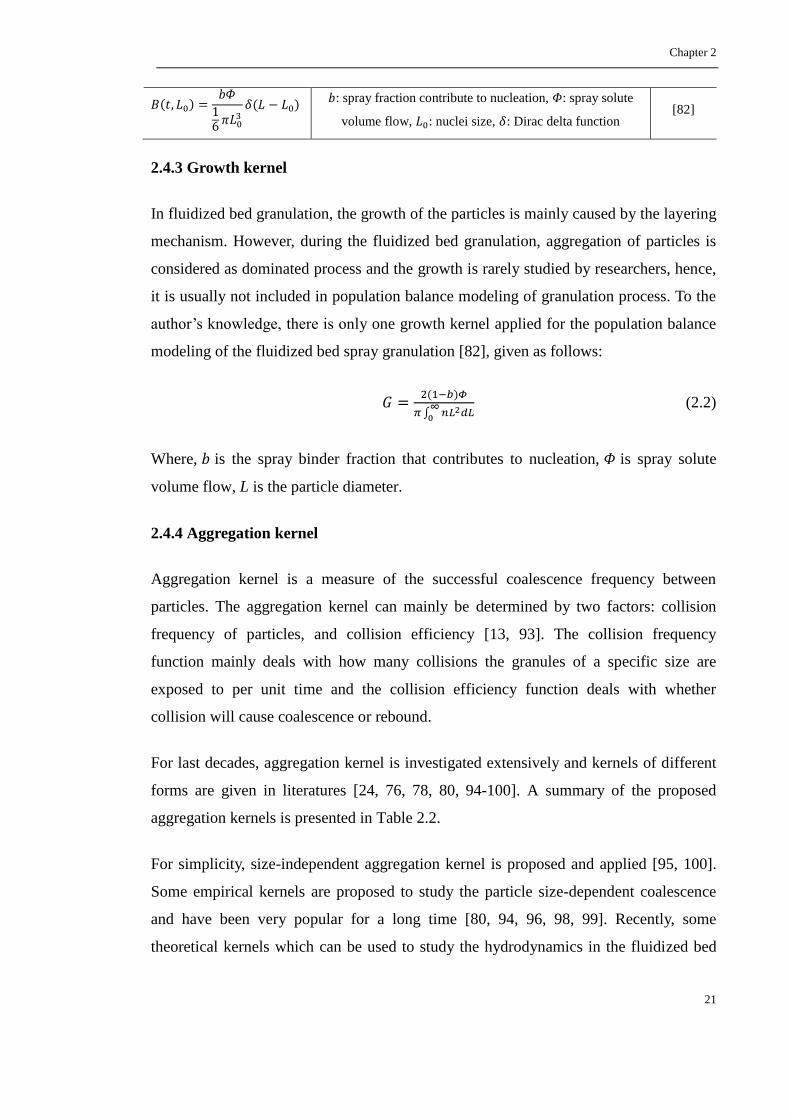
Chapter 2
21
: spray fraction contribute to nucleation, : spray solute
volume flow, : nuclei size, : Dirac delta function [82]
2.4.3 Growth kernel
In fluidized bed granulation, the growth of the particles is mainly caused by the layering
mechanism. However, during the fluidized bed granulation, aggregation of particles is
considered as dominated process and the growth is rarely studied by researchers, hence,
it is usually not included in population balance modeling of granulation process. To the
author’s knowledge, there is only one growth kernel applied for the population balance
modeling of the fluidized bed spray granulation [82], given as follows:
(2.2)
Where, is the spray binder fraction that contributes to nucleation, is spray solute
volume flow, L is the particle diameter.
2.4.4 Aggregation kernel
Aggregation kernel is a measure of the successful coalescence frequency between
particles. The aggregation kernel can mainly be determined by two factors: collision
frequency of particles, and collision efficiency [13, 93]. The collision frequency
function mainly deals with how many collisions the granules of a specific size are
exposed to per unit time and the collision efficiency function deals with whether
collision will cause coalescence or rebound.
For last decades, aggregation kernel is investigated extensively and kernels of different
forms are given in literatures [24, 76, 78, 80, 94-100]. A summary of the proposed
aggregation kernels is presented in Table 2.2.
For simplicity, size-independent aggregation kernel is proposed and applied [95, 100].
Some empirical kernels are proposed to study the particle size-dependent coalescence
and have been very popular for a long time [80, 94, 96, 98, 99]. Recently, some
theoretical kernels which can be used to study the hydrodynamics in the fluidized bed
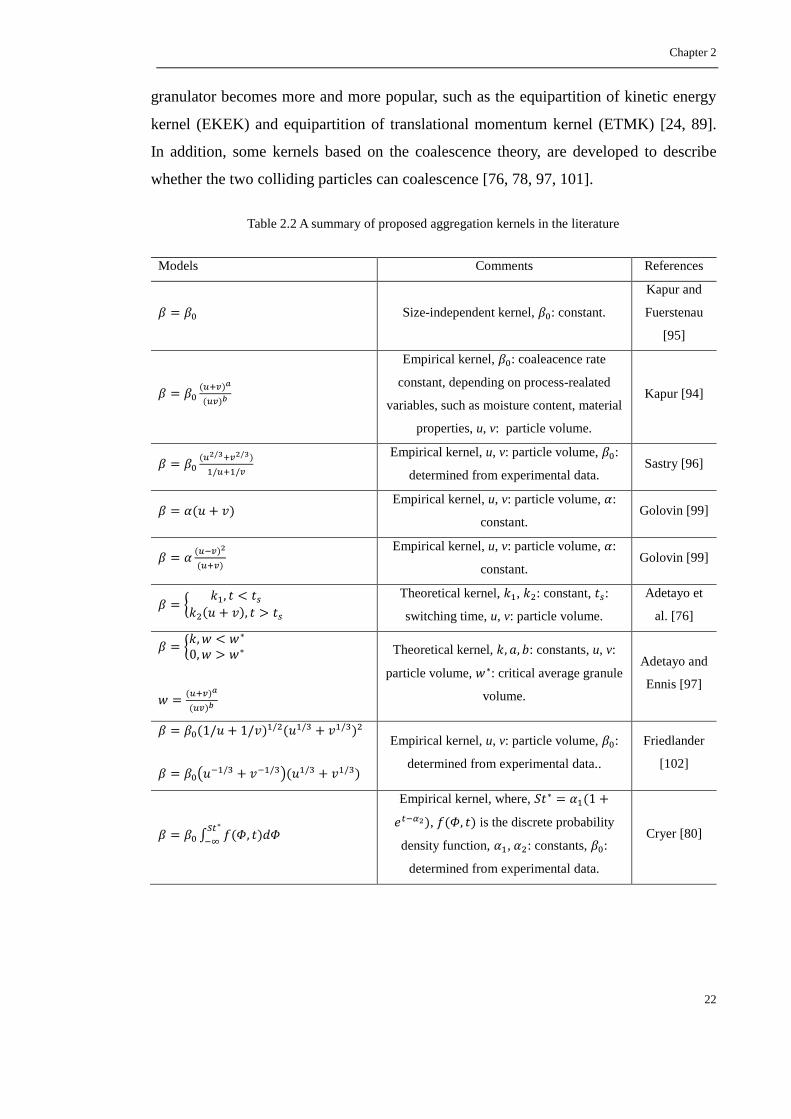
Chapter 2
22
granulator becomes more and more popular, such as the equipartition of kinetic energy
kernel (EKEK) and equipartition of translational momentum kernel (ETMK) [24, 89].
In addition, some kernels based on the coalescence theory, are developed to describe
whether the two colliding particles can coalescence [76, 78, 97, 101].
Table 2.2 A summary of proposed aggregation kernels in the literature
Models Comments References
Size-independent kernel, : constant.
Kapur and
Fuerstenau
[95]
Empirical kernel, : coaleacence rate
constant, depending on process-realated
variables, such as moisture content, material
properties, u, v: particle volume.
Kapur [94]
Empirical kernel, u, v: particle volume, :
determined from experimental data. Sastry [96]
Empirical kernel, u, v: particle volume, :
constant. Golovin [99]
Empirical kernel, u, v: particle volume, :
constant. Golovin [99]
Theoretical kernel, , : constant, :
switching time, u, v: particle volume.
Adetayo et
al. [76]
Theoretical kernel, : constants, u, v:
particle volume, : critical average granule
volume.
Adetayo and
Ennis [97]
Empirical kernel, u, v: particle volume, :
determined from experimental data..
Friedlander
[102]
Empirical kernel, where,
, is the discrete probability
density function, , : constants, :
determined from experimental data.
Cryer [80]

Chapter 2
23
Theoretical kernel, , : constants, The
aggregation kernel is different constant
according to the coalescence type.
Liu and
Litster [78]
Theoretical kernel, Where,
, : granular temperature, :
particle radial distribution, : particle
density, : successful factor for aggregation.
Hounslow
[89],
Goldschmidt
[24]
Empirical kernel, , : particle diameter,
, : constant, large-large particle
collision is favored.
Hounslow
[89]
Theoretical kernel, , : constants, u, v:
particle volume.
Papiya Roy
et al. [101]
2.4.5 Breakage kernel
A breakage kernel includes the breakage selection rate, which represents the particle
fraction breakup per unit time, and the fragments size distribution function, which
describes the distribution of the fragments from the breakage of parent particles.
2.4.5.1 Breakage selection rate
Comparing with aggregation, breakage in the fluidized bed granulation received less
research. Based on the theory for particle breakage described in the section 2.2.3,
several models for breakage selection rate have been proposed [67, 81, 89] and
summarized in Table 2.3.
Table 2.3 Breakage selection rates in literature
Models Comments References
Constant breakage selection rate, :
constant. Tan et al. [67]
Proportional to the granule size to the power
, : constant, : particle diameter.
Tan et al. [81], Kumar
et al. [100], Soos et al.
[103]
Time-dependent selection rate, : constant. Hounslow et al. [89]
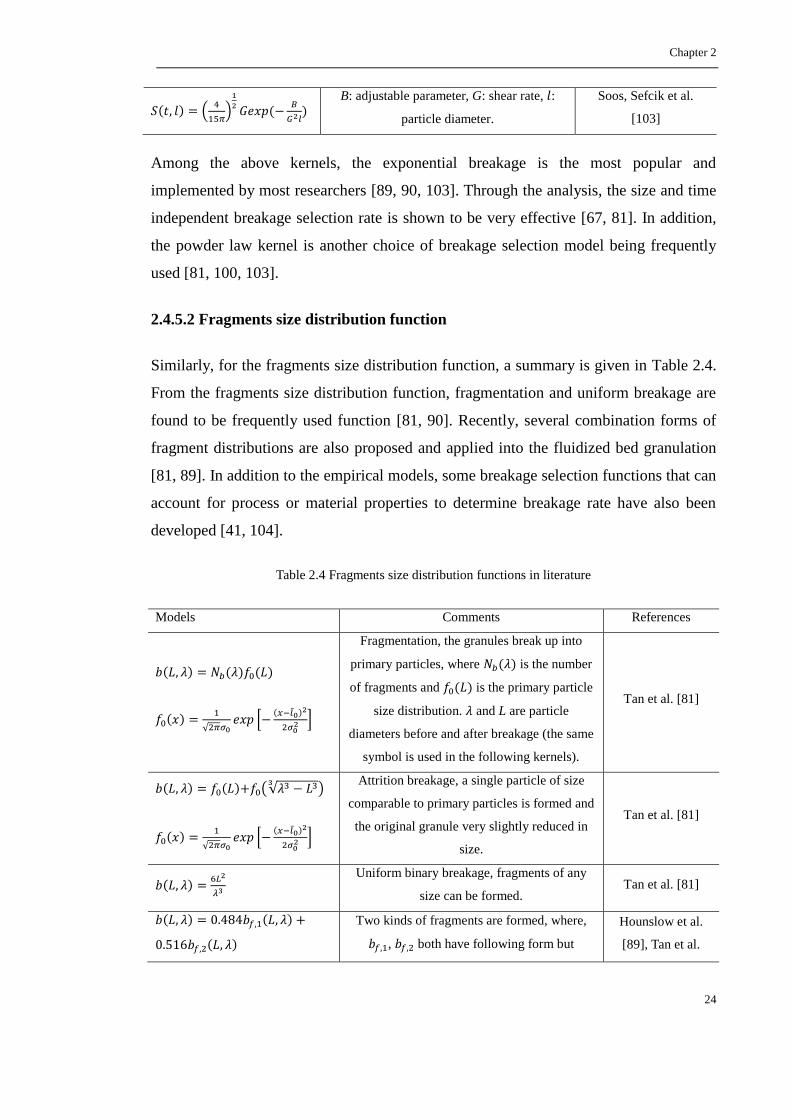
Chapter 2
24
B: adjustable parameter, G: shear rate, :
particle diameter.
Soos, Sefcik et al.
[103]
Among the above kernels, the exponential breakage is the most popular and
implemented by most researchers [89, 90, 103]. Through the analysis, the size and time
independent breakage selection rate is shown to be very effective [67, 81]. In addition,
the powder law kernel is another choice of breakage selection model being frequently
used [81, 100, 103].
2.4.5.2 Fragments size distribution function
Similarly, for the fragments size distribution function, a summary is given in Table 2.4.
From the fragments size distribution function, fragmentation and uniform breakage are
found to be frequently used function [81, 90]. Recently, several combination forms of
fragment distributions are also proposed and applied into the fluidized bed granulation
[81, 89]. In addition to the empirical models, some breakage selection functions that can
account for process or material properties to determine breakage rate have also been
developed [41, 104].
Table 2.4 Fragments size distribution functions in literature
Models Comments References
Fragmentation, the granules break up into
primary particles, where is the number
of fragments and is the primary particle
size distribution. and L are particle
diameters before and after breakage (the same
symbol is used in the following kernels).
Tan et al. [81]
Attrition breakage, a single particle of size
comparable to primary particles is formed and
the original granule very slightly reduced in
size.
Tan et al. [81]
Uniform binary breakage, fragments of any
size can be formed. Tan et al. [81]
Two kinds of fragments are formed, where,
, both have following form but
Hounslow et al.
[89], Tan et al.
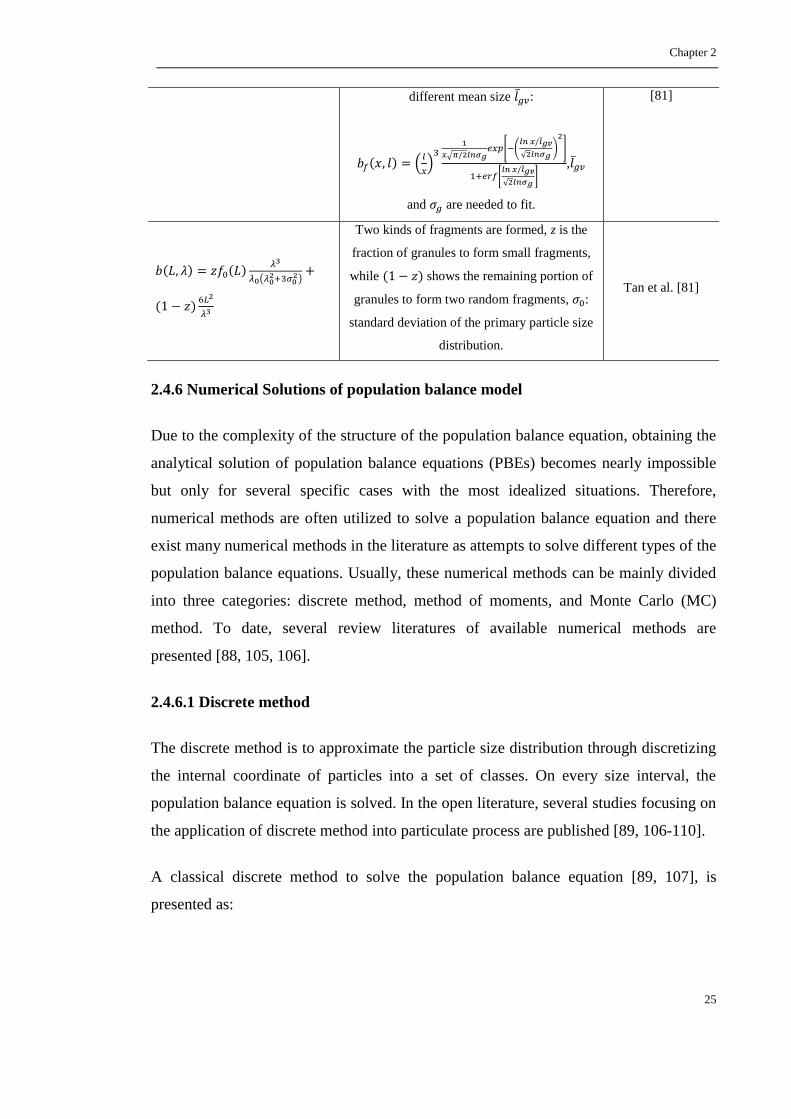
Chapter 2
25
different mean size :
,
and are needed to fit.
[81]
Two kinds of fragments are formed, z is the
fraction of granules to form small fragments,
while shows the remaining portion of
granules to form two random fragments, :
standard deviation of the primary particle size
distribution.
Tan et al. [81]
2.4.6 Numerical Solutions of population balance model
Due to the complexity of the structure of the population balance equation, obtaining the
analytical solution of population balance equations (PBEs) becomes nearly impossible
but only for several specific cases with the most idealized situations. Therefore,
numerical methods are often utilized to solve a population balance equation and there
exist many numerical methods in the literature as attempts to solve different types of the
population balance equations. Usually, these numerical methods can be mainly divided
into three categories: discrete method, method of moments, and Monte Carlo (MC)
method. To date, several review literatures of available numerical methods are
presented [88, 105, 106].
2.4.6.1 Discrete method
The discrete method is to approximate the particle size distribution through discretizing
the internal coordinate of particles into a set of classes. On every size interval, the
population balance equation is solved. In the open literature, several studies focusing on
the application of discrete method into particulate process are published [89, 106-110].
A classical discrete method to solve the population balance equation [89, 107], is
presented as:
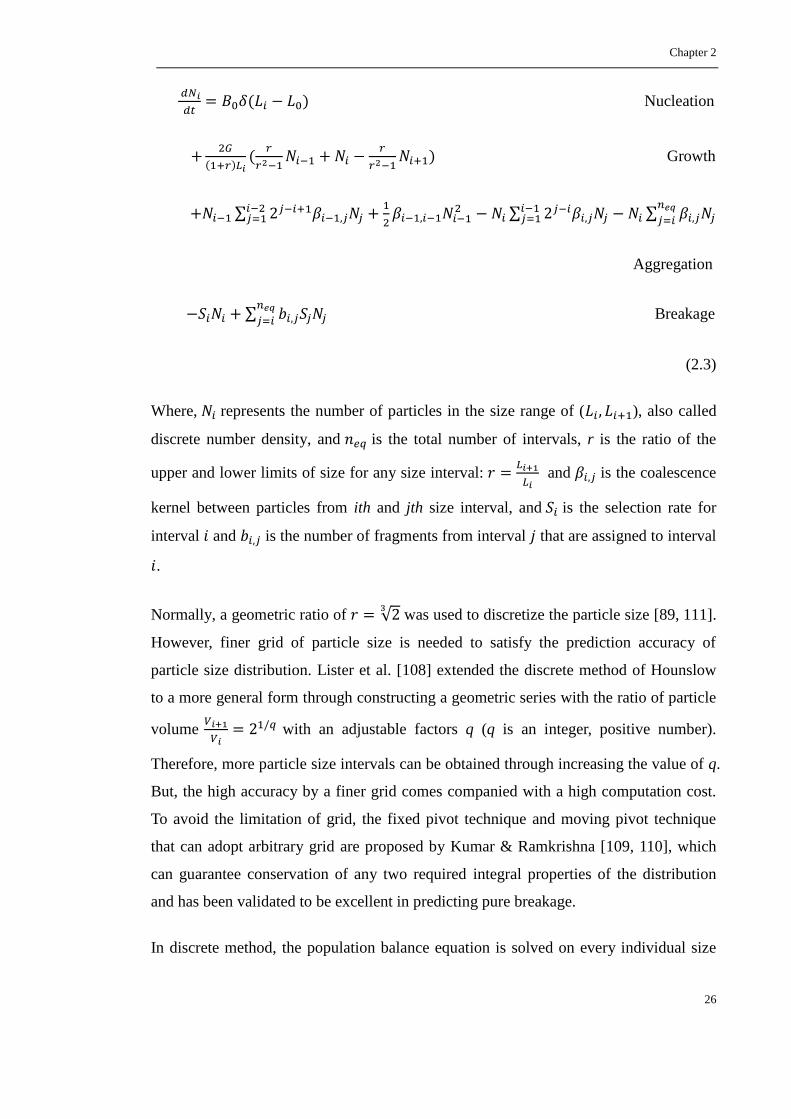
Chapter 2
26
Nucleation
Growth
Aggregation
Breakage
(2.3)
Where, represents the number of particles in the size range of ( ), also called
discrete number density, and is the total number of intervals, r is the ratio of the
upper and lower limits of size for any size interval:
and is the coalescence
kernel between particles from ith and jth size interval, and is the selection rate for
interval and is the number of fragments from interval that are assigned to interval
.
Normally, a geometric ratio of
was used to discretize the particle size [89, 111].
However, finer grid of particle size is needed to satisfy the prediction accuracy of
particle size distribution. Lister et al. [108] extended the discrete method of Hounslow
to a more general form through constructing a geometric series with the ratio of particle
volume
with an adjustable factors q (q is an integer, positive number).
Therefore, more particle size intervals can be obtained through increasing the value of q.
But, the high accuracy by a finer grid comes companied with a high computation cost.
To avoid the limitation of grid, the fixed pivot technique and moving pivot technique
that can adopt arbitrary grid are proposed by Kumar & Ramkrishna [109, 110], which
can guarantee conservation of any two required integral properties of the distribution
and has been validated to be excellent in predicting pure breakage.
In discrete method, the population balance equation is solved on every individual size

Chapter 2
27
interval. Therefore, an advantage of this technique is that the approach directly presents
the result of the particle size distribution. On the other hand, in order to achieve an
excellent accuracy, a large number of intervals are needed, which means a disadvantage
of huge computation cost, especially for cases with wide particle size distribution.
2.4.6.2 Method of moment
The method of moment is a technique to solve the population balance in terms of
moment, which is defined as:
(2.4)
Where, k is the order of the moment and n is the length number density in terms of
particle size L.
The concept of solving the population balance equation using moment method has been
firstly proposed by Hulburt and Katz [112]. By multiplying and integrating for L, the
population balance equation is transferred into the form of moment. The general
population balance equation in terms of particle length is given as follows:
Nucleation
Growth
Aggregation
Breakage
(2.5)
Where, is the number density function in terms of the particle diameter ,
is the coalescence kernel, while and are breakage selection
rate function and fragments size distribution function, respectively. is the size
dependent growth rate, and is the nucleation rate.

Chapter 2
28
If the equation (2.5) is solved directly, this is called standard method of moment (SMM)
[113-117]. Comparing with discrete method, the main advantage of the SMM is that the
number of moments required is very small, however, the closure problem of the
equation in terms of moment can only be solved for some size-independent growth rates
and aggregation kernels while for any breakage kernels impossible [118]. In fact, it is
only in above cases that the SMM formulation of the problem can be expressed in terms
of a closed set of kernels. Based on this situation, the quadrature method of moment
(QMOM) is proposed by McGraw [118] for modeling the size evolution and has been
developed by a lot of researchers [90, 119-124]. In this method, a quadrature
approximation is employed:
(2.6)
Where, weights ( ) and abscissas ( ) are used to approximate the moments and are
determined through a Product-Difference (PD) algorithm from the lower-order moments.
Through equation (2.6), it can be seen that 2 moments are needed to calculate the
weights and abscissas. After the QMOM is used, the following population balance
equation is given [90, 121]:
Nucleation
Growth
Aggregation
Breakage
(2.7)
Where, is the number of nodes of the quadrature approximation, while the other
variables have the same meaning with equation (2.5).
In fact, the particle size distribution can also be obtained by the QMOM method,
through doing the reconstruction from the moments. Assuming the particle size
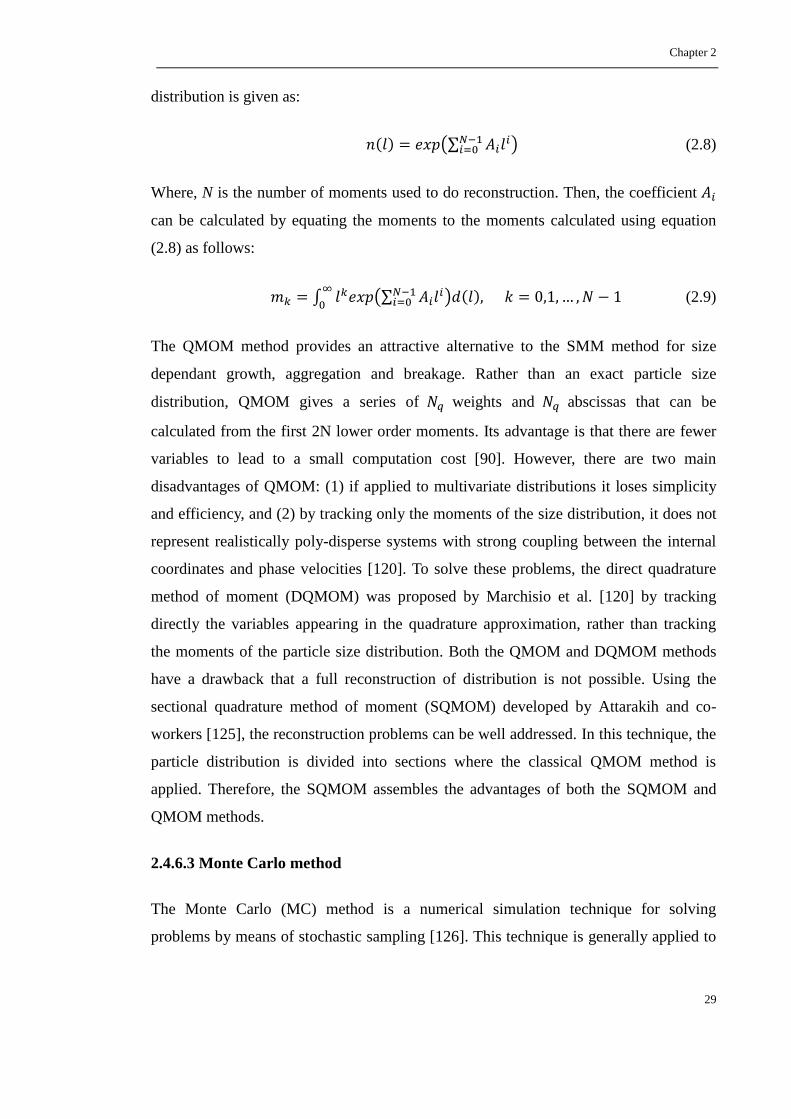
Chapter 2
29
distribution is given as:
(2.8)
Where, N is the number of moments used to do reconstruction. Then, the coefficient
can be calculated by equating the moments to the moments calculated using equation
(2.8) as follows:
(2.9)
The QMOM method provides an attractive alternative to the SMM method for size
dependant growth, aggregation and breakage. Rather than an exact particle size
distribution, QMOM gives a series of weights and abscissas that can be
calculated from the first 2N lower order moments. Its advantage is that there are fewer
variables to lead to a small computation cost [90]. However, there are two main
disadvantages of QMOM: (1) if applied to multivariate distributions it loses simplicity
and efficiency, and (2) by tracking only the moments of the size distribution, it does not
represent realistically poly-disperse systems with strong coupling between the internal
coordinates and phase velocities [120]. To solve these problems, the direct quadrature
method of moment (DQMOM) was proposed by Marchisio et al. [120] by tracking
directly the variables appearing in the quadrature approximation, rather than tracking
the moments of the particle size distribution. Both the QMOM and DQMOM methods
have a drawback that a full reconstruction of distribution is not possible. Using the
sectional quadrature method of moment (SQMOM) developed by Attarakih and co-
workers [125], the reconstruction problems can be well addressed. In this technique, the
particle distribution is divided into sections where the classical QMOM method is
applied. Therefore, the SQMOM assembles the advantages of both the SQMOM and
QMOM methods.
2.4.6.3 Monte Carlo method
The Monte Carlo (MC) method is a numerical simulation technique for solving
problems by means of stochastic sampling [126]. This technique is generally applied to

Chapter 2
30
analyze physical systems where experiment is difficult or where population balance
equations cannot be solved [127]. As an alternative to solve population balance equation,
Monte Carlo approach can be applied to the particulate system [126, 128].
Usually, two general categories of Monte Carlo methods can be distinguished: time-
driven MC method [128-130] and event-driven MC method [131-133]. A big difference
between the two types of MC method is whether the time-step is chosen before the
event. In the former approach, a time interval is initially defined and Monte Carlo is
used to decide which or how many events will be realized within the time-step [128,
130]. By contrast, in event-driven MC method, the time between events is calculated on
the basis of the known event probability. Therefore, this method does not need explicit
time discretization and has advantage that the time step can adjust itself to the rate of the
process.
The Monte Carlo methods can also be classified by whether the total volume or particle
number is constant in the simulation: constant-volume MC method [132] and constant-
number MC method [134-136]. In the constant volume MC method, when a sufficient
number of simulation particles is used, this method is validated to have capability to
well minimize statistical errors [132]. However, if the simulation volume is kept
constant, in the simulation total particle number will increase or decrease, which
obviously influence the accuracy of the Monte Carlo method and the computation time.
To solve this problem, the constant number MC method is developed [134-136], in
which, the number of particle is kept constant. This technique amounts to expanding or
contracting the physical volume represented by the simulation so as to continuously
maintain a reaction volume that contains constant number of particles [134].
Comparing with discrete method, the MC method can well deal with the following
problems: (1) there is no information about the history of each particle, (2) when
multidimensional systems have to be dealt with, the sectional representation results in
very complex algorithm [132]. Another obvious advantage is that discretization is
unnecessary since a sample of the population is simulated explicitly. However, if high
accuracy is needed, the simulation number should be increased, which may also result
in high computation cost.
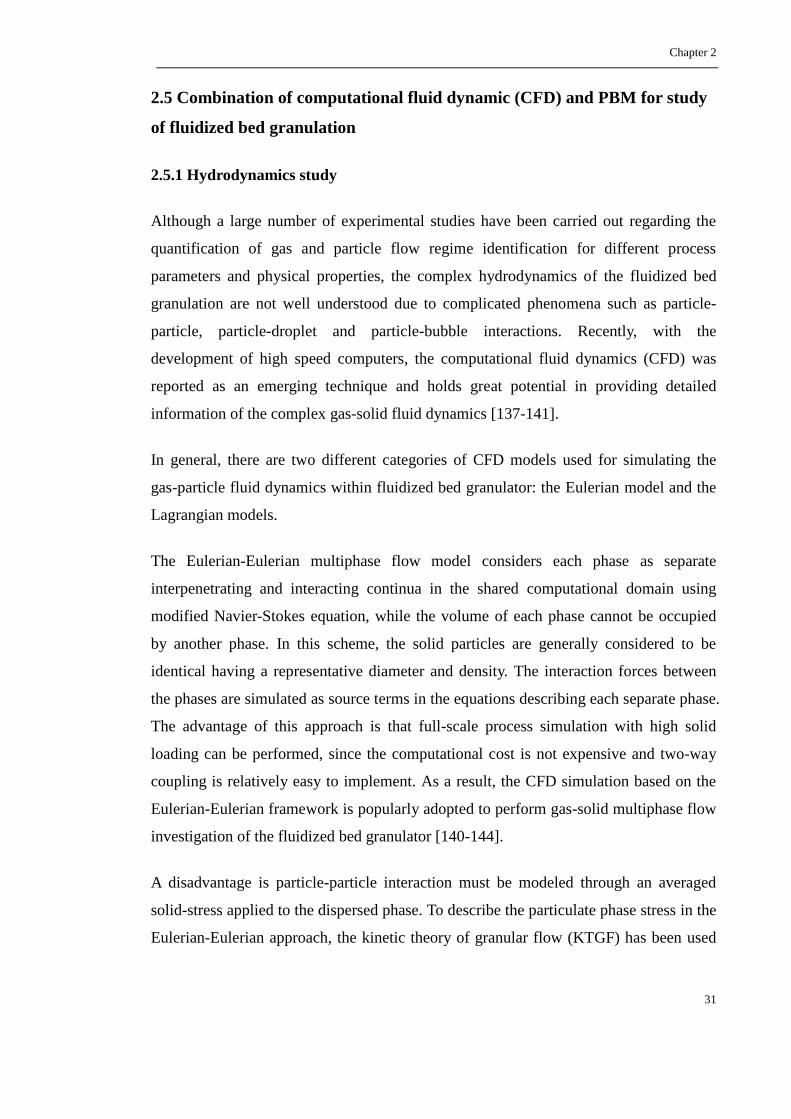
Chapter 2
31
2.5 Combination of computational fluid dynamic (CFD) and PBM for study
of fluidized bed granulation
2.5.1 Hydrodynamics study
Although a large number of experimental studies have been carried out regarding the
quantification of gas and particle flow regime identification for different process
parameters and physical properties, the complex hydrodynamics of the fluidized bed
granulation are not well understood due to complicated phenomena such as particle-
particle, particle-droplet and particle-bubble interactions. Recently, with the
development of high speed computers, the computational fluid dynamics (CFD) was
reported as an emerging technique and holds great potential in providing detailed
information of the complex gas-solid fluid dynamics [137-141].
In general, there are two different categories of CFD models used for simulating the
gas-particle fluid dynamics within fluidized bed granulator: the Eulerian model and the
Lagrangian models.
The Eulerian-Eulerian multiphase flow model considers each phase as separate
interpenetrating and interacting continua in the shared computational domain using
modified Navier-Stokes equation, while the volume of each phase cannot be occupied
by another phase. In this scheme, the solid particles are generally considered to be
identical having a representative diameter and density. The interaction forces between
the phases are simulated as source terms in the equations describing each separate phase.
The advantage of this approach is that full-scale process simulation with high solid
loading can be performed, since the computational cost is not expensive and two-way
coupling is relatively easy to implement. As a result, the CFD simulation based on the
Eulerian-Eulerian framework is popularly adopted to perform gas-solid multiphase flow
investigation of the fluidized bed granulator [140-144].
A disadvantage is particle-particle interaction must be modeled through an averaged
solid-stress applied to the dispersed phase. To describe the particulate phase stress in the
Eulerian-Eulerian approach, the kinetic theory of granular flow (KTGF) has been used

Chapter 2
32
[145-147], which was developed to model the motion of a dense collection of nearly
elastic spherical particles [148, 149]. The application of kinetic theory to model the
motion of a dense collection of nearly elastic spherical particles is based on an analogy
to the kinetic theory of dense gas. A granular temperature is defined to represent the
specific kinetic energy of the velocity fluctuation or the translational fluctuation energy
resulting from the particle velocity fluctuations. In granular flow, particle velocity
fluctuations about the mean are assumed to result in collisions between particles being
swept along together by the mean flow. The granular particle temperature equation can
be expressed in terms of production of fluctuation by shear, dissipation by kinetic and
collisional shear flow, dissipation due to inelastic collision with molecules, and
dissipation due to interaction with the fluid [150].
The Lagrangian model solves equations of motion for each particle taking into account
particle-particle collisions and the forces acting on the particle by the gas, which allows
the effects of various particle properties on the motion of fluid to be studied and
attracted lots of researches’ attention [151-156]. However, due to the velocity and
corresponding trajectory are solved for each individual particle, the computation cost of
Lagrangian model is intensive. Due to computational limitations, the Lagrangian model
is still not possible to track more than about a million particles within reasonable
simulation time, even though recent advances in computation seem to be very promising
[157]. Therefore, when the number of particles is large, as is the case in fluidized beds,
the computational requirements can force the Eulerian-Eulerian models to be preferred
selection.
2.5.2 Eulerian-Eulerian multi-phase flow model (EEMFM)
The general Eulerian-Eulerian multi-phase flow model utilized to simulate granular
flow in a fluidized bed granulator and constitutive equations are presented in this
section.
2.5.2.1 Governing equations
As described early, an Eulerian-Eulrian model considers each phase as interpenetrating
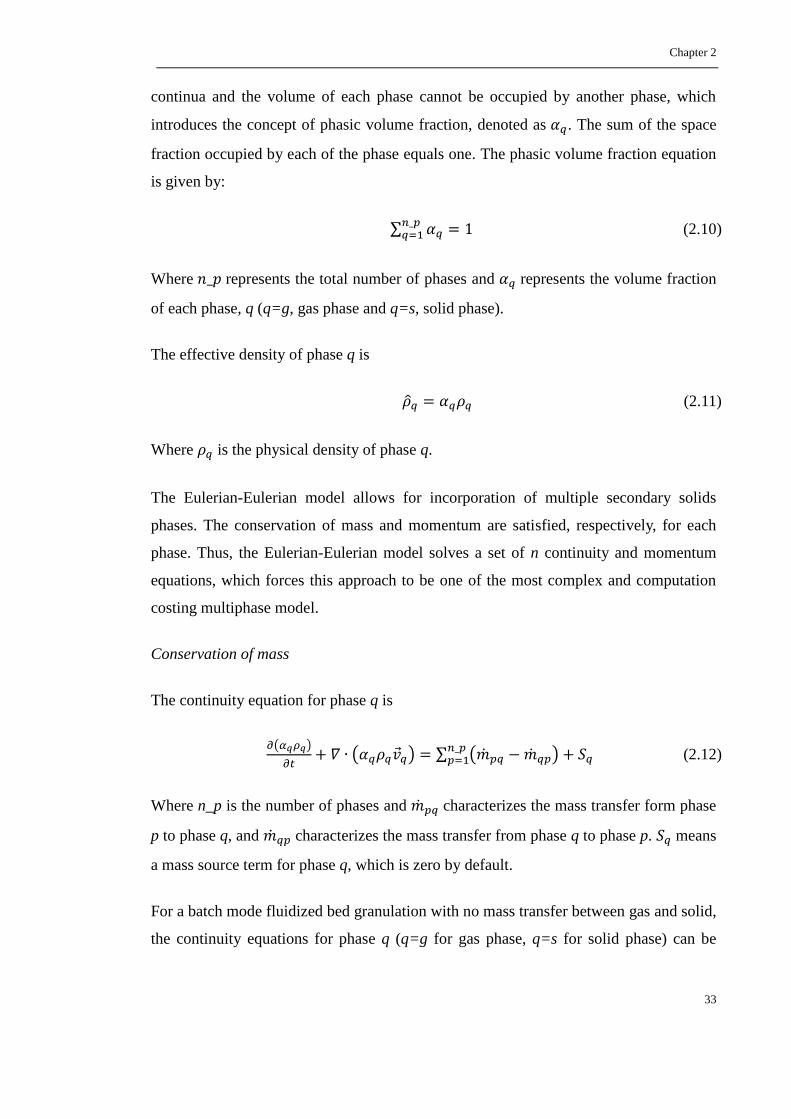
Chapter 2
33
continua and the volume of each phase cannot be occupied by another phase, which
introduces the concept of phasic volume fraction, denoted as . The sum of the space
fraction occupied by each of the phase equals one. The phasic volume fraction equation
is given by:
(2.10)
Where represents the total number of phases and represents the volume fraction
of each phase, q (q=g, gas phase and q=s, solid phase).
The effective density of phase q is
(2.11)
Where is the physical density of phase q.
The Eulerian-Eulerian model allows for incorporation of multiple secondary solids
phases. The conservation of mass and momentum are satisfied, respectively, for each
phase. Thus, the Eulerian-Eulerian model solves a set of n continuity and momentum
equations, which forces this approach to be one of the most complex and computation
costing multiphase model.
Conservation of mass
The continuity equation for phase q is
(2.12)
Where n_p is the number of phases and characterizes the mass transfer form phase
p to phase q, and characterizes the mass transfer from phase q to phase p. means
a mass source term for phase q, which is zero by default.
For a batch mode fluidized bed granulation with no mass transfer between gas and solid,
the continuity equations for phase q (q=g for gas phase, q=s for solid phase) can be

Chapter 2
34
written as
(2.13)
Conservation of momentum
The momentum balance equations for the gas phase can be written as:
(2.14)
Where represents the number of solid phases. The first term on the left hand side of
equation (2.14) means the unsteady acceleration and the second term represents the
convective acceleration of the flow. The first term on the right hand of momentum
equation accounts for pressure changes, where is the pressure shared by all phases.
The second term on the right hand side is stress-strain tensor term, given by
(2.15)
Where is the viscosity of gas phase g. The bulk viscosity of a fluid is a measure of
the difference between the thermodynamic mechanical pressures and for a Newtonian
fluid (e.g. air), the bulk viscosity is set to zero in what is referred to as the Stokes’
assumption. is the transpose of the velocity gradient, and is the identity matrix.
The third term on the right hand side of equation (2.14) means the effect of gravitational
force. The fourth term includes the interaction force between gas and solid phase, and
effect of mass transfer between phases. The final term on the right hand side includes an
external body force , a lift force, , and a virtual mass force, .
For the study in this thesis, there are one gas phase and one solid phase, and the mass
transfer terms, external body force, lift force, and virtual mass force terms are all zero,
simplifying the momentum equation for the gas phase to the following form:
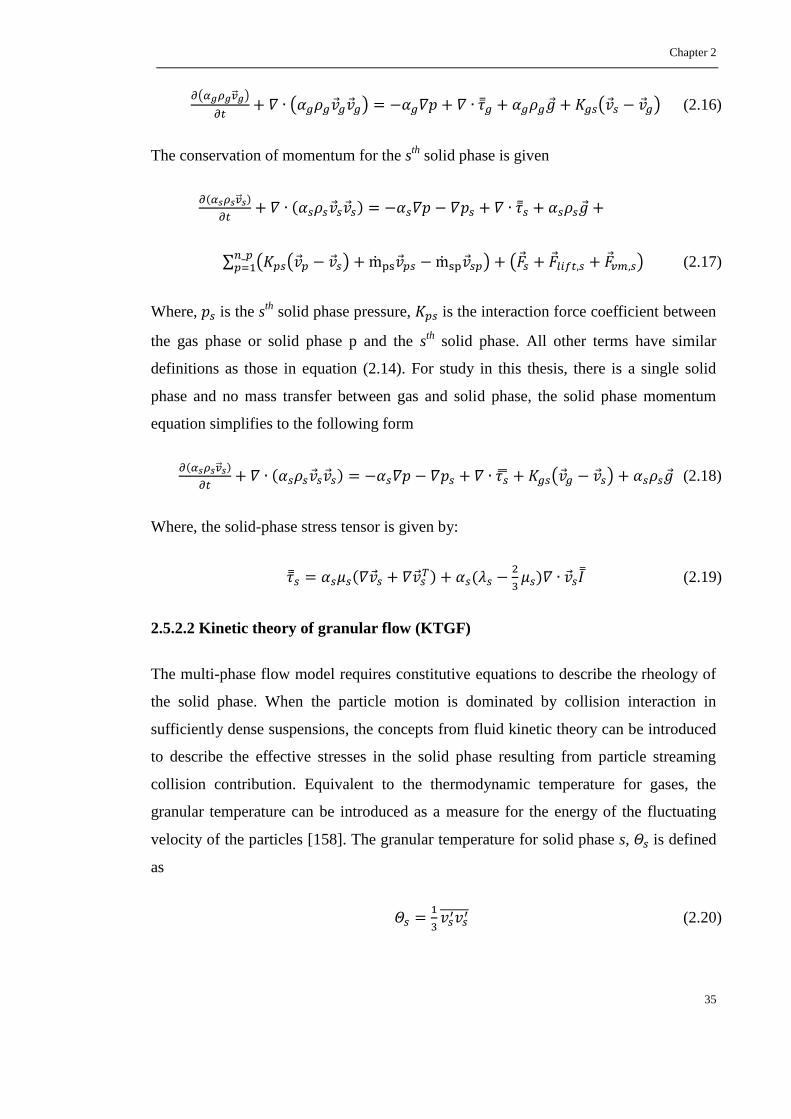
Chapter 2
35
(2.16)
The conservation of momentum for the sth
solid phase is given
(2.17)
Where, is the sth
solid phase pressure, is the interaction force coefficient between
the gas phase or solid phase p and the sth
solid phase. All other terms have similar
definitions as those in equation (2.14). For study in this thesis, there is a single solid
phase and no mass transfer between gas and solid phase, the solid phase momentum
equation simplifies to the following form
(2.18)
Where, the solid-phase stress tensor is given by:
(2.19)
2.5.2.2 Kinetic theory of granular flow (KTGF)
The multi-phase flow model requires constitutive equations to describe the rheology of
the solid phase. When the particle motion is dominated by collision interaction in
sufficiently dense suspensions, the concepts from fluid kinetic theory can be introduced
to describe the effective stresses in the solid phase resulting from particle streaming
collision contribution. Equivalent to the thermodynamic temperature for gases, the
granular temperature can be introduced as a measure for the energy of the fluctuating
velocity of the particles [158]. The granular temperature for solid phase s, is defined
as
(2.20)

Chapter 2
36
Where is the particle fluctuating velocity of s
th solid phase.
A transport equation of granular temperature for the sth
solid phase is proportional to the
kinetic energy of the random motion of the particles. The transport equation derived
from kinetic theory according to Ding and Gidaspow’s model [159] is give as follows:
(2.21)
Where is the generation of energy by the solid stress tensor,
represents the diffusion of energy, with the diffusion coefficient for granular energy
is given by Syamlal et al. [160], which is also used in the CFD study of this thesis:
(2.22)
Where,
(2.23)
Where is the coefficient of restitution for particle collision.
An alternative expression of the diffusion coefficient for granular energy is developed
by Gidaspow et al. [161]:
(2.24)
The collisional dissipation of energy, , represents the rate of energy dissipation
within the sth
solid phase due to collisions between particles. This term is modeled using
the correlation by Lun et al. [162], which is utilized in the CFD study of this thesis:
(2.25)
An alternative option of is developed by Gidaspow et al. [158] and given as
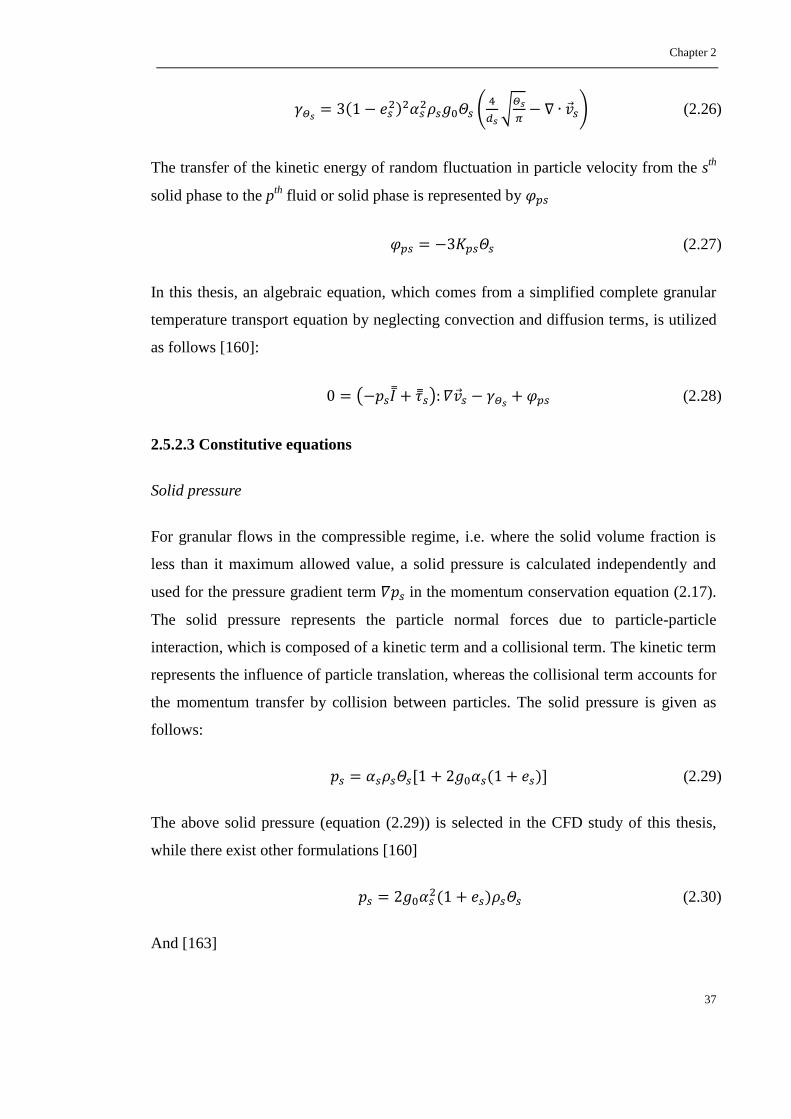
Chapter 2
37
(2.26)
The transfer of the kinetic energy of random fluctuation in particle velocity from the sth
solid phase to the pth
fluid or solid phase is represented by
(2.27)
In this thesis, an algebraic equation, which comes from a simplified complete granular
temperature transport equation by neglecting convection and diffusion terms, is utilized
as follows [160]:
(2.28)
2.5.2.3 Constitutive equations
Solid pressure
For granular flows in the compressible regime, i.e. where the solid volume fraction is
less than it maximum allowed value, a solid pressure is calculated independently and
used for the pressure gradient term in the momentum conservation equation (2.17).
The solid pressure represents the particle normal forces due to particle-particle
interaction, which is composed of a kinetic term and a collisional term. The kinetic term
represents the influence of particle translation, whereas the collisional term accounts for
the momentum transfer by collision between particles. The solid pressure is given as
follows:
(2.29)
The above solid pressure (equation (2.29)) is selected in the CFD study of this thesis,
while there exist other formulations [160]
(2.30)
And [163]

Chapter 2
38
(2.31)
Solid bulk viscosity
The solid bulk viscosity accounts for the resistance of the granular particles to
compression and expansion. It has the following form from Lun et al. [162] and used in
this thesis:
(2.32)
Radial distribution function
The radial distribution function, is a correction factor that modifies the probability of
collision between particles when the solid granular phase become dense. This function
may also be interpreted as the non-dimensional distance between spheres:
(2.33)
Where s is the distance between particles. From equation (2.33) it can be seen that for a
dilute solid phase , therefore . In the dense solid phase where ,
. In the literature, there are several formulations for the radial distribution
function as follows and equation (2.34) is utilized in the CFD study of this thesis.
For case with one solid phase, use [164]
(2.34)
For case with more than one solid phase
(2.35)
Where

Chapter 2
39
(2.36)
And k is solid phase only.
Another formulation developed by [165]
(2.37)
Also available [163]
(2.38)
The following equation [160] is available
(2.39)
Solid shear stresses
The solid stress tensor contains shear and bulk viscosities arising from particle
momentum exchange due to translation and collision. A frictional component of
viscosity can be included to account for the viscous-plastic transition that occurs when
particle of a solid phase reach the maximum solid volume fraction. The solid shear
stress includes collisional part, kinetic parts and frictional part as follows:
(2.40)
The collisional part of the shear viscosity is modeled as [160, 161]
(2.41)
Two kinds of kinetic viscosity expressions are summarized as follows[160, 161]:

Chapter 2
40
(2.42)
(2.43)
The frictional viscosity is calculated as follows:
(2.44)
Where, is the angle of internal friction and is the second invariant of the deviatoric
stress tensor.
In the CFD study of this thesis, the combination of equation (2.41), (2.43) and (2.44) are
used.
2.5.2.4 Gas-solid interaction
It can be seen in equation (2.16) and (2.18) that momentum exchange between gas and
solid phase is based on the gas-solid interaction force coefficient . The gas-solid
momentum exchange coefficient can be written in general form as:
(2.45)
Where f is defined depending on the different exchange-coefficient models, and is the
particulate relaxation time and is defined as
(2.46)
Where is the diameter of particles of phase s.
Teaters [166] presented a detailed summary of various drag model that are popular used
for predicting gas-solid interactions which is given in Table 2.5. In this thesis, the
momentum transfer between the gas and solid phases is described by the empirical drag
law developed by Gidaspow et.al [158].
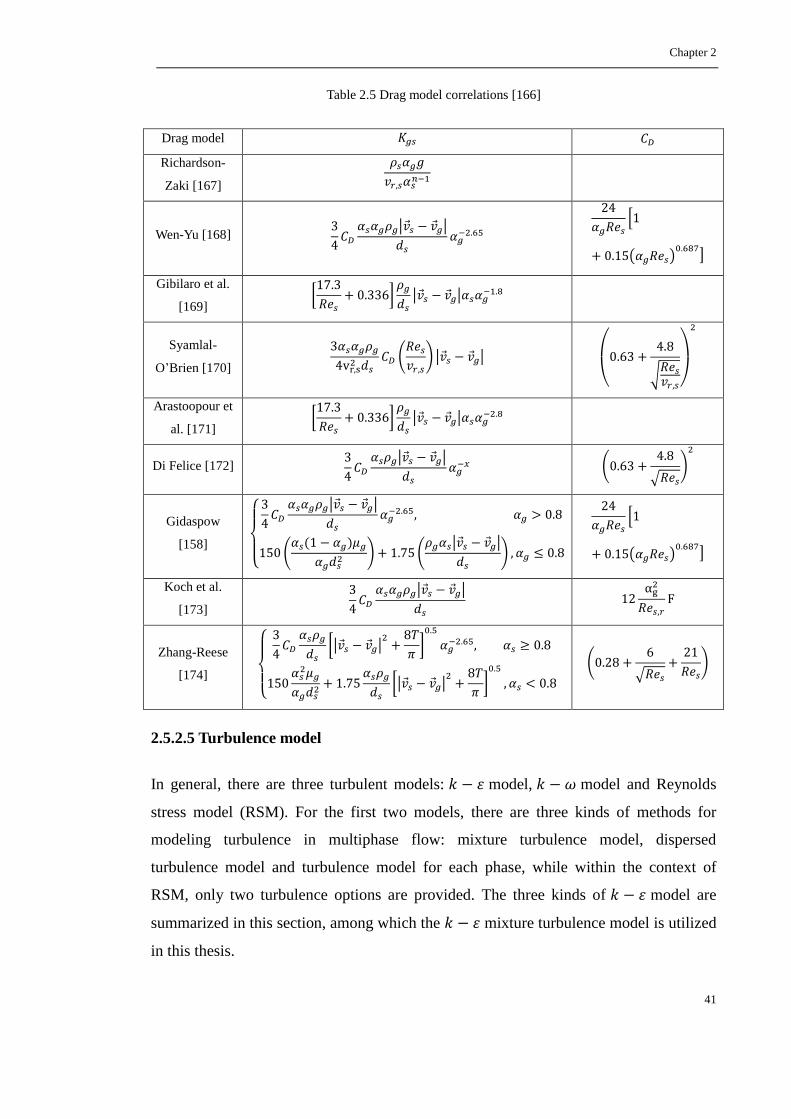
Chapter 2
41
Table 2.5 Drag model correlations [166]
Drag model
Richardson-
Zaki [167]
Wen-Yu [168]
Gibilaro et al.
[169]
Syamlal-
O’Brien [170]
Arastoopour et
al. [171]
Di Felice [172]
Gidaspow
[158]
Koch et al.
[173]
Zhang-Reese
[174]
2.5.2.5 Turbulence model
In general, there are three turbulent models: model, model and Reynolds
stress model (RSM). For the first two models, there are three kinds of methods for
modeling turbulence in multiphase flow: mixture turbulence model, dispersed
turbulence model and turbulence model for each phase, while within the context of
RSM, only two turbulence options are provided. The three kinds of model are
summarized in this section, among which the mixture turbulence model is utilized
in this thesis.
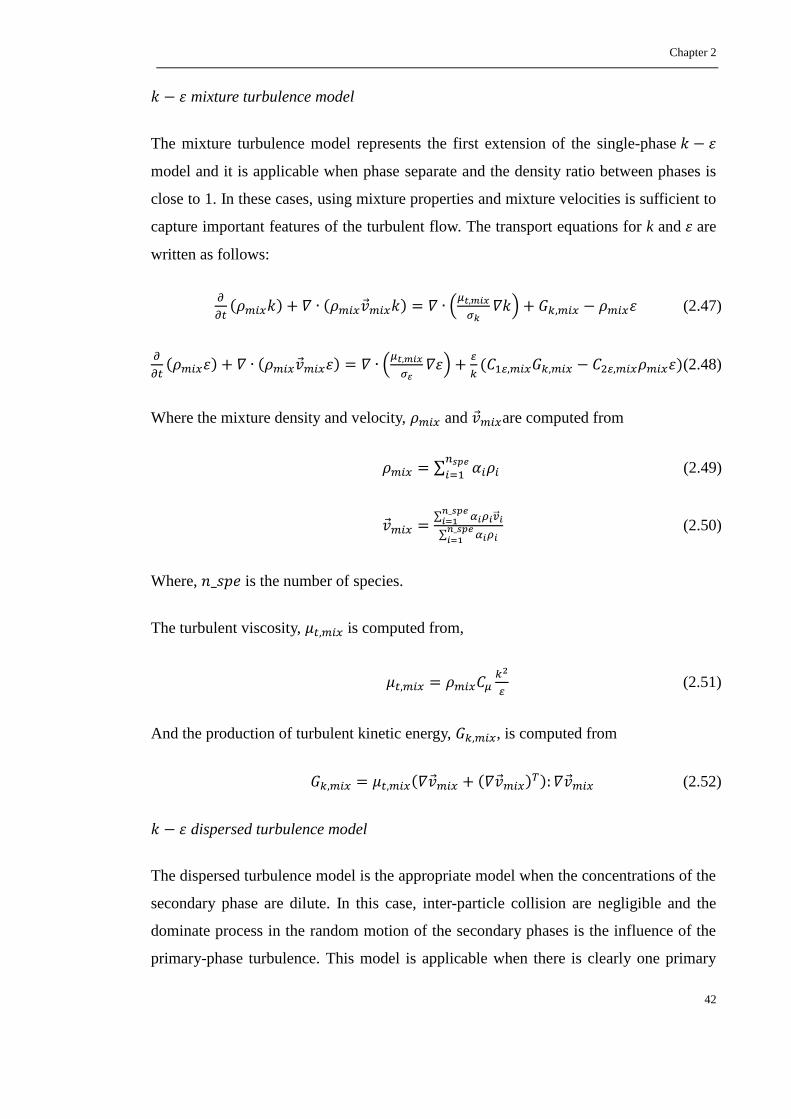
Chapter 2
42
mixture turbulence model
The mixture turbulence model represents the first extension of the single-phase
model and it is applicable when phase separate and the density ratio between phases is
close to 1. In these cases, using mixture properties and mixture velocities is sufficient to
capture important features of the turbulent flow. The transport equations for k and are
written as follows:
(2.47)
(2.48)
Where the mixture density and velocity, and are computed from
(2.49)
(2.50)
Where, is the number of species.
The turbulent viscosity, is computed from,
(2.51)
And the production of turbulent kinetic energy, , is computed from
(2.52)
dispersed turbulence model
The dispersed turbulence model is the appropriate model when the concentrations of the
secondary phase are dilute. In this case, inter-particle collision are negligible and the
dominate process in the random motion of the secondary phases is the influence of the
primary-phase turbulence. This model is applicable when there is clearly one primary
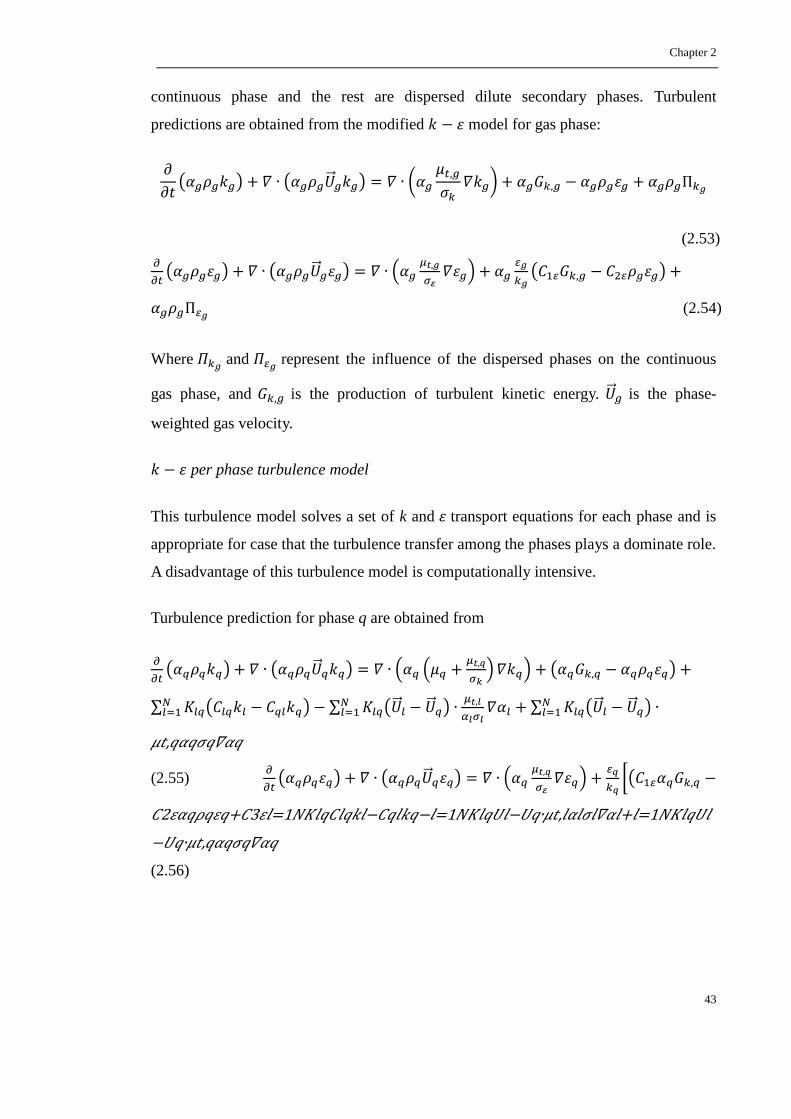
Chapter 2
43
continuous phase and the rest are dispersed dilute secondary phases. Turbulent
predictions are obtained from the modified model for gas phase:
(2.53)
(2.54)
Where and represent the influence of the dispersed phases on the continuous
gas phase, and is the production of turbulent kinetic energy. is the phase-
weighted gas velocity.
per phase turbulence model
This turbulence model solves a set of k and transport equations for each phase and is
appropriate for case that the turbulence transfer among the phases plays a dominate role.
A disadvantage of this turbulence model is computationally intensive.
Turbulence prediction for phase q are obtained from
,
(2.55)
2 + 3 =1 =1 , + =1
,
(2.56)

Chapter 2
44
2.5.3 Coupled CFD-PBM model
Usually, the assumption of a spatially homogeneous (well-mixed) system is employed in
development of population balance models. However, since powder characteristics and
essential hydrodynamics and kinetic parameters regarding the size enlargement process
are changing with time and position in the fluidized bed, the population balance model
based on homogeneity cannot be applied for the whole fluidized bed granulation
process and be applied for a priori design and scale-up of fluidized bed granulation
process [24]. For instance, wetting of the particles is usually limited to a certain portion
(i.e. 30%) of the fluidized bed and as a result, fluidizing gas velocity and particle
properties with respect to different zones or regions of the fluidized bed granulator
would be different [56, 175, 176].
In order to rigorously account for particle-related phenomena (e.g. agglomeration and
breakage), the population balance model (PBM) must be solved along with the
continuity and momentum balance equations, which gives huge potential of the
combined CFD-PBM research. The solid volume fraction, particle velocity and
temperature calculated from the Navier-Stokes transport equations by CFD are used to
solve the PBM, because they are related to the particle growth, aggregation, and
breakage [177, 178]. Once the population balance equations are solved, results of PBM
can be used to calculate the Sauter mean diameter to further modify the gas-solid
interaction in the multiphase flow model and hence update the information of solid
volume fraction, particle velocity, and temperature for PBM. Recently, some hybrid
CFD models have been developed to describe gas-solid flow field, as well as the
particle population balance equation for particle size distribution (PSD) in fluidized bed
reactors, which is called CFD-PBM coupled models [15, 179-183]. Notably, Fan et. al.
[180, 181] started to use the CFD-PBM coupled models to simulate poly-disperse gas-
solid fluidized bed reactors (FBRs). In their work, the quadrature method of moments
(QMOM) and direct quadrature method of moments (DQMOM) were used to solve the
PBM, and they were implemented in a multi-fluid model to simulate poly-disperse gas-
solid FBRs. Rajniak’s work [15] presented an direct comparison between the CFD-
PBM coupled model and homogeneous PBM, in which the QMOM is employed to
Chapter 2
45
solve the CFD-PBM coupled model and homogeneous PBM.
However, this CFD-PBM coupled model has the same disadvantage as the CFD model
of expensive computational time and, due to the complex fluid dynamics of spray
fluidized bed granulation, attempts to incorporate the PBM into multi-fluid model to
describe the evolution of the particle size distribution in a fluidized bed granulator are
still very limited.
2.5.4 Multi-compartmental PBM model
Based on the analysis above, CFD simulations present huge advantages on predicting
the multiphase flow hydrodynamics of fluidized bed granulation, while they have the
main problems of expensive computation cost and no continuous model output, which
are essential for model based system control. For example, it has been reported that to
compute 30s in real time for the precipitation process, the fully coupled CFD-PBM
simulation takes nearly 60 days and simulation relying on frozen flow field obtained by
switching off flow and turbulence equations after reaching quasi-steady state requires
about 21 minutes. Hence, the multi-compartmental PBM model emerges as potential to
reduce computational time and to be applied for control, in the mean time, considering
local hydrodynamics of different region of fluidized bed granulator. In the multi-
compartmental PBM model, the fluidized bed granulator is divided into different
compartments according the gas-solid fluid dynamics study. Each region is assumed as
homogeneous, based on which the one-dimensional PBM is implemented on each
region to predict the local particle growth and particle size distribution evolution,
considering particles communicating between neighbor regions. The number of regions
is determined by experimental measurement, CFD simulation or empirical experience.
Until now, only very limited literatures could be found about the multi-compartmental
PBM study, especially on the application of spray fluidized bed granulation [184-186].
Tuichiuli et al. [185] divided the fluidized bed granulator into three different zones:
wetting-active zone, isothermal zone and hear transfer zone by experimental
measurement of the bed humidity. A two-zone PBM was developed in their work by
considering particle layering growth and agglomeration in the wetting-active zone and
Chapter 2
46
only particle exchange happened in the other two zones. A two-compartmental PBM
study of bottom-spray wurster fluidized bed granulation was carried out by Matthias et
al. [184] considering particle growth in the spray compartment. Mubashir et al. divided
the fluidized bed granulator into two compartments: spraying zone and dying zone. A
fundamental study of the two-compartmental PBM model was carried out by
considering particle agglomeration happening on the spraying zone and comparison was
done between the one-compartment PBM and two-compartmental PBM. However, all
the local gas-particle fluid dynamics and particle communicating of above study are
based on empirical equation and so far, to the author’s knowledge, no multi-
compartmental research combined with CFD simulation has been found on the study of
spray fluidized bed granulation.
2.6 Control of fluidized bed granulation
Fluidized bed granulation is a complex interaction process, which is affected by a large
number of factors: operating variables, material properties and equipment parameters.
Any subtle change of these variables may give rise to huge deterioration in final
granules quality and result in energy and material waste. Therefore, accurate control
strategy is required to improve the quality of final granules and consistency of
granulation process. The necessarity of tight control for granulation process has been
identified [57, 187].
While many papers focusing on the modelling of the granulation system, the literature
in the field of control of fluidized bed spray granulation process is somewhat limited.
One of the most important issues for the effective control of granulation process is the
development of fast and reliable measurement techniques for characterization of the
particulate system. Usually, particle size, size distribution, and shape of granules are the
most frequently used objective variables, of which, however, the direct measurement is
very difficult. Hence, some indirect monitoring parameters have been adopted as the
indicators of particle characteristics, such as moisture content [188, 189], and power
consumption [57]. Although the measurement of moisture or power consumption is a
reliable method to monitor the granule growth indirectly, it is susceptible to the
disturbance in powder properties and the operating conditions. However, the emergence

Chapter 2
47
of the imaging process system effectively solved this problem and the particle
characteristics can be considered as objective variables directly [190, 191].
Basically, the control strategies of granulation process can be divided into two
categories: model based control [192-194] and un-model based control [188, 190, 191],
which are distinguished with whether an accurate mathematical model is needed.
2.6.1 Model based control
In order to accurately control the granulation process, in some cases, the mathematical
models are needed, of which model predictive control has been suggested by Gatzke
and Doyle [192] and has been used most frequently. Model predictive control (MPC),
also referred to as moving horizon control or receding horizon control, has become an
attractive control strategy in fluidized bed granulation, which is based on a family of
MPC algorithms in which models are utilized to predict the future system response. At
each control interval an MPC algorithm attempts to optimize future plant behavior by
computing a sequence of future manipulated variable adjustments. The first control
move of calculated optimal inputs is then sent into the plant, and the entire calculation is
repeated at subsequent control intervals. According to the model, two kinds of model
predictive control strategies are distinguished: linear MPC [192-194] and non-linear
MPC [195], of which linear MPC is used most popularly.
For the linear MPC, in the area of top spray fluidized bed granulation, there are very
few applications in open literature [192-194]. In these linear MPC applications, an
empirical, linear model obtained by fitting to process data is implemented to calculate
the optimal control horizon of the input variables. Because of the complex nonlinearity
of the population balance model, to date, there are very limited literatures of nonlinear
MPC utilizing population balance model [195]. In these works mentioned above, the
most common manipulated variable is binder flow rate, and the objective variables are
bulk density, particle size distribution, and control effort. In real systems, some process
output has constraints and some control objectives are much more important than other
objectives, which can be solved by introducing the soft output constraint and prioritized
control objectives [192]. The main advantage of model predictive control is that it can

Chapter 2
48
accommodate with multivariable input-output systems and systems with process
constraints. For the complex systems that the mathematical model is difficult to extract,
the application of model predictive control is impossible.
2.6.2 Un-model based control
Besides the model-based control strategy, there are a number of practical control
schemes in the granulation area, which do not rely on mathematical models. Recently,
the development of intelligent methods makes them possible to be used in modelling
and controlling the complex granulation systems, for example, fuzzy logic [188, 190,
191]. In addition, there are several works presenting the application of simple feedback
control, such as PID control, in fluidized bed granulation [194].
Fuzzy logic control of fluidized bed granulation
The fuzzy logic control is to calculate the manipulated variables through a fuzzy logic
algorithm to achieve the control objective. For the objective variable of granule size, a
control system using fuzzy logic is designed and implemented to control granule growth
in the fluidized bed granulation [190, 191]. In this control system, the image processing
system was used for direct monitoring of number median granule size with high
accuracy. For the fuzzy controller, there are two input variables: (1) deviation between
desired granule size and measured value, and (2) the changing rate of this deviation. The
IF-THEN algorithm is used and the result of fuzzy reasoning is used to control the
output power of liquid feed pump, considering four fuzzy variables: ZR (zero), PS
(positive small), PM (positive medium) and PL (positive large). The selection of the
moisture content of granules during fluidized bed granulation as the objective variable
has also been successfully implemented using the fuzzy logic controller [188].
Simple feedback control
With the development of measurement techniques, information about the particle
distribution can be obtained on-line and sent back quickly, which is really a key factor
of feedback control. To date, there are several applications about feedback control [189,
196]. Mont et al. [196] developed a feedback control strategy to control the level of
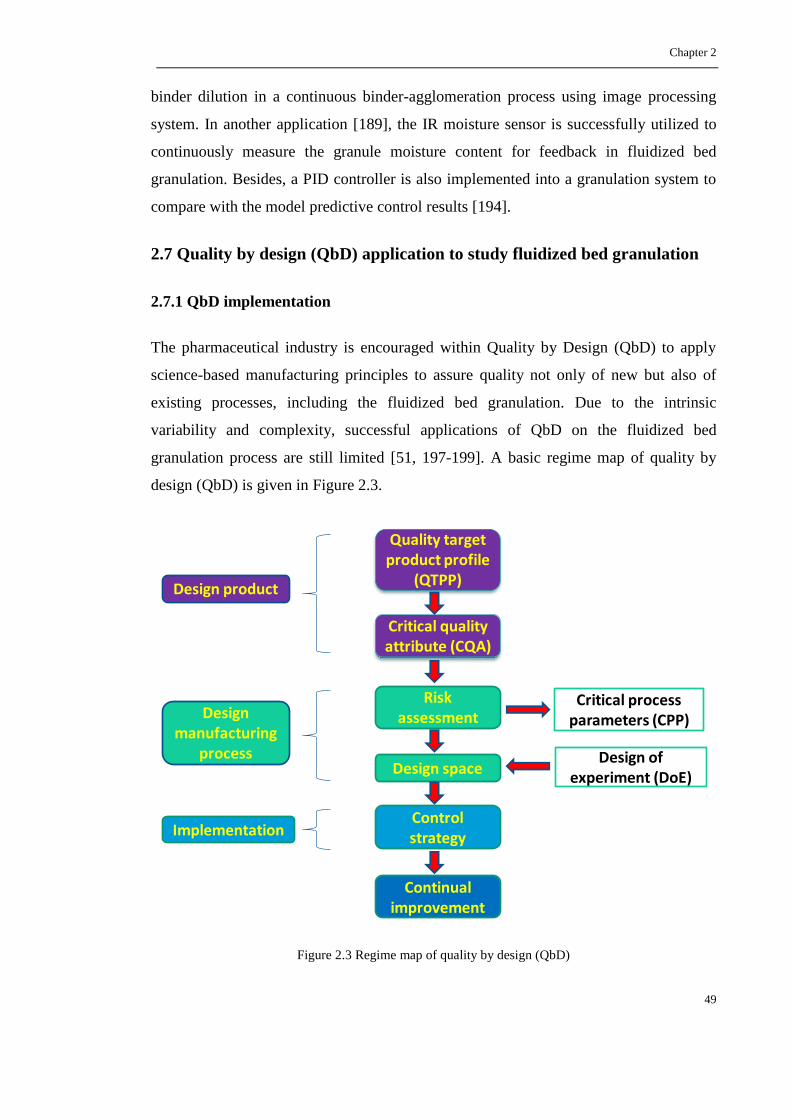
Chapter 2
49
binder dilution in a continuous binder-agglomeration process using image processing
system. In another application [189], the IR moisture sensor is successfully utilized to
continuously measure the granule moisture content for feedback in fluidized bed
granulation. Besides, a PID controller is also implemented into a granulation system to
compare with the model predictive control results [194].
2.7 Quality by design (QbD) application to study fluidized bed granulation
2.7.1 QbD implementation
The pharmaceutical industry is encouraged within Quality by Design (QbD) to apply
science-based manufacturing principles to assure quality not only of new but also of
existing processes, including the fluidized bed granulation. Due to the intrinsic
variability and complexity, successful applications of QbD on the fluidized bed
granulation process are still limited [51, 197-199]. A basic regime map of quality by
design (QbD) is given in Figure 2.3.
Figure 2.3 Regime map of quality by design (QbD)
Critical process parameters (CPP)
Design of experiment (DoE)
Quality target product profile
(QTPP)
Critical quality attribute (CQA)
Risk assessment
Design space
Control strategy
Continual improvement
Design product
Design manufacturing
process
Implementation
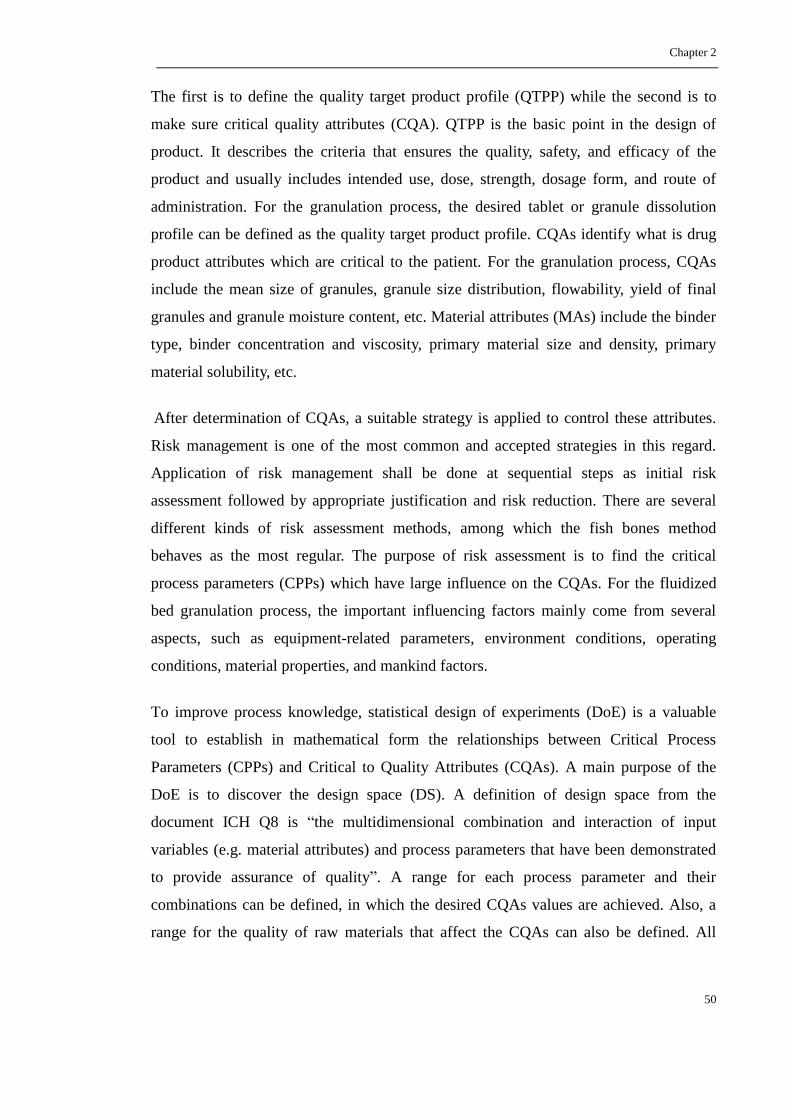
Chapter 2
50
The first is to define the quality target product profile (QTPP) while the second is to
make sure critical quality attributes (CQA). QTPP is the basic point in the design of
product. It describes the criteria that ensures the quality, safety, and efficacy of the
product and usually includes intended use, dose, strength, dosage form, and route of
administration. For the granulation process, the desired tablet or granule dissolution
profile can be defined as the quality target product profile. CQAs identify what is drug
product attributes which are critical to the patient. For the granulation process, CQAs
include the mean size of granules, granule size distribution, flowability, yield of final
granules and granule moisture content, etc. Material attributes (MAs) include the binder
type, binder concentration and viscosity, primary material size and density, primary
material solubility, etc.
After determination of CQAs, a suitable strategy is applied to control these attributes.
Risk management is one of the most common and accepted strategies in this regard.
Application of risk management shall be done at sequential steps as initial risk
assessment followed by appropriate justification and risk reduction. There are several
different kinds of risk assessment methods, among which the fish bones method
behaves as the most regular. The purpose of risk assessment is to find the critical
process parameters (CPPs) which have large influence on the CQAs. For the fluidized
bed granulation process, the important influencing factors mainly come from several
aspects, such as equipment-related parameters, environment conditions, operating
conditions, material properties, and mankind factors.
To improve process knowledge, statistical design of experiments (DoE) is a valuable
tool to establish in mathematical form the relationships between Critical Process
Parameters (CPPs) and Critical to Quality Attributes (CQAs). A main purpose of the
DoE is to discover the design space (DS). A definition of design space from the
document ICH Q8 is “the multidimensional combination and interaction of input
variables (e.g. material attributes) and process parameters that have been demonstrated
to provide assurance of quality”. A range for each process parameter and their
combinations can be defined, in which the desired CQAs values are achieved. Also, a
range for the quality of raw materials that affect the CQAs can also be defined. All
Chapter 2
51
likely combinations of raw material attributes and process parameters that need to be
realized by the process, to ensure that the CQAs stay within the required ranges, can be
called the Design Space (DS) of the process. After the DS is determined, the control
strategy can be developed for the granulation process introduced in chapter 4 [200] and
further the control space (CS) can be determined.
2.7.2 Role of model in Process understanding by QbD
In the pharmaceutical industry, historically very conservative in technological aspects,
there has been an effort to promote technological advances and increase process
flexibility, if one can demonstrate enhanced process understanding, to assure products
of better quality. One of these initiatives is known as Quality by Design (QbD). Quality
by Design (QbD) was firstly introduced to the pharmaceutical industry in 2006 by the
International Conference on Harmonization (ICH) Q8 guidance [201]. In the ICH Q8
(R2) guidance [202], QbD is defined as “a systematic approach to development that
begins with predefined objectives and emphasizes product and process understanding
and process control, based on sound science and quality risk management.” This
framework represents a move away from the traditional approach in the industry of
“quality by testing” (QbT). QbD is a comprehensive approach targeting all phases of
drug discovery, manufacture, and delivery. The aim is to improve the quality and reduce
the costs of medicines for consumers. It has been recognized that a consistent and well-
controlled granulation process in a fluidised bed processor requires a thorough
understanding of the complex influence of various factors on critical granule attributes
and identification of the design space, as opposed to the traditional reliance on operator
experience. For pharmaceutical manufacturing processes, QbD could well be
paraphrased as the application of fit-for-purpose engineering models to the design and
scale-up of active pharmaceutical ingredient (API) production and dosage form
manufacturing processes. The goal is to improve product quality and process efficiency.
Process characterization under QbD involves three key steps: first, a risk assessment is
performed to identify the relevant CPPs and CMAs; second, design of experiments
(DoE), so that the effects of CPPs and CMAs on CQAs can be quantified and third, the
results are analyzed to generate accurate models, relating each CQA with the relevant

Chapter 2
52
CPP/CMA, which are used to generate the design space. In the case of top-spray
fluidized bed granulation, theoretical models often comprise two types: empirical model
from operating to granule properties used for analysis influence of operating conditions
on granules properties, and mechanical model from operating conditions to granule size
distribution by population balance model used to analysis the particle formation and
breakage mechanisms during granulation. Particularly for the last two steps of QbD
shown in Figure 2.3, appropriate mathematical modeling tools are necessary to work
through these steps. The benefit of using mathematical modeling during pharmaceutical
development should be seen as reduced experimentation and reduced developmental
resources. Accordingly, modeling would be the tool that allows both to guide smart
decisions about the fit-for-purpose experimentation and to provide increased process
understanding by formalizing in mathematical terms the relationships between variables
[203]. On the other hand, mathematical modeling can be considered as important PAT
tool. As a consequence, models can be used to support development activities, in order
to accelerate the lunch of new products in the market, but also to improve the
productivity and to control the product quality in manufacturing environment [203].
2.7.3 Design of experiments (DoE)
Design of experiments which is one of key elements of the Quality by Design principle
has been used to study a fluidized bed granulation process [65, 197, 204]. Use of design
of experiments allows for testing a large number of factors simultaneously and
precludes the use of a huge number of independent runs when the traditional step-by-
step approach is used. Systematic optimization procedures can be carried out by
selecting an objective function, finding the most important or contributing factors and
investigating the relationship between responses and factors. Currently there are very
few studies using a design of experimental approach to investigate a pulsed spray
fluidized bed granulation process, in particular, the effect of pulsed frequency on the
granule properties and its interaction with other process parameters.
Basically, there are two kinds of DoE: screening DoE and optimization DoE. Screening
DoE aims to identify the CPPs and CQAs together with a deeper understanding of the
process, which can be considered as part of risk analysis. Optimization DoE aims to

Chapter 2
53
determine the ranges of operating parameters for design space and considers more
complex situations, such as the quadratic terms of variables, comparing with screening
DoE.
Full factorial design
A full factorial design contains all possible combinations of a set of factors. This is the
most fool proof design approach, but it is also the most costly in experimental resources.
In full factorial designs, you perform an experimental run at every combination of the
factor levels. The sample size is the product of the numbers of levels of the factors. For
example, a factorial experiment with a two-level factor, a three-level factor, and a four-
level factor has 2 x 3 x 4 = 24 runs. Full factorial designs are the most conservative of
all design types. There is little scope for ambiguity when you are willing to try all
combinations of the factor settings. Unfortunately, the sample size grows exponentially
in the number of factors, so full factorial designs are too expensive to run for most
practical purposes.
Fractional factorial design
This design method could be utilized for fitting the process model which includes the
interactions terms and linear terms. Fractional factorial designs are expressed using the
notation , where is the number of levels of each factor investigated, is the
number of factors investigated, and p describes the size of the fraction of the full
factorial used. Formally, p is the number of generators, assignments as to which effects
or interactions are confounded, i.e., cannot be estimated independently of each other. A
design with p such generators is a fraction of the full factorial design. For example,
a design is 1/4 of a two level, five factor factorial design. Rather than the 32 runs
that would be required for the full factorial experiment, this experiment design
requires only eight runs. In practice, one rarely encounters levels in fractional
factorial designs, since response surface methodology is a much more experimentally
efficient way to determine the relationship between the experimental response and
factors at multiple levels.

Chapter 2
54
Response surface methodology (RSM)
Response surface methodology (RSM) is one of the popular methods in design of
experiments, which involves the use of different types of experimental designs to
generate polynomial mathematical relationships and mapping of the response over the
experimental domain to select the optimal process parameters [205]. This design
method includes three kinds of central composite designs and Box-Behnken designs
(Figure 2.4), which can be applied for the third model to give an optimum point of the
variables to the response.
Figure 2.4 Response surface methodology methods. (a) Circumscribed design (b) Inscribed design (c)
Faced design (d) Box-Behnken design
Box-Behnken statistical design is one type of RSM designs, which is an independent,
rotatable or nearly rotatable, quadratic design having the treatment combinations at the
midpoints of the edges of the process space and at the centre [206, 207]. Box-Behnken
(a) (b)
(c) (d)

Chapter 2
55
experimental design was used to optimize and evaluate main effects, interaction effects
and quadratic effects of the process variables on the quality of granules. A significant
advantage of Box-Behnken statistical design is that it is a more cost-effective technique,
which requires fewer experimental runs and less time for optimization of a process,
compared with other techniques such as central composite design, 3-level factorial
design and D-optimal design.
For the response surface methodology involving Box-Behnken design, a total of 15
experiments were designed for three factors at three levels of each parameter shown in
Table 2.6.
Table 2.6 Experiment table by the Box-Behnken experimental design
Run Independent variables (levels)
Mode X1 X2 X3
1 −−0 -1 -1 0
2 −0− -1 0 -1
3 −0+ -1 0 1
4 −+0 -1 1 0
5 0−− 0 -1 -1
6 0−+ 0 -1 1
7 000 0 0 0
8 000 0 0 0
9 000 0 0 0
10 0+− 0 1 -1
11 0++ 0 1 1
12 +−0 1 -1 0
13 +0− 1 0 -1
14 +0+ 1 0 1
15 ++0 1 1 0
This design is equal to the three replicated centre points and the set of points lying at the
midpoint of each surface of the cube defining the region of interest of each parameter,
as described by the red points in Figure 2.4 (d). The non-linear quadratic model
generated by the design is given as
Chapter 2
56
(2.57)
where, Y is a measured response associated with each factor level combination; is an
intercept; to are regression coefficients calculated from the observed
experimental values of Y; and , and are the coded levels of independent
variables. The terms , , and (i=1, 2, 3) represent the interaction and
quadratic terms, respectively.
2.8 Study of pulsed top-spray fluidized bed granulation
In fluidized bed granulation, it would be not easy to control the granule size directly
because of difficulty in in-line particle size determination. The moisture content in the
bed is the key parameter to control because it is the most critical factor influencing
overall process performance [57]. In order to control the moisture content in the bed, the
binder spray rate is often adjusted during the granulation process. Recently it has been
found that a pulsed spray has more potential for controlling the granulation process to
determine the quality of final product and to target the end particle size in fluidized bed
granulation [50-52].
During the fluidized bed granulation, the liquid binder is sprayed into the bed by an
atomizer in two modes: continuous spraying and pulsed spraying. Continuous spraying
is to spray the binder solution into the fluidizing bed continuously from the beginning of
experiment, which is utilized for most of the experimental study of fluidized bed
granulation. Pulsed spraying is to interrupt the binder feed in a regular sequence during
the spraying phase, which makes the powder materials in the fluidized bed undergoing
intermittent drying and wetting, resulting in a better control of the humidity within the
granulation chamber.
A spray cycle includes two stages: a spraying phase in which the pump is turned on to
spray the binder solution on the bed for a predetermined time and a pulsed phase in
which the pump is turned off to stop spraying the binder solution for a predetermined
time. The previous spray cycle ends and the next one starts again. Repeated spray cycles
Chapter 2
57
make the spray pulsed. In a spray circle, the ratio of the pulsed and spraying time is
called pulsed frequency, which is normally controlled by a computer in experiments.
For example, a pulsed frequency is zero, showing that the binder solution is sprayed
continuously, and the pulsed frequency is 1, indicating that the binder solution is
sprayed for half spray circle and stops for another half circle.
For the literature, until now, only very limited publications could be found on the
investigation of influence of pulsed spraying [50-52]. It was found that shorting the
spraying period affected the bed moisture level but did not influence the growth rate and
final granule size when the amount of granulation liquid was constant [50]. It was found
that the pause time of liquid feed can be used to compensate the change of liquid feed
rate and inlet air humidity, in order to maintain the median granule size [52]. It was also
indicated that the liquid feed pulsing decreased the median granule size clearly and
broadened the size distribution slightly when the liquid feed rate and relative humidity
were constant, which may be explained by the attrition of granules during the pulsed
spraying time [52]. All above experiments are based on varying pulsed frequency. In
another study using fixed pulsed frequency [51], it was found that by varying the spray
circle, it is also possible to control granule nucleation and growth. Through above
analysis, it can be seen clearly that the pulsed binder spray is a useful tool to achieve the
targeted final product size and is a straightforward tool in process control of the
fluidized bed granulation
2.9 Chapter conclusions
In this chapter, a full literature review of the study of fluidized bed granulation is
presented. At the beginning, the granulation mechanisms are introduced. Subsequently,
the experimental study is summarized, including the influence of process-related
parameters and material-related properties. The modelling studies of the fluidized bed
granulation process are presented from two aspects: population balance modelling and
computational fluid dynamics modelling. The limited study of the coupled CFD-PBM
model is also investigated and the multi-compartmental PBM is introduced. The control
study and application of quality by design (QbD) study of fluidized bed granulation
were summarized. Finally, the pulsed binder spray in literature was summarized.

Chapter 3
58
Chapter 3 Experimental study of pulsed spray fluidized bed
granulation
3.1 Chapter overview
In this thesis, the purpose of experiments is to study the influence of three operating
parameters of spray pulse frequency, binder spray rate and atomization pressure on the
final granule properties, such mean size, flowability, and particle yield.
In this chapter, all the experiments carried out in this thesis are introduced, including the
materials, experimental apparatus, operating method, and end granules properties
characterization. 15 experiments are designed using the Box-Behnken experimental
design method and 4 validation experiments are also carried out to validate the
developed mathematical models. Three operating parameters of spray pulsed frequency,
binder spray rate and atomization pressure are selected to investigate their influence on
the final granule properties.
3.2 Materials and methods
3.2.1 Materials
The powder used for granulation was microcrystalline cellulose (MCC) supplied by
(Blackburn Distributions Ltd, UK). The size distribution of the primary particles ranged
from 150-180 m. HPMC (Hydroxy Propyl Methyl Cellulose, methocel A 15 LV) was
used as the binder. The concentration of the binder solution was 6% w/w that was
prepared by adding HPMC to deionised water under constant stirring. The solution was
allowed to sit overnight to allow hydration and degassing. For each granulation
experiment, 46.5g of MCC and 3.5g of dry binder HPMC corresponding to 58.33g of
the binder solution were used. The binder to powder ratio was 7.5% (w/w).
Microcrystalline cellulose is a very frequently used pharmaceutical excipient in the wet
granulation process. Firstly, MCC allows dilution to be distributed evenly through the
wet granulation process. In addition, tablet or granules made up of MCC excipient has
Chapter 3
59
been found to disintegrate relatively easy, which provides the possibility of rapid
dissolution tablet dosage form. In particular, MCC has excellent compactibility, which
can contribute to the strength and robustness of a tablet dosage form. In the meantime, it
should be mentioned that the compactibility of MCC could be changed by the
granulation operating factor and the amount of binder. Normally, the active
pharmaceutical ingredient (API) and excipient should be included simultaneously in the
formulation of granulation. However, in this study, only the MCC is used in the
fluidized bed granulation, because only the physical properties of granules need to be
measured, such as the granule size distribution, granule mean size, or granule moisture.
Therefore, it is impossible to measure properties of API using the granulation
experiments in this study, such as the dissolution test.
3.2.2 Experimental equipment
Granulation experiments were carried out in a lab-scale batch fluidized bed granulator
(MP-Micro ™, GEA Process Engineering Ltd, UK). The schematic diagram for the
experimental setup can be seen in Figure 3.1.
The product chamber is a conical cylinder made from Perspex. The height of the
container is 30 cm with inner diameters of 4.97 cm and 7.48 cm at the bottom and top.
The air distributor is a 4500 mesh stainless steel plate at the bottom of the product
container. The inlet air was preheated at a constant temperature of 40 °C by an electrical
heater before entering the bed for each experiment. The binder spray nozzle was a
movable, internal mixing two-fluid spray nozzle (GEA Niro, NTF-I- 50/50) and was
placed at 16.2 cm above the distributor plate. Spray from the nozzle was in a downward
direction and counter current to the fluidizing air flow. The binder was drawn from a
reservoir of HPMC solution using a peristaltic pump. The total amount of binder
solution withdrawn for each experiment was constant at 58.33g corresponding 7.5%w/w
of the dry binder and powder rate.
Although the fluidized bed granulator used in this study is small-scale, the purpose-
designed equipment can bring all the flexibility of a full-size production fluid bed
granulator to the laboratory bench up. Firstly, it can perform the drying mixing and
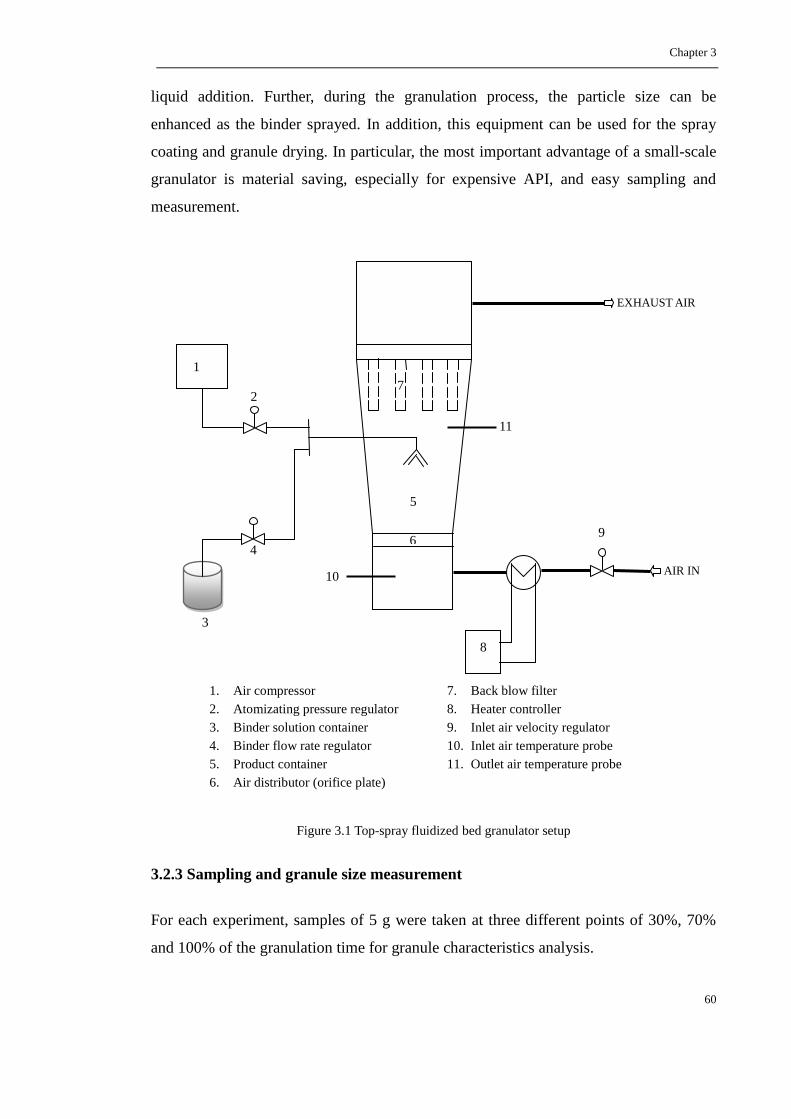
Chapter 3
60
liquid addition. Further, during the granulation process, the particle size can be
enhanced as the binder sprayed. In addition, this equipment can be used for the spray
coating and granule drying. In particular, the most important advantage of a small-scale
granulator is material saving, especially for expensive API, and easy sampling and
measurement.
Figure 3.1 Top-spray fluidized bed granulator setup
3.2.3 Sampling and granule size measurement
For each experiment, samples of 5 g were taken at three different points of 30%, 70%
and 100% of the granulation time for granule characteristics analysis.
AIR IN
EXHAUST AIR
1
2
3
4
5
6
7
8
9
10
11
1. Air compressor
2. Atomizating pressure regulator
3. Binder solution container
4. Binder flow rate regulator
5. Product container
6. Air distributor (orifice plate)
7. Back blow filter
8. Heater controller
9. Inlet air velocity regulator
10. Inlet air temperature probe
11. Outlet air temperature probe

Chapter 3
61
Final granule size distribution was determined by the sieve analysis method. A set of
sieves (150, 180, 250, 355, 500, 710, 1000, and 2000 um) in combination with the
Retsch AS 200 sieve shaker (RETSCH, Germany) was used for size distribution
analysis. Before the particle size analysis, final granules were dried in an oven at 60°C
for 24 hours. The dried granules were transferred to the pre-weighed sieves and allowed
to shake at amplitude of 1 mm for 10 minutes. The sieves were then reweighted to
determine the weight fraction of granules retained on each sieve. These weights were
converted in mass percentage.
The mean diameter and relative width of granule distribution are calculated according to
the following equations
Mean diameter:
(3.1)
Relative width of granule distribution:
(3.2)
where is the mean diameter of final granules; dpi is the geometrical mean of sieve
band i; D10 and D90 are granule sizes at 10% and 90% percentages from the mass
cumulative particle size distribution; RW is the relative width of granule distribution.
The yield of granules between 250 and 1000 m was obtained by emulating of the mass
percentage from the sieves of 250, 355, 500, 710 and 1000 m based on the final
granule size distribution.
3.2.4 Granule physical property characterization
The granules were analyzed for bulk and tapped densities and Hausner ratio.
Bulk and tapped densities
Granules were gently poured into a 250 ml graduated cylinder. The granule weight and
volume were measured to calculate the bulk density. Using an automatic tapping density
tester, the cylinder was tapped 2000 times and the new volume was read to calculate the
tapped density.

Chapter 3
62
Hausner ratio
Hausner ratio is calculated using the bulk and tapped densities to describe the granules
flowability according to the equation as follows [208]:
(3.3)
Moisture content
In this study, a Halogen Moisture Analyzer (HB43-S Mettler Toledo) was used to
measure moisture content of the granules after the samples were taken. This moisture
analyzer can be used for measuring the moisture content of almost any substance. The
thermogravimetric principle was applied by the halogen moisture analyzer. The working
theory is: at the beginning of the measurement, the weight of the sample was
determined, the moisture analyzer then quickly heated the sample by the integral
halogen heating module to let the moisture vaporize. As the samples was heated, the
moisture analyzer continually measures the weight of the sample and obtained the
moisture reduction. Once drying process has been completed, the weight reduction of
sample is obtained as the final result of moisture content.
3.3 Experimental design
3.3.1 JMP software
In this study, the Box-Behnken experimental design, response surfaces and analysis
were all carried out using JMP 11 software (SAS, SAS Institute, Cary, NC, USA).
JMP is a powerful and interactive data visualization and statistical analysis tool, which
can be utilized to learn more about the data by performing analyses and interacting with
the data using data tables, graphs, charts, and reports. During last decades, JMP has
been adopted by more and more researchers to perform a wide range of statistical
analyses and modeling. In addition, JMP has become popular to the business analyst
who wants to quickly uncover trends and patterns in data. Generally, JMP can mainly
work on the following aspects (see JMP website):

Chapter 3
63
Create interactive graphs and charts to explore your data and discover relationships.
Discover patterns of variation across many variables at once.
Explore and summarize large amounts of data.
Develop powerful statistical models to predict the future.
One of the most important application areas of JMP is design of experiment (DoE),
which is powerful, elegant, and cost-effective statistical methods comparing with
traditional costly and time-consuming trial-and-error searches. JMP offers powerful
capabilities for design of experiment and analysis. Design of experiment in JMP is
centered around factors, responses, a model, and runs, which helps you determine how
the responses were influenced by factors. In addition to a complete library of classical
DOE designs (classical screening (fractional factorial), response surface, full factorial,
nonlinear and mixture designs, as well as advanced designs), JMP also offers an
innovative custom design capability that tailors experimental design to specific
situations. Once the data has been collected, JMP streamlines the analysis and model
building so you can easily see the pattern of response, identify active factors and
optimize responses. Also, JMP is the only software that implements definitive screening
designs, which is the most important new class of designs in the past two decades and
were used to efficiently and reliably separate the vital few factors that have a substantial
effect from the trivial many that have negligible impact.
3.3.2 Box-Behnken experimental design
The aim of this chapter is to investigate the effect of spray operating parameters
including the pulsed frequency, binder spray rate and spray atomization pressure on the
quality of granules such as granule size, granule yield and moisture content and to
explore the inter-relationship of these three spray operating parameters. In this chapter,
the Box-Behnken experimental design was used to obtain a design of space which
determined the operating ranges of different process parameters for achieving the
desired quality of granules. A 3-factor, three-level design was used because it was
suitable for exploring quadratic response surfaces and constructing second order
polynomial models for optimization. The independent factors and dependent responses
used in this design are listed in Table 3.1. The low, medium and high levels of each

Chapter 3
64
independent factor were selected based on the results from the preliminary experiments.
Table 3.1 Variables and levels in the Box-Behnken experimental design
In dependent variables Levels
Low (-1) Medium (0) High (1)
X1: pulsed frequency 0 0.5 1
X2: Binder spray rate (g/min) 0.9 1.2 1.5
X3: Atomization pressure (psi) 10 15 20
Dependent responses Constraints Optimum
Y1: Mean size of final granules (m) 300Y1500
Y2: Yield of final granules 85% Y2 Maximum
Y3: Relative width of final granule distribution
Y4: Hausner ratio Y4 1.25
Y5: Moisture content at 30% of binder solution sprayed
Y6: Moisture content at 70% of binder solution sprayed
Y7: Moisture content at 100% of binder solution sprayed
As described in chapter 2.7, using Box-Behnken experimental design, 15 experiments
were designed for the three involved factors at three levels of each parameter, given in
Table 3.3 together with the 7 dependent responses. Three replicated experiments at
center points are designed to validate the experiment repeatability. The Box-Behnken
experimental design, response surfaces and analysis were all carried out using JMP 11
software (SAS, SAS Institute, Cary, NC, USA).
3.3.3 Validation experiments design
In order to validate the RSM results, further four experiments in which all of operating
parameters were in the ranges of the design space have been carried out. The same
materials and operating method were used in the validation experiments. Table 3.2
shows the operating conditions, the experimental and predicted values of all the
response variables and their percentage errors.
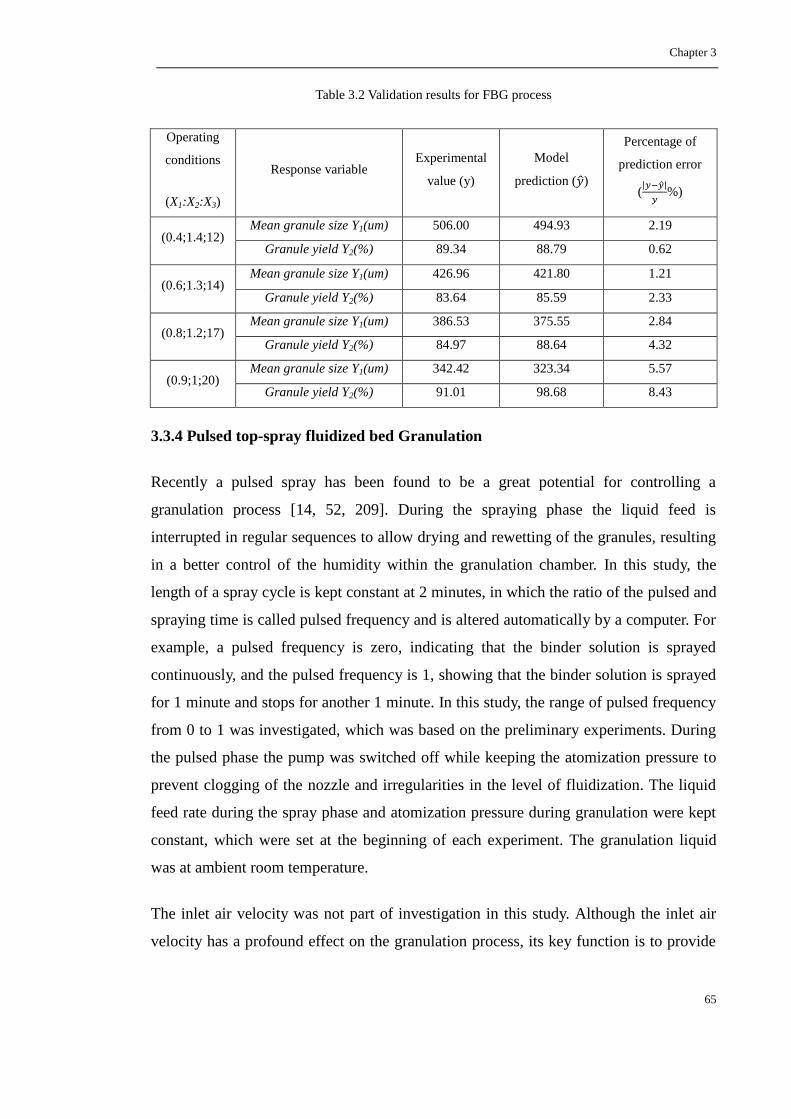
Chapter 3
65
Table 3.2 Validation results for FBG process
Operating
conditions
(X1:X2:X3)
Response variable Experimental
value (y)
Model
prediction ( )
Percentage of
prediction error
(
%)
(0.4;1.4;12) Mean granule size Y1(um) 506.00 494.93 2.19
Granule yield Y2(%) 89.34 88.79 0.62
(0.6;1.3;14) Mean granule size Y1(um) 426.96 421.80 1.21
Granule yield Y2(%) 83.64 85.59 2.33
(0.8;1.2;17) Mean granule size Y1(um) 386.53 375.55 2.84
Granule yield Y2(%) 84.97 88.64 4.32
(0.9;1;20) Mean granule size Y1(um) 342.42 323.34 5.57
Granule yield Y2(%) 91.01 98.68 8.43
3.3.4 Pulsed top-spray fluidized bed Granulation
Recently a pulsed spray has been found to be a great potential for controlling a
granulation process [14, 52, 209]. During the spraying phase the liquid feed is
interrupted in regular sequences to allow drying and rewetting of the granules, resulting
in a better control of the humidity within the granulation chamber. In this study, the
length of a spray cycle is kept constant at 2 minutes, in which the ratio of the pulsed and
spraying time is called pulsed frequency and is altered automatically by a computer. For
example, a pulsed frequency is zero, indicating that the binder solution is sprayed
continuously, and the pulsed frequency is 1, showing that the binder solution is sprayed
for 1 minute and stops for another 1 minute. In this study, the range of pulsed frequency
from 0 to 1 was investigated, which was based on the preliminary experiments. During
the pulsed phase the pump was switched off while keeping the atomization pressure to
prevent clogging of the nozzle and irregularities in the level of fluidization. The liquid
feed rate during the spray phase and atomization pressure during granulation were kept
constant, which were set at the beginning of each experiment. The granulation liquid
was at ambient room temperature.
The inlet air velocity was not part of investigation in this study. Although the inlet air
velocity has a profound effect on the granulation process, its key function is to provide
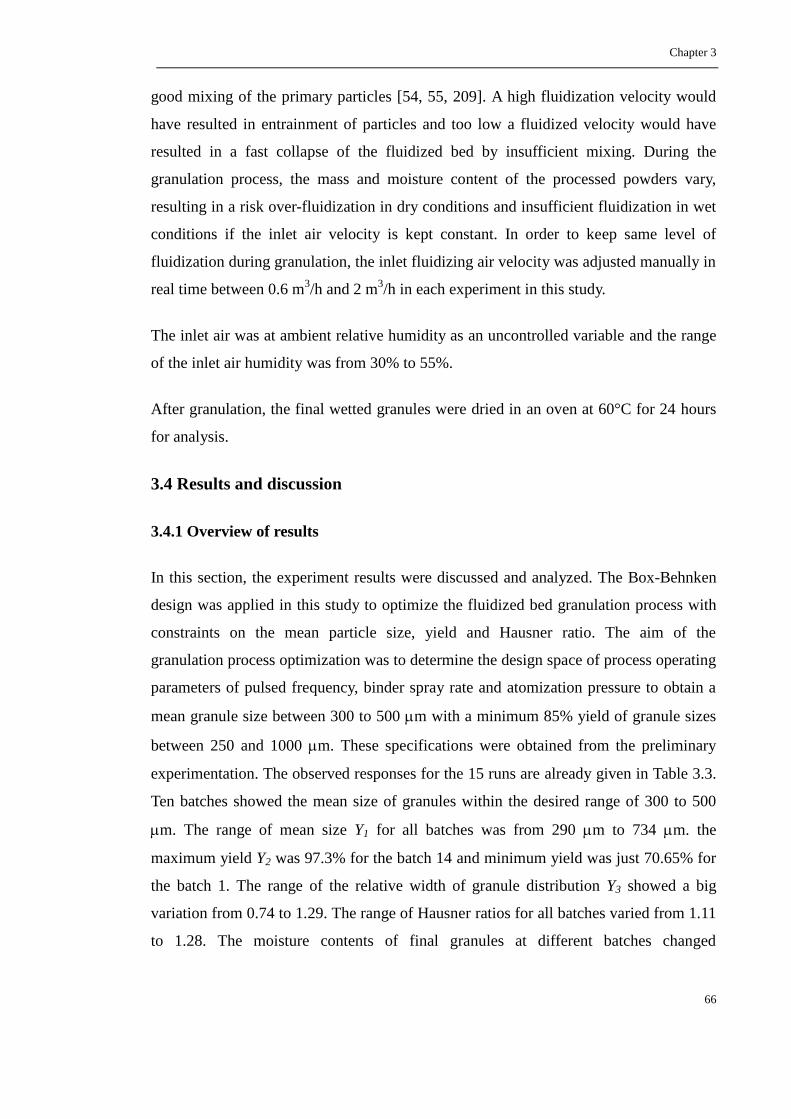
Chapter 3
66
good mixing of the primary particles [54, 55, 209]. A high fluidization velocity would
have resulted in entrainment of particles and too low a fluidized velocity would have
resulted in a fast collapse of the fluidized bed by insufficient mixing. During the
granulation process, the mass and moisture content of the processed powders vary,
resulting in a risk over-fluidization in dry conditions and insufficient fluidization in wet
conditions if the inlet air velocity is kept constant. In order to keep same level of
fluidization during granulation, the inlet fluidizing air velocity was adjusted manually in
real time between 0.6 m3/h and 2 m
3/h in each experiment in this study.
The inlet air was at ambient relative humidity as an uncontrolled variable and the range
of the inlet air humidity was from 30% to 55%.
After granulation, the final wetted granules were dried in an oven at 60°C for 24 hours
for analysis.
3.4 Results and discussion
3.4.1 Overview of results
In this section, the experiment results were discussed and analyzed. The Box-Behnken
design was applied in this study to optimize the fluidized bed granulation process with
constraints on the mean particle size, yield and Hausner ratio. The aim of the
granulation process optimization was to determine the design space of process operating
parameters of pulsed frequency, binder spray rate and atomization pressure to obtain a
mean granule size between 300 to 500 m with a minimum 85% yield of granule sizes
between 250 and 1000 m. These specifications were obtained from the preliminary
experimentation. The observed responses for the 15 runs are already given in Table 3.3.
Ten batches showed the mean size of granules within the desired range of 300 to 500
m. The range of mean size Y1 for all batches was from 290 m to 734 m. the
maximum yield Y2 was 97.3% for the batch 14 and minimum yield was just 70.65% for
the batch 1. The range of the relative width of granule distribution Y3 showed a big
variation from 0.74 to 1.29. The range of Hausner ratios for all batches varied from 1.11
to 1.28. The moisture contents of final granules at different batches changed
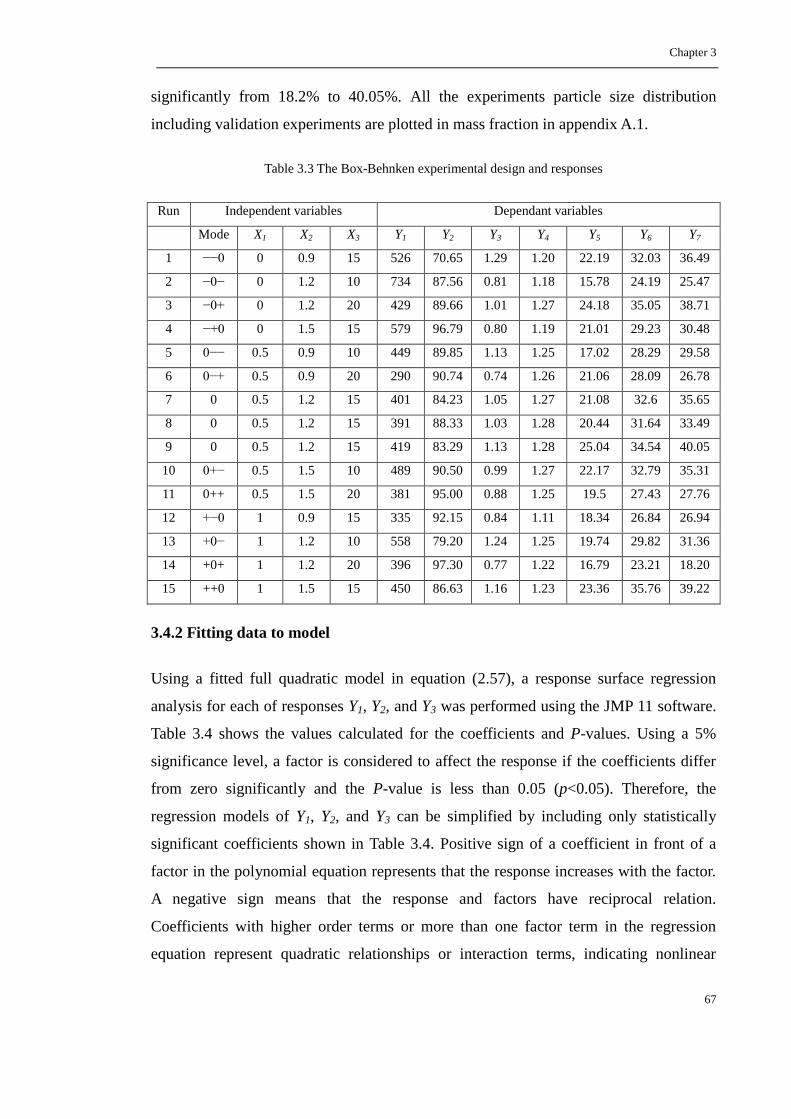
Chapter 3
67
significantly from 18.2% to 40.05%. All the experiments particle size distribution
including validation experiments are plotted in mass fraction in appendix A.1.
Table 3.3 The Box-Behnken experimental design and responses
Run Independent variables Dependant variables
Mode X1 X2 X3 Y1 Y2 Y3 Y4 Y5 Y6 Y7
1 −−0 0 0.9 15 526 70.65 1.29 1.20 22.19 32.03 36.49
2 −0− 0 1.2 10 734 87.56 0.81 1.18 15.78 24.19 25.47
3 −0+ 0 1.2 20 429 89.66 1.01 1.27 24.18 35.05 38.71
4 −+0 0 1.5 15 579 96.79 0.80 1.19 21.01 29.23 30.48
5 0−− 0.5 0.9 10 449 89.85 1.13 1.25 17.02 28.29 29.58
6 0−+ 0.5 0.9 20 290 90.74 0.74 1.26 21.06 28.09 26.78
7 0 0.5 1.2 15 401 84.23 1.05 1.27 21.08 32.6 35.65
8 0 0.5 1.2 15 391 88.33 1.03 1.28 20.44 31.64 33.49
9 0 0.5 1.2 15 419 83.29 1.13 1.28 25.04 34.54 40.05
10 0+− 0.5 1.5 10 489 90.50 0.99 1.27 22.17 32.79 35.31
11 0++ 0.5 1.5 20 381 95.00 0.88 1.25 19.5 27.43 27.76
12 +−0 1 0.9 15 335 92.15 0.84 1.11 18.34 26.84 26.94
13 +0− 1 1.2 10 558 79.20 1.24 1.25 19.74 29.82 31.36
14 +0+ 1 1.2 20 396 97.30 0.77 1.22 16.79 23.21 18.20
15 ++0 1 1.5 15 450 86.63 1.16 1.23 23.36 35.76 39.22
3.4.2 Fitting data to model
Using a fitted full quadratic model in equation (2.57), a response surface regression
analysis for each of responses Y1, Y2, and Y3 was performed using the JMP 11 software.
Table 3.4 shows the values calculated for the coefficients and P-values. Using a 5%
significance level, a factor is considered to affect the response if the coefficients differ
from zero significantly and the P-value is less than 0.05 (p<0.05). Therefore, the
regression models of Y1, Y2, and Y3 can be simplified by including only statistically
significant coefficients shown in Table 3.4. Positive sign of a coefficient in front of a
factor in the polynomial equation represents that the response increases with the factor.
A negative sign means that the response and factors have reciprocal relation.
Coefficients with higher order terms or more than one factor term in the regression
equation represent quadratic relationships or interaction terms, indicating nonlinear

Chapter 3
68
relationship between the response and factors.
Table 3.4 Regression coefficients and associated probability values (P-value) for Responses of Y1, Y2, and
Y3
Term
Mean size of final
granules Y1 Yield of final granules Y2
Relative width of final
granule distribution Y3
Coefficient P-value Coefficient P-value Coefficient P-value
Constant 403.67 <.0001 85.28 <.0001 1.07 <.0001
X1 -66.13 0.0043* 1.33 0.4186 0.01 0.6423
X2 37.37 0.0379* 3.19 0.0877 -0.02 0.4394
X3 -91.75 0.0010* 3.20 0.0872 -0.10 0.0126*
X1* X2 15.50 0.4486 -7.92 0.0138* 0.20 0.0024*
X1* X3 35.75 0.1165 4.00 0.1193 -0.17 0.0054*
X2* X3 12.75 0.5290 0.90 0.6895 0.07 0.1079
X1* X1 97.92 0.0041* -0.91 0.6984 -0.01 0.7509
X2* X2 -29.08 0.1985 2.18 0.3704 -0.04 0.3906
X3* X3 27.67 0.2178 4.06 0.1269 -0.10 0.0436*
Regression
equation
Y1 =403.67 -66.13X1 +
37.37X2 -91.75X3 +
97.92X12
Y2 = 85.28 -7.92X1X2
Y3 =1.07 -0.10X3 +
0.20X1X2-0.17X1X3 -
0.10X32
R-square 0.958067 0.86379 0.941784
Prob>F of
ANOVA 0.006* 0.0895 0.0131*
It is clearly indicated that all three factors of the pulsed frequency (X1), binder spray
rate (X2) and atomization pressure (X3) have significant effects on the mean size of
granules. The atomization pressure X3 has negative effects on the mean size of granules
while the binder spray rate (X2) has positive effects. As expected, increasing the binder
spray rate resulted in an increase of the mean size of granules and increasing the
atomization pressure resulted in a decrease of the granule size, all of which have already
been reported in literatures by several researchers [12, 54, 56]. These can be explained
that the high spray rate promotes granule growth via excessive liquid supply while
lower atomization pressure promotes granule growth via large droplet size. It seemed
that there was no interaction effect of the spray rate and atomization pressure on the
mean granule size because the interaction term can be neglected in the model, which is

Chapter 3
69
consistent with those reported in the literatures [12, 54, 55]. When a pulsed mode is
used during granulation, the pulsed frequency has profound effects on the mean size of
granules shown in the regression equation in Table 3.4. It had both direct negative and
positive quadratic effects on the mean size. Interestingly, there was no interaction effect
of the pulsed frequency with either the spray rate or atomization pressure on the mean
size of granules. The result can be seen as the strong evidence to support previous
finding that the pulsed spray was a potential for controlling a granulation process [14,
52, 209]. Therefore, when a pulsed mode is used during granulation, more choices are
available to control the granule size. However, care has to be taken when the pulsed
frequency is chosen for controlling the granule size due to the nonlinear quadratic
relation in the regression mode. More discussion will be given in the next section of
contour plot analysis. There was no direct effect from either three of operating factors
on the yield of final granules Y2 which was determined by the interaction effect of the
pulsed frequency (X1) and binder spray rate (X2). From the regression equation, it was
evident that only the atomization pressure (X3) had direct negative and quadratic effects
on the relative width of granule distribution Y3. The interaction effect of X1 and X2 was
favorable for increasing the relative width of size distribution while the interaction
effect of X1 and X3 could reduce the size distribution.
The R-square value of model fit and Prob>F value of analysis of variance were also
shown in Table 3.4. R-square is a statistical measure of how close the data are to the
fitted regression line. It is also known as the coefficient of determination, or the
coefficient of multiple determination for multiple regression. The definition of R-square
is fairly straight-forward, which is the percentage of the response variable variation that
is explained by a linear model. R-square is always between 0 and 100%. 0% indicates
that the model explains none of the variability of the response data around its mean. 100%
indicates that the model explains all the variability of the response data around its mean.
In general, the higher the R-square value, the better the model fits your data. From Table
3.4, it can be seen that all the R-square values are close to 1, which means the fitted
models for Y1, Y2, Y3 can well fit the experiment data. Probability of obtaining (by chance
alone) an F value greater than the one calculated if, in reality, there is no difference in
the population group means. Observed significance probabilities of 0.05 or less are

Chapter 3
70
often considered evidence that there are differences in the group means. From Table 3.4,
it can be seen that the P-value for model Y1 and Y3 are smaller than 0.05, while P-value
for model Y2 are obviously larger than 0.05. This indicated the model Y2 cannot perfectly
well fit the experiment date.
Table 3.5 shows the values calculated for the coefficients and P-values for the
regression models of the moisture contents at different granulation times of 30%, 70%
and 100% of binder solution sprayed. At the beginning of granulation up to 30% of the
total binder sprayed, the moisture content of granules was affected mainly by interaction
term of the pulsed frequency (X1) and the atomization pressure (X3). It was surprised
that the bind spray rate had no significant effect on the moisture content of granules at
the beginning of granulation. After that, the moisture content of granules was
determined by the interaction effects of the pulsed frequency (X1) with both the binder
spray rate (X2) and the atomization pressure (X3) and also by the quadratic term of the
atomization pressure. The similar regression models at 70% and 100% of binder
solution sprayed in Table 3.5 were obtained, indicating that the dynamic equilibrium
state had been established after 30% of the binder solution sprayed. All the R-square
values for model Y5, Y6, and Y7 are close to 0.9, which are accepted for model fitting.
However, none of the P-value of analysis of variance for model Y5, Y6, and Y7 is smaller
than 0.05, which reflected the weakness of the model fitted on fitting the experimental
data.
Repeatability of the process was studied by examining the results of the experiments 7,
8, and 9. With the exclusion of moisture content of granules, values of the other
dependent responses were similar, indicating good repeatability in the experiments. The
deviation of moisture content of granules in the three replicated centre points could be
caused by many factors, such as variations in the inlet flow velocity, granule sampling
and size measurement, in particular, the inlet air relative humidity. In this study the inlet
air relative humidity was uncontrolled and changed significantly from minimum 30% to
55% among different experiments. It was concluded that the inlet air relative humidity
was the main factor contributing to the variation of the moisture content of granules.
However, it was surprised that the other dependent responses, in particular mean

Chapter 3
71
granule size, were not affected by variation of the inlet air relative humidity. It was
contradictive to the reported finding that the inlet air relative humidity was critical
importance during the fluidized bed granulation process, which can increase the
moisture level of granules to improve the granule plasticity, leading to slightly larger
granules [12]. Further research is therefore needed to study this issue.
Table 3.5 Regression coefficients and associated probability values (P-value) for
Responses of Y5, Y6, and Y7
Term
Moisture content at 30%
Y5 Moisture content at 70% Y6
Moisture content at
100% Y7
Coefficient P-value Coefficient P-value Coefficient P-value
Constant 22.19 <.0001 32.93 <.0001 36.40 <.0001
X1 -0.62 0.3600 -0.61 0.4690 -1.93 0.1756
X2 0.93 0.1894 1.24 0.1701 1.62 0.2419
X3 0.85 0.2223 -0.16 0.8415 -1.28 0.3419
X1* X2 1.55 0.1332 2.93 0.0446* 4.57 0.0458*
X1* X3 -2.84 0.0220* -4.37 0.0106* -6.60 0.0124*
X2* X3 -1.68 0.1102 -1.29 0.2935 -1.19 0.5228
X1* X1 -0.89 0.3692 -1.52 0.2409 -2.27 0.2632
X2* X2 -0.07 0.9383 -0.44 0.7166 -0.85 0.6582
X3* X3 -2.18 0.0604 -3.34 0.0331* -5.69 0.0250*
Regression
equation Y5 = 22.19 – 2.84X1X3
Y6 = 32.93 +2.93X1X2 –
4.37X1X3 – 3.34 X32
Y7 = 36.40 +4.57X1X2 –
6.60X1X3 – 5.69X32
R-square 0.85505 0.881604 0.884915
Prob>F of
ANOVA 0.1022 0.0662 0.0622
3.4.3 Response contour plots
The relationship between the dependent and independent variables was further
elucidated using response contour plots, which are very useful to study the effects of
two factors on the response at one time when the third factor is kept at a constant level.
Here the main focus was to study the effect of the pulsed frequency, binder spray rate,
atomization pressure and their interactions on the responses of the mean size of final
granules, yield of final granules, relative width of granule distribution and moisture
contents.

Chapter 3
72
The effect of X1 and X2 and their interaction on the mean size of final granule (Y1) at low,
medium and high levels of X3 is given in Figure 3.2. It is clearly shown that the
relationships among the three variables are non-linear because of the curved contour
lines. At three different levels of atomization pressure, it was found that at a fixed spray
rate increasing pulsed time within a spray circle resulted in a reduced mean particle size.
At a fixed pulsed frequency, increasing spray rate resulted in increased mean particle
size. In the contour plots shown in Figure 3.2, the white areas show the operating spaces
which can granulate the required mean particle size in the range of 300 um to 500 um. It
is shown that the operating ranges of the pulsed frequency and spray rate for required
mean particle size increased significantly with increasing the atomization pressure.
At low level of the atomization pressure, the operating space only covers small ranges
of X1 and X2. From the contour plot shown in Figure 3.2(a), it is indicated that the most
effective operating variable to control granule size is the pulsed frequency in which a
wide range of granule size can be produced from around 450m to 700m and the
granule size was almost independent on the spray rate. Research has shown that the
ratio of droplet size/particle size is the main factor to determine nucleation mechanism
of granulation [61]. At a low atomization pressure, large binder droplets were produced,
which can cause immersion of the solid particles in the liquid binder. This can not only
enhance particle agglomeration and growth but also cause oversetting of the bed surface,
resulting in formation of large lumps and defluidization. In order to lower the moisture
content of the bed and increase mixing, the best way to control granule size was to pulse
the binder spay to dry the wet granules to a required level of moisture content.
Therefore the mean size of granules was affected significantly by the pulsed frequency
X1 and was unaffected by the spray rate X2.
At the medium and high levels of atomization pressure, the binder droplets were smaller
than the particles so that the distribution nucleation mechanism was dominant in the
fluid bed granulation, in which nuclei were formed by collisions between the surface-
wetted powder particles. Because both the pulsed frequency and spray rate affected the
wetting profiles of the particles, the mean size of granules was determined by the
combination effect of the two factors. It can also be seen that the operating ranges of X1
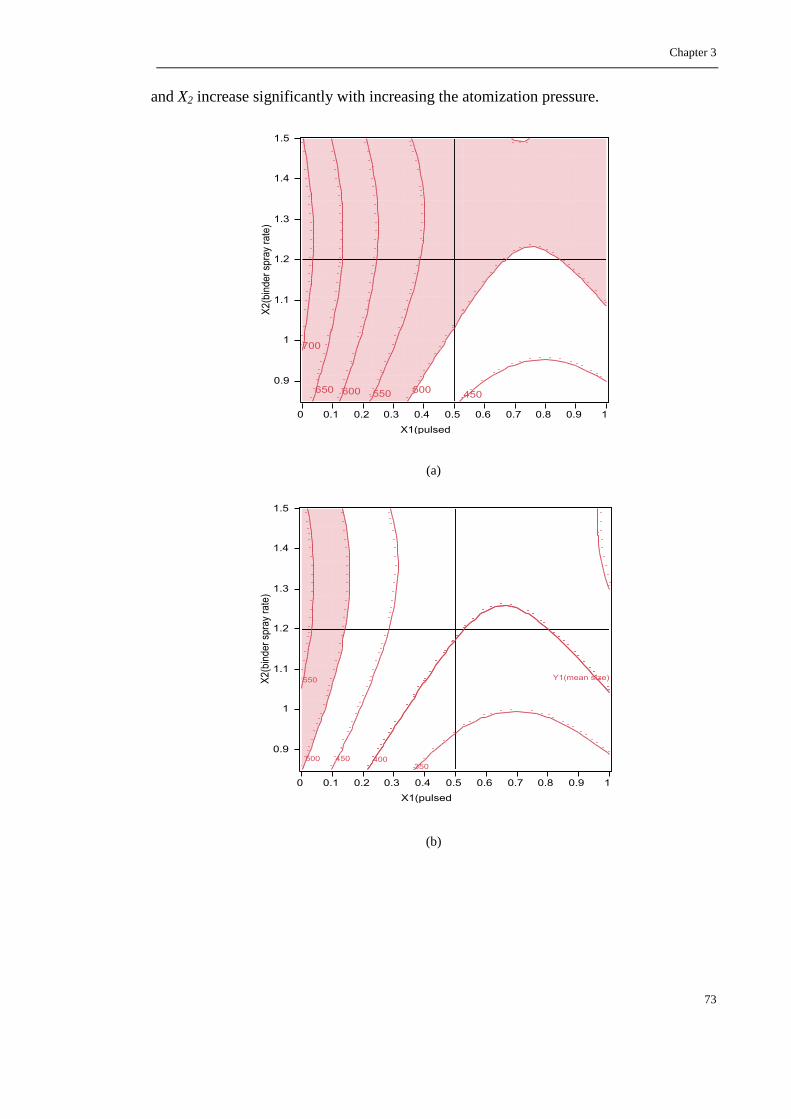
Chapter 3
73
and X2 increase significantly with increasing the atomization pressure.
(a)
(b)

Chapter 3
74
(c)
Figure 3.2 Response contour plots showing effect of pulsed frequency (X1) and binder spray rate (X2) on
mean size of final granules (Y1) (a) at low level of atomization pressure (X3); (b) at medium level of
atomization pressure (X3); (c) at high level of atomization pressure (X3)
The main effect of the independent variables on the dependent variable Y1 is
summarized using a Pareto chart and interaction plot in Figure 3.3. From the interaction
plots, it is shown that at a high level of the pulsed frequency, the mean granulate size
remained constant with changes in the spray rate and atomization pressure. The mean
granule size showed significant change by changing the pulsed frequency within the
whole ranges of spray rate and atomization pressure. The mean granule size decreased
with increasing the atomization pressure. The standardized Pareto chart for Y1 depicts
the main effect of the independent variables on the mean granule size in fluidized bed
granulation. The length of each bar in the graph indicates the effect of these factors and
the level of their effects on the response. From Figure 3.3(a), it can be inferred that
factors X3, X1, X2, and X12 have significant effects on the mean granule size. The most
significant factor was the atomization pressure and the next two most significant factors
were the quadratic term of X12 and direct term of X1. Therefore the complex effects of
the pulsed frequency on the mean size of granules should be studied thoroughly to
achieve desired granule size.
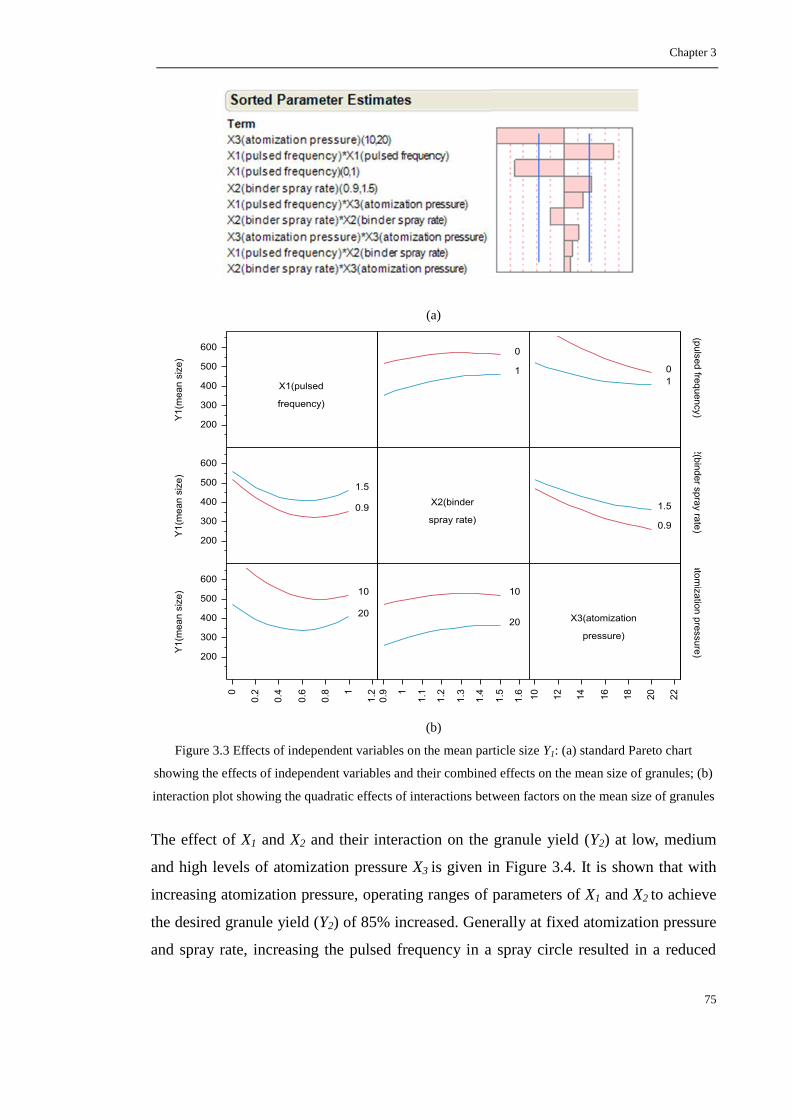
Chapter 3
75
(a)
(b)
Figure 3.3 Effects of independent variables on the mean particle size Y1: (a) standard Pareto chart
showing the effects of independent variables and their combined effects on the mean size of granules; (b)
interaction plot showing the quadratic effects of interactions between factors on the mean size of granules
The effect of X1 and X2 and their interaction on the granule yield (Y2) at low, medium
and high levels of atomization pressure X3 is given in Figure 3.4. It is shown that with
increasing atomization pressure, operating ranges of parameters of X1 and X2 to achieve
the desired granule yield (Y2) of 85% increased. Generally at fixed atomization pressure
and spray rate, increasing the pulsed frequency in a spray circle resulted in a reduced

Chapter 3
76
yield. The reason could be due to attrition of granule surfaces during the pulsed phase
resulting in more fines which were out of desired range of granules [52].
(a)
(b)

Chapter 3
77
(c)
Figure 3.4 Contour plots showing effect of pulsed frequency (X1) and binder spray rate (X2) on final
granule yield (Y2): (a) at low level of atomization pressure; (b) at medium level of atomization pressure;
(c) at high level of atomization pressure
The main effect of the independent variables on the dependent variable Y2 is
summarized using a Pareto chart and interaction plot in Figure 3.5. Regarding the
interaction plot, it is shown that at low level of the atomization pressure, the granule
yield remained constant with changes of the pulsed frequency and spray rate. It is
observed that there is a strong nonlinear relationship between factors of X1 and X2.
Factors X2 and X3 have almost a linear relationship. From Figure 3.5(a), it is inferred
that the interaction term X1X2 is the only significant factor to achieve a higher yield rate.
(a)

Chapter 3
78
(b)
Figure 3.5 Effects of independent variables on the granule yield Y2: (a) standard Pareto chart showing the
effects of independent variables and their combined effects on the granule yield; (b) interaction plot
showing the quadratic effects of interactions between factors on the granule yield
Moisture content of granules is very important, which impacts not only nucleation and
growth of granules, but also causes uneven mixing in the bed. If moisture content of
granules is high, larger lumps can be formed so that they decrease the mixing and cause
further overwetting and defluidization. In order to avoid defluidization in this study, the
air flow rate was adjusted to keep the granule flow pattern consistent during granulation.
As granulation proceeded agglomerates became larger and more influential for the air
flow. The effect of X1 and X2 and their interaction on the moisture content of final
granules (Y7) at low, medium and high levels of atomization pressure X3 is given in
Figure 3.6. All three operating parameters are very much inter-related and have
profound effects on the moisture content of granules. Previous studies have shown that
the moisture content of granules was affected by not only operating parameters but also
by other factors such as the inlet air relative humidity and inlet velocity [12, 14, 52]. In
this work, the inlet air relative humidity was uncontrolled varying from 30% to 55%.
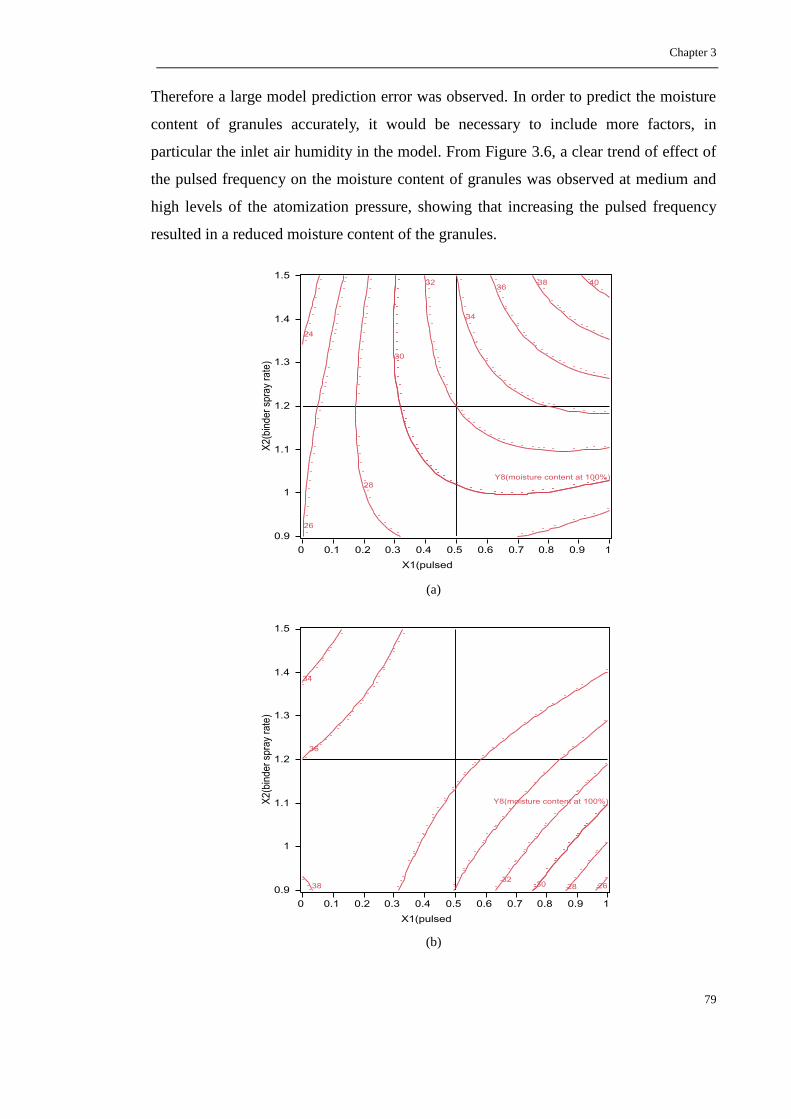
Chapter 3
79
Therefore a large model prediction error was observed. In order to predict the moisture
content of granules accurately, it would be necessary to include more factors, in
particular the inlet air humidity in the model. From Figure 3.6, a clear trend of effect of
the pulsed frequency on the moisture content of granules was observed at medium and
high levels of the atomization pressure, showing that increasing the pulsed frequency
resulted in a reduced moisture content of the granules.
(a)
(b)
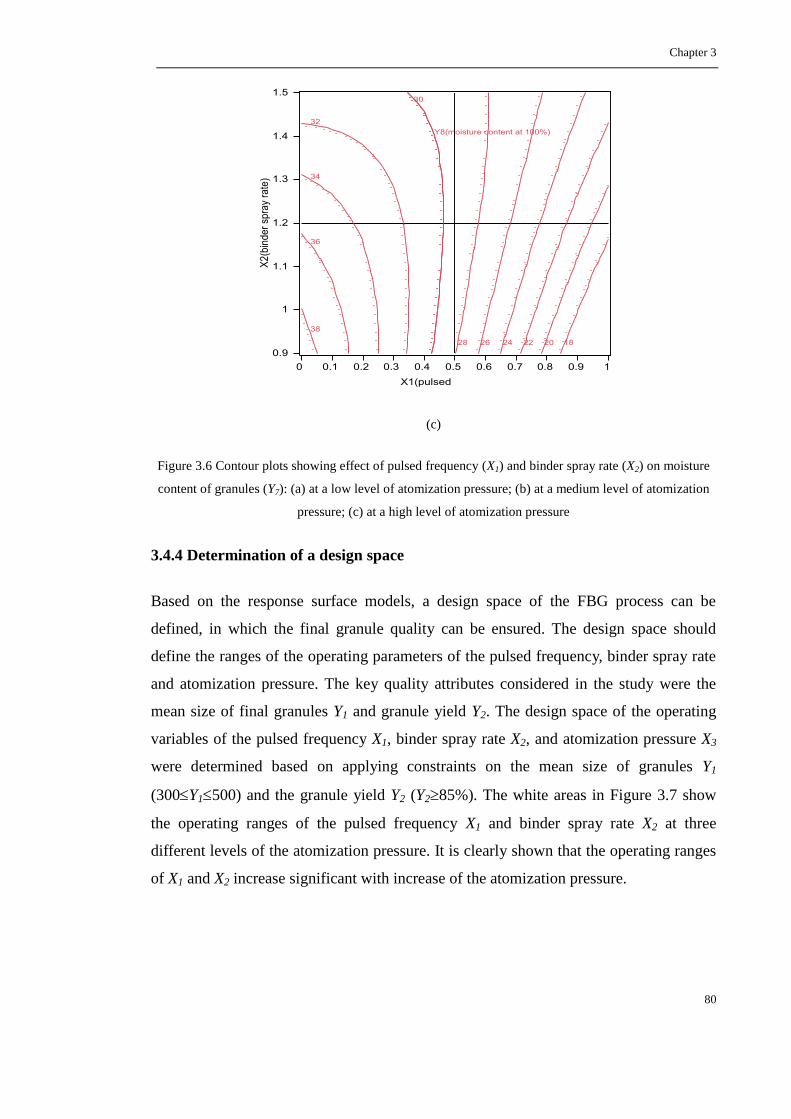
Chapter 3
80
(c)
Figure 3.6 Contour plots showing effect of pulsed frequency (X1) and binder spray rate (X2) on moisture
content of granules (Y7): (a) at a low level of atomization pressure; (b) at a medium level of atomization
pressure; (c) at a high level of atomization pressure
3.4.4 Determination of a design space
Based on the response surface models, a design space of the FBG process can be
defined, in which the final granule quality can be ensured. The design space should
define the ranges of the operating parameters of the pulsed frequency, binder spray rate
and atomization pressure. The key quality attributes considered in the study were the
mean size of final granules Y1 and granule yield Y2. The design space of the operating
variables of the pulsed frequency X1, binder spray rate X2, and atomization pressure X3
were determined based on applying constraints on the mean size of granules Y1
(300Y1500) and the granule yield Y2 (Y285%). The white areas in Figure 3.7 show
the operating ranges of the pulsed frequency X1 and binder spray rate X2 at three
different levels of the atomization pressure. It is clearly shown that the operating ranges
of X1 and X2 increase significant with increase of the atomization pressure.
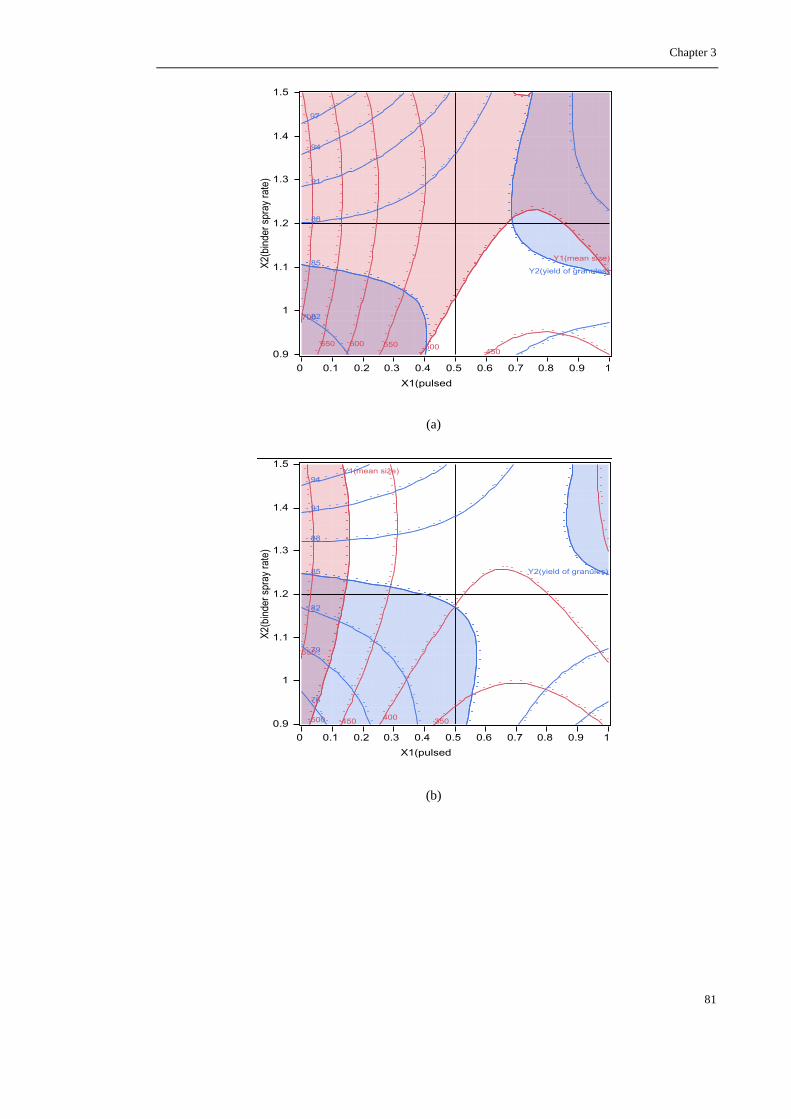
Chapter 3
81
(a)
(b)

Chapter 3
82
(c)
Figure 3.7 Design space for the FDG process: (a) operating ranges of pulsed frequency and binder spray
rate at low level of atomization pressure; (b) operating ranges of pulsed frequency and binder spray rate at
medium level of atomization pressure; (c) operating ranges of pulsed frequency and binder spray rate at
high level of atomization pressure
3.4.5 Validation for process model
In order to validate the RSM results, further four experiments in which all of operating
parameters were in the ranges of the design space have been carried out. The operating
conditions, the experimental and predicted values of all the response variables and their
percentage errors were already shown in Table 3.6. From the results, it is shown that the
prediction error between the experimental values of the responses and those of the
anticipated values was small, varying between 1.21% and 5.57% for Y1 and between
0.62% and 8.43% for Y2.
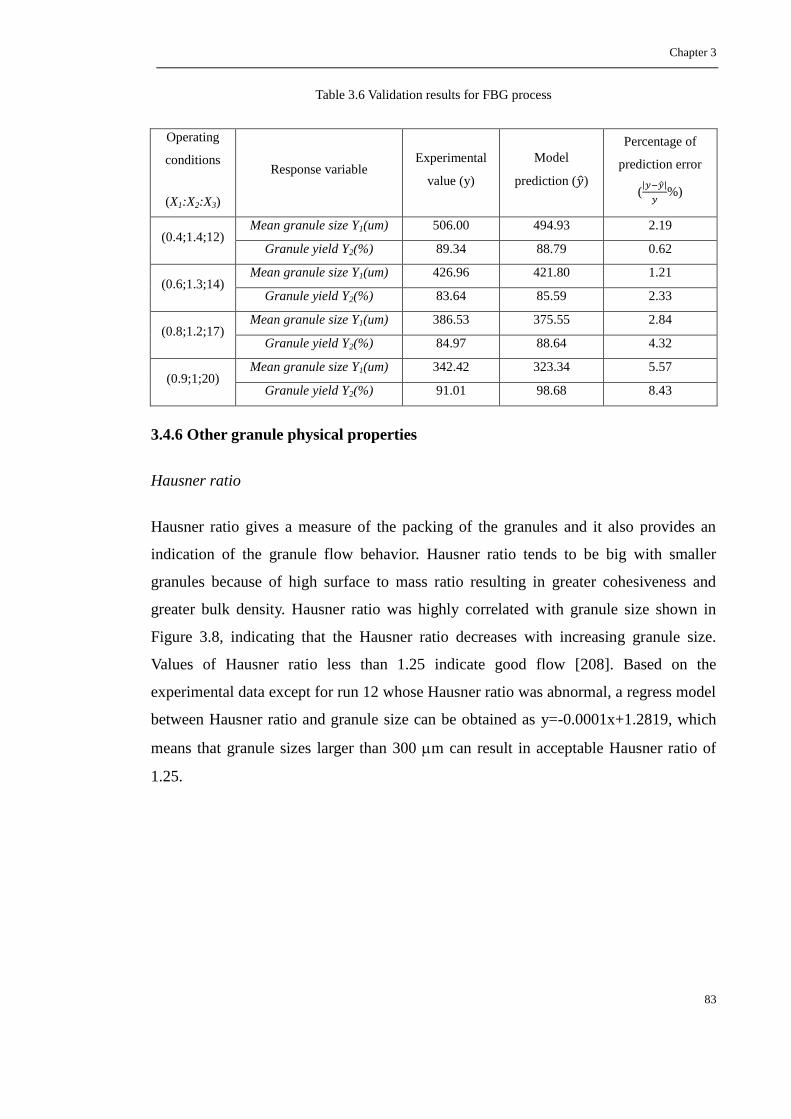
Chapter 3
83
Table 3.6 Validation results for FBG process
Operating
conditions
(X1:X2:X3)
Response variable Experimental
value (y)
Model
prediction ( )
Percentage of
prediction error
(
%)
(0.4;1.4;12) Mean granule size Y1(um) 506.00 494.93 2.19
Granule yield Y2(%) 89.34 88.79 0.62
(0.6;1.3;14) Mean granule size Y1(um) 426.96 421.80 1.21
Granule yield Y2(%) 83.64 85.59 2.33
(0.8;1.2;17) Mean granule size Y1(um) 386.53 375.55 2.84
Granule yield Y2(%) 84.97 88.64 4.32
(0.9;1;20) Mean granule size Y1(um) 342.42 323.34 5.57
Granule yield Y2(%) 91.01 98.68 8.43
3.4.6 Other granule physical properties
Hausner ratio
Hausner ratio gives a measure of the packing of the granules and it also provides an
indication of the granule flow behavior. Hausner ratio tends to be big with smaller
granules because of high surface to mass ratio resulting in greater cohesiveness and
greater bulk density. Hausner ratio was highly correlated with granule size shown in
Figure 3.8, indicating that the Hausner ratio decreases with increasing granule size.
Values of Hausner ratio less than 1.25 indicate good flow [208]. Based on the
experimental data except for run 12 whose Hausner ratio was abnormal, a regress model
between Hausner ratio and granule size can be obtained as y=-0.0001x+1.2819, which
means that granule sizes larger than 300 m can result in acceptable Hausner ratio of
1.25.
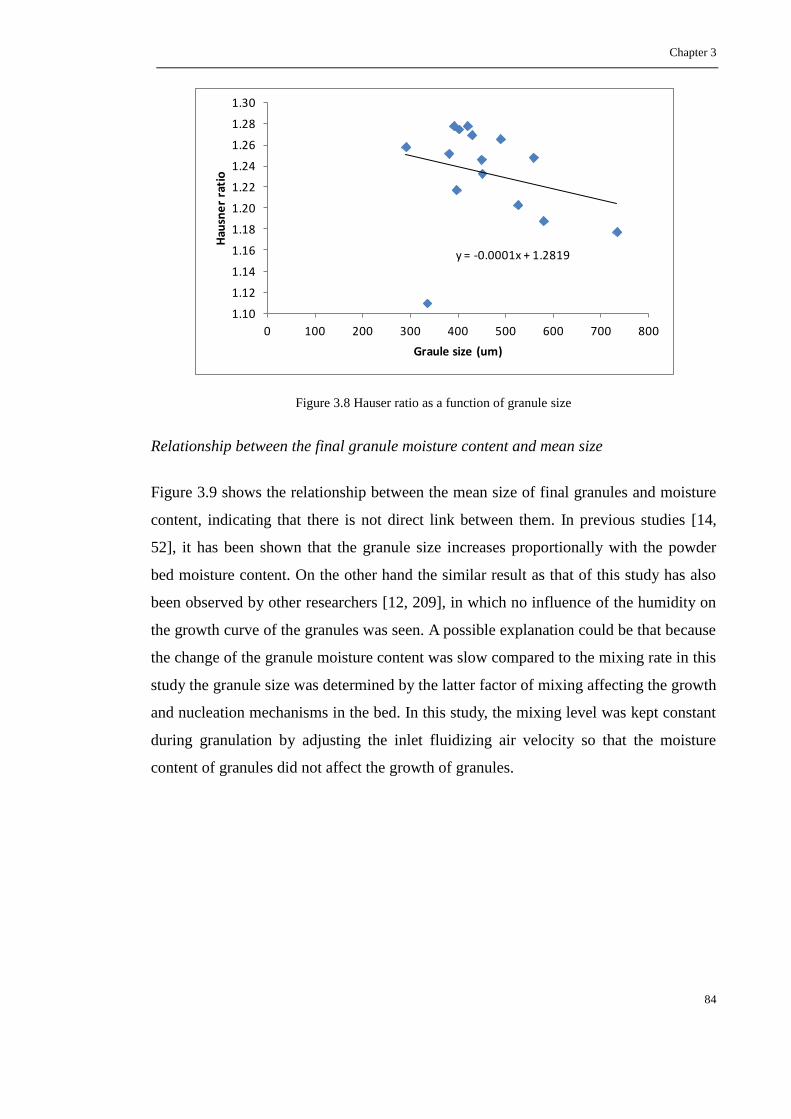
Chapter 3
84
Figure 3.8 Hauser ratio as a function of granule size
Relationship between the final granule moisture content and mean size
Figure 3.9 shows the relationship between the mean size of final granules and moisture
content, indicating that there is not direct link between them. In previous studies [14,
52], it has been shown that the granule size increases proportionally with the powder
bed moisture content. On the other hand the similar result as that of this study has also
been observed by other researchers [12, 209], in which no influence of the humidity on
the growth curve of the granules was seen. A possible explanation could be that because
the change of the granule moisture content was slow compared to the mixing rate in this
study the granule size was determined by the latter factor of mixing affecting the growth
and nucleation mechanisms in the bed. In this study, the mixing level was kept constant
during granulation by adjusting the inlet fluidizing air velocity so that the moisture
content of granules did not affect the growth of granules.
y = -0.0001x + 1.2819
1.10
1.12
1.14
1.16
1.18
1.20
1.22
1.24
1.26
1.28
1.30
0 100 200 300 400 500 600 700 800
Hau
sne
r ra
tio
Graule size (um)

Chapter 3
85
Figure 3.9 Relationship between mean size of final granules and moisture content
3.5 Chapter conclusions
In this chapter, all the experiments carried in this work was introduced, including the
materials, experimental apparatus, operating method, sampling and final granule
properties characterization. The influence factors of pulsed frequency, binder spray rate
and atomization pressure of the top-spray fluidized bed granulation process were
studied using the Box-Behnken experimental design method. Different mathematical
models were developed to predict the mean size of granules, yield, relative width of
granule distribution and final granule moisture content. The study has supported the
theory that the granule size can be controlled through the liquid feed pulsing [14, 52,
209]. However, care has to be taken when the pulsed frequency is chosen for controlling
the granule size due to the nonlinear quadratic relation in the regression model. The
design space of the ranges of operating parameters has been determined based on
constraints of the mean size of granules Y1 (300Y1500) and granule yield Y2 (Y285%).
High degree of prediction obtained from validation experiments has shown the
reliability and effectiveness using the Box-Behnken experimental design method to
study the fluidized bed granulation process.
0
100
200
300
400
500
600
0 10 20 30 40 50
Gra
nu
le s
ize
(u
m)
Moisture content (%)
Chapter 4
86
Chapter 4 Population balance modeling and multi-stage
optimal control of a pulsed spray fluidized bed granulation
4.1 Chapter overview
The primary aim of this chapter was to develop a process model which can link the key
binder solution spray operating factors of the binder spray rate, atomizing air pressure
and pulsed frequency of spray with the granule properties to predict granule growth
behavior in a pulsed spray fluidized bed granulation process. The model will be then
used to design the control strategies to operate the pulsed spray fluidized bed
granulation under more optimal conditions to achieve the desired quality of the end
granules. The model was based on the one-dimensional discretized population balance
model (PBM) of the fluidized bed to describe the changes of granule size by assuming
that aggregation and breakage were key mechanisms in the granulation process.
Through selecting the appropriate kernels of the aggregation and breakage processes in
which the spray operating factors were built, the model can predict evolution of the
granule size and distribution at different binder spray operating conditions with accuracy.
After the process was developed, based on which a multi-stage open optimal control
strategy was proposed to achieve the desired mean size of the end granules. In the
method the optimal operating variables related to the binder spray, including the spray
rate of binding liquid, atomizing air pressure and pulsed frequency of spray, were
determined through adjusting the trajectory of the evolution of the granule size
distribution at predefined sample intervals.
4.2 Population balance model
The full population balance model considering nucleation, growth, aggregation and
breakage was already introduced in chapter 2 and given in equation (2.1) and equation
(2.3) in continuous and discretization form, respectively. In this chapter, only the
aggregation and breakage were simultaneously considered in the PBM, which means
equation (2.1) and (2.3) only consider the aggregation and breakage terms. The
population balance model will not be rewritten here and the equation (2.3) mentioned in

Chapter 4
87
this chapter means the equation (2.3) only considering aggregation and breakage terms.
In this work, the group of ordinary differential equations in equation (2.3) was solved by
the ode45 solver in MATLAB based on the following assumptions: (a) every particle is
a sphere; (b) the size of granules in a particular size class is represented by the left edge
of the size interval; and (c) the relative growth rate is uniform for each particle within
the same volume interval.
4.2.1 Selection of aggregation model
An aggregation model can generally be split into two parts as [16, 210]
(4.1)
where is the granulation rate constant, which incorporates various system
parameters , such as the binder spray and fluidization operating conditions for a top
spray fluidized bed granulator, and nonequipment parameters , such as physical
properties of the powder mixtures. The second term expresses the influence of
granule size on the likelihood of aggregation.
Based on our previous study of a top spray fluidized bed granulator, it was shown that
the quality of end granules was affected significantly by the binder solution spray
conditions [198]. Therefore, for the given materials and formulation, the granulation
rate constant should be a function of the binder solution spray conditions of the
pulsed frequency x1, binder spray rate x2 and atomization pressure x3, which can be
represented as a non-linear quadratic model as
(4.2)
where , ……, are constants.
There are many empirical or semi-empirical mathematical models proposed for the
second term of and a general expression can be described as [211],
Chapter 4
88
(4.3)
where p is the order of the kernel. The order of the kernel enables the aggregation to
become size independent if p=0 or to follow Smoluchowski’s shear kernel if p=3.
All constants , ……, and p in the aggregation model will be determined
through fitting the experimental datasets, which will be detailed in section 4.2.3.
4.2.2 Selection of breakage model
A breakage selection function can also be described as the following two parts [81, 211],
(4.4)
Where is the breakage selection rate constant, which incorporates various
system parameters and physical property parameters of powder mixture. The
second term is the size dependence of the selection rate.
Similar as the granulation rate constant , the breakage selection rate constant can be
represented as a non-linear quadratic model of the binder solution spray conditions of
the pulsed frequency x1, binder spray rate x2 and atomization pressure x3, detailed as
(4.5)
Where , ……, are constants.
The size dependence of the selection rate is assumed as
(4.6)
Where q is the order of the kernel, which enables the breakage to become size
independent if q=0 or to be proportional to the particle volume if q=3.
The breakage kernel describes the formation of fragments of diameter l from the
breakage of particles of diameter µ. In this study, it is assumed that any size of fragment

Chapter 4
89
is equally probable and the total volume of the fragments formed equals the volume of
the selected breakage of particle of diameter µ. Therefore the breakage kernel is
described as
(4.7)
All constants , ……, and q in the breakage model will be determined from the
experiments detailed in section 4.2.3.
4.2.3 Determination of the parameters of aggregation and breakage models
In order to predict the evolution of granule size distribution under different operating
conditions of the binder solution spray in a top spray fluidized bed granulation process,
a best fit approach is adopted, in which the set of parameters used in the PBM is the best
prediction for the experimental data of dynamics of granulation processes in chapter 3.
In this work, the granule size distribution was chosen as the criterion for the dynamics
of granulation. Details of the modeling approach used in this work are illustrated in
Figure 4.1. In the algorithm, the first step is to define the kinetics of aggregation and
breakage mechanisms in the PBM by setting one of combinations of and
. In the second step, the granulation rate and breakage selection
rate constants for each experimental data set are determined by
minimizing the following cost function of the sum of square errors (SSE) of the particle
size distribution through an iterative optimal algorithm for a given and ,
, , , , , ,0, , , ,0, 2 (4.8)
where and are the optional weights of each size class over time and size, is
the measured number of granules in the size range of at time t and is
the normalized volume fraction of particles , and is the predicted number based
on and is the normalized volume fraction of particles . In
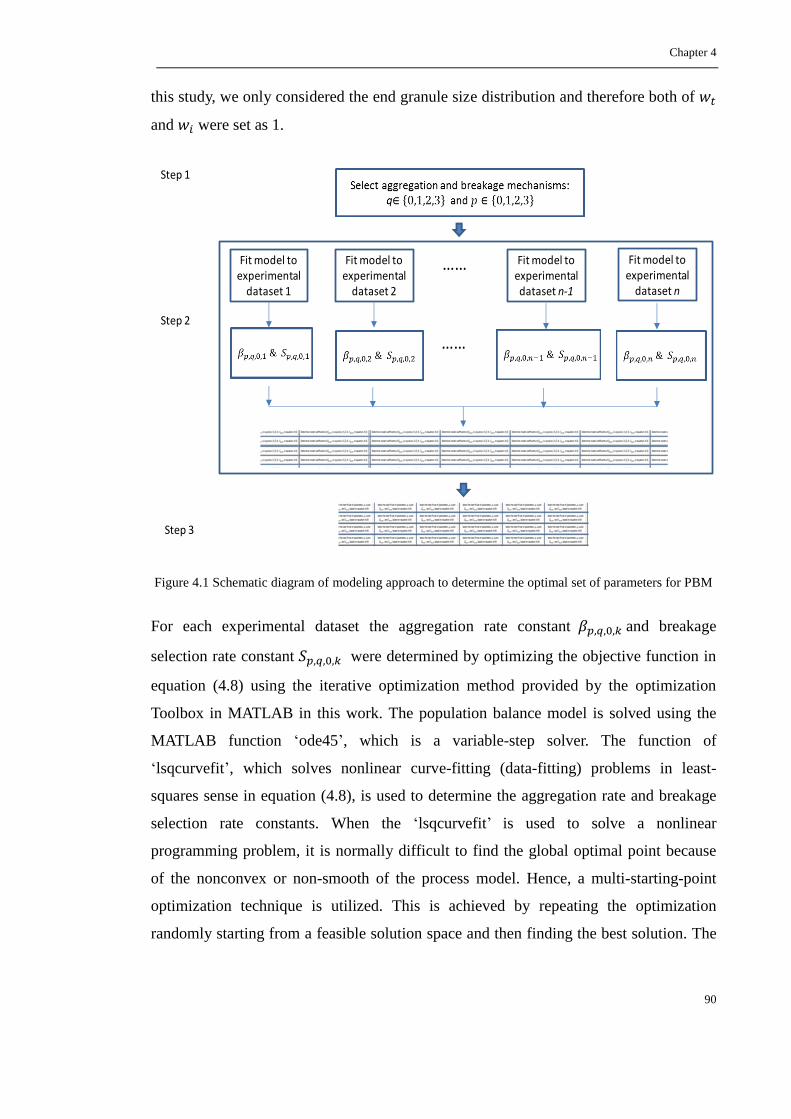
Chapter 4
90
this study, we only considered the end granule size distribution and therefore both of
and were set as 1.
Figure 4.1 Schematic diagram of modeling approach to determine the optimal set of parameters for PBM
For each experimental dataset the aggregation rate constant and breakage
selection rate constant were determined by optimizing the objective function in
equation (4.8) using the iterative optimization method provided by the optimization
Toolbox in MATLAB in this work. The population balance model is solved using the
MATLAB function ‘ode45’, which is a variable-step solver. The function of
‘lsqcurvefit’, which solves nonlinear curve-fitting (data-fitting) problems in least-
squares sense in equation (4.8), is used to determine the aggregation rate and breakage
selection rate constants. When the ‘lsqcurvefit’ is used to solve a nonlinear
programming problem, it is normally difficult to find the global optimal point because
of the nonconvex or non-smooth of the process model. Hence, a multi-starting-point
optimization technique is utilized. This is achieved by repeating the optimization
randomly starting from a feasible solution space and then finding the best solution. The
Fit model to experimental
dataset 1
Fit model to experimental
dataset 2
Fit model to experimental
dataset n
Fit model to experimental dataset n-1
……
……
Step 1
Step 2
Step 3

Chapter 4
91
limitation lies in the ability to adequately search the entire feasible region of the
parameter space. It is noted that no guarantee can be made on local or global optimality
of the resulting solution, especially for very complex process model. In this work, the
solution searched by setting 20 starting points demonstrated good optimality when
comparing with the experimental results. In the optimization method, the maximum
iteration and desired error limitation were set as 500 and 1×10⁻⁸
. The commercial
software MATLAB (2011b) on a 2 GHz Intel Four Core processor desktop computer
with 4 GB RAM using a XP platform was used in computation.
Once the best fit parameters of and for each of experimental dataset were
obtained at the given aggregation kernel p and breakage kernel q , the process model
parameters of and linking the binder solution spray
operating parameters in equations (4.2) and (4.5) can be obtained using JMP 11
software (SAS, SAS Institute, Cary, NC, USA).
Finally the best fit set of parameters, p, q and and in the PBM in equation
(2.3) is obtained based on the minimal prediction error given by
, , , , ,0, 1, 2, 3, , ,0, 1, 2, 32 (4.9)
where n is the total number of experiments.
4.3 PBM based multi-stage optimal strategy to determine the optimal
operating conditions of binder solution spray
For a continuous fluidized bed granulation process, a closed-loop control strategy can
be implemented through on-line adjusting the operating factors, such as the solid feed
rate and binder spray rate, to achieve the desired granule size distribution and consistent
quality based on the process model and different control strategies [193, 194, 212-214].
Chapter 4
92
However, there are more challenges on implementation of a closed-loop strategy to
adjust the operating factors of a batch fluidized bed granulation process in real time. For
a batch fluidized bed granulation, the process is inherently unstable, very sensitive to its
bed humidity, large delay and short processing time. Any change of the binder spray
operating conditions during a fluidized bed granulation process could pose the danger of
overwetting of the particles, leading to a non-retrievable bed collapse. Additionally, on-
line measurements of critical parameters of granules during fluidized bed granulation, in
particular granule size and size distribution, is still challenging and problematic even
though significant progress has been made over past few years [215]. Therefore, the
best way to control a fluidized bed granulation process is to set the operating conditions
right from the beginning of the operation. In this chapter, a multi-stage open optimal
control strategy was proposed to achieve the desired mean size of the end granules. In
the method the optimal operating variables related to the binder spray, including the
spray rate of binding liquid, atomizing air pressure and pulsed frequency of spray, were
determined through adjusting the trajectory of the evolution of the granule size
distribution at predefined sample intervals.
Based on the developed model of a pulsed spray fluidized bed granulation process in
Section 4.2, the optimal operating conditions of the binder solution spray can be
determined, with the aim of obtaining the end granules with the desired properties, such
as mean size, size distribution and yield of final granules. To simply the problem, the
mean size of the end granules was considered as the sole objective of optimization in
this study. Therefore, the optimal operating conditions of the binder solution spray,
including the pulsed frequency x1, binder spray rate x2 and atomization pressure x3, can
be determined by solving the following optimization problem as
(4.10)
Subject to:
(a)
given by the PBM in equations (2.3) and (4.1)-(4.9)
(b) Operating range of pulsed frequency x1 as
Chapter 4
93
(c) Operating range of binder spray rate x2 as
(d) Operating range of atomization pressure x3 as
Where is the desired mean diameter of end granules; is the granulation
completion time at which a fixed amount of binder solution has been sprayed;
is the mean size of the end granules given by
(4.11)
Where is the volume fraction of end granules at size interval
, is the number of end granules in the ith size interval calculated by
the PBM in equation (2.3), and is the geometrical mean of the size interval
.
This is an open-loop optimization problem in which the trajectory of the mean granule
size evolution is determined to achieve the desired mean diameter of end granules. The
same optimization method for the modeling development in section 4.2 was used for
determination of the optimal settings of the pulsed frequency x1, binder spray rate x2 and
atomization pressure x3. It is well known that the drawback of an open-loop
optimization problem is that it relies on accuracy of the process model. For a batch top-
spray fluidized bed granulation process it is undoubted that there exists the model
mismatch between the developed PBM and actual granulation process. Hence, a multi-
stage optimization strategy has been developed, shown in Figure 4.2. At the beginning
of the granulation process, the optimal settings of the pulsed frequency x1_0, binder
spray rate x2_0 and atomization pressure x3_0 is determined based on the desired end
mean size and PBM, and the trajectory of the mean granule size evolution is
given in the Figure 4.2. Due to the model mismatch, it is expected that the actual mean
size of end granules is which is significantly different from the desired value
of . If the granule size distribution is available through an on-line particle sizer
at a sampling time , the optimal settings of the binder solution spray can be adjusted
through a new optimal search at a new initial process point based on a
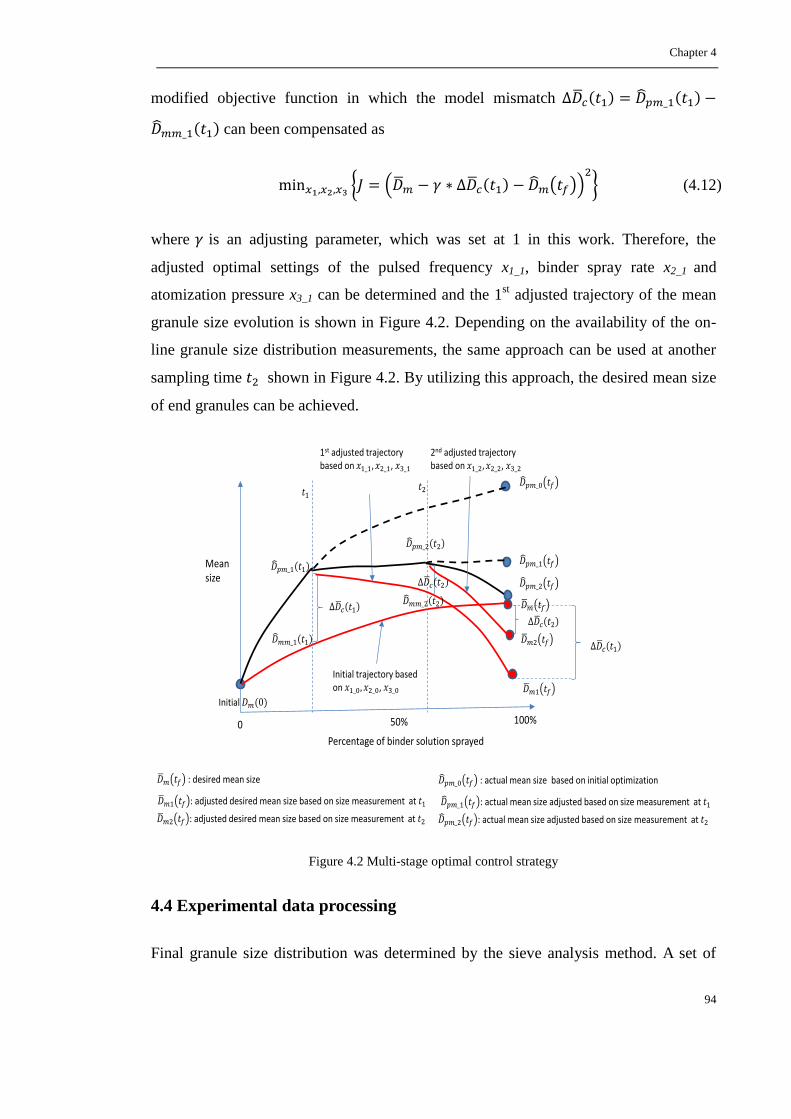
Chapter 4
94
modified objective function in which the model mismatch
can been compensated as
(4.12)
where is an adjusting parameter, which was set at 1 in this work. Therefore, the
adjusted optimal settings of the pulsed frequency x1_1, binder spray rate x2_1 and
atomization pressure x3_1 can be determined and the 1st adjusted trajectory of the mean
granule size evolution is shown in Figure 4.2. Depending on the availability of the on-
line granule size distribution measurements, the same approach can be used at another
sampling time shown in Figure 4.2. By utilizing this approach, the desired mean size
of end granules can be achieved.
Figure 4.2 Multi-stage optimal control strategy
4.4 Experimental data processing
Final granule size distribution was determined by the sieve analysis method. A set of
Initial
Percentage of binder solution sprayed
0 50% 100%
Initial trajectory based on ,
1st adjusted trajectory based on ,
: adjusted desired mean size based on size measurement at
: desired mean size
: adjusted desired mean size based on size measurement at
2nd adjusted trajectory based on ,
: actual mean size adjusted based on size measurement at
: actual mean size based on initial optimization
: actual mean size adjusted based on size measurement at
Meansize
Chapter 4
95
sieves (150, 180, 250, 355, 500, 710, 1000, and 2000 um)
The experiments results obtained in chapter 3 were used in the modeling work of this
chapter. However, in order to carry out the modeling work in section 4.2, the raw data
from sieving based on the volume fraction have to be first transferred into a standard
number-based datasets using a series of size intervals with
, where
and are the upper and lower boundaries of ith size interval, required by solving the
discretized PBM in equation (2.3) proposed by Hounslow et al [89, 107]. An
assumption used in the transformation is that the particles volume is normally
distributed within each size interval of the initial set of sieves: 150-180, 180-250, 250-
355, 355-500, 500-710, 710-1000, 1000-2000 µm. After transformation, the size range
used in the modelling work was from 150 µm to 2400 µm which was divided into 12
intervals as: 150-189, 189-238, 238-300, 300-378, 378-476, 476-600, 600-756, 756-952,
952-1200, 1200-1512, 1512-1905, 1905-2400 µm. At the beginning of the simulation,
all initial particles were defined to have a diameter of 150 µm in the first size interval
and total number of particles was 5.8475×10⁷ corresponding to the total number of
primary particles used in the experiments.
4.5 Results and discussion
4.5.1 Determination of PBMs for a pulsed top spray fluidized bed granulation
A PBM based process model has been developed based on the experimental data
obtained in section 4.4 using the proposed method in section 4.2 to predict the evolution
of granule size in a pulsed spray fluidized bed granulation process at different operating
conditions of the binder solution spray.
The kernel orders of p in the aggregation model and q in the breakage model indicate
the mechanisms of evolution of the granules during granulation. If values of p and q are
0, it indicates that aggregation and breakage of the granules are size independent and
while as if values of p and q are 1, 2, or 3, it shows that the aggregation and breakage of
granules are dependent on granules’ length, surface area or volume. In total 16
combinations of p and q have been tested to investigate the mechanisms of granulation
Chapter 4
96
in a pulsed spray fluidized bed granulation process in this work. For each combination
of p and q, the granulation rate constant and breakage selection rate constant
for each experimental dataset were determined based on the cost function in
equation (4.8). Subsequently the parameters of non-linear quadratic models of the
granulation rate constant in equation (4.2) and breakage selection rate constant
in equation (4.5) which link the operating factors of the binder spray rate,
atomizing air pressure and pulsed frequency of spray were determined. The SSE of the
end granule size distribution between the experimental data and model predictions can
be calculated for each combination of p and q in equation (4.9) and the relative
magnitude of the SSEs in volume fraction for all combinations of the aggregation and
breakage kernels is shown in Figure 4.3. It is clearly indicated that the PBMs show good
predictions when the breakage kernel q is zero, indicating the breakage of granules was
size independent during granulation. Among them, the best fitted PBM is p=3 and q=0,
indicating the aggregation of granules was dependent on the granule volume following
the Smoluchowski’s shear kernel. Studies of aggregation and breakage kernels in
fluidized bed granulation have indicated that they were closely correlated with the
mixing properties of a fluidized bed, such as Stokes number [16, 80]. In the study, the
experiments were carried out at the same level of fluidization during granulation for
each granulation experiment. Therefore, the Stakes number was kept constant over the
whole granulation process. It was not surprising that the breakage kernel was constant
[16]. Aggregation kernel was dependent the volume of granules which was the same as
the previous study for the best predictive PBM [80]. Table 4.1 shows the best two PBMs
obtained from the mathematical fitting. From the R-Square of sum of fit and P-value of
ANOVA, it can be seen all the aggregation models and breakage models of p=2, q=0
and p=3, q=0 can well fit the original kernel constants, which also means these model
can be trusted in following work.
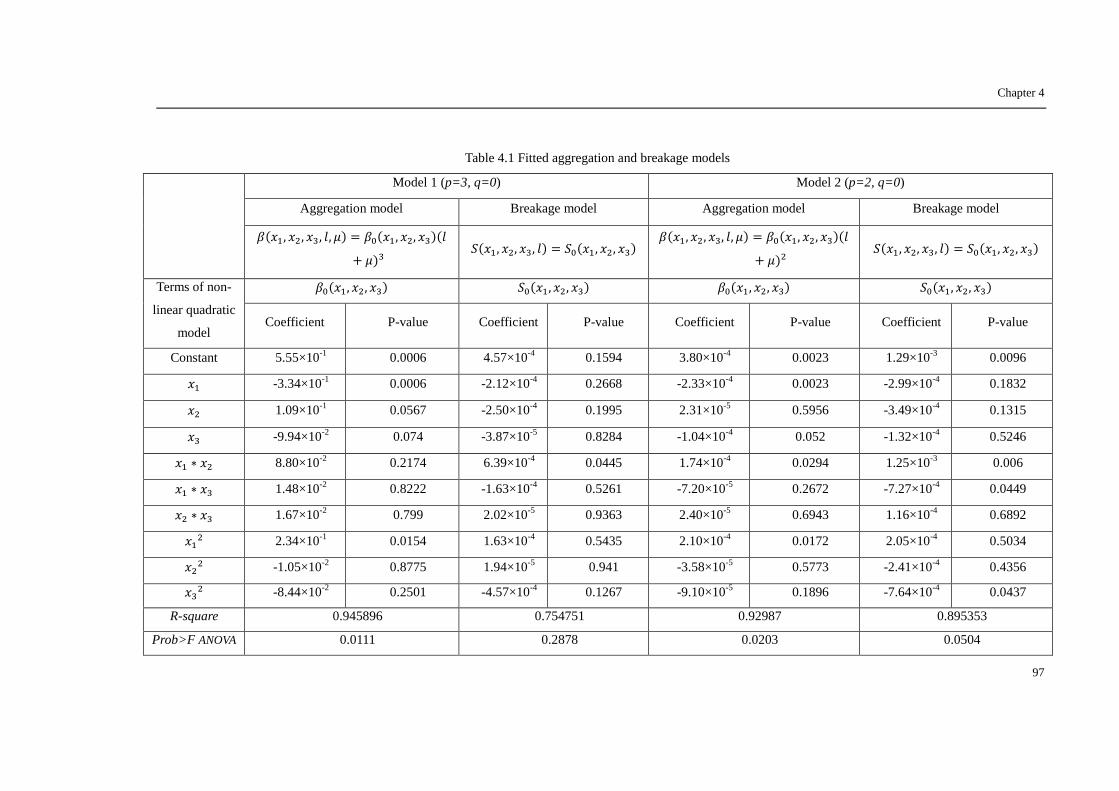
Chapter 4
97
Table 4.1 Fitted aggregation and breakage models
Model 1 (p=3, q=0) Model 2 (p=2, q=0)
Aggregation model Breakage model Aggregation model Breakage model
Terms of non-
linear quadratic
model
Coefficient P-value Coefficient P-value Coefficient P-value Coefficient P-value
Constant 5.55×10⁻¹
0.0006 4.57×10⁻⁴
0.1594 3.80×10⁻⁴
0.0023 1.29×10⁻³
0.0096
-3.34×10⁻¹
0.0006 -2.12×10⁻⁴
0.2668 -2.33×10⁻⁴
0.0023 -2.99×10⁻⁴
0.1832
1.09×10⁻¹
0.0567 -2.50×10⁻⁴
0.1995 2.31×10⁻⁵
0.5956 -3.49×10⁻⁴
0.1315
-9.94×10⁻²
0.074 -3.87×10⁻⁵
0.8284 -1.04×10⁻⁴
0.052 -1.32×10⁻⁴
0.5246
8.80×10⁻²
0.2174 6.39×10⁻⁴
0.0445 1.74×10⁻⁴
0.0294 1.25×10⁻³
0.006
1.48×10⁻²
0.8222 -1.63×10⁻⁴
0.5261 -7.20×10⁻⁵
0.2672 -7.27×10⁻⁴
0.0449
1.67×10⁻²
0.799 2.02×10⁻⁵
0.9363 2.40×10⁻⁵
0.6943 1.16×10⁻⁴
0.6892
2.34×10
-1 0.0154 1.63×10
-4 0.5435 2.10×10
-4 0.0172 2.05×10
-4 0.5034
-1.05×10
-2 0.8775 1.94×10
-5 0.941 -3.58×10
-5 0.5773 -2.41×10
-4 0.4356
-8.44×10
-2 0.2501 -4.57×10
-4 0.1267 -9.10×10
-5 0.1896 -7.64×10
-4 0.0437
R-square 0.945896 0.754751 0.92987 0.895353
Prob>F ANOVA 0.0111 0.2878 0.0203 0.0504
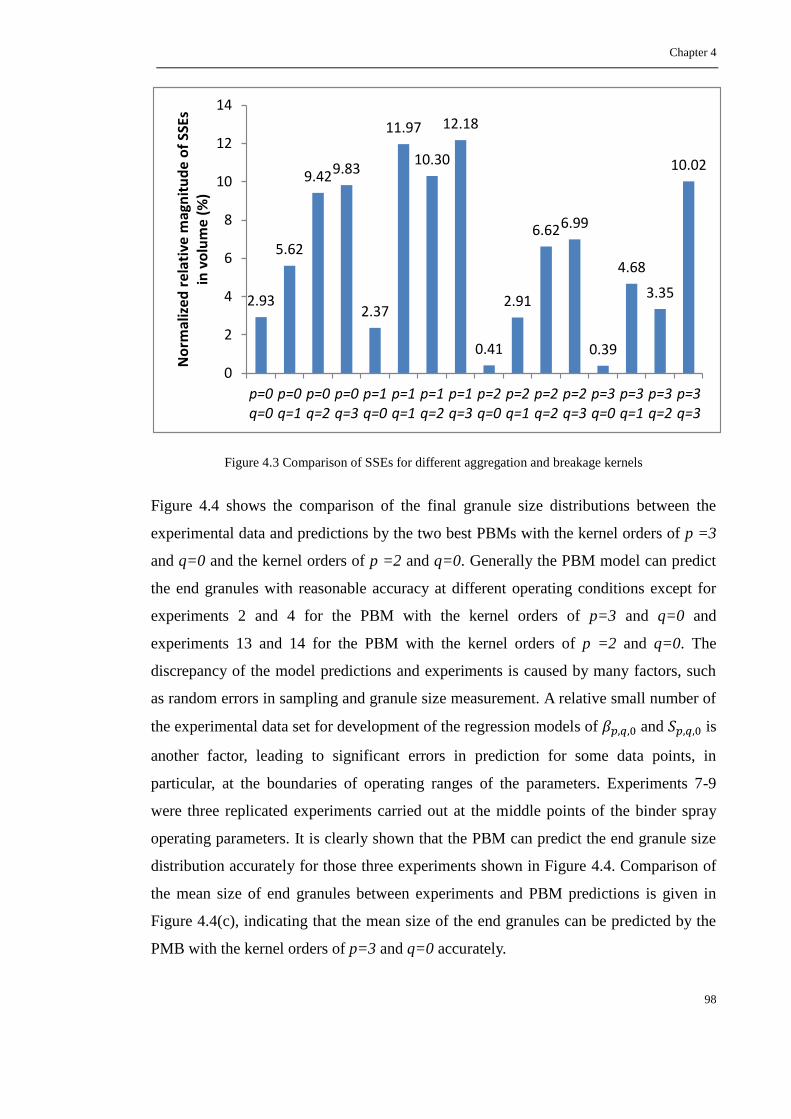
Chapter 4
98
Figure 4.3 Comparison of SSEs for different aggregation and breakage kernels
Figure 4.4 shows the comparison of the final granule size distributions between the
experimental data and predictions by the two best PBMs with the kernel orders of p =3
and q=0 and the kernel orders of p =2 and q=0. Generally the PBM model can predict
the end granules with reasonable accuracy at different operating conditions except for
experiments 2 and 4 for the PBM with the kernel orders of p=3 and q=0 and
experiments 13 and 14 for the PBM with the kernel orders of p =2 and q=0. The
discrepancy of the model predictions and experiments is caused by many factors, such
as random errors in sampling and granule size measurement. A relative small number of
the experimental data set for development of the regression models of and is
another factor, leading to significant errors in prediction for some data points, in
particular, at the boundaries of operating ranges of the parameters. Experiments 7-9
were three replicated experiments carried out at the middle points of the binder spray
operating parameters. It is clearly shown that the PBM can predict the end granule size
distribution accurately for those three experiments shown in Figure 4.4. Comparison of
the mean size of end granules between experiments and PBM predictions is given in
Figure 4.4(c), indicating that the mean size of the end granules can be predicted by the
PMB with the kernel orders of p=3 and q=0 accurately.
2.93
5.62
9.429.83
2.37
11.97
10.30
12.18
0.41
2.91
6.626.99
0.39
4.68
3.35
10.02
0
2
4
6
8
10
12
14
p=0q=0
p=0q=1
p=0q=2
p=0q=3
p=1q=0
p=1q=1
p=1q=2
p=1q=3
p=2q=0
p=2q=1
p=2q=2
p=2q=3
p=3q=0
p=3q=1
p=3q=2
p=3q=3
No
rma
lize
d r
ela
tive
ma
gnit
ud
e o
f SS
Es
in v
olu
me
(%
)
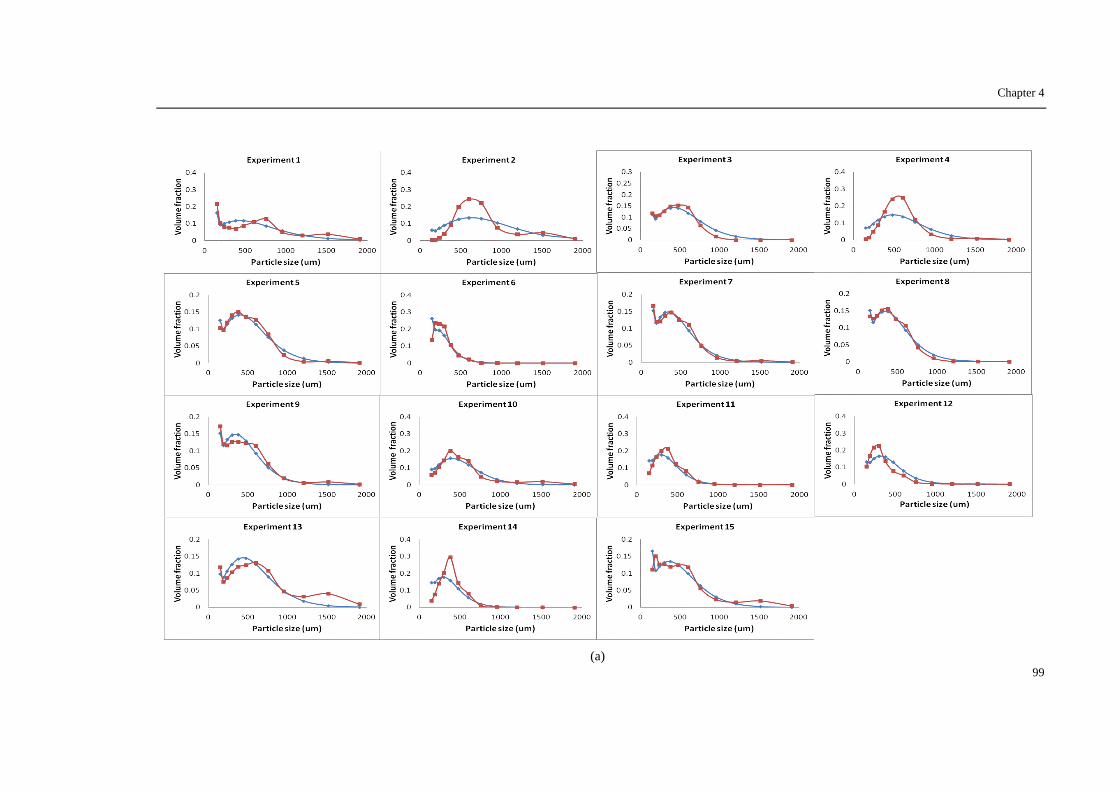
Chapter 4
99
(a)
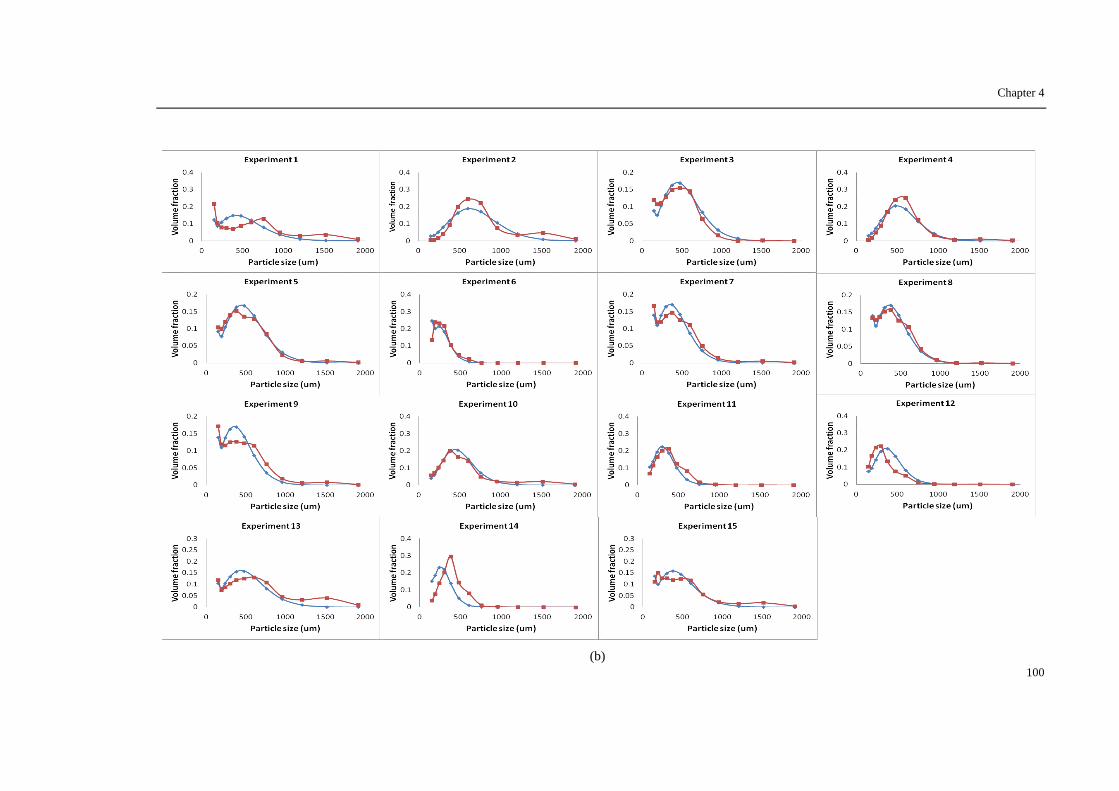
Chapter 4
100
(b)

Chapter 4
101
(c)
Figure 4.4 Comparison of experimental data with the predictions by the PBMs (red square: experimental
data; blue diamond: prediction value): (a) the kernel orders of p=3 and q=0; (b) Kernel order of p=2; and
q=0; (c) mean size.
In order to validate the developed PBM models, two further experiments in which all of
operating parameters were away from the boundaries from the previous study were
selected to compare the model predictions [198]. Figure 4.5 shows the validation results
of evolution of granule distribution predicted by the developed PBMs with the
experiment results at the operating conditions of x1=0.2, x2 = 0.33, x3 = -0.2,
corresponding the actual operating conditions of 0.6 of the pulsed frequency of spray,
1.3 g/min of spray rate of binding liquid, and 14 psi of atomizing air pressure. Generally
both of the developed PBMs can track the evolution of the granules at different times
with accuracy shown in Figure 4.5. The predicted errors decreased significantly with
increasing the spray time because that the PBMs were developed based on the end
granule size distributions. In order to reduce the discrepancy between the model and
experimental results at different spray times, more intermediate granules size

Chapter 4
102
distributions should be included in equation (4.8) to obtain the optimal granulation rate
and breakage selection rate constants. Based on the prediction error curve in Figure
4.5(d), it is shown that the PBM with the kernel orders of p=2 and q=0 had better
predictions for the granules at 30% and 70% of binder sprayed times compared with
those predicted the PBM with the kernel orders of p=3 and q=0.
(a)
.
(b)

Chapter 4
103
(c)
(d)
Figure 4.5 Validation of predictions of granule distribution by the PBMs with the kernel orders of p =3
and q=0 and the kernel order of p=2and q=0 at the operating condition of x1=0.2; x2 = 0.333; x3 = -0.2:
(a) at 30% binder sprayed; (b) at 70% binder sprayed; (c) at 100% binder sprayed; (d) evolution of
prediction errors.
Figure 4.6 shows the validation experiment at another operating condition of x1=0.6,
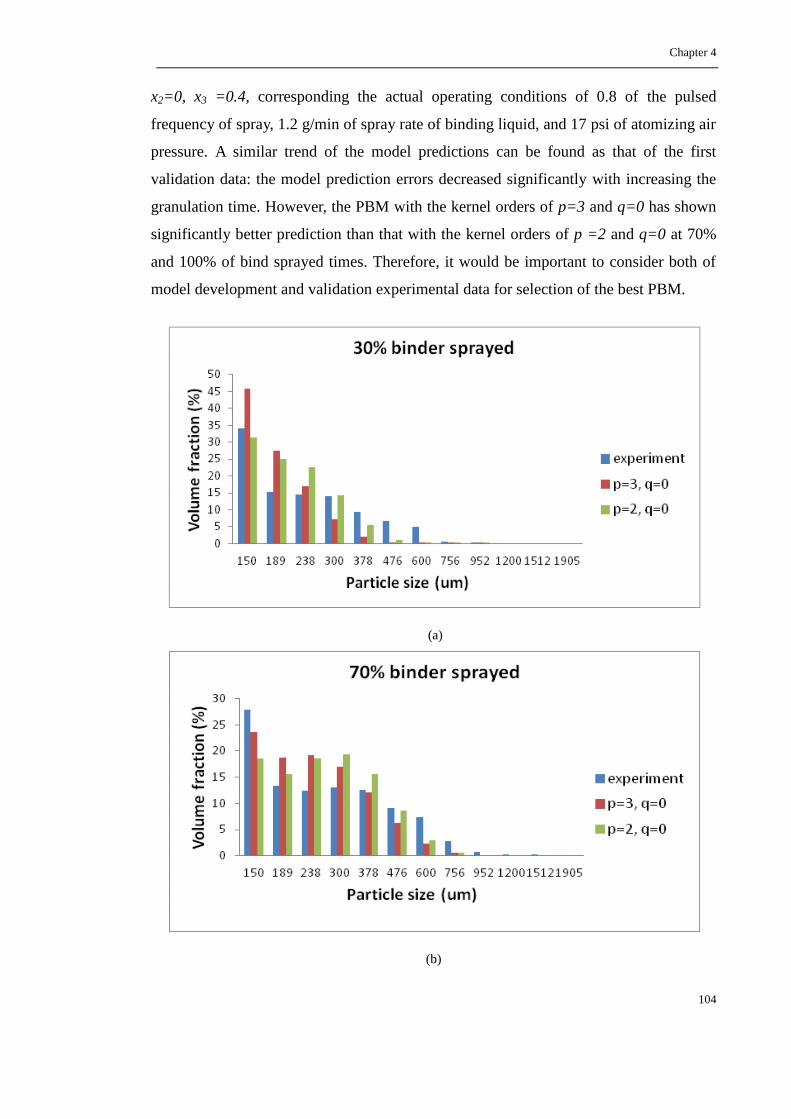
Chapter 4
104
x2=0, x3 =0.4, corresponding the actual operating conditions of 0.8 of the pulsed
frequency of spray, 1.2 g/min of spray rate of binding liquid, and 17 psi of atomizing air
pressure. A similar trend of the model predictions can be found as that of the first
validation data: the model prediction errors decreased significantly with increasing the
granulation time. However, the PBM with the kernel orders of p=3 and q=0 has shown
significantly better prediction than that with the kernel orders of p =2 and q=0 at 70%
and 100% of bind sprayed times. Therefore, it would be important to consider both of
model development and validation experimental data for selection of the best PBM.
(a)
(b)

Chapter 4
105
(c)
(d)
Figure 4.6 Validation of predictions of granule distribution by the PBMs with the kernel orders of p=3
and q=0 and the kernel order of p=2 and q=0 at the operating condition of x1=0.6; x2 = 0; x3 = 0.4: (a) at
30% binder sprayed; (b) at 70% binder sprayed; (c) at 100% binder sprayed; (d) evolution of prediction
errors.
4.5.2 Multi-stage optimal control of a pulsed top spray fluidized bed granulation
The optimization strategy to determine the optimal operating conditions of binder

Chapter 4
106
solution spray was applied to a simulation of a pulsed top spray fluidized bed
granulation process. The granulation process was simulated by the developed PBM with
the kernel orders of p=3 and q=0 given in Table 4.1. The process model used for
determination of the optimal operating conditions of binder solution spray was a
simplified process model in which coefficients are only statistically significant in the
models of the granulation rate and breakage selection rate constants. In this study, using
a 5% significance level, a factor is considered to affect the response if the coefficients
differ from zero significantly and the P-value is less than 0.05 (p<0.05) shown in Table
4.1. Therefore in the process model the granulation rate constant is given by
(4.13)
and the breakage selection rate constants is given by
(4.14)
Comparison of evolution of the granule mean sizes of granulation process and its
process model at different operating conditions of binder spray is given in Figure 4.7. It
is shown that at the center of each operating variable the process model can predict the
granule process accurately in Figure 4.7(a). The significant discrepancy between the
outputs of the granulation process and its process model can be found when the
operating variables are away from its center as shown in Figures 4.7(b) and 4.7(c).

Chapter 4
107
(a)
(b)
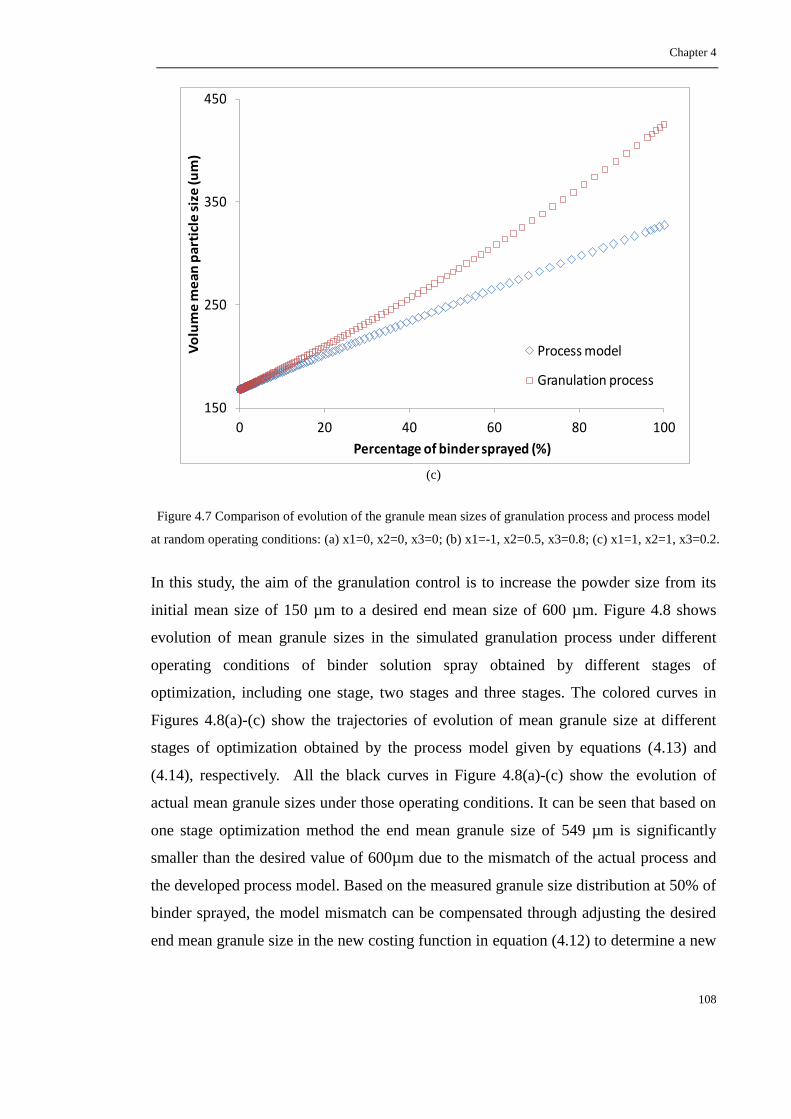
Chapter 4
108
(c)
Figure 4.7 Comparison of evolution of the granule mean sizes of granulation process and process model
at random operating conditions: (a) x1=0, x2=0, x3=0; (b) x1=-1, x2=0.5, x3=0.8; (c) x1=1, x2=1, x3=0.2.
In this study, the aim of the granulation control is to increase the powder size from its
initial mean size of 150 µm to a desired end mean size of 600 µm. Figure 4.8 shows
evolution of mean granule sizes in the simulated granulation process under different
operating conditions of binder solution spray obtained by different stages of
optimization, including one stage, two stages and three stages. The colored curves in
Figures 4.8(a)-(c) show the trajectories of evolution of mean granule size at different
stages of optimization obtained by the process model given by equations (4.13) and
(4.14), respectively. All the black curves in Figure 4.8(a)-(c) show the evolution of
actual mean granule sizes under those operating conditions. It can be seen that based on
one stage optimization method the end mean granule size of 549 µm is significantly
smaller than the desired value of 600µm due to the mismatch of the actual process and
the developed process model. Based on the measured granule size distribution at 50% of
binder sprayed, the model mismatch can be compensated through adjusting the desired
end mean granule size in the new costing function in equation (4.12) to determine a new
150
250
350
450
0 20 40 60 80 100
Vo
lum
e m
ea
n p
art
icle
siz
e (u
m)
Percentage of binder sprayed (%)
Process model
Granulation process

Chapter 4
109
trajectory (green color curve) shown in Figure 4.8(b). It is shown that the difference
between the end mean granule size and the desired granule size based on two-stage
optimization is reduced significantly to 26 µm from 51 µm based on one-stage
optimization. For a three-stage optimization, the end mean granule size is nearly same
as the desired mean size. The operation variables of the binder solution spray obtained
by the different stages of optimization are also given in Figure 4.8(a)-(c).
(a)

Chapter 4
110
(b)
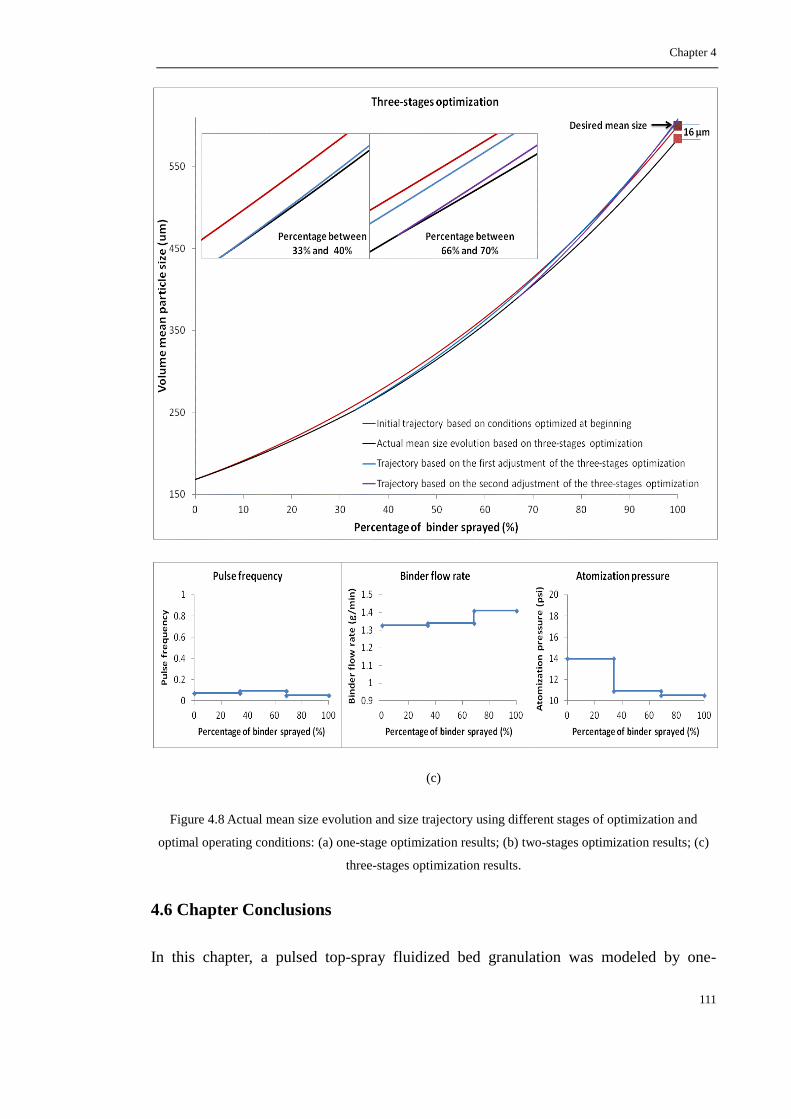
Chapter 4
111
(c)
Figure 4.8 Actual mean size evolution and size trajectory using different stages of optimization and
optimal operating conditions: (a) one-stage optimization results; (b) two-stages optimization results; (c)
three-stages optimization results.
4.6 Chapter Conclusions
In this chapter, a pulsed top-spray fluidized bed granulation was modeled by one-
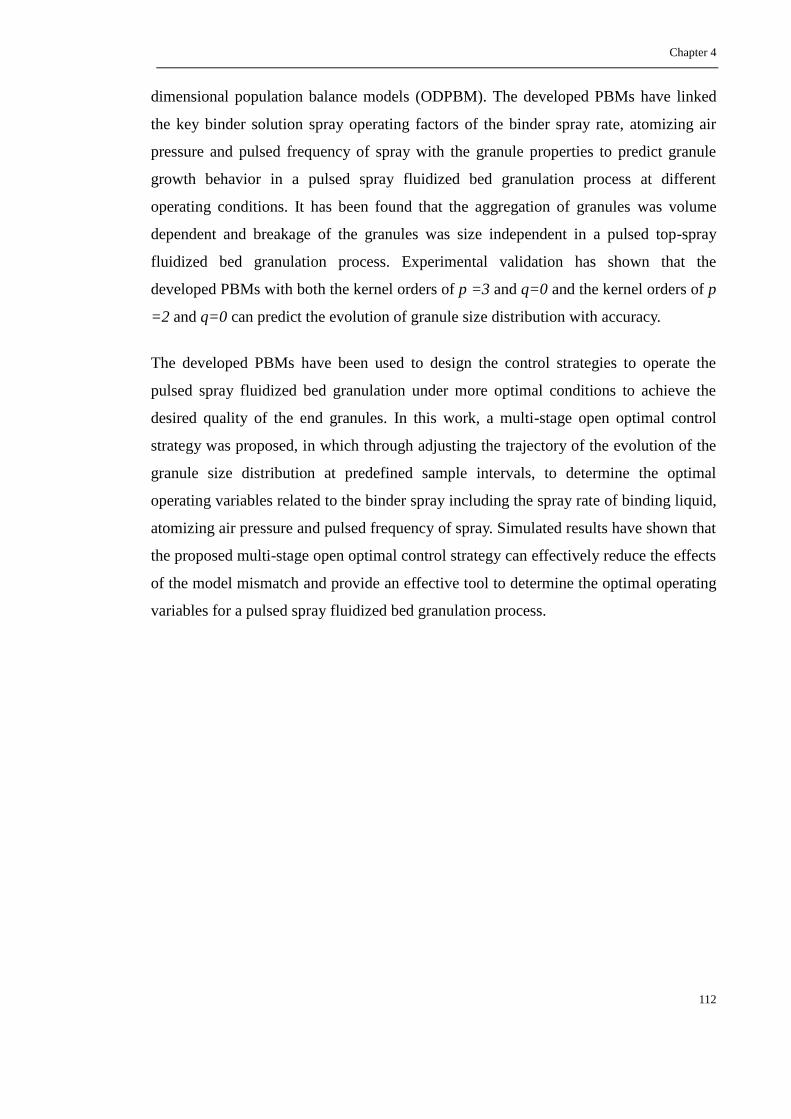
Chapter 4
112
dimensional population balance models (ODPBM). The developed PBMs have linked
the key binder solution spray operating factors of the binder spray rate, atomizing air
pressure and pulsed frequency of spray with the granule properties to predict granule
growth behavior in a pulsed spray fluidized bed granulation process at different
operating conditions. It has been found that the aggregation of granules was volume
dependent and breakage of the granules was size independent in a pulsed top-spray
fluidized bed granulation process. Experimental validation has shown that the
developed PBMs with both the kernel orders of p =3 and q=0 and the kernel orders of p
=2 and q=0 can predict the evolution of granule size distribution with accuracy.
The developed PBMs have been used to design the control strategies to operate the
pulsed spray fluidized bed granulation under more optimal conditions to achieve the
desired quality of the end granules. In this work, a multi-stage open optimal control
strategy was proposed, in which through adjusting the trajectory of the evolution of the
granule size distribution at predefined sample intervals, to determine the optimal
operating variables related to the binder spray including the spray rate of binding liquid,
atomizing air pressure and pulsed frequency of spray. Simulated results have shown that
the proposed multi-stage open optimal control strategy can effectively reduce the effects
of the model mismatch and provide an effective tool to determine the optimal operating
variables for a pulsed spray fluidized bed granulation process.

Chapter 5
113
Chapter 5 Three-dimensional computational fluid dynamics
(CFD) study of the gas-solid circulation pattern in a fluidized
bed granulator
5.1 Chapter overview
In this chapter, the particle-gas two-phase fluid dynamics within top-spray fluidized bed
granulator was studied by the commercial computational fluid dynamics (CFD)
software ANSYS Fluent 13.0. The fluid dynamic characteristics of fluidized bed
granulation process were studied by changing the particle size and inlet air velocity.
CFD simulations were designed by a two-factors three-levels full factorial experimental
design. The influence of particle size and inlet air velocity on the particle circulation
pattern was investigated and a mathematical relationship between the particle
circulation time with particle size and inlet air velocity was developed in this chapter.
5.2 CFD software packages
5.2.1 ANSYS ICEM CFD
The basic flowchart of a CFD simulation is pre-processing, calculation and post-
processing. The prerequisite for pre-processing is to create the geometry and to generate
the mesh, both of which, in this work, are completed using the powerful commercial
software ANSYS ICEM CFD 13.0 (Ansys Inc., US).
ANSYS ICEM CFD provides advanced geometry acquisition, mesh generation, and
mesh optimization tools to meet the requirement for integrated mesh generation for
today’s sophisticated analyses. ANSYS ICEM CFD can provide wide range of tools for
both creating new geometry and manipulating existing geometry. Different formats of
geometry can be transported into ANSYS ICEM CFD, such as geometry generated by a
commercial CAD design package, 3rd party universal database, scan data or point data.
Beginning with a robust geometry module which supports the creation and modification
of points, curves and surfaces, ANSYS ICEM CFD’s open geometry database offers the

Chapter 5
114
flexibility to combine geometric information in various formats for mesh generation.
The resulting structured or unstructured meshes, topology, inter-domain connectivity
and boundary conditions are then stored in a database where they can easily be
translated to input files formatted for a particular solver. Generally, ANSYS ICEM
CFD’s mesh generation tools offer the capability to parametrically create meshes from
geometry in numerous formats:
Multiblock structured
Unstructured hexahedral
Unstructured tetrahedral
Cartesian with H-grid refinement
Hybrid meshes comprising hexahedral, tetrahedral, pyramidal and/or prismatic
elements
Quadrilateral and triangular surface meshes
In the present work, the truncated conical 50 gram/batch lab scale fluidized bed
granulator with inner-diameter 4.97 cm at the bottom and 7.48 cm at the top and height
of 30 cm is modeled and meshed in ANSYS ICEM CFD 13.0. The granulator model is
created in three dimensional and meshed into ‘O’ type unstructured hexahedrons, which
is detailed shown in Figure 5.1.

Chapter 5
115
Figure 5.1 The geometry and mesh strategy of the fluidized bed granulator: (a) the fluidized bed
granulator overview; (b) the X-Y cross-sectional plane; (c) the inlet (blue) and outlet (red) cross-sectional
plane.
5.2.2 ANSYS Fluent
In this work, both procedures of calculation and post-processing of the CFD simulation
for gas-solid two-phase flow hydrodynamics within the top-spray fluidized bed
granulator are performed utilizing the commercial software package ANSYS Fluent
13.0 (Ansys Inc., US). Fluent is a state-of-the-art computer program for modelling fluid
flow and heat transfer in complex geometries. Generally, the Fluent solver has the
following modelling capabilities:
(a) (b) (c)

Chapter 5
116
Flow problems in 2D/3D
Steady-state and transient flow
Incompressible and compressible flows
Heat transfer
Chemical species mixing and reaction
Free surface and multiphase models
Lagrangian trajectory calculation
Cavitation model
Phase change model
Porous media
Inertial and non-inertial, multiple reference frames
Dynamic mesh model
Material property database
Extensive customization capability via user-defined functions
Population balance module
Regarding simulating multiphase flow, actually, several kinds of CFD software could be
considered, such as Fluent, CFX, COMSOL, MFIX, and Star-CD, among which
ANSYS Fluent is leading in multiphase modelling. Its powerful capabilities allow
engineers to gain insight into equipment that is often difficult to probe. ANSYS Fluent
can also be utilized to capture the interaction between multiple fluid phases, such as
gases and liquids, dispersed particles and droplets.
Different group of models are provided by ANSYS Fluent for multiphase flows. The
volume-of-fluid (VOF) model is offered for immiscible multiphase flows. The discrete
phase model (DPM) can be used for multiphase applications such as spray dryers, liquid
fuel sprays. For flows with denser droplets or particulates concentration, ANSYS Fluent
offers the dense DPM (DDPM) model. Furthermore, ANSYS Fluent discrete element
particles model (DEM) can be used to track the collisions between solids particles.
Recently, ANSYS Fluent was popularly used for modelling fluidized bed granulation or
fluidisation. A large number of research articles have been published in recent years on

Chapter 5
117
the application of ANSYS Fluent in analysis of fluidized bed granulation and
fluidization [141, 143, 144, 146, 177, 216-220].
5.3 CFD modeling strategy
An Eulerian-Eulerian two-fluid model (EETFM) which considers the conservation of
mass and momentum for the gas and particle phases [221] is utilized to model the
fluidized bed granulation in this chapter, which was already introduced in chapter 2.5.2
and was summarized together with the closure equations in Table 5.1. The standard
model was considered to describe the turbulence inside the fluidized bed
granulator, where the kinetic theory of granular flow was employed to close the
momentum balance equation for the solid phase. The finite volume approach by a
commercial CFD software package ANSYS Fluent 13.0 (Ansys Inc., US) was used for
solving the set of governing equations in Table 5.1 in a 3-D domain comprising all the
interior volume of the conical product chamber in the fluidized bed granulator in double
precision mode. The phase coupled SIMPLE algorithm was used for the pressure-
velocity coupling, in which the coupling terms were solved implicitly to form part of the
solution matrix. First order upwind schemes in both space and time were used for the
solution of the equations. The transient simulation mode is selected and a time step of
s with maximum 200 iterations per time step is utilized to ensure adequate
convergence. The convergence criterion was set to for the relative error
between two successive iterations for each scaled residual component.
Table 5.1 Models used for CFD simulations
Continuity
equation
Gas:
Solid:
Momentum
equation
Gas:
Solid:

Chapter 5
118
Stress tensors:
Gas solid drag
model [222]
Where,
Solid pressure
[223]
Bulk viscosity
Radial
distribution
function [223]
Kinetic theory
of granular flow
model [159]
[224] [223]
Simplified
KTGF
Solid dynamic
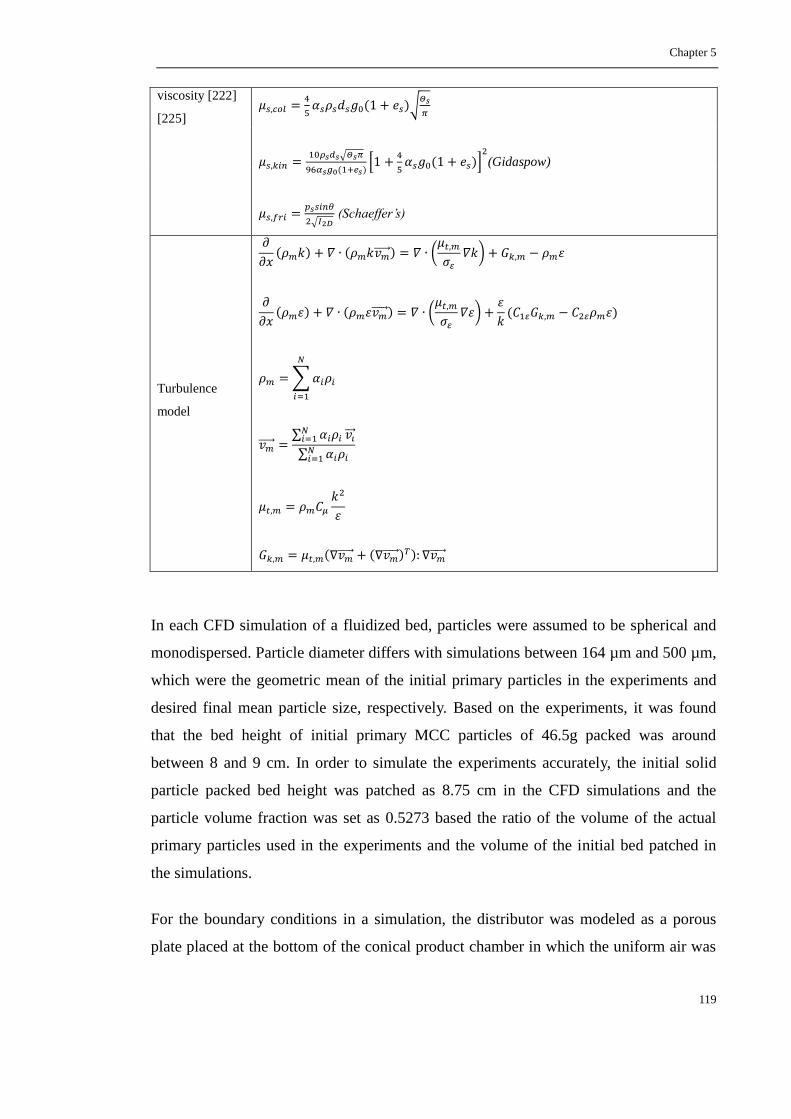
Chapter 5
119
viscosity [222]
[225]
(Gidaspow)
(Schaeffer’s)
Turbulence
model
In each CFD simulation of a fluidized bed, particles were assumed to be spherical and
monodispersed. Particle diameter differs with simulations between 164 µm and 500 µm,
which were the geometric mean of the initial primary particles in the experiments and
desired final mean particle size, respectively. Based on the experiments, it was found
that the bed height of initial primary MCC particles of 46.5g packed was around
between 8 and 9 cm. In order to simulate the experiments accurately, the initial solid
particle packed bed height was patched as 8.75 cm in the CFD simulations and the
particle volume fraction was set as 0.5273 based the ratio of the volume of the actual
primary particles used in the experiments and the volume of the initial bed patched in
the simulations.
For the boundary conditions in a simulation, the distributor was modeled as a porous
plate placed at the bottom of the conical product chamber in which the uniform air was
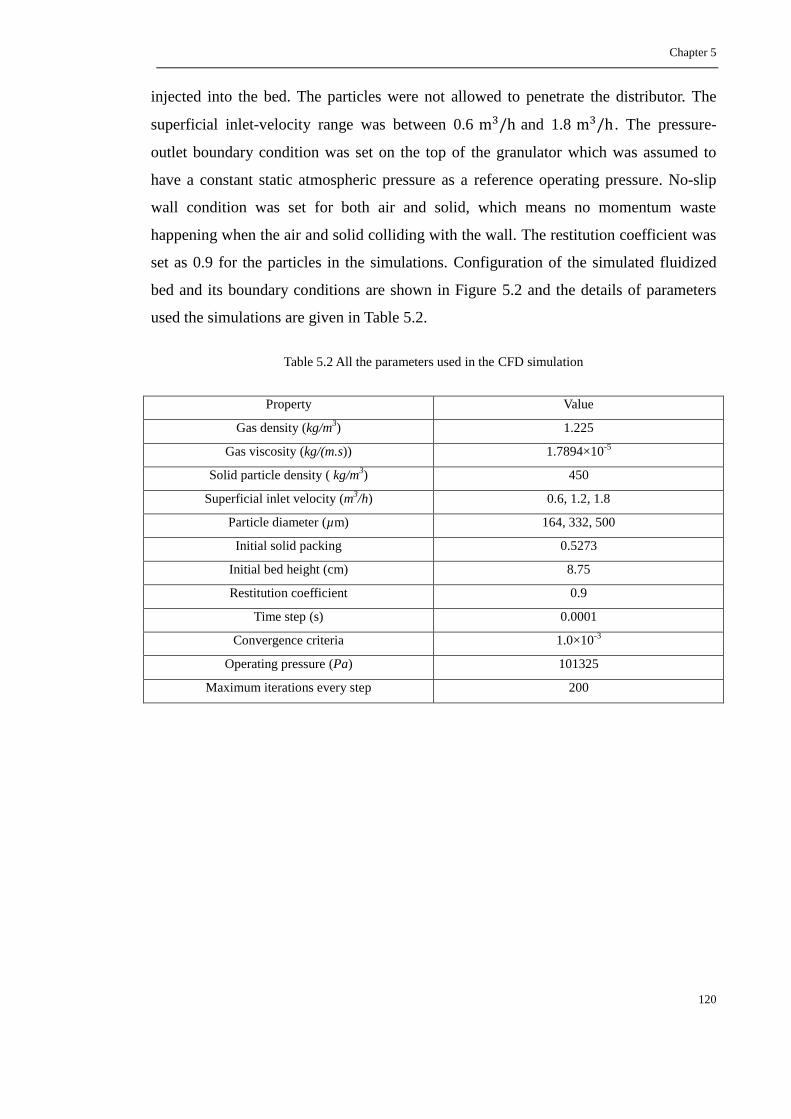
Chapter 5
120
injected into the bed. The particles were not allowed to penetrate the distributor. The
superficial inlet-velocity range was between 0.6 and 1.8 . The pressure-
outlet boundary condition was set on the top of the granulator which was assumed to
have a constant static atmospheric pressure as a reference operating pressure. No-slip
wall condition was set for both air and solid, which means no momentum waste
happening when the air and solid colliding with the wall. The restitution coefficient was
set as 0.9 for the particles in the simulations. Configuration of the simulated fluidized
bed and its boundary conditions are shown in Figure 5.2 and the details of parameters
used the simulations are given in Table 5.2.
Table 5.2 All the parameters used in the CFD simulation
Property Value
Gas density (kg/m3) 1.225
Gas viscosity (kg/(m.s)) 1.7894×10⁻⁵
Solid particle density ( kg/m3) 450
Superficial inlet velocity (m3/h) 0.6, 1.2, 1.8
Particle diameter (µm) 164, 332, 500
Initial solid packing 0.5273
Initial bed height (cm) 8.75
Restitution coefficient 0.9
Time step (s) 0.0001
Convergence criteria 1.0×10⁻³
Operating pressure (Pa) 101325
Maximum iterations every step 200

Chapter 5
121
Figure 5.2 The geometry and boundary conditions used in the simulations
The CFD simulations were performed on a 2 GHz Intel Four Core processor desktop
computer with 4 GB RAM using a XP platform. Mesh sensitivity studies were carried
out at three different grids with total cells of 60000, 101400, and 135000. Three
parameters of the bed solid volume fraction, bed pressure drop and bed height were
used to monitor the effect of grid density on the simulation results in Figure 5.3,
indicating that the grid with a total amount of 101400 cells was adequate to give a grid
independent results, which was used in all the simulations.
Distributor:
Homogeneous Velocity-inlet
Top:
Pressure-outlet
Reference operating pressure
=7.48cm
=4.97cm
Walls:
Non-slip condition for air
and particle
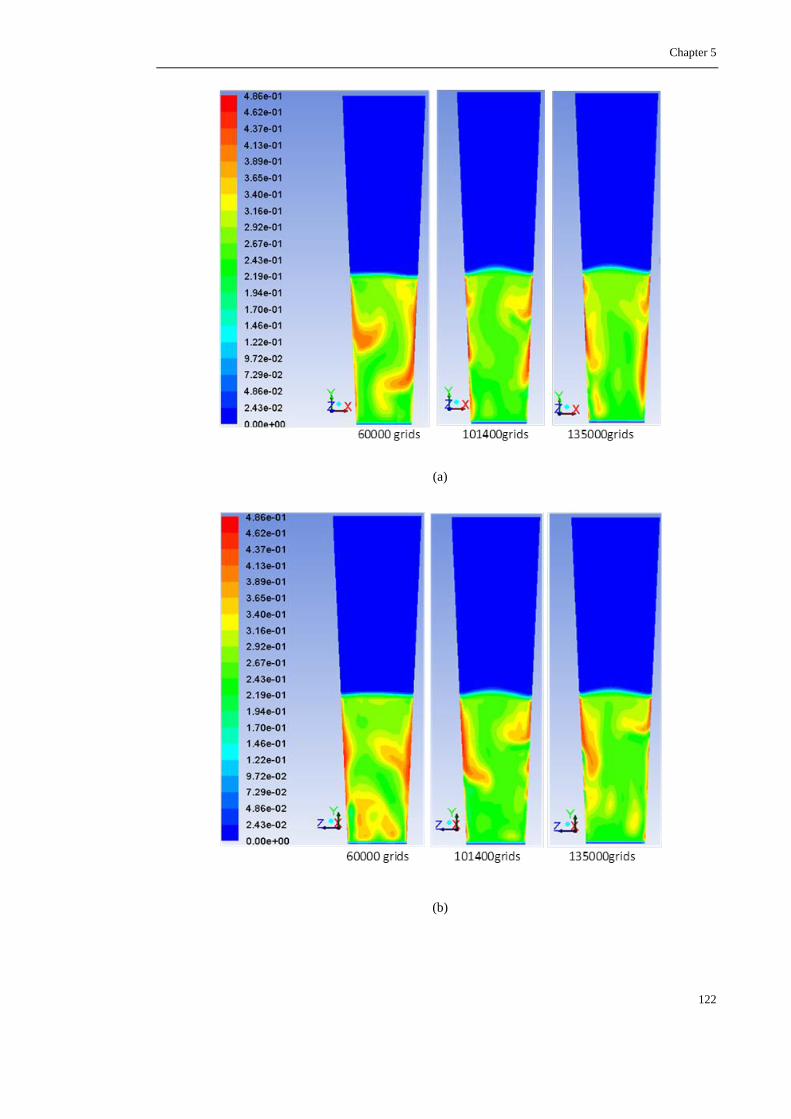
Chapter 5
122
(a)
(b)

Chapter 5
123
(c)
(d)
Figure 5.3 Mesh sensitivity study results; (a) solid volume fraction on cross-sectional plane XY; (b) solid
volume fraction on cross-sectional plane YZ; (c) pressure drop with time; (d) bed height with time.
180
185
190
195
200
0 1 2 3 4
Pre
ssu
re d
rop
(P
asca
l)
Time (s)
60000 grids
101400 grids
135000 grids
0.08
0.1
0.12
0.14
0.16
0.18
0 1 2 3 4
Be
d h
eig
ht
(m)
Time (s)
60000 grids
101400 grids
135000 grids
Chapter 5
124
5.4 Design of CFD simulations
In the current study, the solid circulation pattern is represented by the particle
circulation time and the granulation process is simulated by increasing the particle size
and inlet air velocity. In order to investigate the relationship between the solid
circulation pattern with inlet air velocity and the particle size, CFD simulations were
designed using JMP 11.0 software (SAS, SAS Institute, Cary, NC, USA). The full
factorial experimental design method is selected with air velocity and particle size as
factors and each factor has three levels. The low, medium and high levels of each
independent factor are determined based on the preliminary experimental study in
chapter 3, which represents the beginning, medium and final stages of the granulation
experiments, respectively. A total of 9 CFD simulations are designed based on the full
factorial experimental design as shown in Table 5.3. A non-linear quadratic model
generated by the full-factorial experiment design method is given as:
(5.1a)
(5.1b)
(5.1c)
where Y is a measured response associated with each factors combination; is an
intercept; to are regression coefficients calculated from the observed
experimental values of Y; and are the real values of independent variables and
, and , are the minimum and maximum value of variable
and , respectively. The term represents the interaction effect.

Chapter 5
125
Table 5.3 The full factorial experimental design and responses
Run Independent variables Dependent variables
Mode X1 X2 Y1
1 −− 164 0.6 2.57
2 −0 164 1.2 2.22
3 −+ 164 1.8 2.02
4 0− 332 0.6 3.23
5 00 332 1.2 2.37
6 0+ 332 1.8 2.22
7 +− 500 0.6 4.61
8 +0 500 1.2 2.56
9 ++ 500 1.8 2.32
5.5 Results and discussion
5.5.1 Convergence to quasi-steady state and verification of CFD model
The CFD simulation in this study was carried out in transient mode. Although the solid
flow in the bed is unsteady with changes of local velocity in both magnitude and
direction during fluidization, it is important to ensure that the CFD simulation reaches
quasi-steady-state conditions, in which the gas-solid flow dynamics is generally time
independent. In order to determine the simulation time to the quasi-steady state,
different variables, including the bed steady state pressure drop, the bed height and solid
volume fraction on the cross section of X-Y plane, were monitored for simulation 1
shown in Figure 5.4. It is clearly seen that the quasi-steady-state conditions were
reached after 5s because all of parameters showed constant values during process. The
time needed to reach the quasi-steady state differs between all the simulations. However,
study using the same method has shown that all the simulations designed in section 5.4
can reach quasi-steady state after 5 s. Therefore all the results obtained from the CFD
simulations are based on the time averaged values from 5s to 10s throughout the thesis.
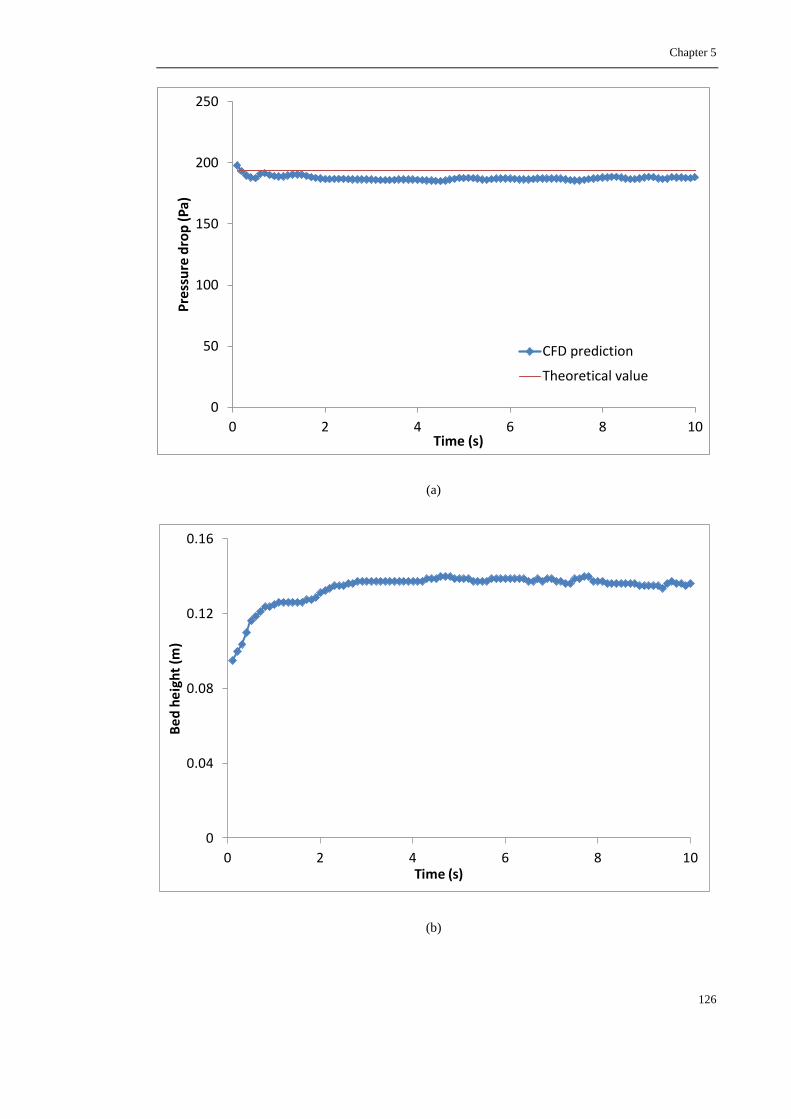
Chapter 5
126
(a)
(b)
0
50
100
150
200
250
0 2 4 6 8 10
Pre
ssu
re d
rop
(P
a)
Time (s)
CFD prediction
Theoretical value
0
0.04
0.08
0.12
0.16
0 2 4 6 8 10
Be
d h
eig
ht
(m)
Time (s)

Chapter 5
127
(c)
Figure 5.4 Convergence to quasi-steady state and validation studies for CFD simulation: (a) bed pressure
drop; (b) Bed height; (c) distribution of solid volume fraction on the cross section of the XY plane
0.1s 0.2s 0.4s 0.6s 0.8s 1.0s 1.2s
1.4s 1.6s 1.8s 2.0s 2.2s 2.5s 3.0s
4.0s 5.0s 6.0s 7.0s 8.0s 9.0s 10s

Chapter 5
128
The effectiveness of the CFD simulation can be validated through comparison of the
theoretical prediction and numerical simulation result of the total pressure drop of the
bed [226]. It is well known that among all the parameters describing the fluidized bed
granulation performance, the pressure drop is one of the most important ones, in
particular, in scale-up and design of fluidized bed granulator. In the current study,
pressure drop is selected to validate the CFD model by comparing the pressure drop
obtained from the CFD simulation with the classical calculated data. At the minimum
fluidization conditions, the powder in the bed is fully supported by the upward gas flow.
The force generated by the upward gas is proportional with the pressure drop, which is
mainly balanced by the weight of the solid bed. Therefore, the pressure drop across the
bed is given as [226]:
(5.2)
where, and
are the particle and air densities, and are the bed height and
the bed voidage at the minimum fluidization velocity, and is the product
chamber height. Based on the experiment, it was found that the bed height at the
minimum fluidization velocity was 12.7cm and then the bed voidage can be determined
as 0.6588. Figure 5.4(a) shows the comparison between the CFD predicted pressure
drop and theoretically calculated value as 193.90 Pa. It is indicated that at the beginning
of fluidization the overall pressure drop decreases significantly and then fluctuates
around a steady-state value of 187 Pa after 5s. It can be seen that the steady-state value
of 193.90 Pa obtained by the CFD simulation is in reasonably good agreement with the
theatrically calculated value, indicating that the CFD model can be used to predict the
performance of a fluidized bed.
5.5.2 Particle flow characteristics
Figure 5.5 shows the time-averaged upward and downward particle velocity at different
bed height in the CFD simulation 1. All the other simulations have the similar curve
trend and are not given here. It can be seen that both the upward particle flow velocity
and downward particle flow velocity increases with bed height from the granulator
bottom and starts to decrease with bed height from the middle of the bed until the bed
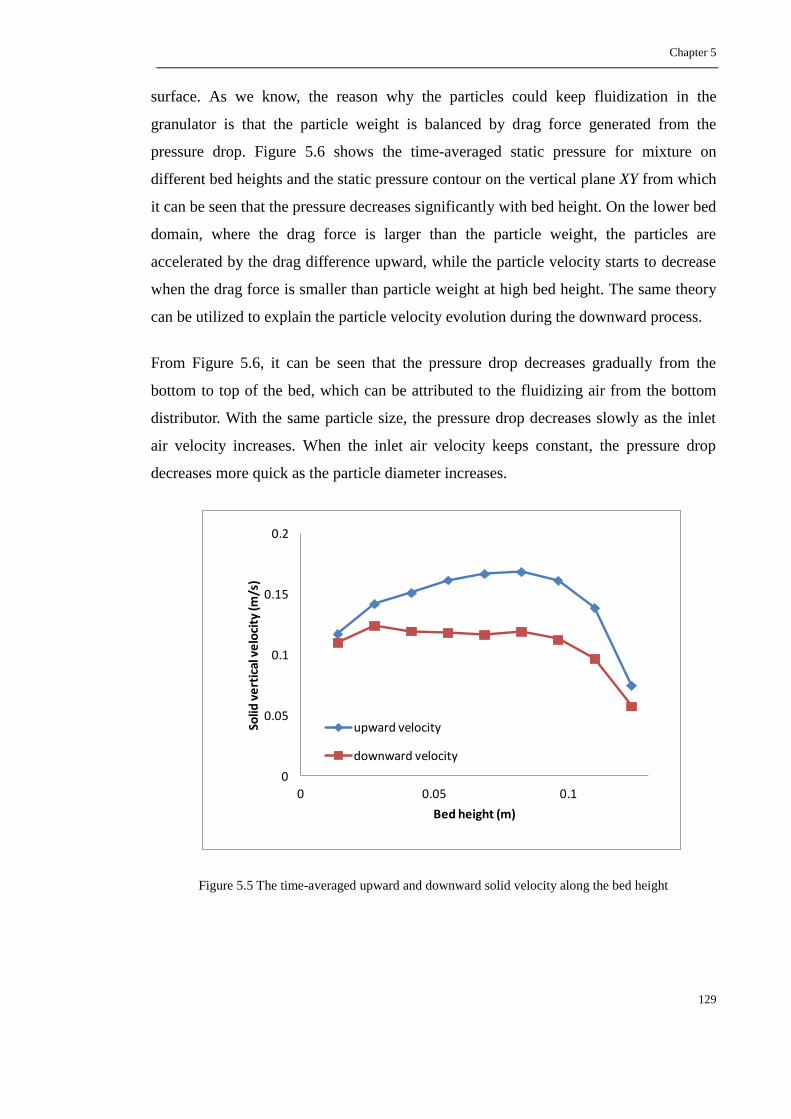
Chapter 5
129
surface. As we know, the reason why the particles could keep fluidization in the
granulator is that the particle weight is balanced by drag force generated from the
pressure drop. Figure 5.6 shows the time-averaged static pressure for mixture on
different bed heights and the static pressure contour on the vertical plane XY from which
it can be seen that the pressure decreases significantly with bed height. On the lower bed
domain, where the drag force is larger than the particle weight, the particles are
accelerated by the drag difference upward, while the particle velocity starts to decrease
when the drag force is smaller than particle weight at high bed height. The same theory
can be utilized to explain the particle velocity evolution during the downward process.
From Figure 5.6, it can be seen that the pressure drop decreases gradually from the
bottom to top of the bed, which can be attributed to the fluidizing air from the bottom
distributor. With the same particle size, the pressure drop decreases slowly as the inlet
air velocity increases. When the inlet air velocity keeps constant, the pressure drop
decreases more quick as the particle diameter increases.
Figure 5.5 The time-averaged upward and downward solid velocity along the bed height
0
0.05
0.1
0.15
0.2
0 0.05 0.1
Solid
ve
rtic
al v
elo
city
(m/s
)
Bed height (m)
upward velocity
downward velocity
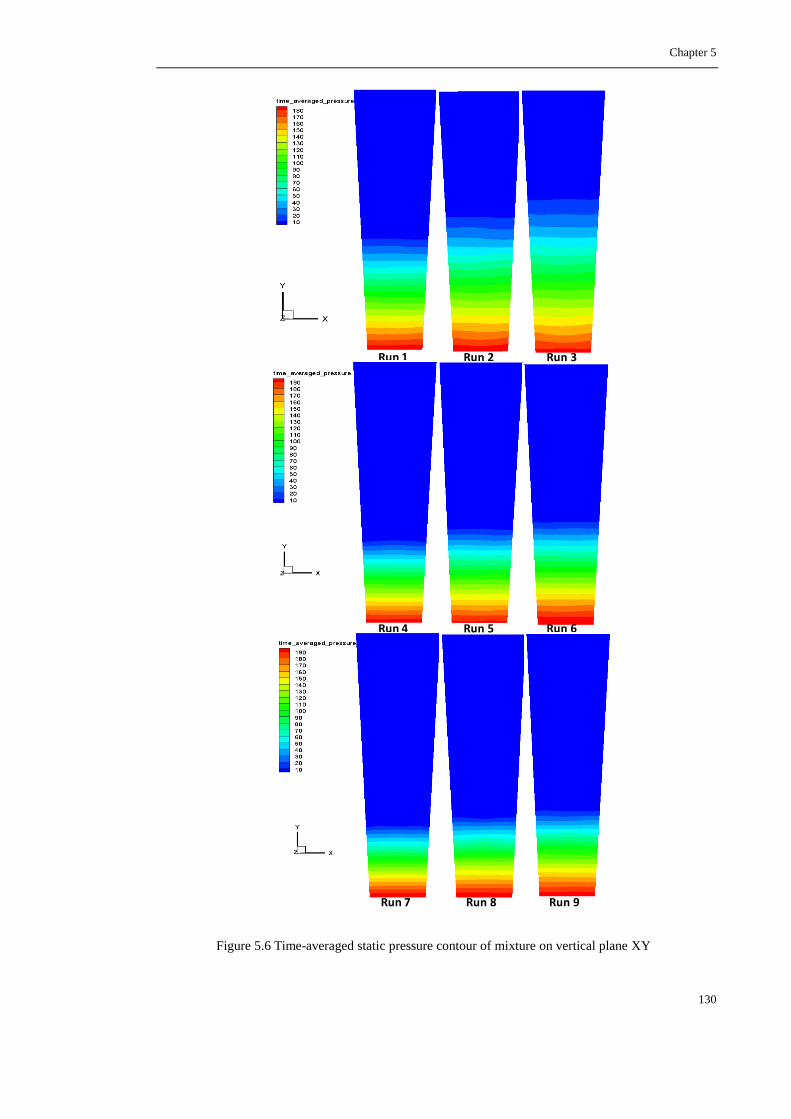
Chapter 5
130
Figure 5.6 Time-averaged static pressure contour of mixture on vertical plane XY
Run 1 Run 2 Run 3
Run 4 Run 5 Run 6
Run 7 Run 8 Run 9
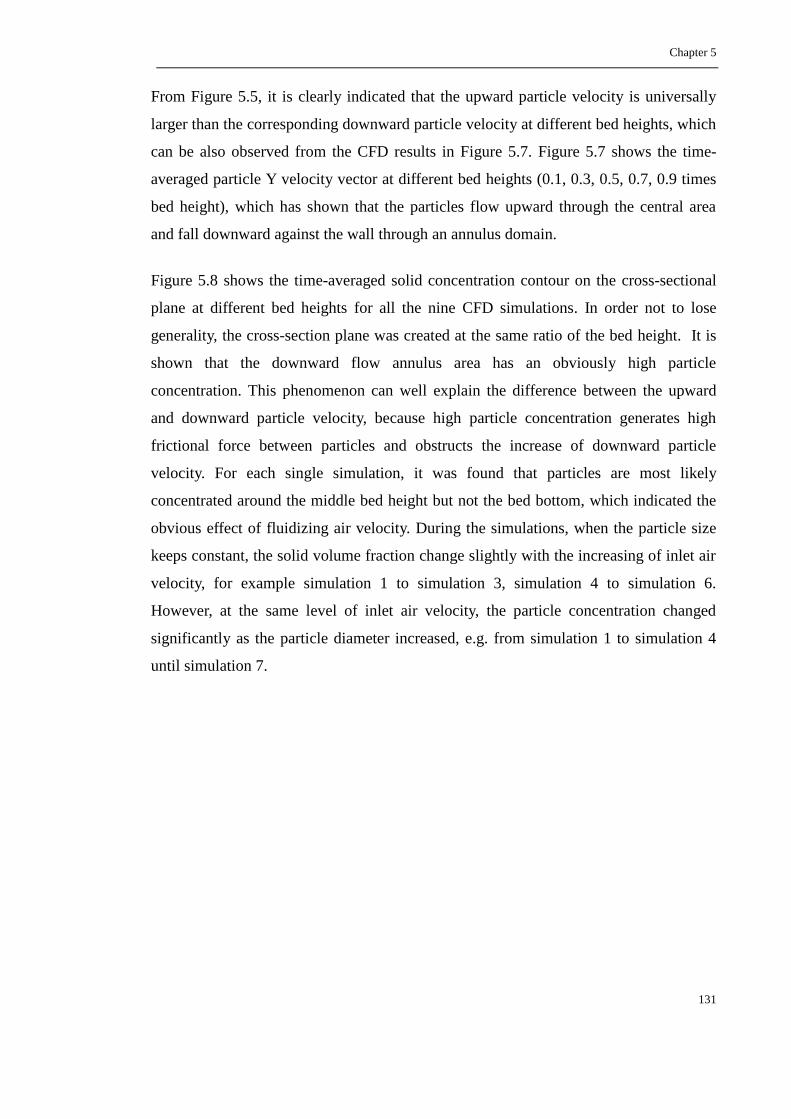
Chapter 5
131
From Figure 5.5, it is clearly indicated that the upward particle velocity is universally
larger than the corresponding downward particle velocity at different bed heights, which
can be also observed from the CFD results in Figure 5.7. Figure 5.7 shows the time-
averaged particle Y velocity vector at different bed heights (0.1, 0.3, 0.5, 0.7, 0.9 times
bed height), which has shown that the particles flow upward through the central area
and fall downward against the wall through an annulus domain.
Figure 5.8 shows the time-averaged solid concentration contour on the cross-sectional
plane at different bed heights for all the nine CFD simulations. In order not to lose
generality, the cross-section plane was created at the same ratio of the bed height. It is
shown that the downward flow annulus area has an obviously high particle
concentration. This phenomenon can well explain the difference between the upward
and downward particle velocity, because high particle concentration generates high
frictional force between particles and obstructs the increase of downward particle
velocity. For each single simulation, it was found that particles are most likely
concentrated around the middle bed height but not the bed bottom, which indicated the
obvious effect of fluidizing air velocity. During the simulations, when the particle size
keeps constant, the solid volume fraction change slightly with the increasing of inlet air
velocity, for example simulation 1 to simulation 3, simulation 4 to simulation 6.
However, at the same level of inlet air velocity, the particle concentration changed
significantly as the particle diameter increased, e.g. from simulation 1 to simulation 4
until simulation 7.
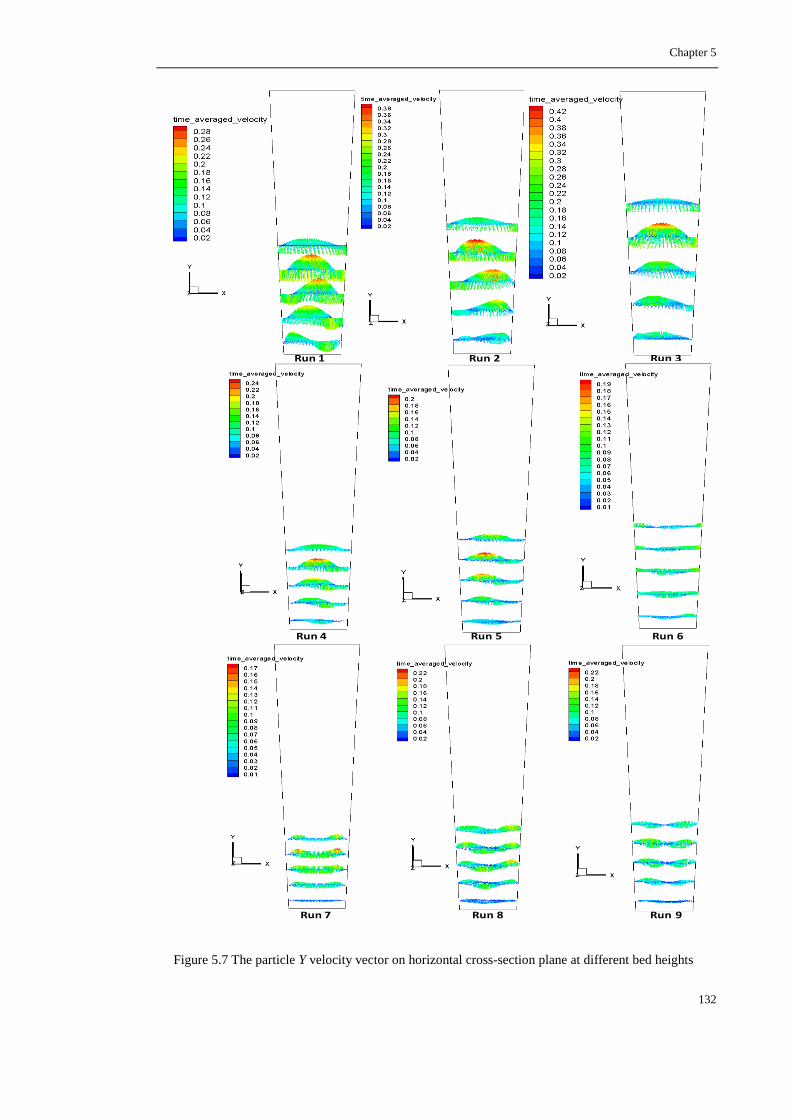
Chapter 5
132
Figure 5.7 The particle Y velocity vector on horizontal cross-section plane at different bed heights
Run 1 Run 2 Run 3
Run 4 Run 5 Run 6
Run 7 Run 8 Run 9
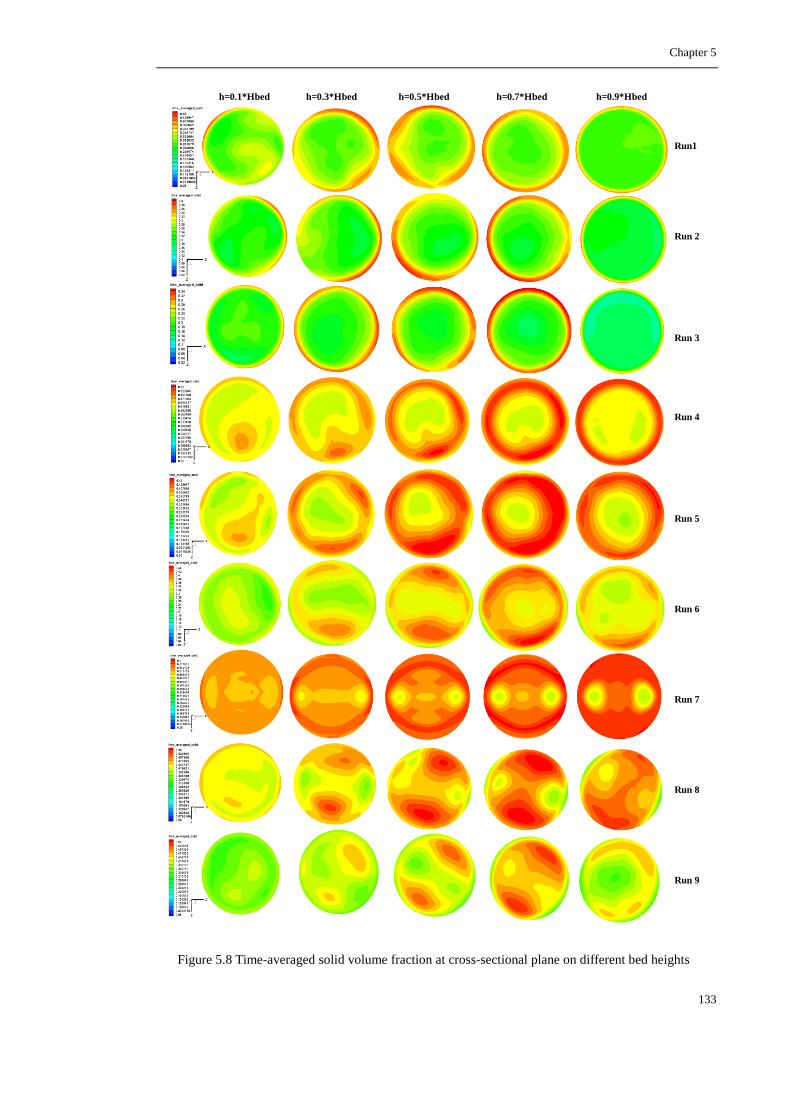
Chapter 5
133
Figure 5.8 Time-averaged solid volume fraction at cross-sectional plane on different bed heights
h=0.1*Hbed h=0.3*Hbed h=0.5*Hbed h=0.7*Hbed h=0.9*Hbed
Run1
Run 2
Run 3
Run 4
Run 5
Run 6
Run 7
Run 8
Run 9
Chapter 5
134
However, although the upward particle velocity is large than the downward particle
velocity, the particle volume exchange flow rate between two adjacent compartments
has reached a balance state through any horizontal plane as the particles moves
vertically. The volume flow rate (m3/s) through any horizontal plane ( ) was
calculated from the Fluent simulation by the following equation in terms of discretized
form:
(5.3a)
(5.3b)
where, is the cell volume, is the time-averaged solid volume fraction of the cell ,
is the cross section area of the cell with the horizontal surface, is the
particle velocity in cell on the surface through which particle moves upward,
is the particle velocity in cell on the surface through which particle moves
downward.
Figure 5.9(a), (b), (c) have shown the particle volume flow rate through three horizontal
planes which are randomly created at heights of 0.0344m, 0.0688m and 0.1032m in
simulation 1, respectively. It is indicated that at the beginning time before 4 seconds the
upward particle volume flow rate is larger than the downward volume flow rate,
because of the initial particle patching at the bottom of the bed. After 4 seconds, it can
be seen that the evolution of the two particle volume flow rates is high consistent with
time, because the fluidization basically has reached the quasi-steady state.

Chapter 5
135
(a)
(b)
0E+00
2E-05
4E-05
6E-05
8E-05
0 2 4 6 8 10
Par
ticl
e v
olu
me
flo
w r
ate
(m3
/s)
Time (s)
upward at h=0.0344m
downward at h=0.0344m
0E+00
2E-05
4E-05
6E-05
8E-05
0 2 4 6 8 10
Par
ticl
e v
olu
me
flo
w r
ate
(m3
/s)
Time (s)
upward at h=0.0688m
downward at h=0.0688m
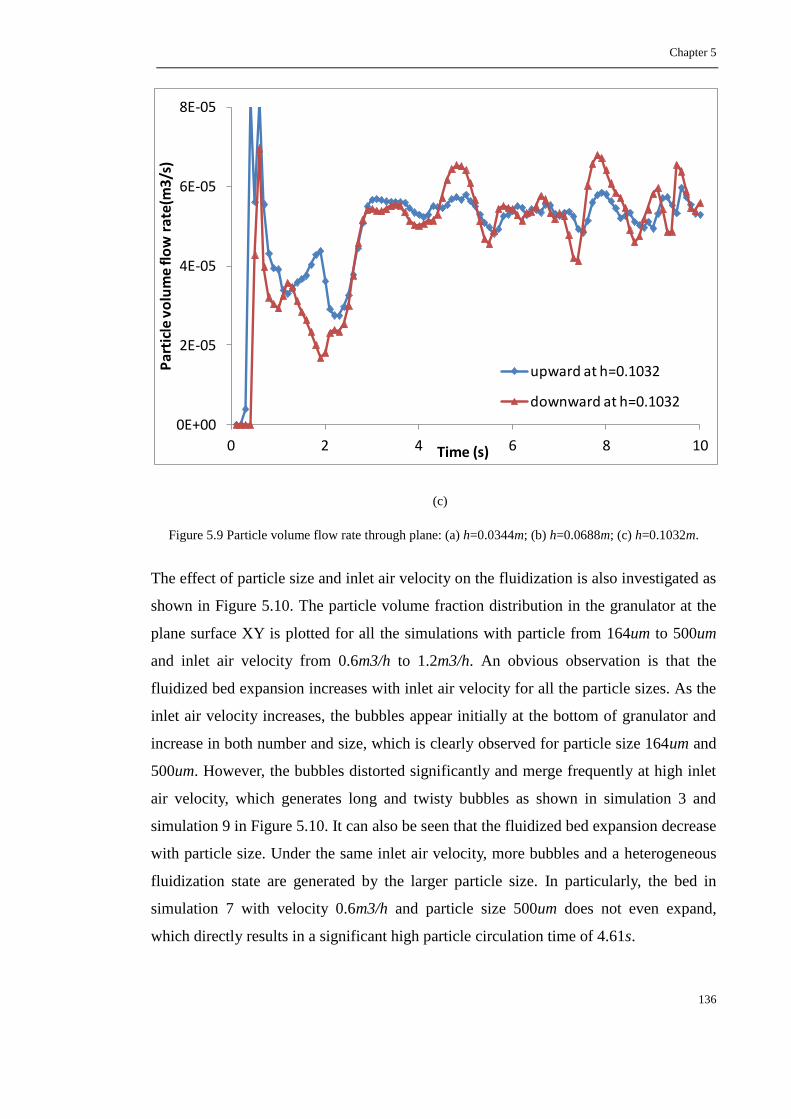
Chapter 5
136
(c)
Figure 5.9 Particle volume flow rate through plane: (a) h=0.0344m; (b) h=0.0688m; (c) h=0.1032m.
The effect of particle size and inlet air velocity on the fluidization is also investigated as
shown in Figure 5.10. The particle volume fraction distribution in the granulator at the
plane surface XY is plotted for all the simulations with particle from 164um to 500um
and inlet air velocity from 0.6m3/h to 1.2m3/h. An obvious observation is that the
fluidized bed expansion increases with inlet air velocity for all the particle sizes. As the
inlet air velocity increases, the bubbles appear initially at the bottom of granulator and
increase in both number and size, which is clearly observed for particle size 164um and
500um. However, the bubbles distorted significantly and merge frequently at high inlet
air velocity, which generates long and twisty bubbles as shown in simulation 3 and
simulation 9 in Figure 5.10. It can also be seen that the fluidized bed expansion decrease
with particle size. Under the same inlet air velocity, more bubbles and a heterogeneous
fluidization state are generated by the larger particle size. In particularly, the bed in
simulation 7 with velocity 0.6m3/h and particle size 500um does not even expand,
which directly results in a significant high particle circulation time of 4.61s.
0E+00
2E-05
4E-05
6E-05
8E-05
0 2 4 6 8 10
Par
ticl
e v
olu
me
flo
w r
ate
(m3
/s)
Time (s)
upward at h=0.1032
downward at h=0.1032

Chapter 5
137
Figure 5.10 Time-averaged particle volume fraction for all the simulations at the plane XY.
Run 1 Run 2 Run 3
Run 4 Run 5 Run 6
Run 7 Run 8 Run 9
Chapter 5
138
5.5.3 Particle circulation time
In the fluidized bed granulator, the particle circulation pattern is a very important design
attribute of the granulation process, which can be utilized to explain how the
aggregation and breakage are happening. As described in chapter 3, the inlet air velocity
in the experiments is increased gradually with time to keep the constant flow pattern
[227]. In this chapter, the particle circulation time will be considered as an indicator of
the particle circulation pattern to investigate the effect of particle size and inlet air
velocity on it.
The particle circulation time in the current study is defined as the sum of time required
for the particles to reach the bed surface and return back to the air distributor, as
described by Rowe [227]:
(5.4)
Where, and are the total upward flowing particle volume and total
downward flowing particle volume, respectively. and are the
average upward particle volume flow rate and average downward particle volume flow
rate, respectively.
(5.5a)
(5.5b)
and
(5.6a)
(5.6b)
(5.6c)
Where, is the cell volume, is the time-averaged solid volume fraction of the cell

Chapter 5
139
, is the cross section area of the cell with the horizontal surface ,
is the particle velocity in cell on the surface through which particle moves upward,
is the particle velocity in cell on the surface through which particle moves
downward, in the grid number along y-axis, and is the chamber height.
Using this method, the particle circulation time was calculated for all the nine CFD
simulations and filled in the Table 5.3 for later analysis.
Figure 5.11 shows the effect of particle size and inlet air velocity on the particle
circulation time in the fluidized bed granulator. It can be seen that the circulation time
decreases with inlet air velocity and increase with particle size under the same inlet air
velocity. Three CFD simulations run1, run 5 and run 9 with particle size 164um, 332um,
and 500 um, respectively, are marked on Figure 5.11. It can be seen that the circulation
time can be kept constant by adjusting the inlet air velocity from the observation that the
three marked simulations have similar circulation time while particle size increased
from 164um to 500um. For the simulation 7 with condition of particle size 500 um and
inlet air velocity 0.6 m3/h, an apparent high circulation time 4.61s is observed, which is
caused by the defluidization of the solid bed that will be discussed later. From our
previous experimental study [228], it is known that the final particle mean size has a
significant range from 290 um to 734 um among all the experiments. In addition,
considering the increasing bed humidity in reality, the inlet air velocity has to be
adjusted to keep the solid flow pattern constant.
The process model parameters of , , , and in equation (5.1) can be obtained
using JMP 11 software (SAS, SAS Institute, Cary, NC, USA). A mathematical model
between the particle circulation time and particle size and inlet air velocity is developed
by the JMP software is given as follows:
(5.7)
Where, is the mean particle diameter in um and is the inlet air velocity in
m3/h. If the particle size distribution can be obtained online, the particle circulation time
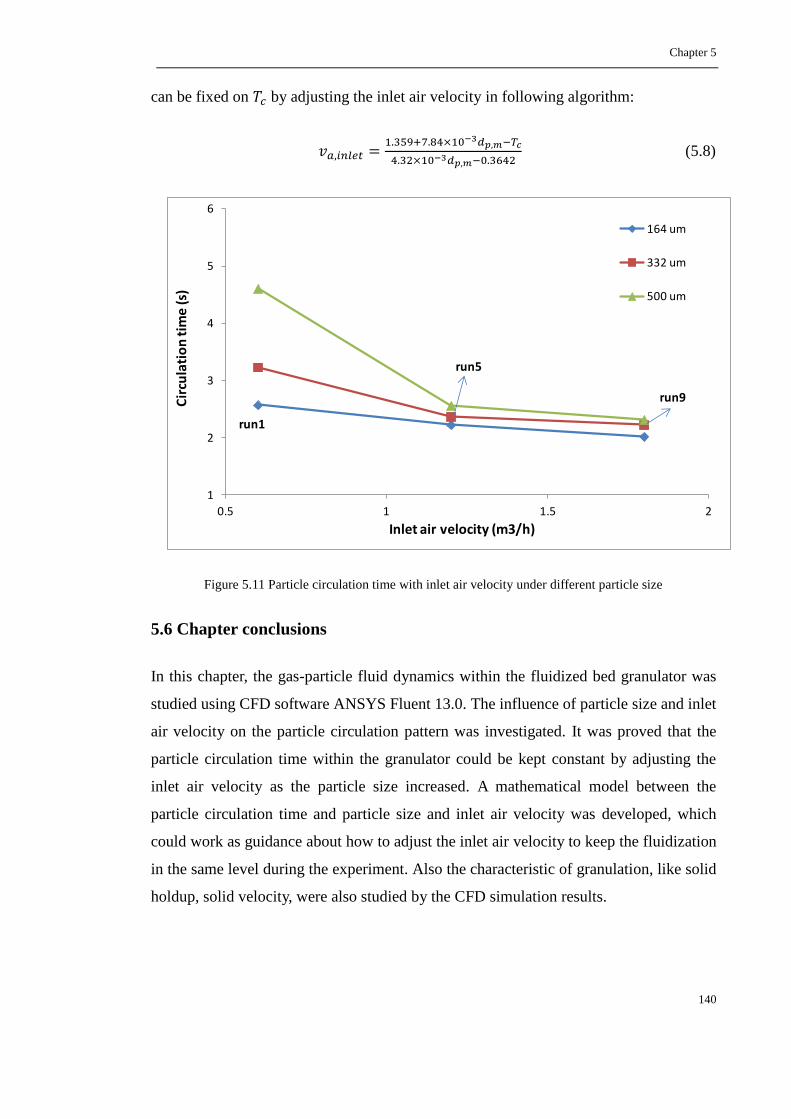
Chapter 5
140
can be fixed on by adjusting the inlet air velocity in following algorithm:
(5.8)
Figure 5.11 Particle circulation time with inlet air velocity under different particle size
5.6 Chapter conclusions
In this chapter, the gas-particle fluid dynamics within the fluidized bed granulator was
studied using CFD software ANSYS Fluent 13.0. The influence of particle size and inlet
air velocity on the particle circulation pattern was investigated. It was proved that the
particle circulation time within the granulator could be kept constant by adjusting the
inlet air velocity as the particle size increased. A mathematical model between the
particle circulation time and particle size and inlet air velocity was developed, which
could work as guidance about how to adjust the inlet air velocity to keep the fluidization
in the same level during the experiment. Also the characteristic of granulation, like solid
holdup, solid velocity, were also studied by the CFD simulation results.
1
2
3
4
5
6
0.5 1 1.5 2
Cir
cula
tio
n t
ime
(s)
Inlet air velocity (m3/h)
164 um
332 um
500 um
run5
run9
run1
Chapter 6
141
Chapter 6 Two-compartmental population balance modeling
and control of a pulsed spray fluidized bed granulation based
on computational fluid dynamics (CFD) analysis
6.1 Chapter overview
In this chapter, the fluidized bed granulator was divided into two compartments, both of
which were assumed as homogeneous domain, based on the CFD analysis of gas-solid
fluid dynamics in chapter 5. A wetting compartment which contains 30% of the bed size
was defined where aggregation happened, while a drying compartment that contains 70%
of bed size close to the air distributor where only breakage is considered. A two-
compartmental population balance model was developed by combining the one-
dimensional PBM and compartments divided by the CFD study. The two-
compartmental PBM was validated by the experiment data obtained in chapter 3. The
prediction ability on the final particle size distribution was also compared between the
two-compartmental PBM and the one-dimensional PBM, which indicated that the two-
compartmental PBM did have advantages and had generally shown smaller sum square
of error (SSE). Finally, the control strategy proposed in chapter 5 was also applied to
control the granulation system based on the two-compartmental PBM, and results
showed that the system can be controlled effectively to obtain desired mean size.
6.2 Two-compartmental population balance model (TCPBM)
6.2.1 Two-compartmental modeling strategy
During last decades, a lot of research work on granulation process modeling [210, 229]
was based on the one-dimensional discretized population balance model (PBM) of a
fluidized bed granulation process in which it is assumed that the fluidized bed is a well-
mixed system and the mechanisms of the aggregation and breakage are spatially
homogeneous for evolution of granule growth. Obviously it is not true in a real spray
fluidized bed granulation process. It is well known that particles in a fluidized bed are
not homogeneously distributed and their hydrodynamics and kinetic parameters
Chapter 6
142
regarding the size enlargement process change with the time and position in the bed.
Therefore, the PBM based on homogeneity cannot be applied for the whole fluidized
bed granulation process.
In a top spray fluidized bed granulator in which the binder liquid solution is sprayed at
the top of the bed into the fluidized bed, three regions have been identified with
significant temperature gradients and different granulation mechanisms are shown to
dominate in each of zones as [56, 230]: 1) the Wetting-active zone which is a low
temperature and high humidity region near the spraying zone at the topmost part of the
bed. The high humidity and temperature gradients are caused by the wetting of the
fluidized particles by the liquid binder solution sprayed and the evaporation of the
solvent; 2) The Isothermal zone which is near the walls and around the wetting-active
zone. In this region there is equilibrium between heat and mass transfer and air
temperature is homogeneous; 3) the heat transfer zone which is situated right above the
bottom hot air distributor plate. It has been found that in a top spray fluidized bed
granulation process agglomeration of the particles mainly takes place in the wetting
active zone because of high humidity and in the isothermal and heat transfer zones
granules are dried and solidified. Therefore, it is essential to consider different
granulation mechanisms according to different zones in a granulation process model for
accurately predicting the evolution of granule growth during granulation. Although
multi-compartmental modeling has been effectively used to model the mixing of fluids
in reactors, such as granular mixing and bioreactor [231-233], very little research has
been carried out for modeling of a spray fluidized bed granulation process by a multi-
compartmental model. Very recently the idea of a two-compartmental model has been
applied to model a spray fluidized bed granulation process with two well-mixed zones
of wetting and drying, in which a one dimension population balance model is only
applied to the spray zone for the modeling of aggregation process and the granules
communicate between the two zones at a constant flow rate [186, 230]. Obviously more
research is required from both fundamental and applied studies on multi-compartmental
modeling for fluidized bed granulation processes.
One aim of this chapter is to develop a more advantaged process model considering the

Chapter 6
143
spatially heterogeneous granulation mechanisms of granule growth for a pulsed spray
fluidized bed granulation process in comparison with our recent work on the one-
dimensional population balance models under assumption of a well-mixed system in
which the granulation mechanisms are spatially uniform [229]. The proposed model
should be capable to link the key binder solution spray operating factors of the binder
spray rate, atomizing air pressure and pulsed frequency to predict granule growth
behavior in the system accurately. In this work the developed model was based on two
spatial compartments of the wetting and drying zones of a top spray fluidized bed
granulator, called the two-compartmental population balance model (TCPBM). It is
assumed that each of two compartments is perfectly mixed and can be described by a
one-dimensional PBM with different granulation mechanisms to predict the overall
granule growth behavior in the granulator, in which the aggregation mechanism is
assumed in the wetting compartment and the breakage mechanism is assumed in the
drying compartment. Therefore, the proposed TCPBM can predict evolution of the
granule size and distribution at different regions within the granulator under different
binder spray operating conditions with accuracy.
Two critical issues in the TCPBM modeling of a top spray of fluidized bed granulation
process are the sizes of the wetting and drying compartments and particle exchange rate
between them. Studies have shown that the size of the wetting compartment can occupy
between 14% and 30% of the bed depending on the operating conditions [56, 230].
Without losing generality the fixed sizes of wetting and drying compartments were
assumed in this work, i.e., 30% of the bed was the wetting compartment and 70% of the
bed was the drying compartment. The exchange rate of particles between the wetting
and drying compartments can be determined by the particle residence time in each
compartment, which can be characterized by the flow properties and distribution of
particles in the bed. In this work, details of the flow properties and distribution of
particles were studied by computational fluid dynamics (CFD) techniques as described
in chapter 5. It was validated that the particle circulation pattern can be kept constant by
adjusting the inlet air velocity, which was selected in our experimental work. Therefore,
in this chapter, all the parameters from CFD are based on simulation 1, which represent
the initial stage of granulation experiment. The volume fractions of particles in each of

Chapter 6
144
two compartments and particle exchange rate between them were calculated based on
the CFD results and then were used in the TCPBM.
6.2.2 Continuous TCPBM
In this work a top-spray granulator is divided into two perfectly mixed compartments:
wetting compartment (WC) which is the upper zone of the granulator and drying
compartment (DC) which is the low part of the system. In the WC the binder solution is
sprayed into the bed to wet particles so that the aggregation of wet particles is carried
out. In the DC granules are quickly dried by the inlet hot fluidizing air, therefore only
breakage of granules takes place. The particles exchange randomly between the two
compartments at certain steady state mass flow rate. The schematic illustration of the
two compartments of the system is given in Figure 6.1 in which the following
assumptions are made for the model development as
a. Both WC and DC are considered as well-mixed systems.
b. Sizes of the WC and DC are constants during granulation, in which the height of
WC is 30% of the bed height as and the height of DC is 70% of
the bed height as .
c. Total volumes of particles in WC and in DC remain constant, which
are determined by CFD simulations. The volume fraction of particles in the WC
is given by
and the volume fraction of particles in the DC is
.
d. The volume exchange rate of particles between two compartments is constant as
, which is determined by CFD simulations. Therefore
an average amount of times and that a particle spends in the WC and
DC can be calculated as
(6.1)
(6.2)

Chapter 6
145
e. Particle aggregation mechanism is considered in the WC while
breakage mechanism is considered in the
Figure 6.1 Schematic diagram of the TCPBM of a top spray fluidized bed granulation.
If the number density functions in terms of the particle diameter in the WC and DC are
and , based on equation (6.1) the particle flux from the WC to DC
is
(6.3)
and based on equation (6.2) the particle flux from DC to WC is given by
(6.4)
Applying a one-dimensional PBM to both of WC and DC, a TCPBM is given by
determined by CFD

Chapter 6
146
(6.5a)
(6.5b)
(6.5c)
Where is the number density function of the whole fluidized bed, is
the length-based aggregation kernel describing the frequency that particles with
diameter and collide to form a particle of volume , is the length-
based breakage selection rate constant describing the rate at which particles are selected
to break and is the breakage kernel describing the formation of particles of
diameter from the breakup of particle of diameter .
6.2.3 Numerical solution of TCPBM
In order to solve the TCPBM in equation (6.5), the discretized approach proposed by
Hounslow et al [107, 234] is employed to determine the change in number of particles
in the WC by the mechanism of aggregation and in the DC by the
mechanism of breakage in interval i under the assumption of conservation of the total
volume of particles in each compartment. According to particle resident times in
equations (6.1) and (6.2), the numbers of particle exchange rate between two
compartments are given by
(6.6)
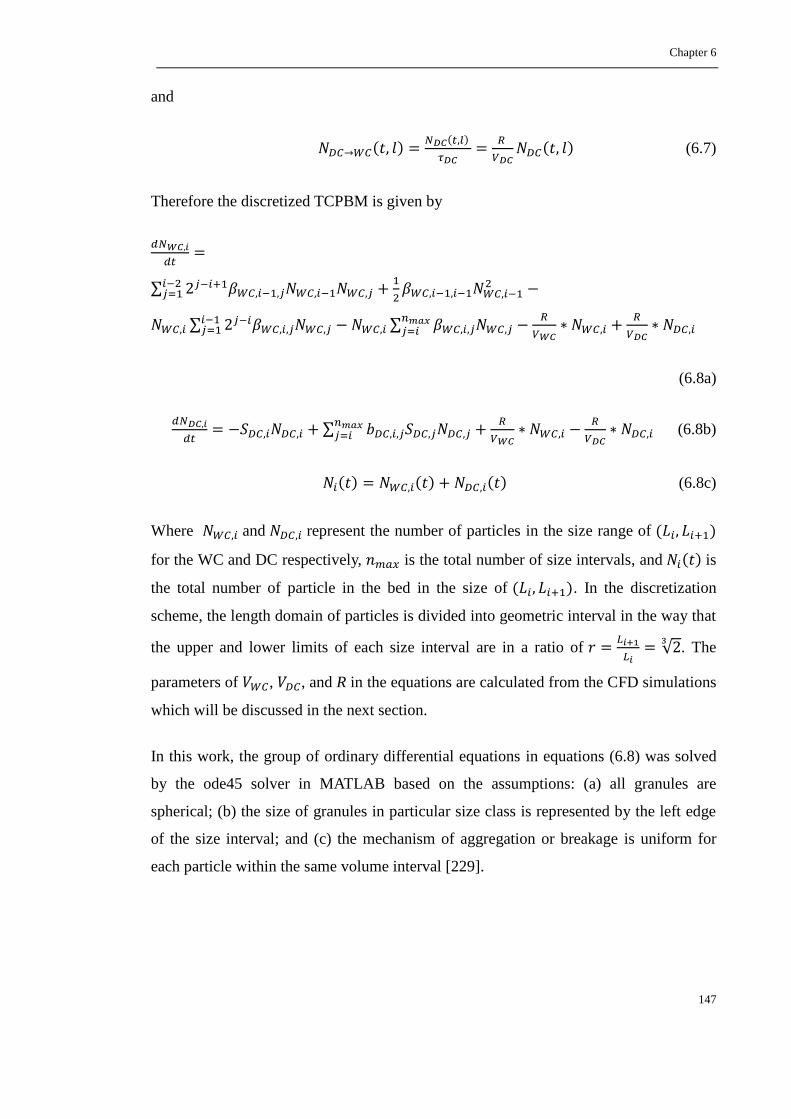
Chapter 6
147
and
(6.7)
Therefore the discretized TCPBM is given by
(6.8a)
(6.8b)
(6.8c)
Where and represent the number of particles in the size range of
for the WC and DC respectively, is the total number of size intervals, and is
the total number of particle in the bed in the size of . In the discretization
scheme, the length domain of particles is divided into geometric interval in the way that
the upper and lower limits of each size interval are in a ratio of
. The
parameters of , , and R in the equations are calculated from the CFD simulations
which will be discussed in the next section.
In this work, the group of ordinary differential equations in equations (6.8) was solved
by the ode45 solver in MATLAB based on the assumptions: (a) all granules are
spherical; (b) the size of granules in particular size class is represented by the left edge
of the size interval; and (c) the mechanism of aggregation or breakage is uniform for
each particle within the same volume interval [229].
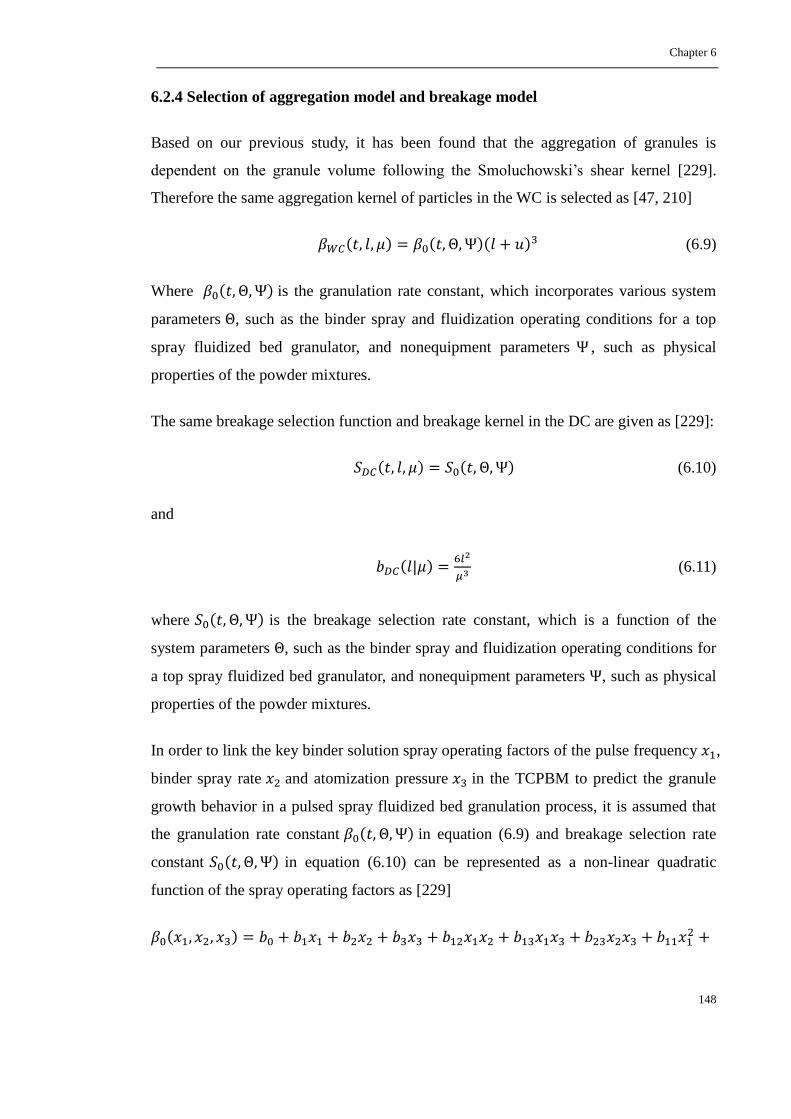
Chapter 6
148
6.2.4 Selection of aggregation model and breakage model
Based on our previous study, it has been found that the aggregation of granules is
dependent on the granule volume following the Smoluchowski’s shear kernel [229].
Therefore the same aggregation kernel of particles in the WC is selected as [47, 210]
(6.9)
Where is the granulation rate constant, which incorporates various system
parameters , such as the binder spray and fluidization operating conditions for a top
spray fluidized bed granulator, and nonequipment parameters , such as physical
properties of the powder mixtures.
The same breakage selection function and breakage kernel in the DC are given as [229]:
(6.10)
and
(6.11)
where is the breakage selection rate constant, which is a function of the
system parameters , such as the binder spray and fluidization operating conditions for
a top spray fluidized bed granulator, and nonequipment parameters , such as physical
properties of the powder mixtures.
In order to link the key binder solution spray operating factors of the pulse frequency ,
binder spray rate and atomization pressure in the TCPBM to predict the granule
growth behavior in a pulsed spray fluidized bed granulation process, it is assumed that
the granulation rate constant in equation (6.9) and breakage selection rate
constant in equation (6.10) can be represented as a non-linear quadratic
function of the spray operating factors as [229]
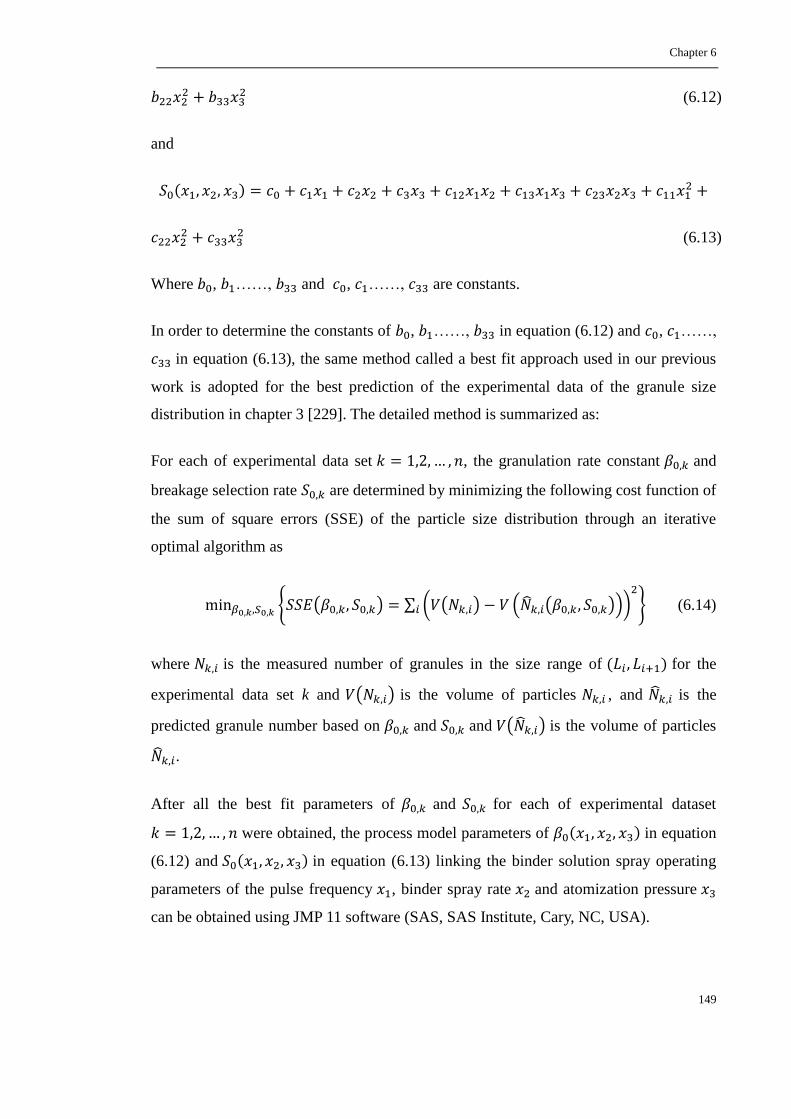
Chapter 6
149
(6.12)
and
(6.13)
Where , ……, and , ……, are constants.
In order to determine the constants of , ……, in equation (6.12) and , ……,
in equation (6.13), the same method called a best fit approach used in our previous
work is adopted for the best prediction of the experimental data of the granule size
distribution in chapter 3 [229]. The detailed method is summarized as:
For each of experimental data set , the granulation rate constant and
breakage selection rate are determined by minimizing the following cost function of
the sum of square errors (SSE) of the particle size distribution through an iterative
optimal algorithm as
(6.14)
where is the measured number of granules in the size range of for the
experimental data set k and is the volume of particles , and is the
predicted granule number based on and and is the volume of particles
.
After all the best fit parameters of and for each of experimental dataset
were obtained, the process model parameters of in equation
(6.12) and in equation (6.13) linking the binder solution spray operating
parameters of the pulse frequency , binder spray rate and atomization pressure
can be obtained using JMP 11 software (SAS, SAS Institute, Cary, NC, USA).
Chapter 6
150
6.3 Results and discussion
6.3.1 Determination of the TCPBM parameters based on the CFD simulation
During granulation, the particle size increases due to agglomeration. In order to keep the
constant particle flow pattern and fluidized bed height, the inlet air velocity has to be
adjusted consistently, which has been described in the chapter 3 and validated in chapter
5. Due to the same particle flow behavior during granulation was adjusted to be constant,
the parameters of the volumes of particles in the WC and DC and the exchange rate
between them were calculated based on the CFD simulation 1, which corresponds to the
beginning stage of granulation.
Figure 6.2 shows the time-averaged particle volume fraction distribution and flow
pattern predicted by the CFD simulation. It can be seen that the details of the complex
mixing flows and distribution of particles in the bed can be revealed. The distribution of
particles in the bed shown in Figures 6.2(a) and (c) is significantly non-homogeneous. A
higher density of particles close to the wall is revealed, which is in a good agreement
with the real situation in a fluidized bed where the particles intend to attach the wall.
The distribution of velocity vectors within the bed indicates that the particles mainly
move up to the bed top from the center and fall down close to the wall, showing the
existence of the core-annular structure in Figures 6.2(b) and (d). There is a limited radial
flow of the particles in the bed shown in Figure 6.2(b).

Chapter 6
151
(a) (b)
(c) (d)
Figure 6.2 CFD simulation results: (a) time-averaged distribution of particle volume fractions at plane XY
across the center of the bed; (b) time-averaged particle flow pattern at plane XY across the center of the
bed; (c) time-averaged distribution of particle volume fractions on the cross section between wetting and
drying compartments; (d) time-average particle flow pattern on the cross section between wetting and
drying compartments.
Based on the CFD results, the particle volumes in the two compartments of wetting and

Chapter 6
152
drying and exchange rate can be calculated by
(6.15)
(6.16)
and
(6.17)
(6.18)
where, is the cell volume, is the time-averaged solid volume fraction of the cell ,
is the cross section area of the cell with the surface between the two
compartments, is the particle velocity in cell on the surface through which
particle moves up from the drying compartment to the wetting compartment,
is the particle velocity in cell on the surface through which particle moves down from
the wetting compartment to the drying compartment.
The calculated results are shown in Table 6.1.
Table 6.1 Parameters of the TCPBM based on the CFD simulation
Parameters value
Particle diameter (µm) 164
Superficial inlet velocity (m/s) 0.086
WC Particle Volume ( ) 3.43×10⁻⁵
DC Particle Volume ( ) 6.88×10⁻⁵
Particle flow rate from WC to DC ( ) 5.85×10⁻⁵
Particle WC resident time (s) 0.5863
Particle flow rate from DC to WC ( ) 5.72×10⁻⁵
Particle DC resident time (s) 1.2028
6.3.2 Determination of TCPBM for a pulsed top spray fluidized bed granulation
Using the optimization method proposed in section 6.2.3, a TCPBM can be developed

Chapter 6
153
based on the experimental data in chapter 3. The TCPBM can predict the evolution of
granule size in a pulsed spray fluidized bed granulation process at different operating
conditions of the binder solution spray. Table 6.2 shows the determined parameters of
granulation rate constant in equation (6.12) and the breakage selection rate
constant in equation (6.13). Using a 10% significance level, a factor is
considered to affect the response if its P-value is less than 0.10 (p<0.10). Therefore the
fitted aggregation kernel in the wetting compartment and breakage kernel in drying
compartment can be simplified as
(6.19)
and
(6.20)
Firstly, from the Table 6.2, it can be seen that the aggregation model can well fit the
original kernel constants according to the R-square of sum of fit and P-value of ANOVA.
However, the model for breakage seems not well fitting the original data, which can
also explain why only one term is considered significant in the breakage model. From
the above equations, it is clearly shown that three binder solution spray factors
significantly affect the aggregation kernel in the wetting compartment. The atomization
pressure ( ) has negative effects on the aggregation kernel while the binder spray rate
( ) has positive effects, all of which have been reported in our previous study [228].
When a pulsed mode is used during granulation, the pulsed frequency has both direct
negative and positive quadratic effects on the aggregation kernel shown in equation
(6.19), proving that the pulsed spray can be used to control the granulation process [51,
52, 228]. According to the breakage kernel in equation (6.20), it is shown that the
breakage in the drying compartment is only affected by the interaction term of the
pulsed frequency ( ) and binder spray rate ( ) and there is no direct effect from either
of three of the binder solution spray operating factors. Actually the coefficient of the
term is very small. Therefore it is believed that the breakage kernel is only affected by
the mixing conditions.

Chapter 6
154
The comparison of final particle size distributions between experimental data and
predictions by the MCPBM is shown in Figure 6.3. It can be seen that the TCPBM can
predict the final granule size distributions at different operating conditions with
reasonable accuracy except that there are little bit higher prediction errors for
experiments 2, 4 and 14, which are similar to those predicted by a one-dimensional
PBM in our previous work [229].
Table 6.2 Fitted aggregation kernel in wetting compartment and breakage kernel in drying compartment
Aggregation model in WC Breakage model in DC
Terms of non-
linear
quadratic
model
Coefficient P-value Coefficient P-value
Constant 4.97 0.0006* 1.01×10-3
0.4779
-3.00 0.0006* -1.17×10⁻³
0.2089
9.73×10⁻¹
0.0576* -1.25×10⁻³
0.1827
-8.81×10⁻¹
0.0768* -8.56×10⁻⁵
0.9199
7.37×10⁻¹
0.2453 2.73×10⁻³
0.0627*
1.68×10-1
0.7763 -3.37×10⁻⁴
0.7805
1.49×10⁻¹
0.8009 3.84×10⁻⁵
0.9746
2.05 0.017* 1.01×10
-3 0.4356
-1.08×10
-1 0.8599 7.12×10
-3 0.5767
-7.51×10
-1 0.2543 -1.69×10
-3 0.2162
Regression
equation
R-square 0.944176 0.750163
Prob>F of
ANOVA 0.0119 0.2975

Chapter 6
155
Figure 6.3 Comparison of experimental data with the predictions by the TCPBMs (red square: experimental data; blue diamond: predicted value)
0
0.1
0.2
0.3
0 500 1000 1500 2000
Volu
me f
ract
ion
Granule size (um)
Experiment 1
0
0.1
0.2
0.3
0.4
0 500 1000 1500 2000
Volu
me f
ract
ion
Granule size (um)
Experiment 2
0
0.1
0.2
0.3
0 500 1000 1500 2000
Volu
me f
ract
ion
Granule size (um)
Experiment 3
0
0.1
0.2
0.3
0.4
0 500 1000 1500 2000
Volu
me f
ract
ion
Granule size (um)
Experiment 4
0
0.1
0.2
0.3
0 500 1000 1500 2000
Volu
me f
ract
ion
Granule size (um)
Experiment 5
0
0.1
0.2
0.3
0.4
0.5
0 500 1000 1500 2000
Volu
me f
ract
ion
Granule size (um)
Experiment 6
0
0.05
0.1
0.15
0.2
0 500 1000 1500 2000
Volu
me f
ract
ion
Granule size (um)
Experiment 7
0
0.05
0.1
0.15
0.2
0 500 1000 1500 2000
Volu
me f
ract
ion
Granule size (um)
Experiment 8
0
0.05
0.1
0.15
0.2
0 500 1000 1500 2000
Volu
me f
ract
ion
Granule size (um)
Experiment 9
0
0.1
0.2
0.3
0 500 1000 1500 2000
Volu
me
fract
ion
Granule size (um)
Experiment 10
0
0.1
0.2
0.3
0 500 1000 1500 2000
Volu
me f
ract
ion
Granule size (um)
Experiment 11
0
0.1
0.2
0.3
0.4
0 500 1000 1500 2000
Volu
me f
ract
ion
Granule size (um)
Experiment 12
0
0.05
0.1
0.15
0.2
0 500 1000 1500 2000
Volu
me f
ract
ion
Granule size (um)
Experiment 13
0
0.1
0.2
0.3
0.4
0 500 1000 1500 2000
Volu
me f
ract
ion
Granule size (um)
Experiment 14
0
0.1
0.2
0.3
0 500 1000 1500 2000
Volu
me f
ract
ion
Granule size (um)
Experiment 15

Chapter 6
156
In order to reveal the advantage of the TCPMB, the comparison of the mean size of the
end granules between the experiments and predictions by both the TCPBM and single
PBM [229] is given in Figure 6.4 (a), indicating that the TCPBM can predict the mean
size of final granules more accurate than those by the single PBM. Comparison of each
of the sum square of errors (SSEs) between the experiments and predictions by the
TCPBM or single PMB is also given in Figure 6.4(b), indicating that the TCPBM
generally shows smaller SSEs than those by the single PBM over all the fifteen
experiments. It approves that the introduction of the two compartments in a process can
improve the ability of PBM on predicting the end granule size distribution. Three
replicated experiments 7-9 were carried out at the middle points of the binder spray
operating parameters. The final PSD for these three experiments can be predicted
accurately by the TCPBM, showing that the model behaves well at the intermediate
range of the operating conditions.
(a)
200
300
400
500
600
700
200 300 400 500 600 700
Pre
dic
ted
me
an g
ran
ule
siz
e (
um
)
Experimental mean granule size (um)
Single PBM
TCPBM
Experiments
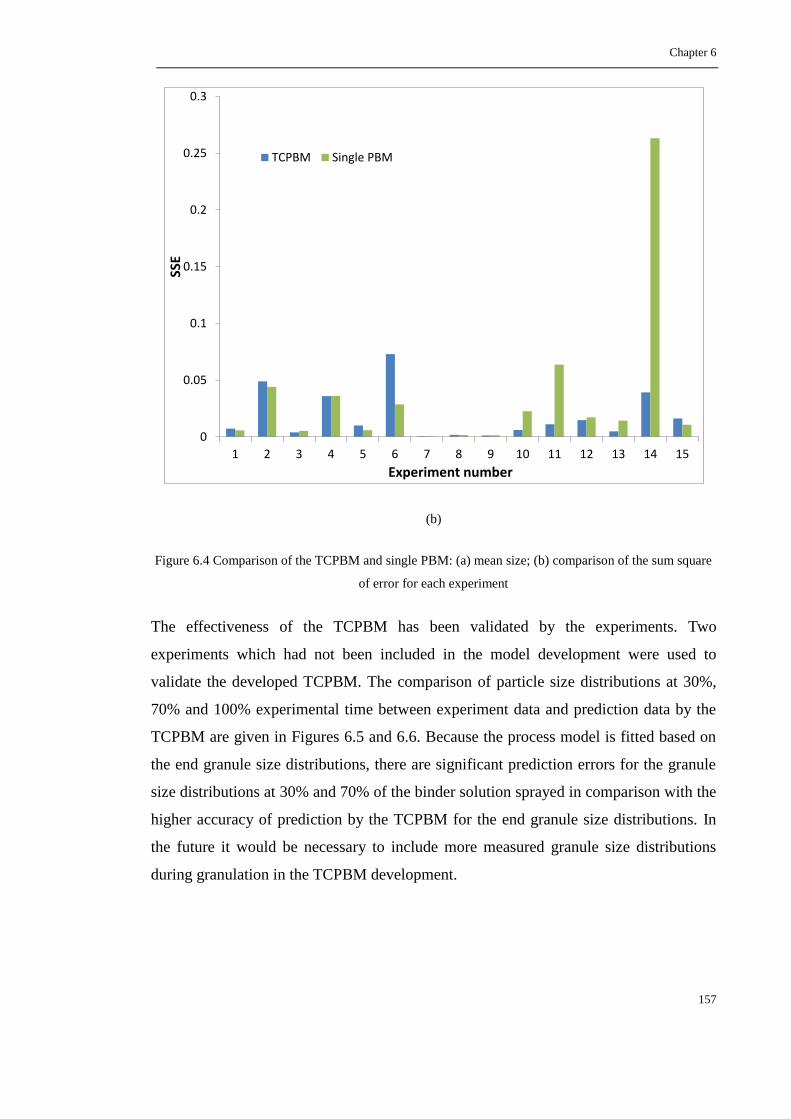
Chapter 6
157
(b)
Figure 6.4 Comparison of the TCPBM and single PBM: (a) mean size; (b) comparison of the sum square
of error for each experiment
The effectiveness of the TCPBM has been validated by the experiments. Two
experiments which had not been included in the model development were used to
validate the developed TCPBM. The comparison of particle size distributions at 30%,
70% and 100% experimental time between experiment data and prediction data by the
TCPBM are given in Figures 6.5 and 6.6. Because the process model is fitted based on
the end granule size distributions, there are significant prediction errors for the granule
size distributions at 30% and 70% of the binder solution sprayed in comparison with the
higher accuracy of prediction by the TCPBM for the end granule size distributions. In
the future it would be necessary to include more measured granule size distributions
during granulation in the TCPBM development.
0
0.05
0.1
0.15
0.2
0.25
0.3
1 2 3 4 5 6 7 8 9 10 11 12 13 14 15
SSE
Experiment number
TCPBM Single PBM
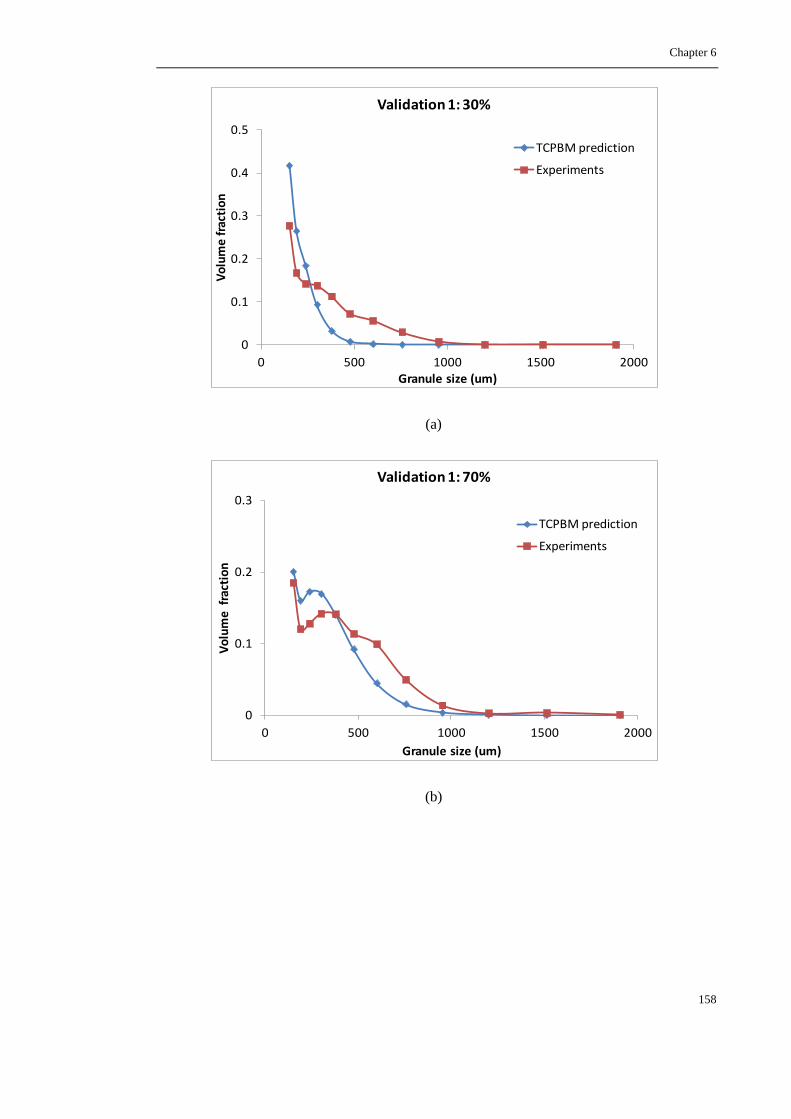
Chapter 6
158
(a)
(b)
0
0.1
0.2
0.3
0.4
0.5
0 500 1000 1500 2000
Vo
lum
e f
ract
ion
Granule size (um)
Validation 1: 30%
TCPBM prediction
Experiments
0
0.1
0.2
0.3
0 500 1000 1500 2000
Vo
lum
e f
ract
ion
Granule size (um)
Validation 1: 70%
TCPBM prediction
Experiments
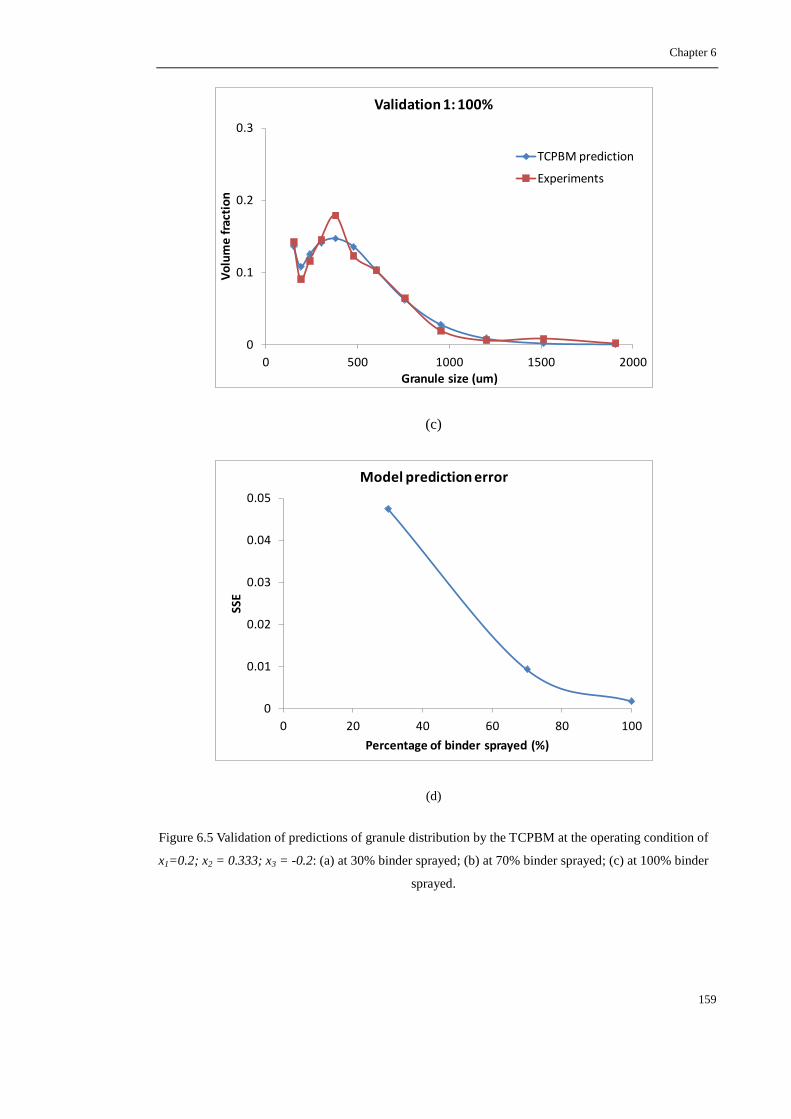
Chapter 6
159
(c)
(d)
Figure 6.5 Validation of predictions of granule distribution by the TCPBM at the operating condition of
x1=0.2; x2 = 0.333; x3 = -0.2: (a) at 30% binder sprayed; (b) at 70% binder sprayed; (c) at 100% binder
sprayed.
0
0.1
0.2
0.3
0 500 1000 1500 2000
Vo
lum
e f
ract
ion
Granule size (um)
Validation 1: 100%
TCPBM prediction
Experiments
0
0.01
0.02
0.03
0.04
0.05
0 20 40 60 80 100
SSE
Percentage of binder sprayed (%)
Model prediction error

Chapter 6
160
(a)
(b)
0
0.1
0.2
0.3
0.4
0.5
0 500 1000 1500 2000
Vo
lum
e f
ract
ion
Granule size (um)
Validation 2: 30%
TCPBM prediction
Experiments
0
0.1
0.2
0.3
0.4
0 500 1000 1500 2000
Vo
lum
e f
ract
ion
Granule size (um)
Validation 2: 70%
TCPBM prediction
Experiments

Chapter 6
161
(c)
(d)
Figure 6.6 Validation of predictions of granule distribution by the TCPBMs at the operating condition of
x1=0.6; x2 = 0; x3 = 0.4: (a) at 30% binder sprayed; (b) at 70% binder sprayed; (c) at 100% binder
sprayed.
0
0.05
0.1
0.15
0.2
0 500 1000 1500 2000
Vo
lum
e f
ract
ion
Granule size (um)
Validation 2: 100%
TCPBM prediction
Experiments
0
0.01
0.02
0.03
0.04
0.05
0 20 40 60 80 100
SSE
Percentage of binder sprayed (%)
Model prediction error

Chapter 6
162
6.3.3 Multi-stage optimal control of a pulsed top spray fluidized bed granulation
based on the TCPBM
In this study, the proposed multi-stage open loop optimal control strategy was applied to
control the top spray fluidized bed granulation system using the TCPBM. However, the
introduction of two compartments and particle exchange flow between the two
compartments significantly increased the complexity of PBM. Hence, the application of
proposed multi-stage optimization strategy would be a huge challenge using the
TCPBM. The TCPBM determined in last section given in equation (6.19) and equation
(6.20) is used for the model-based control strategy implementation.
Comparison of evolution of the granule mean sizes of granulation process and its
process model at different operating conditions of binder spray is given in Figure 6.7. It
is shown that at the center of each operating variable the process model can predict the
granule process accurately in Figure 6.7(a). The significant discrepancy between the
outputs of the granulation process and its process model can be found when the
operating variables are away from its centers shown in Figures 6.7(b) and 6.7(c).
(a)
150
200
250
300
350
400
450
0 20 40 60 80 100
Volu
me
mea
n pa
rtic
le si
ze (u
m)
Percentage of binder sprayed (%)
Model output
Process output

Chapter 6
163
(b)
(c)
Figure 6.7 Comparison of evolution of the granule mean sizes of granulation process and its process
model at three different random operating conditions: (a) x1=0, x2=0, x3=0; (b) x1=-1, x2=0.1, x3=1; (c)
x1=0.8, x2=-0.1, x3=0.1.
150
250
350
450
550
650
0 20 40 60 80 100
Volu
me
mea
n pa
rtic
le si
ze (u
m)
Percentage of binder sprayed (%)
Model output
Process output
100
200
300
400
0 20 40 60 80 100
Volu
me
mea
n pa
rtic
le si
ze (u
m)
Percentage of binder sprayed (%)
Model output
Process output

Chapter 6
164
In this study, the aim of the granulation control is to increase the powder size from its
initial mean size of 150 µm to a desired end mean size of 600 µm. Figure 6.8 shows
evolution of mean granule sizes in the simulated granulation process under different
operating conditions of binder solution spray obtained by different stages of
optimization, including one stage, two stages and three stages. The colored curves in
Figures 6.8(a)-(c) show the trajectories of evolution of mean granule size at different
stages of optimization obtained by the process model given by equations (6.19) - (6.20).
All the black curves in Figure 6.8(a)-(c) show the evolution of actual mean granule sizes
under those operating conditions. It can be seen that based on one stage optimization
method the end mean granule size of 556 µm is significantly smaller than the desired
value of 600µm due to the mismatch of the actual process and the developed process
model. Through adjusting the operation conditions of the binder solution spray at 50%
of binder spray based on the measured granule size distribution on line, the model
mismatch can be compensated through adjusting the desired end mean granule size in
the new costing function in equation (4.12) to determine a new trajectory (green color
curve) shown in Figure 6.8(b). It is shown that the difference between the end mean
granule size and the desired granule size based on two-stage optimization is reduced
significantly to 13µm from 44µm based on one-stage optimization. For a three-stage
optimization, the end mean granule size is very close to the desired mean size. The
operation variables of the binder solution spray obtained by the different stages of
optimization are also given in Figure 6.8(a)-(c).
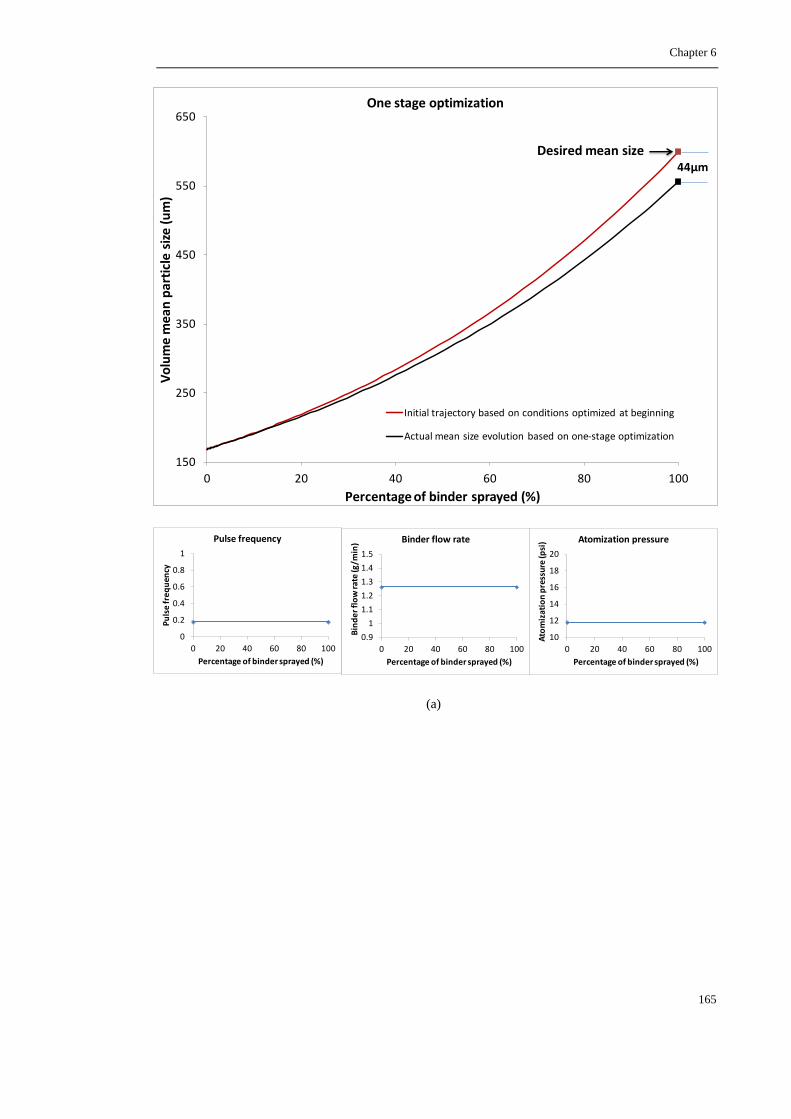
Chapter 6
165
(a)
150
250
350
450
550
650
0 20 40 60 80 100
Vo
lum
e m
ean
par
ticl
e si
ze (
um
)
Percentage of binder sprayed (%)
One stage optimization
Initial trajectory based on conditions optimized at beginning
Actual mean size evolution based on one-stage optimization
Desired mean size44μm
0
0.2
0.4
0.6
0.8
1
0 20 40 60 80 100
Pu
lse
fre
qu
ency
Percentage of binder sprayed (%)
Pulse frequency
0.9
1
1.1
1.2
1.3
1.4
1.5
0 20 40 60 80 100
Bin
de
r fl
ow
rate
(g/m
in)
Percentage of binder sprayed (%)
Binder flow rate
10
12
14
16
18
20
0 20 40 60 80 100
Ato
miz
atio
n p
ress
ure
(psi
)
Percentage of binder sprayed (%)
Atomization pressure
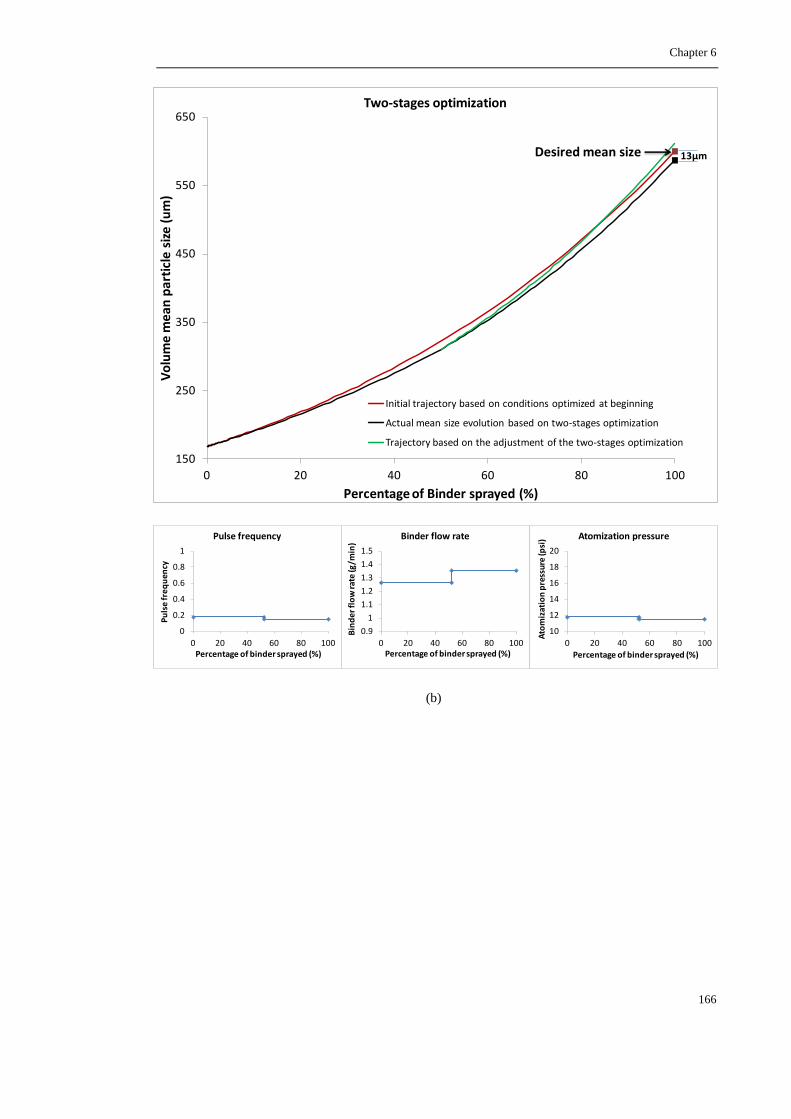
Chapter 6
166
(b)
150
250
350
450
550
650
0 20 40 60 80 100
Vo
lum
e m
ean
par
ticl
e s
ize
(u
m)
Percentage of Binder sprayed (%)
Two-stages optimization
Initial trajectory based on conditions optimized at beginning
Actual mean size evolution based on two-stages optimization
Trajectory based on the adjustment of the two-stages optimization
Desired mean size 13μm
0
0.2
0.4
0.6
0.8
1
0 20 40 60 80 100
Pu
lse
fre
qu
ency
Percentage of binder sprayed (%)
Pulse frequency
0.9
1
1.1
1.2
1.3
1.4
1.5
0 20 40 60 80 100
Bin
de
r fl
ow
rate
(g/m
in)
Percentage of binder sprayed (%)
Binder flow rate
10
12
14
16
18
20
0 20 40 60 80 100
Ato
miz
atio
n p
ress
ure
(psi
)
Percentage of binder sprayed (%)
Atomization pressure
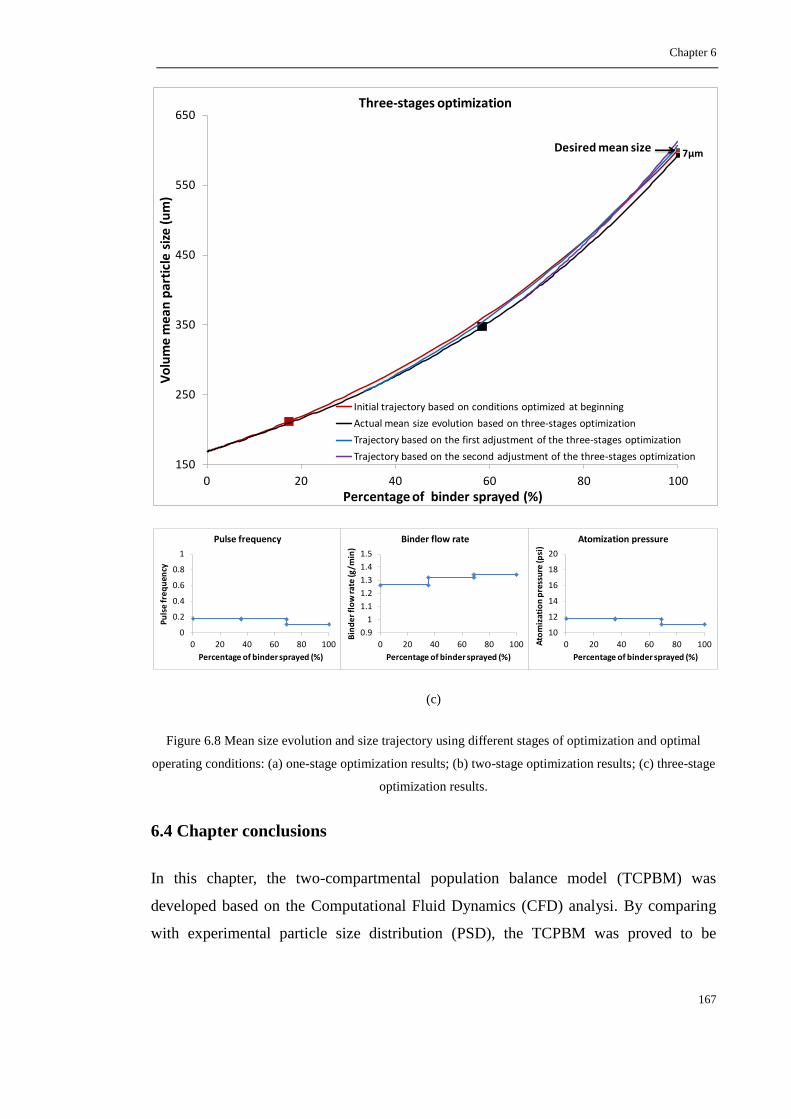
Chapter 6
167
(c)
Figure 6.8 Mean size evolution and size trajectory using different stages of optimization and optimal
operating conditions: (a) one-stage optimization results; (b) two-stage optimization results; (c) three-stage
optimization results.
6.4 Chapter conclusions
In this chapter, the two-compartmental population balance model (TCPBM) was
developed based on the Computational Fluid Dynamics (CFD) analysi. By comparing
with experimental particle size distribution (PSD), the TCPBM was proved to be
150
250
350
450
550
650
0 20 40 60 80 100
Vo
lum
e m
ean
par
ticl
e s
ize
(u
m)
Percentage of binder sprayed (%)
Three-stages optimization
Initial trajectory based on conditions optimized at beginning
Actual mean size evolution based on three-stages optimization
Trajectory based on the first adjustment of the three-stages optimization
Trajectory based on the second adjustment of the three-stages optimization
Desired mean size 7μm
0
0.2
0.4
0.6
0.8
1
0 20 40 60 80 100
Pu
lse
fre
qu
ency
Percentage of binder sprayed (%)
Pulse frequency
0.9
1
1.1
1.2
1.3
1.4
1.5
0 20 40 60 80 100
Bin
de
r fl
ow
rate
(g/m
in)
Percentage of binder sprayed (%)
Binder flow rate
10
12
14
16
18
20
0 20 40 60 80 100Ato
miz
atio
n p
ress
ure
(psi
)
Percentage of binder sprayed (%)
Atomization pressure
Chapter 6
168
effective on predicting the particle growth. The prediction ability on end granules
particle size distribution was also compared between the TCPBM and one-dimensional
PBM, and results indicated that the TCPBM can generally give smaller sum square of
error (SSE). Experiments were carried out to validate the TCPBM which proved that
the TCPBM can predict final PSD at any random operating conditions accurately. At the
end, the control strategy proposed in chapter 4 was successfully applied based on the
TCPBM.
Chapter 7
169
Chapter 7 Conclusions and future work
In this chapter, a summary of the present work and main findings are presented.
Limitations of the research are also briefly discussed along with potential areas for
further research.
7.1 Summary of the presented work
This research mainly focused on the modeling and control of the top-spray fluidized bed
granulation system.
The research commenced with a critical literature review about the top-spray fluidized
bed granulation, including the detailed granulation mechanisms, experimental study,
modeling study and control application recently. The review work presented deep
understanding of the current research status of the top-spray fluidized bed granulation,
which helps develop the potential research topics to further improve the performance of
the spray granulation system. Depending upon the literature review, the primary aim of
current work was established, which is to develop a superior population balance model
(PBM) based on computational fluid dynamics (CFD) study and to develop control
strategy based on the proposed PBM model.
In order to fit parameters in the mathematical model, experiments should be carried out.
In this work, the experiments were designed by the Box-Behnken experimental design
method. The experiment results were used to investigate the influence of three operating
conditions of pulse frequency, binder spray rate and atomization pressure on the final
granules properties, and then were used for parameters fitting in the model.
In this work, the particle population within the fluidized bed granulator was modeled
using the population balance model (PBM). A one-dimensional PBM was firstly
developed and successful applied on predicting final particle size distribution (PSD)
comparing with experiment data. In addition, a control strategy was proposed, which is
implemented on the granulations system.

Chapter 7
170
The one-dimensional PBM is developed with assumption that the all the particles are
homogeneous within the granulator, which is obvious not true in real granulation. The
computational fluid dynamics (CFD) software ANSYS Fluent 13.0 was used to study
the gas-particle fluid dynamics with the granulator. The particle circulation pattern was
investigated and a mathematical model between particle circulation time and inlet air
velocity and particle size is developed to give guidance on how to adjust the inlet air
velocity as particle size increased during granulation.
Based on the CFD study, a two-compartmental PBM (TCPBM) was developed, in
which the particle fluidizing domain was divided into two compartments: spray zone
and drying zone. The compartment on the top is wetting zone, where aggregation is
considered, and the bottom compartment is drying zone, where only breakage
mechanism is considered because of the high speed of hot fluidizing air. This model was
also validated by comparing with experiment data. Subsequently, the control strategy
proposed for the one-dimensional PBM is applied based on the TCPBM.
7.2 Conclusions
This thesis carried out a comprehensive study of the top-spray fluidized bed granulation,
including experimental study, process model development and control strategy design.
The influence factors of pulsed frequency, binder spray rate and atomization pressure of
the top-spray fluidized bed granulation process were experimentally studied using the
Box-Behnken design method. Different mathematical models were developed to predict
the mean size of granules, yield, relative width of granule distribution and final granule
moisture content. The experimental study has supported the theory that the granule size
can be controlled through the liquid feed pulsing. However, care has to be taken when
the pulsed frequency is chosen for controlling the granule size due to the nonlinear
quadratic relation in the regression model. The design space of the ranges of operating
parameters has been determined based on constraints of the mean size of granules Y1
(300Y1500) and granule yield Y2 (Y285%). High degree of prediction obtained from
validation experiments has shown the reliability and effectiveness using the Box-
Behnken experimental design method to study the fluidized bed granulation process.
Chapter 7
171
A pulsed top-spray fluidized bed granulation was modeled by one-dimensional
population balance models. The developed PBMs have linked the three key binder
solution spray operating factors of the binder spray rate, atomizing air pressure and
pulsed frequency of spray with the granule properties to predict granule growth
behavior in a pulsed spray fluidized bed granulation process at different operating
conditions. It has been found that the aggregation of granules was size dependent and
breakage of the granules was size independent in a pulsed top-spray fluidized bed
granulation process. Experimental validation has shown that the developed PBMs with
both the kernel orders of p =3 and q=0 and the kernel orders of p =2 and q=0 can
predict the evolution of granule size distribution with accuracy.
The developed PBMs have been used to design the control strategies to operate the
pulsed spray fluidized bed granulation under more optimal conditions to achieve the
desired quality of the end granules. In this work, a multi-stage open optimal control
strategy was proposed, in which through adjusting the trajectory of the evolution of the
granule size distribution at predefined sample intervals, to determine the optimal
operating variables related to the binder spray including the spray rate of binding liquid,
atomizing air pressure and pulsed frequency of spray. Simulated results have shown that
the proposed multi-stage open optimal control strategy can effectively reduce the effects
of the model mismatch and provide an effective tool to determine the optimal operating
variables for a pulsed spray fluidized bed granulation process.
The gas-particle fluid dynamics within the fluidized bed granulator was also studied
using the computational fluid dynamics (CFD) software ANSYS Fluent 13.0. The
influence of particle size and inlet air velocity on the particle flow pattern was
investigated. A mathematical model between the particle circulation time and particle
size and inlet air velocity was developed, which could work as guidance about how to
adjust the inlet air velocity to keep the fluidization in the same level during the
experiment. This coincides with the operating method used in our experiments. The
study of influence of inlet air velocity on bed characteristics has shown that the bed
height increased with inlet air velocity. The bubbles distorted significantly and merge
frequently at high inlet air velocity, which generates long and twisty bubbles. Under the

Chapter 7
172
same inlet air velocity, more bubbles and heterogeneous fluidization state are generated
by the larger particle size.
Based on the detailed gas-solid fluid dynamics study using the CFD simulation, the
two-compartmental population balance model (TCPBM) was developed. By comparing
with experimental particle size distribution (PSD), the TCPBM was proved to be
effective on predicting the particle growth. The prediction ability on end granules
particle size distribution was also compared between the TCPBM and one-dimensional
PBM, and results indicated that the TCPBM gave smaller sum square of error (SSE).
Experiments were carried out to validate the TCPBM which proved that the TCPBM
can predict final PSD at any random operating conditions accurately. At the end, the
control strategy proposed in chapter 4 was successfully applied based on the TCPBM.
7.3 Limitations and future work
The further improvement of this project can include the following aspects:
Experiment data set
In this thesis, the experiments were designed by the Box-Behnken experimental design,
which is sufficient for the experimental study analysis of the influence of the three
operating parameters. However, from the aspect of parameters fitting of the kernel
model in the population balance model, fifteen experiments does not seem enough,
which can be found from the comparing of final particle size distribution between
experiments data and PBM prediction, big mismatch found in several experiments.
Therefore, more experiments and accurate measurement should help to contribute to the
predicting capability of the kernel models.
Extended application of multi-compartment PBM
The advantages of multi-compartmental PBM lie in describing influence of the local
fluid dynamics on the final granule properties. The assumption is that the gas and
particle fluid dynamics can be considered as homogeneous in the specified local domain.
By the studying in this thesis of the lab-scale spray fluidized bed granulation, it can be
Chapter 7
173
found that the multi-compartmental PBM has already shown some advantages
comparing with one-dimensional PBM, while advantages maybe more obvious if
applied on large-scale granulator which behaves more heterogeneous and more vortexes
generated.
Methods of moment in solving population balance model
In this work, the population balance model is solved by discrete method, which has the
advantage of providing the particle size distribution directly. However the discrete
method in solving PBM also has the disadvantage of high computation cost, which can
avoided by using the method of moment to solve the population balance model. The
mth order moment is defined by integrating the population number density function
with respect to certain property variable (e.g. particle sizes, particle volumes) weighted
with this property raised to its mth power. The lower order moments contain important
information about the particle size distribution (e.g. number (0th
moment), total diameter
(1st moment), total surface area (2
nd moment) and total volume of particles (3
rd
moment)). Therefore, the method of moment could be used in solving the population
balance model in further work.
Coupled CFD-PBM model study
Since the gas and particle hydrodynamics and kinetic parameters during the granulation
process are changing with time and position within the fluidized bed granulator, the
coupled CFD-PBM is actually the most accurate way to describe the particle
enlargement process during fluidized bed granulation. However, there are only limited
applications of coupled CFD-PBM on the study of fluidized bed granulation due to the
high computational cost. In my first year report, actually, the coupled CFD-PBM was
already built, which is considered as criterion to validate the compiled MATLAB PBM
code, which did not appear in the current thesis. Therefore, the coupled CFD-PBM
should be studied further as an important aspect.
References
174
References
1. Wurster, D.E., Preparation of compressed tablet granulations by the air-suspension technique. II. J Am Pharm Assoc Am Pharm Assoc, 1960. 49: p. 82-4.
2. Jones, D.M., Factors to consider in fluid-bed processing. Pharmaceutical Technology, 1985. 9(4): p. 50, 55-62.
3. Banks, M. and M.E. Aulton, Fluidized-bed granulation - A chronology. Drug Development and Industrial Pharmacy, 1991. 17(11): p. 1437-1463.
4. Aulton, M. and M. Banks, Factors affecting fluidized-bed granulation. Manufacturing Chemist and Aerosol News, 1978. 49(12): p. 50-56.
5. Scott, M.W., et al., Continuous production of tablet granulations in a fluidized bed.I. Theory and design considerations. J Pharm Sci, 1964. 53: p. 314-20.
6. Khoshtaghaza, M.H. and R.A. Chayjan, Effect of some physical properties on fluidisation stability of grain products. Biosystems Engineering, 2007. 98(2): p. 192-197.
7. Räsänen, E., et al., The characterization of fluidization behavior using a novel multichamber microscale fluid bed. Journal of Pharmaceutical Sciences, 2004. 93(3): p. 780-791.
8. Geldart, D., Types of gas fluidization. Powder Technology, 1973. 7(5): p. 285-292. 9. Lipps, D.M. and A.M. Sakr, Characterization of wet granulation process
parameters using response-surface methodology.1. Top-spray fluidized-bed Journal of Pharmaceutical Sciences, 1994. 83(7): p. 937-947.
10. Maronga, S.J. and P. Wnukowski, Growth kinetics in particle coating by top-spray fluidized bed systems. Advanced Powder Technology, 2001. 12(3): p. 371-391.
11. Iveson, S.M., et al., Nucleation, growth and breakage phenomena in agitated wet granulation processes: a review. Powder Technology, 2001. 117(1–2): p. 3-39.
12. Bouffard, J., M. Kaster, and H. Dumont, Influence of Process Variable and Physicochemical Properties on the Granulation Mechanism of Mannitol in a Fluid Bed Top Spray Granulator. Drug Development and Industrial Pharmacy, 2005. 31(9): p. 923-933.
13. Cameron, I.T., et al., Process systems modelling and applications in granulation: A review. Chemical Engineering Science, 2005. 60(14): p. 3723-3750.
14. Ehlers, H., et al., Granule size control and targeting in pulsed spray fluid bed granulation. International Journal of Pharmaceutics, 2009. 377(1&2): p. 9-15.
15. Rajniak, P., et al., A combined experimental and computational study of wet granulation in a Wurster fluid bed granulator. Powder Technology, 2009. 189(2): p. 190-201.
16. Reynolds, G.K., et al., Breakage in granulation: A review. Chemical Engineering Science, 2005. 60(14): p. 3969-3992.
17. Knight, P.C., et al., An investigation into the kinetics of liquid distribution and growth in high shear mixer agglomeration. Powder Technology, 1998. 97(3): p. 246-257.
18. Tardos, et al., Critical parameters and limiting conditions in binder granulation of fine powders. 1997, Amsterdam, PAYS-BAS: Elsevier.
References
175
19. Schæfer, T. and C. Mathiesen, Melt pelletization in a high shear mixer. IX. Effects of binder particle size. International Journal of Pharmaceutics, 1996. 139(1-2): p. 139-148.
20. Vonk, P., et al., Growth mechanisms of high-shear pelletisation. International Journal of Pharmaceutics, 1997. 157(1): p. 93-102.
21. Le, P.K., et al., A microscopic study of granulation mechanisms and their effect on granule properties. Powder Technology, 2011. 206(1-2): p. 18-24.
22. Hapgood, K.P., J.D. Litster, and R. Smith, Nucleation regime map for liquid bound granules. AIChE Journal, 2003. 49(2): p. 350-361.
23. Paul R, M., Scale-up of binder agglomeration processes. Powder Technology, 2005. 150(2): p. 86-103.
24. Goldschmidt, M.J.V., Hydrodynamic Modelling of Fluidised Bed Spray Granulation. 2001: Enschede. p. 303.
25. Ennis, B.J., G. Tardos, and R. Pfeffer, A microlevel-based characterization of granulation phenomena. Powder Technology, 1991. 65(1-3): p. 257-272.
26. Liu, L.X., et al., Coalescence of deformable granules in wet granulation processes. AIChE Journal, 2000. 46(3): p. 529-539.
27. Thornton, C. and Z. Ning, A theoretical model for the stick/bounce behaviour of adhesive, elastic-plastic spheres. Powder Technology, 1998. 99(2): p. 154-162.
28. Rumpf, H., in W.A., Knepper (Ed.), , The strength of granules and agglomerates. AIME, Agglomeration, interscience. New York, 1962: p. 379-418.
29. Iveson, S.M. and J.D. Litster, Fundamental studies of granule consolidation part 2: Quantifying the effects of particle and binder properties. Powder Technology, 1998b. 99(3): p. 243-250.
30. Iveson, S.M., J.D. Litster, and B.J. Ennis, Fundamental studies of granule consolidation Part 1: Effects of binder content and binder viscosity. Powder Technology, 1996. 88(1): p. 15-20.
31. Naito, M., et al., Microscopic analysis on the consolidation process of granule beds. Powder Technology, 1998. 95(3): p. 214-219.
32. Kristensen, H.G., P. Holm, and T. Schaefer, Granulation in high-speed mixers Part VI. Effects of process conditions on power consumption and granule growth. Powder Technology, 1985. 43(3): p. 225-233.
33. Ouchiyama, N. and T. Tanaka, Stochastic Model for Compaction of Pellets in Granulation. Industrial & Engineering Chemistry Process Design and Development, 1980. 19(4): p. 555-560.
34. Ritala, M., et al., A Comparison Between Binders in the Wet Phase of Granulation in a High Shear Mixer. Drug Development and Industrial Pharmacy, 1986. 12(11-13): p. 1685-1700.
35. van den Dries, K., et al., Granule breakage phenomena in a high shear mixer; influence of process and formulation variables and consequences on granule homogeneity. Powder Technology, 2003. 133(1–3): p. 228-236.
36. Pearson, J.M.K., M.J. Hounslow, and T. Instone, Tracer studies of high-shear granulation: I. Experimental results. AIChE Journal, 2001. 47(9): p. 1978-1983.
37. Knight, P.C., et al., An investigation of the effects on agglomeration of changing the speed of a mechanical mixer. Powder Technology, 2000. 110(3): p. 204-209.

References
176
38. Liu, L.X., R. Smith, and J.D. Litster, Wet granule breakage in a breakage only high-hear mixer: Effect of formulation properties on breakage behaviour. Powder Technology, 2009. 189(2): p. 158-164.
39. Tan, H.S., A.D. Salman, and M.J. Hounslow, Kinetics of fluidised bed melt granulation III: Tracer studies. Chemical Engineering Science, 2005a. 60(14): p. 3835-3845.
40. Biggs, C.A., et al., Fluidised bed granulation: modelling the growth and breakage kinetics using population balances. Proceedings of World Congress on Particle Technology, Sydney,, 2002: p. 629-636.
41. Ramachandran, R., et al., A mechanistic model for breakage in population balances of granulation: Theoretical kernel development and experimental validation. Chemical Engineering Research and Design, 2009. 87(4): p. 598-614.
42. Iveson, S.M., J.A. Beathe, and N.W. Page, The dynamic strength of partially saturated powder compacts: the effect of liquid properties. Powder Technology, 2002. 127(2): p. 149-161.
43. Iveson, S.M. and J.D. Litster, Liquid-bound granule impact deformation and coefficient of restitution. Powder Technology, 1998a. 99(3): p. 234-242.
44. Salman, A.D., et al., Impact breakage of fertiliser granules. Powder Technology, 2003. 130(1-3): p. 359-366.
45. Salman, A.D., et al., An experimental investigation of particle fragmentation using single particle impact studies. Powder Technology, 2002. 128(1): p. 36-46.
46. Salman, A.D. and D.A. Gorham, The fracture of glass spheres. Powder Technology, 2000. 107(1-2): p. 179-185.
47. Fu, J., et al., An experimental study of the impact breakage of wet granules. Chemical Engineering Science, 2005. 60(14): p. 4005-4018.
48. Verkoeijen, D., et al., Determining granule strength as a function of moisture content. Powder Technology, 2002. 124(3): p. 195-200.
49. Niskanen, T. and J. Yliruusi, Attrition of theophylline granules during drying in a fluidised bed granulator. Pharm. Ind., 1994(56): p. 282-285.
50. Schaafsma, S.H., et al., Effects and control of humidity and particle mixing in fluid-bad granulation. AIChE Journal, 1999. 45(6): p. 1202-1210.
51. Ehlers, H., et al., Granule size control and targeting in pulsed spray fluid bed granulation. International Journal of Pharmaceutics, 2009. 377(1–2): p. 9-15.
52. Närvänen, T., et al., Controlling granule size by granulation liquid feed pulsing. International Journal of Pharmaceutics, 2008. 357(1–2): p. 132-138.
53. Rambali, B., L. Baert, and D.L. Massart, Using experimental design to optimize the process parameters in fluidized bed granulation on a semi-full scale. International Journal of Pharmaceutics, 2001. 220(1–2): p. 149-160.
54. Hemati, M., et al., Fluidized bed coating and granulation: influence of process-related variables and physicochemical properties on the growth kinetics. Powder Technology, 2003. 130(1–3): p. 18-34.
55. Tan, H.S., A.D. Salman, and M.J. Hounslow, Kinetics of fluidised bed melt granulation I: The effect of process variables. Chemical Engineering Science, 2006. 61(5): p. 1585-1601.
56. Jiménez, T., C. Turchiuli, and E. Dumoulin, Particles agglomeration in a conical

References
177
fluidized bed in relation with air temperature profiles. Chemical Engineering Science, 2006. 61(18): p. 5954-5961.
57. Faure, A., P. York, and R.C. Rowe, Process control and scale-up of pharmaceutical wet granulation processes: a review. European Journal of Pharmaceutics and Biopharmaceutics, 2001. 52(3): p. 269-277.
58. Crooks, M.J. and H.W. Schade, Fluidized bed granulation of a microdose pharmaceutical powder. Powder Technology, 1978. 19(1): p. 103-108.
59. Liu, H. and M.C. Altan, Science and Engineering of Droplets: Fundamentals and Applications. Applied Mechanics Reviews, 2002. 55(1): p. B16-B17.
60. Davies, W.L. and W.T. Gloor, Batch production of pharmaceutical granulations in a fluidized bed I: Effects of process variables on physical properties of final granulation. Journal of Pharmaceutical Sciences, 1971. 60(12): p. 1869-1874.
61. Abberger, T., A. Seo, and T. Schæfer, The effect of droplet size and powder particle size on the mechanisms of nucleation and growth in fluid bed melt agglomeration. International Journal of Pharmaceutics, 2002. 249(1–2): p. 185-197.
62. Zhai, H., et al., Nucleation and growth in fluidised hot melt granulation. Powder Technology, 2009. 189(2): p. 230-237.
63. Ansari, M.A. and F. Stepanek, Formation of hollow core granules by fluid bed in situ melt granulation: Modelling and experiments. International Journal of Pharmaceutics, 2006. 321(1–2): p. 108-116.
64. Seo, A., P. Holm, and T. Schæfer, Effects of droplet size and type of binder on the agglomerate growth mechanisms by melt agglomeration in a fluidised bed. European Journal of Pharmaceutical Sciences, 2002. 16(3): p. 95-105.
65. Lipsanen, T., et al., Novel description of a design space for fluidised bed granulation. International Journal of Pharmaceutics, 2007. 345(1–2): p. 101-107.
66. Lipsanen, T., et al., Effect of fluidisation activity on end-point detection of a fluid bed drying process. International Journal of Pharmaceutics, 2008. 357(1–2): p. 37-43.
67. Tan, H.S., A.D. Salman, and M.J. Hounslow, Kinetics of fluidised bed melt granulation V: Simultaneous modelling of aggregation and breakage. Chemical Engineering Science, 2005c. 60(14): p. 3847-3866.
68. Hu, X., J. Cunningham, and D. Winstead, Understanding and predicting bed humidity in fluidized bed granulation. Journal of Pharmaceutical Sciences, 2008a. 97(4): p. 1564-1577.
69. Walker, G.M., G. Andrews, and D. Jones, Effect of process parameters on the melt granulation of pharmaceutical powders. Powder Technology, 2006. 165(3): p. 161-166.
70. Ormos, Z. and K. Pataki, Studies on granulation in a fluidised-bed .VII. effect of raw-material upon the granule formation. Hungarian Journal of Industrial Chemistry, 1979. 7(1): p. 89-103.
71. Rajniak, P., et al., Experimental study of wet granulation in fluidized bed: Impact of the binder properties on the granule morphology. International Journal of Pharmaceutics, 2007. 334(1–2): p. 92-102.
72. Abberger, T., The effect of powder type, free moisture and deformation behaviour of granules on the kinetics of fluid-bed granulation. European Journal of
References
178
Pharmaceutics and Biopharmaceutics, 2001. 52(3): p. 327-336. 73. Pont, V., et al., Influence of the physicochemical properties on the growth of solid
particles by granulation in fluidized bed. Powder Technology, 2001. 120(1–2): p. 97-104.
74. Walker, G.M., et al., Influence of process parameters on fluidised hot-melt granulation and tablet pressing of pharmaceutical powders. Chemical Engineering Science, 2005. 60(14): p. 3867-3877.
75. Tan, H.S., et al., Population Balance Modelling of Fluidized Bed Melt Granulation: An Overview. Chemical Engineering Research and Design, 2005b. 83(7): p. 871-880.
76. Adetayo, A.A., et al., Population balance modelling of drum granulation of materials with wide size distribution. Powder Technology, 1995. 82(1): p. 37-49.
77. Peglow, M., et al., A generic population balance model for simultaneous agglomeration and drying in fluidized beds. Chemical Engineering Science, 2007. 62(1-2): p. 513-532.
78. X. Liu, L. and J. D. Litster, Population balance modelling of granulation with a physically based coalescence kernel. Chemical Engineering Science, 2002. 57(12): p. 2183-2191.
79. Liu, Y. and I.T. Cameron, A new wavelet-based method for the solution of the population balance equation. Chemical Engineering Science, 2001. 56(18): p. 5283-5294.
80. Cryer, S.A., Modeling agglomeration processes in fluid-bed granulation. AIChE Journal, 1999. 45(10): p. 2069-2078.
81. Tan, H.S., A.D. Salman, and M.J. Hounslow, Kinetics of fluidised bed melt granulation: IV. Selecting the breakage model. Powder Technology, 2004. 143-144(0): p. 65-83.
82. Vreman, A.W., C.E. van Lare, and M.J. Hounslow, A basic population balance model for fluid bed spray granulation. Chemical Engineering Science, 2009. 64(21): p. 4389-4398.
83. Heinrich, S., et al., Analysis of the start-up process in continuous fluidized bed spray granulation by population balance modelling. Chemical Engineering Science, 2002. 57(20): p. 4369-4390.
84. Drechsler, J., et al., Investigating the dynamic behaviour of fluidized bed spray granulation processes applying numerical simulation tools. Chemical Engineering Science, 2005. 60(14): p. 3817-3833.
85. Radichkov, R., et al., A numerical bifurcation analysis of continuous fluidized bed spray granulation with external product classification. Chemical Engineering and Processing: Process Intensification, 2006. 45(10): p. 826-837.
86. Landgrebe, J.D. and S.E. Pratsinis, Gas-phase manufacture of particulates: interplay of chemical reaction and aerosol coagulation in the free-molecular regime. Industrial & Engineering Chemistry Research, 1989. 28(10): p. 1474-1481.
87. Randolph, A.D. and M.A. Larson, Theory of particulate processes : analysis and techniques of continuous crystallization. 1988, San Diego: Academic Press.
88. Ramkrishna, D., Population Balances. Theory and applications to particulate systems in engineering. . 2000, New York: Academic Press.

References
179
89. Hounslow, M.J., J.M.K. Pearson, and T. Instone, Tracer studies of high-shear granulation: II. Population balance modeling. AIChE Journal, 2001b. 47(9): p. 1984-1999.
90. Marchisio, D.L., R.D. Vigil, and R.O. Fox, Quadrature method of moments for aggregation–breakage processes. Journal of Colloid and Interface Science, 2003b. 258(2): p. 322-334.
91. Poon, J.M.H., et al., Experimental validation studies on a multi-dimensional and multi-scale population balance model of batch granulation. Chemical Engineering Science, 2009. 64(4): p. 775-786.
92. Poon, J.M.H., et al., A three-dimensional population balance model of granulation with a mechanistic representation of the nucleation and aggregation phenomena. Chemical Engineering Science, 2008. 63(5): p. 1315-1329.
93. Darelius, A., et al., High shear wet granulation modelling—a mechanistic approach using population balances. Powder Technology, 2005. 160(3): p. 209-218.
94. Kapur, P.C., Kinetics of granulation by non-random coalescence mechanism. Chemical Engineering Science, 1972. 27(10): p. 1863-1869.
95. Kapur, P.C. and D.W. Fuerstenau, Coalescence Model for Granulation. Industrial & Engineering Chemistry Process Design and Development, 1969. 8(1): p. 56-62.
96. Sastry, K.V.S., Similarity size distribution of agglomerates during their growth by coalescence in granulation or green pelletization. International Journal of Mineral Processing, 1975. 2(2): p. 187-203.
97. Adetayo, A.A. and B.J. Ennis, Unifying approach to modeling granule coalescence mechanisms. AIChE Journal, 1997. 43(4): p. 927-934.
98. Friedlander, S.K., Smoke, dust and haze. Fundamentals of aerosol behavior: John Wiley, New York, London, Sydney, Toronto. 1977. Pp. xvii + 317. Environmental Pollution (1970), 1977. 15(4): p. 315-315.
99. Golovin, A.M., The solution of the coagulating equation for cloud droplets in a rising air current. B. Acad. Sci. USSR, Ser. Geophys., 1963. 5: p. 482-487.
100. Kumar, J., et al., An efficient numerical technique for solving population balance equation involving aggregation, breakage, growth and nucleation. Powder Technology, 2008. 182(1): p. 81-104.
101. Roy, P., et al., Size-dependent coalescence kernel in fertilizer granulation-A comparative study. Particuology, 2009. 7(6): p. 445-450.
102. Friedlander, S.K., Smoke, dust and haze. Fundamentals of aerosol behavior. John Wiley, New York, 1977; second ed. Oxford University Press, NY. 2000.
103. Soos, M., J. Sefcik, and M. Morbidelli, Investigation of aggregation, breakage and restructuring kinetics of colloidal dispersions in turbulent flows by population balance modeling and static light scattering. Chemical Engineering Science, 2006. 61(8): p. 2349-2363.
104. Dhanarajan, A. and R. Bandyopadhyay, An energy-based population-balance approach to model granule growth and breakage in high-shear wet granulation processes. AAPS PharmSciTech, 2007. 8(3): p. E118-E125.
105. Attarakih, M.M., H.J.H.-J. Bart, and N.M. Faqir, Numerical solution of the spatially distributed population balance equation describing the hydrodynamics of
References
180
interacting liquid-liquid dispersions. Chemical Engineering Science, 2004. 59(12): p. 2567-2592.
106. Vanni, M., Approximate Population Balance Equations for Aggregation-Breakage Processes. Journal of Colloid and Interface Science, 2000. 221(2): p. 143-160.
107. Hounslow, M.J., R.L. Ryall, and V.R. Marshall, A discretized population balance for nucleation, growth, and aggregation. AIChE Journal, 1988. 34(11): p. 1821-1832.
108. Lister, J.D., D.J. Smit, and M.J. Hounslow, Adjustable discretized population balance for growth and aggregation. AIChE Journal, 1995. 41(3): p. 591-603.
109. Kumar, S. and D. Ramkrishna, On the solution of population balance equations by discretization--I. A fixed pivot technique. Chemical Engineering Science, 1996a. 51(8): p. 1311-1332.
110. Kumar, S. and D. Ramkrishna, On the solution of population balance equations by discretization--II. A moving pivot technique. Chemical Engineering Science, 1996b. 51(8): p. 1333-1342.
111. Batterham, R.J., J.S. Hall, and G. Barton, Proceedings, 3rd International Symposium on Agglomeration, Nürnberg (1981) p. A136 . 1981.
112. Hulburt, H.M. and S. Katz, Some problems in particle technology: A statistical mechanical formulation. Chemical Engineering Science, 1964. 19(8): p. 555-574.
113. Wan, B. and T.A. Ring, Verification of SMOM and QMOM population balance modeling in CFD code using analytical solutions for batch particulate processes. China Particuology, 2006. 4(5): p. 243-249.
114. Frenklach, M. and S.J. Harris, Aerosol dynamics modeling using the method of moments. Journal of Colloid and Interface Science, 1987. 118(1): p. 252-261.
115. Pratsinis, S.E., S.K. Friedlander, and A.J. Pearlstein, Aerosol reactor theory: Stability and dynamics of a continuous stirred tank aerosol reactor. AIChE Journal, 1986. 32(2): p. 177-185.
116. Kruis, F.E., et al., A Simple Model for the Evolution of the Characteristics of Aggregate Particles Undergoing Coagulation and Sintering. Aerosol Science and Technology, 1993. 19(4): p. 514-526.
117. Lee, K.W., Change of particle size distribution during Brownian coagulation. Journal of Colloid and Interface Science, 1983. 92(2): p. 315-325.
118. McGraw, R., Description of Aerosol Dynamics by the Quadrature Method of Moments. Aerosol Science and Technology, 1997. 27(2): p. 255-265.
119. Marchisio, D.L., R. Dennis Vigil, and R. O. Fox, Implementation of the quadrature method of moments in CFD codes for aggregation-breakage problems. Chemical Engineering Science, 2003c. 58(15): p. 3337-3351.
120. Marchisio, D.L. and R.O. Fox, Solution of population balance equations using the direct quadrature method of moments. Journal of Aerosol Science, 2005. 36(1): p. 43-73.
121. Marchisio, D.L., et al., Quadrature method of moments for population-balance equations. AIChE Journal, 2003a. 49(5): p. 1266-1276.
122. Upadhyay, R.R. and O.A. Ezekoye, Evaluation of the 1-point quadrature approximation in QMOM for combined aerosol growth laws. Journal of Aerosol Science, 2003. 34(12): p. 1665-1683.
123. Piskunov, V.N. and A.I. Golubev, The generalized approximation method for
References
181
modeling coagulation kinetics--Part 1: justification and implementation of the method. Journal of Aerosol Science, 2002a. 33(1): p. 51-63.
124. Piskunov, V.N., et al., The generalized approximation method for modeling coagulation kinetics--Part 2: comparison with other methods. Journal of Aerosol Science, 2002b. 33(1): p. 65-75.
125. Attarakih, M.M., et al., Solution of the population balance equation using the sectional quadrature method of moments (SQMOM), in Computer Aided Chemical Engineering. 2006, Elsevier. p. 209-214.
126. Mishra, B.K., Monte Carlo simulation of particle breakage process during grinding. Powder Technology, 2000. 110(3): p. 246-252.
127. Shah, B.H., D. Ramkrishna, and J.D. Borwanker, Simulation of particulate systems using the concept of the interval of quiescence. AIChE Journal, 1977. 23(6): p. 897-904.
128. van Peborgh Gooch, J.R. and M.J. Hounslow, Monte Carlo simulation of size-enlargement mechanisms in crystallization. AIChE Journal, 1996. 42(7): p. 1864-1874.
129. Liffman, K., A direct simulation Monte-Carlo method for cluster coagulation. Journal of Computational Physics, 1992. 100(1): p. 116-127.
130. Debry, E., B. Sportisse, and B. Jourdain, A stochastic approach for the numerical simulation of the general dynamics equation for aerosols. Journal of Computational Physics, 2003. 184(2): p. 649-669.
131. Maisels, A., F. Einar Kruis, and H. Fissan, Direct simulation Monte Carlo for simultaneous nucleation, coagulation, and surface growth in dispersed systems. Chemical Engineering Science, 2004. 59(11): p. 2231-2239.
132. Kruis, F.E., A. Maisels, and H. Fissan, Direct simulation Monte Carlo method for particle coagulation and aggregation. AIChE Journal, 2000. 46(9): p. 1735-1742.
133. Maisels, A., et al., A Study of Nanoparticle Aerosol Charging by Monte Carlo Simulations. Journal of Nanoparticle Research, 2003. 5(3): p. 225-235.
134. Lin, Y., K. Lee, and T. Matsoukas, Solution of the population balance equation using constant-number Monte Carlo. Chemical Engineering Science, 2002. 57(12): p. 2241-2252.
135. Lee, K. and T. Matsoukas, Simultaneous coagulation and break-up using constant-N Monte Carlo. Powder Technology, 2000. 110(1-2): p. 82-89.
136. Smith, M. and T. Matsoukas, Constant-number Monte Carlo simulation of population balances. Chemical Engineering Science, 1998. 53(9): p. 1777-1786.
137. Utikar, R.P. and V.V. Ranade, Single jet fluidized beds: Experiments and CFD simulations with glass and polypropylene particles. Chemical Engineering Science, 2007. 62(1-2): p. 167-183.
138. Vaishali, S., S. Roy, and P.L. Mills, Hydrodynamic simulation of gas-solids downflow reactors. Chemical Engineering Science, 2008. 63(21): p. 5107-5119.
139. Zhong, W.Q., et al., Discrete Element Method Simulation of Cylinder-Shaped Particle Flow in a Gas-Solid Fluidized Bed. Chemical Engineering & Technology, 2009. 32(3): p. 386-391.
140. Taghipour, F., N. Ellis, and C. Wong, Experimental and computational study of gas - solid fluidized bed hydrodynamics. Chemical Engineering Science, 2005. 60(24):
References
182
p. 6857-6867. 141. Ahuja, G.N. and A.W. Patwardhan, CFD and experimental studies of solids hold-up
distribution and circulation patterns in gas - solid fluidized beds. Chemical Engineering Journal, 2008. 143(1-3): p. 147-160.
142. Wang, J., M.A. van der Hoef, and J.A.M. Kuipers, CFD study of the minimum bubbling velocity of Geldart A particles in gas-fluidized beds. Chemical Engineering Science. 65(12): p. 3772-3785.
143. Hosseini, S.H., et al., CFD studies of solids hold-up distribution and circulation patterns in gas - solid fluidized beds. Powder Technology, 2010. 200(3): p. 202-215.
144. Papadikis, K., A.V. Bridgwater, and S. Gu, CFD modelling of the fast pyrolysis of biomass in fluidised bed reactors, Part A: Eulerian computation of momentum transport in bubbling fluidised beds. Chemical Engineering Science, 2008. 63(16): p. 4218-4227.
145. Armstrong, L.M., S. Gu, and K.H. Luo, Study of wall-to-bed heat transfer in a bubbling fluidised bed using the kinetic theory of granular flow. International Journal of Heat and Mass Transfer, 2010. 53(21-22): p. 4949-4959.
146. Yu, L., et al., Numerical simulation of the bubbling fluidized bed coal gasification by the kinetic theory of granular flow (KTGF). Fuel, 2007. 86(5-6): p. 722-734.
147. Yusuf, R., B. Halvorsen, and M.C. Melaaen, An experimental and computational study of wall to bed heat transfer in a bubbling gas-solid fluidized bed. International Journal of Multiphase Flow, 2012. 42(0): p. 9-23.
148. Ahmadi, G. and M. Shahinpoor, A kinetic model for rapid flows of granular materials. International Journal of Non-Linear Mechanics, 1984. 19(2): p. 177-186.
149. Lun, C.K.K. and S.B. Savage, A Simple Kinetic Theory for Granular Flow of Rough, Inelastic, Spherical Particles. Journal of Applied Mechanics, 1987. 54(1): p. 47-53.
150. Gidaspow, D., Multiphase flow and fluidization: Continuum and kinetic theory descriptions. Academic Press, San Diego, 1994.
151. Kafui, K.D., C. Thornton, and M.J. Adams, Discrete particle-continuum fluid modelling of gas-solid fluidised beds. Chemical Engineering Science, 2002. 57(13): p. 2395-2410.
152. Link, J.M., et al., Comparison of fibre optical measurements and discrete element simulations for the study of granulation in a spout fluidized bed. Powder Technology, 2009. 189(2): p. 202-217.
153. Fries, L., et al., DEM-CFD modeling of a fluidized bed spray granulator. Chemical Engineering Science, 2011. 66(11): p. 2340-2355.
154. Goldschmidt, M.J.V., et al., Discrete element modelling of fluidised bed spray granulation. Powder Technology, 2003. 138(1): p. 39-45.
155. van Buijtenen, M.S., et al., A discrete element study of wet particle–particle interaction during granulation in a spout fluidized bed. The Canadian Journal of Chemical Engineering, 2009. 87(2): p. 308-317.
156. Kafui, D.K. and C. Thornton, Fully-3D DEM simulation of fluidised bed spray granulation using an exploratory surface energy-based spray zone concept. Powder Technology, 2008. 184(2): p. 177-188.
157. Radeke, C.A., B.J. Glasser, and J.G. Khinast, Large-scale powder mixer simulations

References
183
using massively parallel GPUarchitectures. Chemical Engineering Science, 2010. 65(24): p. 6435-6442.
158. Gidaspow, D., Multiphase flow and fluidization: Continuum and kinetic theory descriptions. San Diego, USA: Academic Press, 1994.
159. Ding, J. and D. Gidaspow, A bubbling fluidization model using kinetic theory of granular flow. AIChE Journal, 1990. 36(4): p. 523-538.
160. M. Syamlal, W. Rogers, and O.Brien T. J, MFIX Documentation: Volume1, Theory Guide>. National Technical Information Service, Springfield, VA. DOE/METC-9411004, NTIS/DE94000871993.
161. Gidaspow, D., R.B. , and J.D. , Hydrodynamics of Circulating Fluidized Beds, Kinetic Theory Approach. In Fluidization VII, Proceeding of the 7th Engineering Foundation Conference on Fluidization, 1992: p. 75-82.
162. Lun, C.K.K., et al., Kinetic Theories for Granular Flow: Inelastic Particles in Couette Flow and Slightly Inelastic Particles in a General Flow Field. Journal of Fluid Mechanics 1984. 140: p. 223-256.
163. Ma, D. and G. Ahmadi, A thermodynamical formulation for dispersed multiphase turbulent flows II: Simple shear flows for dense mixtures. International Journal of Multiphase Flow, 1990. 16(2): p. 341-351.
164. Ogawa, S., A. Umemura, and N. Oshima, On the equations of fully fluidized granular materials. Zeitschrift für angewandte Mathematik und Physik ZAMP, 1980. 31(4): p. 483-493.
165. Iddir, H. and H. Arastoopour, Modeling of multitype particle flow using the kinetic theory approach. AIChE Journal, 2005. 51(6): p. 1620-1632.
166. Teaters, L., A Computational Study of the Hydrodynamics of Gas-Solid Fluidized Beds Msc thesis, Virginia Polytechnic Institute and State University, 2012.
167. Richardson, J.R. and W.N. Zaki, Sedimentation and Fluidization: Part I. Transactions of the Institute of Chemical Engineering, 1954. 32(1): p. 35-53.
168. Wen, C.Y. and Y.H. Yu, A generalized method for predicting the minimum fluidization velocity. AIChE Journal, 1966. 12(3): p. 610-612.
169. Gibilaro, L.G., et al., Generalized friction factor and drag coefficient correlations for fluid-particle interactions. Chemical Engineering Science, 1985. 40(10): p. 1817-1823.
170. Syamlal, M. and T.J. O'Brien, Computer Simulation of Bubbles in a Fluidized Bed. American Institute of Chemical Engineers Symposium Series, 1989. 85: p. 22-31.
171. Arastoopour, H., P. Pakdel, and M. Adewumi, Hydrodynamic analysis of dilute gas-solids flow in a vertical pipe. Powder Technology, 1990. 62(2): p. 163-170.
172. Di Felice, R., The voidage function for fluid-particle interaction systems. International Journal of Multiphase Flow, 1994. 20(1): p. 153-159.
173. Koch, D.L. and R.J. Hill, Inertial Effects in Suspension and Porous-Media Flows. Annual Review of Fluid Mechanics, 2001. 33(1): p. 619-647.
174. Zhang, Y. and J.M. Reese, The Drag Force in Two Fluid Models of Gas-Solid Flows. Chemical Engineering Science, 2003. 58(8): p. 1641-1644.
175. Maronga, S.J. and P. Wnukowski, Establishing temperature and humidity profiles in fluidized bed particulate coating. Powder Technology, 1997. 94(2): p. 181-185.
176. Heinrich, S., et al., Study of dynamic multi-dimensional temperature and
References
184
concentration distributions in liquid-sprayed fluidized beds. Chemical Engineering Science, 2003. 58(23-24): p. 5135-5160.
177. Chen, X.-Z., et al., Three-dimensional CFD-PBM coupled model of the temperature fields in fluidized-bed polymerization reactors. AIChE Journal, 2011. 57(12): p. 3351-3366.
178. A. Öncül, A.A., et al., CFD modelling of BaSO4 precipitation inside microemulsion droplets in a semi-batch reactor. Chemical Engineering Journal, 2008. 138(1-3): p. 498-509.
179. Venneker, B.C.H., J.J. Derksen, and H.E.A. Van den Akker, Population balance modeling of aerated stirred vessels based on CFD. AIChE Journal, 2002. 48(4): p. 673-685.
180. Fan, R., D.L. Marchisio, and R.O. Fox, Application of the direct quadrature method of moments to polydisperse gas-solid fluidized beds. Powder Technology, 2004. 139(1): p. 7-20.
181. Fan, R. and R.O. Fox, Segregation in polydisperse fluidized beds: Validation of a multi-fluid model. Chemical Engineering Science, 2008. 63(1): p. 272-285.
182. Ahmadzadeh, A., et al., Population balance equations' application in rotating fluidized bed polymerization reactor. Chemical Engineering Research and Design, 2008. 86(4): p. 329-343.
183. Balaji, S., et al., Multi-scale modeling and control of fluidized beds for the production of solar grade silicon. Powder Technology, 2010. 199(1): p. 23-31.
184. Börner, M., M. Peglow, and E. Tsotsas, Derivation of parameters for a two compartment population balance model of Wurster fluidised bed granulation. Powder Technology, 2013. 238(0): p. 122-131.
185. Turchiuli, C., T. Jimenèz, and E. Dumoulin, Identification of thermal zones and population balance modelling of fluidized bed spray granulation. Powder Technology, 2011. 208(2): p. 542-552.
186. Hussain, M., et al., On two-compartment population balance modeling of spray fluidized bed agglomeration. Computers & Chemical Engineering, 2014. 61(0): p. 185-202.
187. Zhang, J., et al., Evaluation of control strategies for fertiliser granulation circuits using dynamic simulation. Powder Technology, 2000. 108(2–3): p. 122-129.
188. Watano, S., Y. Sato, and K. Miyanami, Application of fuzzy-logic to moisture control in fluidized-bed granulation. Journal of Chemical Engineering of Japan, 1995. 28(3): p. 282-287.
189. Watano, S., K. Terashita, and K. Miyanami, Moisture feedback control and process automation in fluidized bed granulation. Advanced Powder Technology, 1992. 3(4): p. 255-265.
190. Watano, S., Y. Sato, and K. Miyanami, Control of granule growth in fluidized bed granulation by an image processing system. Chemical & pharmaceutical bulletin, 1996. 44(8): p. 1556-1560.
191. Watano, S., Direct control of wet granulation processes by image processing system. Powder Technology, 2001. 117(1-2): p. 163-172.
192. Gatzke, E.P. and F.J. Doyle, Model predictive control of a granulation system using soft output constraints and prioritized control objectives. Powder Technology,

References
185
2001. 121(2-3): p. 149-158. 193. Pottmann, M., et al., Model-based control of a granulation system. Powder
Technology, 2000. 108(2-3): p. 192-201. 194. Sanders, C.F.W., M.J. Hounslow, and F.J. Doyle Iii, Identification of models for
control of wet granulation. Powder Technology, 2009. 188(3): p. 255-263. 195. Long, C.E., J.A. Gantt, and E.R. Gatzke. Batch granulation control using a
simplified population balance and nonlinear model predictive control. in American Control Conference, 2005. Proceedings of the 2005. 2005.
196. Mort, P.R., S.W. Capeci, and J.W. Holder, Control of agglomerate attributes in a continuous binder-agglomeration process. Powder Technology, 2001. 117(1-2): p. 173-176.
197. Lourenço, V., et al., A quality by design study applied to an industrial pharmaceutical fluid bed granulation. European Journal of Pharmaceutics and Biopharmaceutics, 2012. 81(2): p. 438-447.
198. Liu, H., et al., Using the Box–Behnken experimental design to optimise operating parameters in pulsed spray fluidised bed granulation. International Journal of Pharmaceutics, 2013. 448(2): p. 329-338.
199. Närvänen, T., et al., Controlling granule size by granulation liquid feed pulsing. International Journal of Pharmaceutics, 2008. 357(1&2): p. 132-138.
200. Liu, H. and M. Li, Population balance modelling and multi-stage optimal control of a pulsed spray fluidized bed granulation. International Journal of Pharmaceutics, 2014(0).
201. CDER, F.a.D.A., Guidance for Industry Q8 Pharmaceutical Development. May 2006. 202. CDER, F.a.D.A., Guidance for Industry Q8(R2) Pharmaceutical Development.
November 2009. 203. Tomba, E., et al., Latent variable modeling to assist the implementation of
Quality-by-Design paradigms in pharmaceutical development and manufacturing: A review. International Journal of Pharmaceutics, 2013. 457(1): p. 283-297.
204. Rambali, B., et al., Using Experimental Design to Optimize the Process Parameters in Fluidized Bed Granulation. Drug Development and Industrial Pharmacy, 2001. 27(1): p. 47-55.
205. Montgomery, D.C., Design and analysis of experiments. Third Edition ed. 1991: John wiley & sons.
206. Zidan, A.S., et al., Quality by design: Understanding the formulation variables of a cyclosporine A self-nanoemulsified drug delivery systems by Box-Behnken design and desirability function. International Journal of Pharmaceutics, 2007. 332(1&2): p. 55-63.
207. Govender, S., et al., Optimisation and characterisation of bioadhesive controlled release tetracycline microspheres. International Journal of Pharmaceutics, 2005. 306(1&2): p. 24-40.
208. Aulton, M.E., Pharmaceutics: the Science of Dosage Form Design. Second ed. 2002: Churchill Livingstone.
209. Schaafsma, S.H., et al., Effects and control of humidity and particle mixing in fluid-bed granulation. AIChE Journal, 1999. 45(6): p. 1202-1210.
210. Iveson, S.M., Limitations of one-dimensional population balance models of wet
References
186
granulation processes. Powder Technology, 2002. 124(3): p. 219-229. 211. Ding, A., M.J. Hounslow, and C.A. Biggs, Population balance modelling of
activated sludge flocculation: Investigating the size dependence of aggregation, breakage and collision efficiency. Chemical Engineering Science, 2006. 61(1): p. 63-74.
212. Glaser, T., et al., Model predictive control of continuous drum granulation. Journal of Process Control, 2009. 19(4): p. 615-622.
213. Ramachandran, R. and A. Chaudhury, Model-based design and control of a continuous drum granulation process. Chemical Engineering Research and Design, 2012. 90(8): p. 1063-1073.
214. Gatzke, E.P. and F.J. Doyle Iii, Model predictive control of a granulation system using soft output constraints and prioritized control objectives. Powder Technology, 2001. 121(2–3): p. 149-158.
215. Burggraeve, A., et al., Process analytical tools for monitoring, understanding, and control of pharmaceutical fluidized bed granulation: A review. European Journal of Pharmaceutics and Biopharmaceutics, 2013. 83(1): p. 2-15.
216. Wang, J., M.A. van der Hoef, and J.A.M. Kuipers, CFD study of the minimum bubbling velocity of Geldart A particles in gas-fluidized beds. Chemical Engineering Science, 2010. 65(12): p. 3772-3785.
217. Depypere, F.d.r., J.G. Pieters, and K. Dewettinck, CFD analysis of air distribution in fluidised bed equipment. Powder Technology, 2004. 145(3): p. 176-189.
218. Armstrong, L.M., K.H. Luo, and S. Gu, Two-dimensional and three-dimensional computational studies of hydrodynamics in the transition from bubbling to circulating fluidised bed. Chemical Engineering Journal, 2010. 160(1): p. 239-248.
219. Feng, Y., et al., CFD modeling of gas-solid flow in an internally circulating fluidized bed. Powder Technology, 2012. 219(0): p. 78-85.
220. Taghipour, F., N. Ellis, and C. Wong, Experimental and computational study of gas-solid fluidized bed hydrodynamics. Chemical Engineering Science, 2005. 60(24): p. 6857-6867.
221. van Wachem, B.G.M. and A.E. Almstedt, Methods for multiphase computational fluid dynamics. Chemical Engineering Journal, 2003. 96(1–3): p. 81-98.
222. Gidaspow, D., R. Bezburuah, and J. Ding, Hydrodynamics of circulating fluidized beds: Kinetic theory approach. 1991. Medium: ED; Size: Pages: (8 p).
223. Lun, C.K.K., et al., Kinetic theories for granular flow: inelastic particles in Couette flow and slightly inelastic particles in a general flow field. Journal of Fluid Mechanics, 1984. vol. 140: p. p.223-256.
224. Syamal M, Rogers W, and O.B. TJ., Theory Guide. Springfield: National Technical Information Service. MIFX Documentation 1993. Vol. 1.
225. Schaeffer, D.G., Instability in the evolution equations describing incompressible granular flow. Journal of Differential Equations, 1987. 66(1): p. 19-50.
226. Lettieri, P., et al., CFD modelling of liquid fluidized beds in slugging mode. Powder Technology, 2006. 167(2): p. 94-103.
227. Ronsse, F., J. Depelchin, and J.G. Pieters, Particle surface moisture content estimation using population balance modelling in fluidised bed agglomeration. Journal of Food Engineering. 109(3): p. 347-357.

References
187
228. Liu, H., et al., Using the Box-Behnken experimental design to optimise operating parameters in pulsed spray fluidised bed granulation. International Journal of Pharmaceutics, 2013. 448(2): p. 329-338.
229. Liu, H. and M. Li, Population balance modelling and multi-stage optimal control of a pulsed spray fluidized bed granulation. International Journal of Pharmaceutics, 2014. 468(1-2): p. 223-233.
230. Turchiuli, C., T. Jimenez, and E. Dumoulin, Identification of thermal zones and population balance modelling of fluidized bed spray granulation. Powder Technology, 2011. 208(2): p. 542-552.
231. Bezzo, F., S. Macchietto, and C.C. Pantelides, General hybrid multizonal/CFD approach for bioreactor modeling. AIChE Journal, 2003. 49(8): p. 2133-2148.
232. Bezzo, F., S. Macchietto, and C.C. Pantelides, Computational issues in hybrid multizonal/computational fluid dynamics models. AIChE Journal, 2005. 51(4): p. 1169-1177.
233. Portillo, P.M., F.J. Muzzio, and M.G. Ierapetritou, Hybrid DEM-compartment modeling approach for granular mixing. AIChE Journal, 2007. 53(1): p. 119-128.
234. Hounslow, M.J., J.M.K. Pearson, and T. Instone, Tracer studies of high-shear granulation: II. Population balance modeling. AIChE Journal, 2001. 47(9): p. 1984-1999.
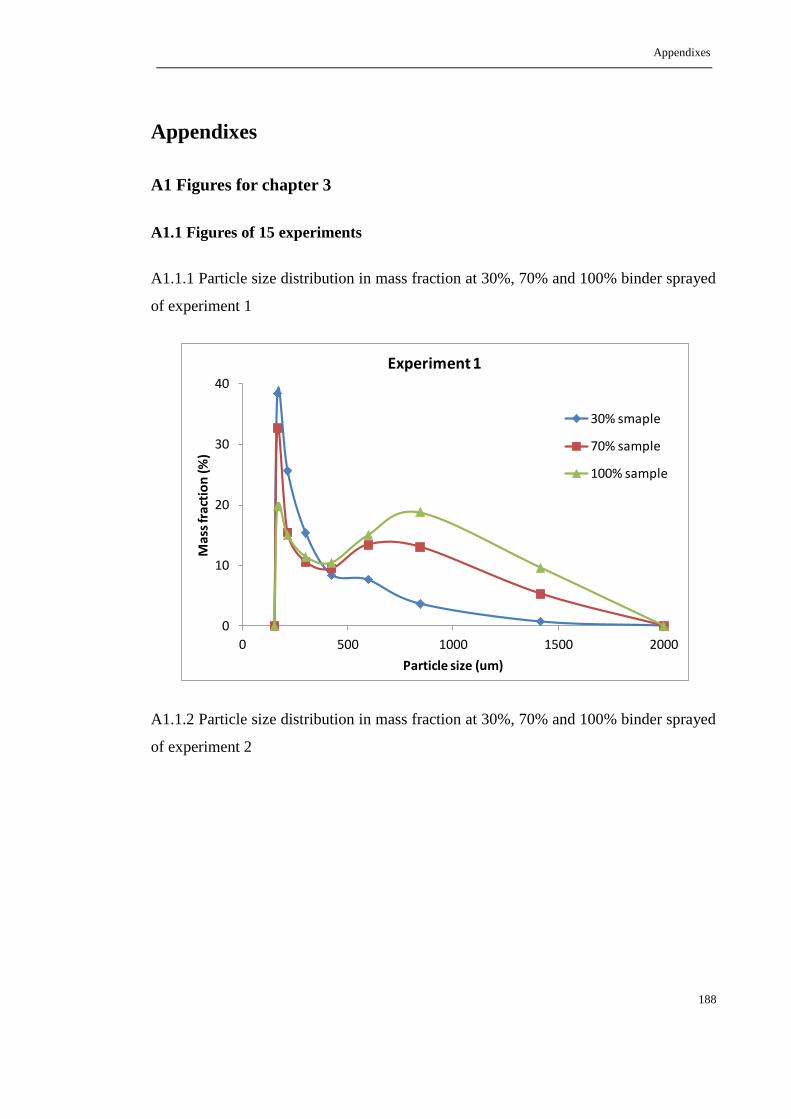
Appendixes
188
Appendixes
A1 Figures for chapter 3
A1.1 Figures of 15 experiments
A1.1.1 Particle size distribution in mass fraction at 30%, 70% and 100% binder sprayed
of experiment 1
A1.1.2 Particle size distribution in mass fraction at 30%, 70% and 100% binder sprayed
of experiment 2
0
10
20
30
40
0 500 1000 1500 2000
Mas
s fr
acti
on
(%)
Particle size (um)
Experiment 1
30% smaple
70% sample
100% sample

Appendixes
189
A1.1.3 Particle size distribution in mass fraction at 30%, 70% and 100% binder sprayed
of experiment 3
A1.1.4 Particle size distribution in mass fraction at 30%, 70% and 100% binder sprayed
of experiment 4
0
10
20
30
40
50
0 500 1000 1500 2000
Mas
s fr
acti
on
(%)
Particle size (um)
Experiment 2
30% smaple
70% sample
100% sample
0
10
20
30
40
0 500 1000 1500 2000
Mas
s fr
acti
on
(%)
Particle size (um)
Experiment 3
30% smaple
70% sample
100% sample
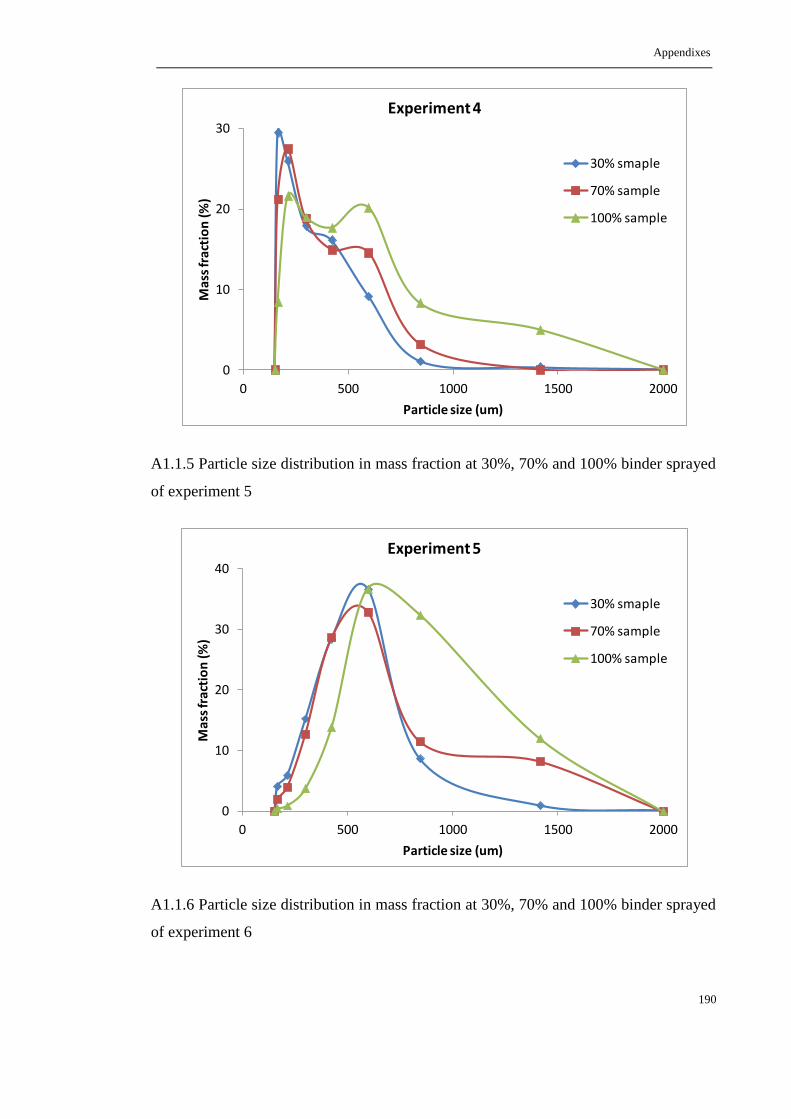
Appendixes
190
A1.1.5 Particle size distribution in mass fraction at 30%, 70% and 100% binder sprayed
of experiment 5
A1.1.6 Particle size distribution in mass fraction at 30%, 70% and 100% binder sprayed
of experiment 6
0
10
20
30
0 500 1000 1500 2000
Ma
ss fr
act
ion
(%
)
Particle size (um)
Experiment 4
30% smaple
70% sample
100% sample
0
10
20
30
40
0 500 1000 1500 2000
Mas
s fr
acti
on
(%)
Particle size (um)
Experiment 5
30% smaple
70% sample
100% sample

Appendixes
191
A1.1.7 Particle size distribution in mass fraction at 30%, 70% and 100% binder sprayed
of experiment 7
A1.1.8 Particle size distribution in mass fraction at 30%, 70% and 100% binder sprayed
of experiment 8
0
10
20
30
40
0 500 1000 1500 2000
Mas
s fr
acti
on
(%)
Particle size (um)
Experiment 6
30% smaple
70% sample
100% sample
0
10
20
30
0 500 1000 1500 2000
Ma
ss fr
act
ion
(%
)
Particle size (um)
Experiment 7
30% smaple
70% sample
100% sample
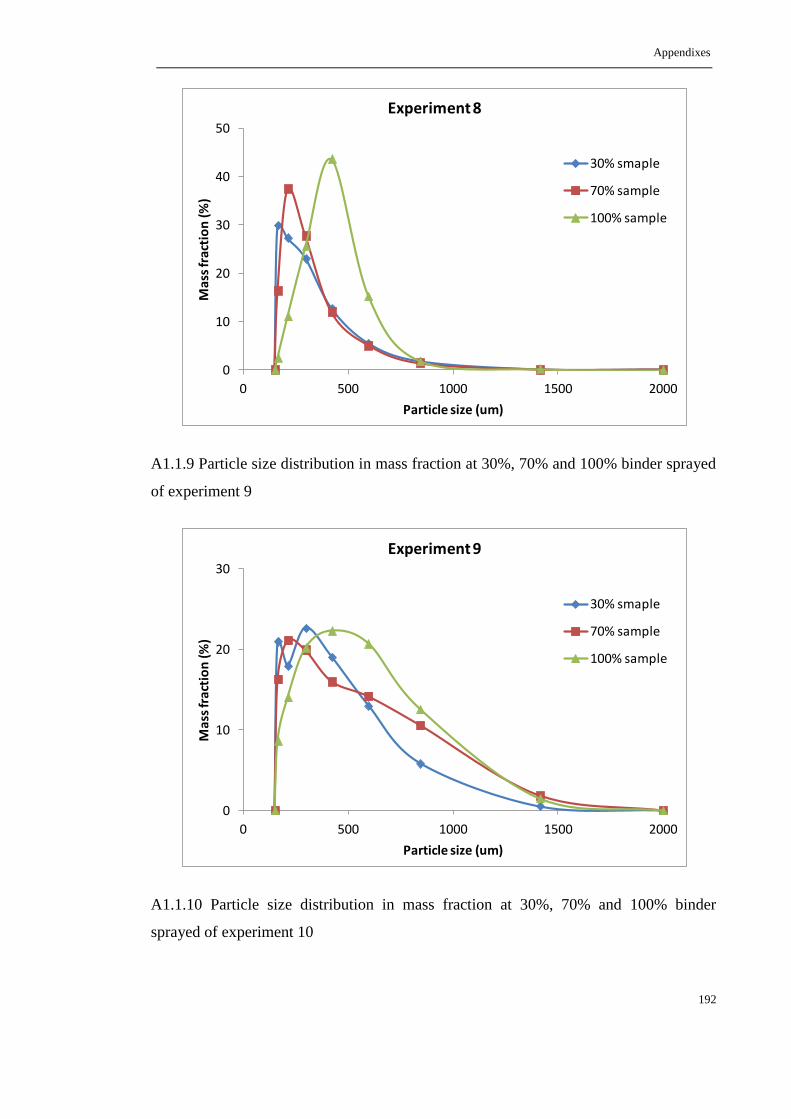
Appendixes
192
A1.1.9 Particle size distribution in mass fraction at 30%, 70% and 100% binder sprayed
of experiment 9
A1.1.10 Particle size distribution in mass fraction at 30%, 70% and 100% binder
sprayed of experiment 10
0
10
20
30
40
50
0 500 1000 1500 2000
Ma
ss fr
acti
on
(%
)
Particle size (um)
Experiment 8
30% smaple
70% sample
100% sample
0
10
20
30
0 500 1000 1500 2000
Ma
ss fr
act
ion
(%)
Particle size (um)
Experiment 9
30% smaple
70% sample
100% sample
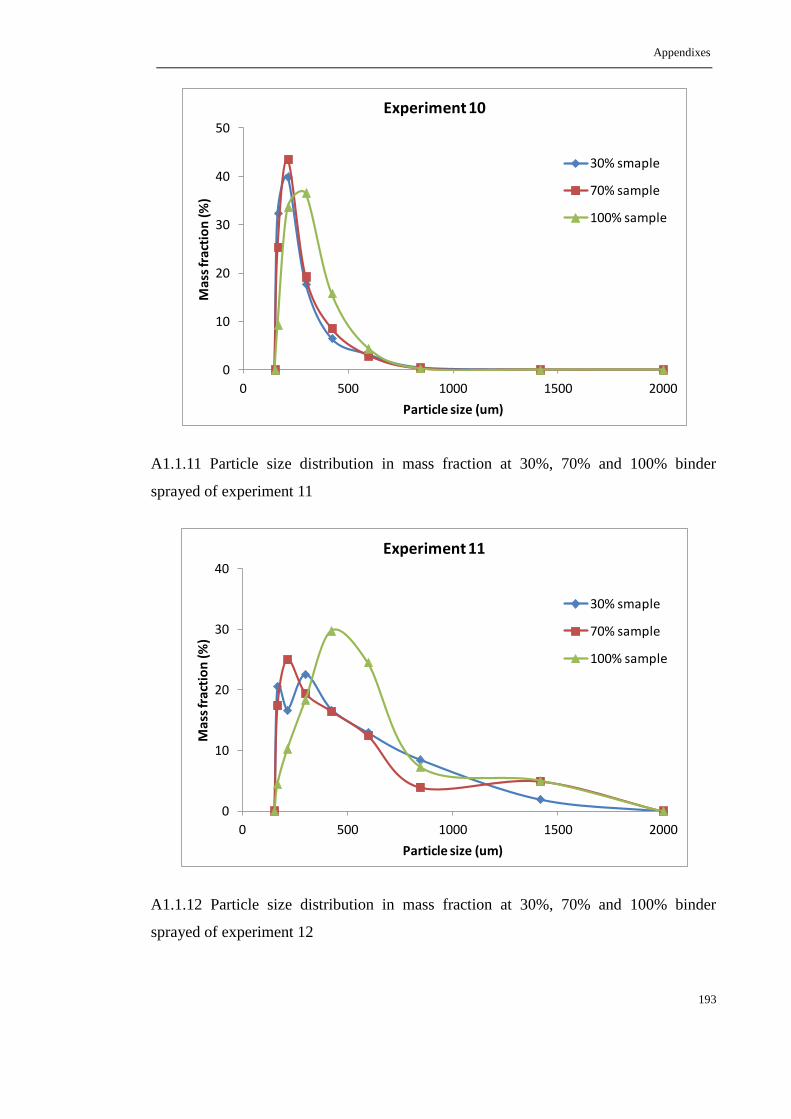
Appendixes
193
A1.1.11 Particle size distribution in mass fraction at 30%, 70% and 100% binder
sprayed of experiment 11
A1.1.12 Particle size distribution in mass fraction at 30%, 70% and 100% binder
sprayed of experiment 12
0
10
20
30
40
50
0 500 1000 1500 2000
Ma
ss fr
act
ion
(%
)
Particle size (um)
Experiment 10
30% smaple
70% sample
100% sample
0
10
20
30
40
0 500 1000 1500 2000
Mas
s fr
acti
on
(%)
Particle size (um)
Experiment 11
30% smaple
70% sample
100% sample

Appendixes
194
A1.1.13 Particle size distribution in mass fraction at 30%, 70% and 100% binder
sprayed of experiment 13
A1.1.14 Particle size distribution in mass fraction at 30%, 70% and 100% binder
sprayed of experiment 14
0
10
20
30
40
0 500 1000 1500 2000
Ma
ss fr
act
ion
(%)
Particle size (um)
Experiment 12
30% smaple
70% sample
100% sample
0
10
20
30
0 500 1000 1500 2000
Mas
s fr
acti
on
(%)
Particle size (um)
Experiment 13
30% smaple
70% sample
100% sample
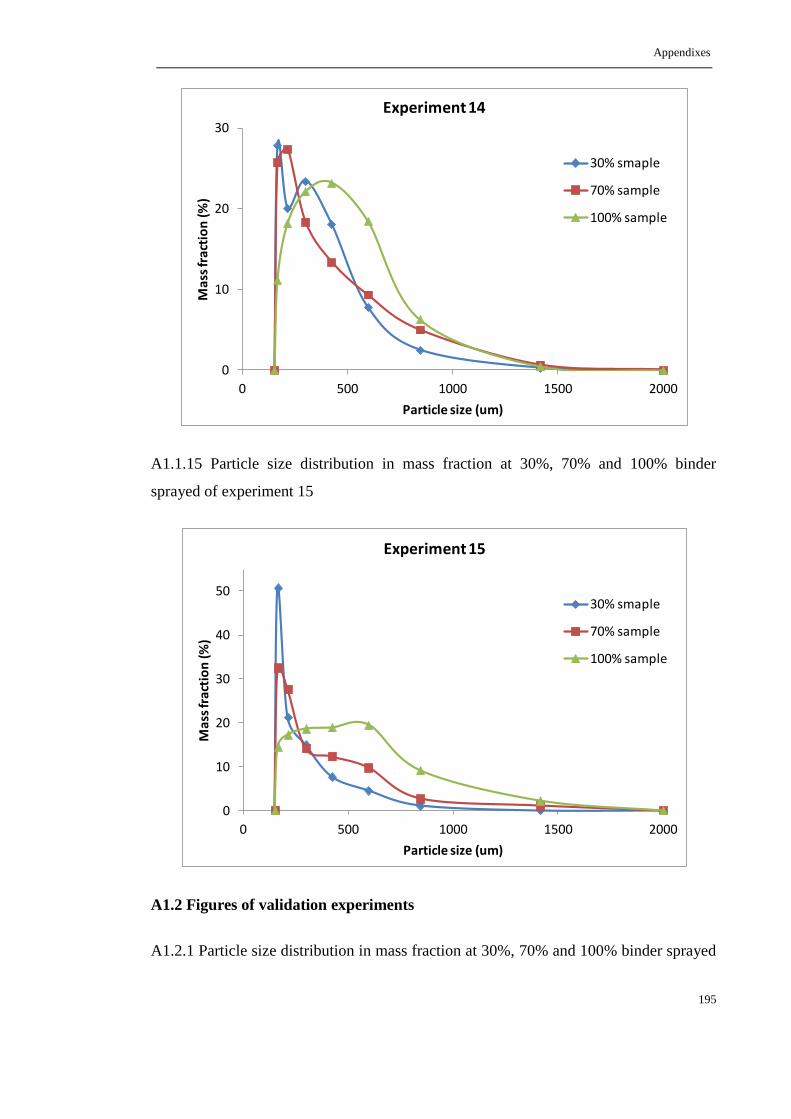
Appendixes
195
A1.1.15 Particle size distribution in mass fraction at 30%, 70% and 100% binder
sprayed of experiment 15
A1.2 Figures of validation experiments
A1.2.1 Particle size distribution in mass fraction at 30%, 70% and 100% binder sprayed
0
10
20
30
0 500 1000 1500 2000
Ma
ss fr
act
ion
(%)
Particle size (um)
Experiment 14
30% smaple
70% sample
100% sample
0
10
20
30
40
50
0 500 1000 1500 2000
Mas
s fr
acti
on
(%)
Particle size (um)
Experiment 15
30% smaple
70% sample
100% sample

Appendixes
196
of validation experiment 1
A1.2.2 Particle size distribution in mass fraction at 30%, 70% and 100% binder sprayed
of validation experiment 2
A1.2.3 Particle size distribution in mass fraction at 30%, 70% and 100% binder sprayed
0
10
20
30
40
0 500 1000 1500 2000
Mas
s fr
acti
on
(%)
Particle size (um)
Validation experiment 1
30% smaple
70% sample
100% sample
0
10
20
30
0 500 1000 1500 2000
Mas
s fr
acti
on
(%
)
Particle size (um)
Validation experiment 2
30% smaple
70% sample
100% sample

Appendixes
197
of validation experiment 3
A1.2.4 Particle size distribution in mass fraction at 30%, 70% and 100% binder sprayed
of validation experiment 4
0
10
20
30
0 500 1000 1500 2000
Mas
s fr
acti
on
(%)
Particle size (um)
Validation experiment 3
30% smaple
70% sample
100% sample
0
10
20
30
40
0 500 1000 1500 2000
Mas
s fr
acti
on
(%)
Particle size (um)
Validation experiment 4
30% smaple
70% sample
100% sample
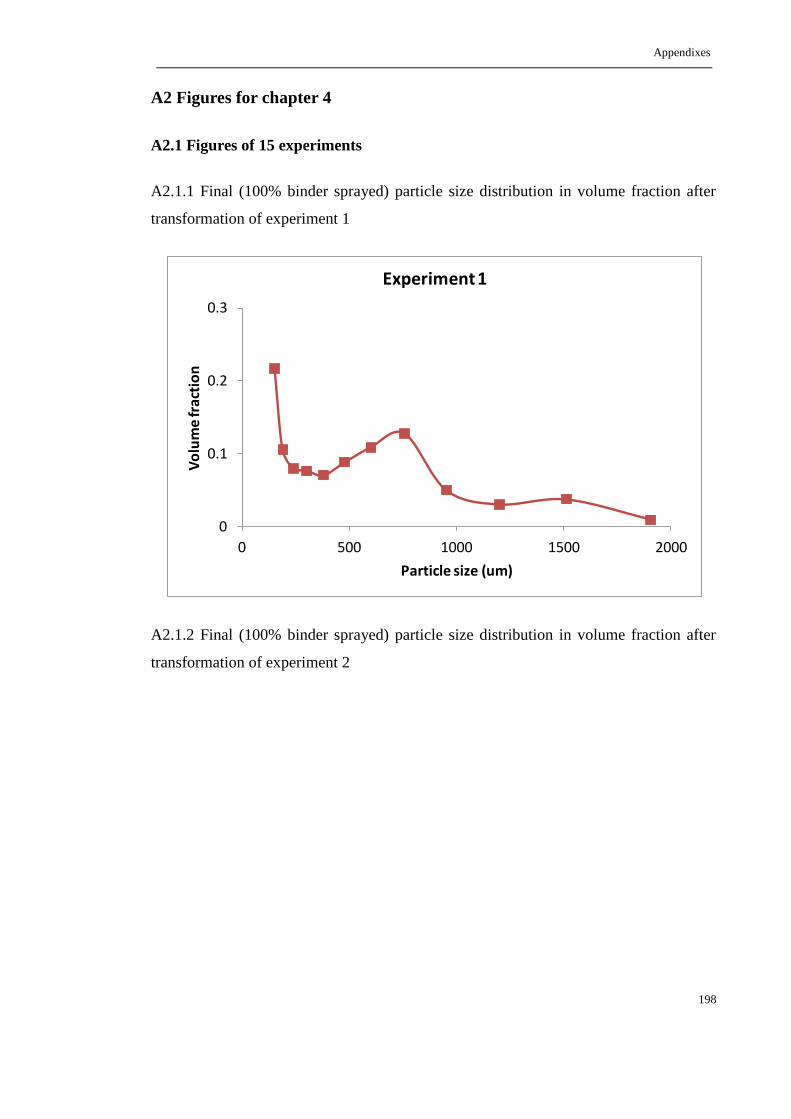
Appendixes
198
A2 Figures for chapter 4
A2.1 Figures of 15 experiments
A2.1.1 Final (100% binder sprayed) particle size distribution in volume fraction after
transformation of experiment 1
A2.1.2 Final (100% binder sprayed) particle size distribution in volume fraction after
transformation of experiment 2
0
0.1
0.2
0.3
0 500 1000 1500 2000
Vo
lum
e fr
acti
on
Particle size (um)
Experiment 1
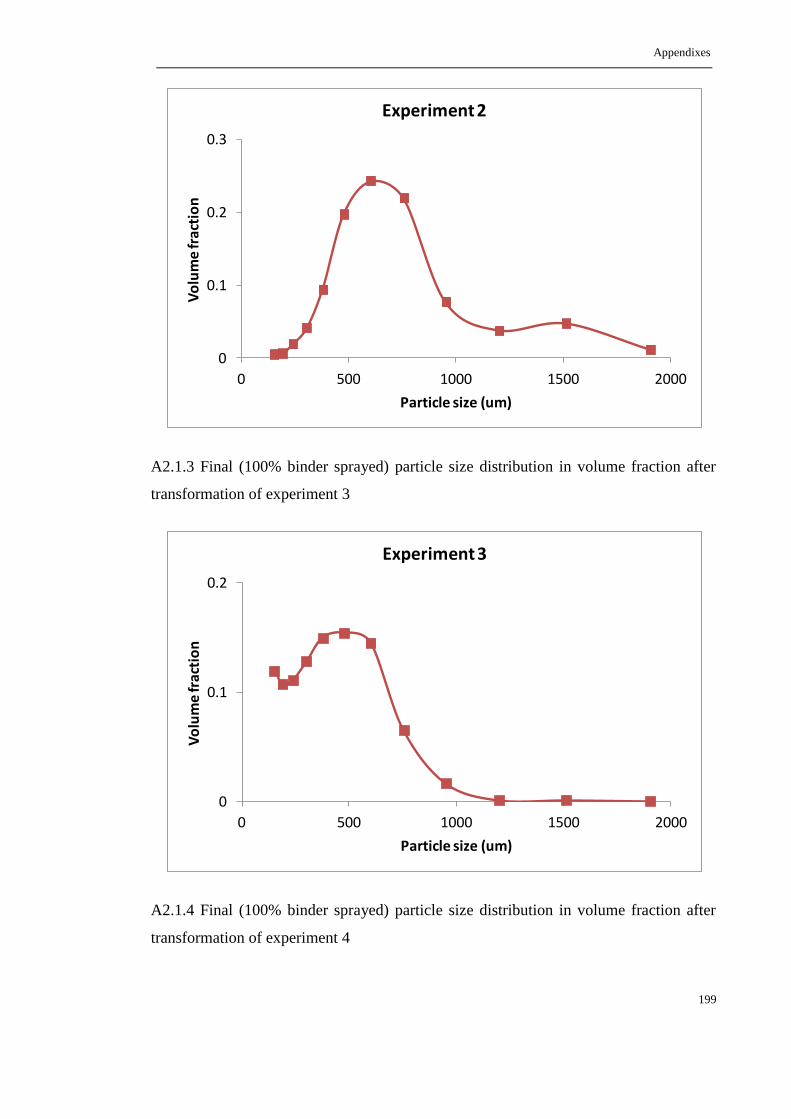
Appendixes
199
A2.1.3 Final (100% binder sprayed) particle size distribution in volume fraction after
transformation of experiment 3
A2.1.4 Final (100% binder sprayed) particle size distribution in volume fraction after
transformation of experiment 4
0
0.1
0.2
0.3
0 500 1000 1500 2000
Vo
lum
e fr
acti
on
Particle size (um)
Experiment 2
0
0.1
0.2
0 500 1000 1500 2000
Vo
lum
e fr
acti
on
Particle size (um)
Experiment 3
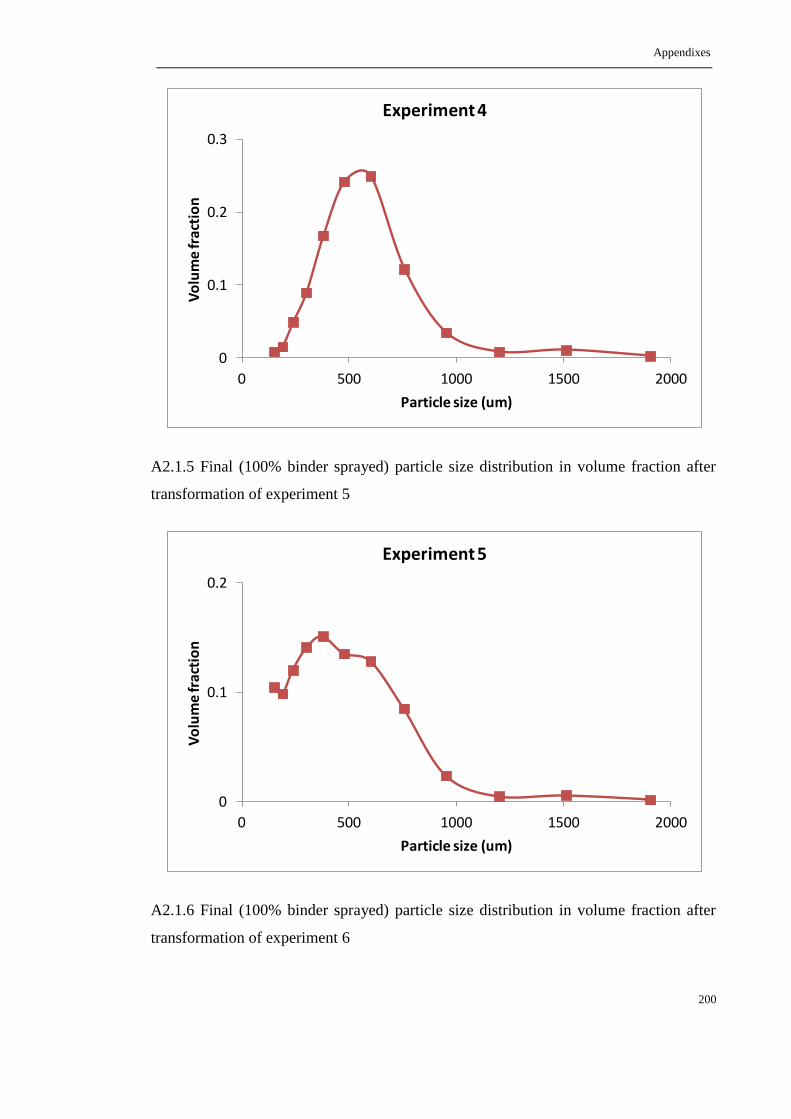
Appendixes
200
A2.1.5 Final (100% binder sprayed) particle size distribution in volume fraction after
transformation of experiment 5
A2.1.6 Final (100% binder sprayed) particle size distribution in volume fraction after
transformation of experiment 6
0
0.1
0.2
0.3
0 500 1000 1500 2000
Vo
lum
e fr
acti
on
Particle size (um)
Experiment 4
0
0.1
0.2
0 500 1000 1500 2000
Vo
lum
e fr
acti
on
Particle size (um)
Experiment 5
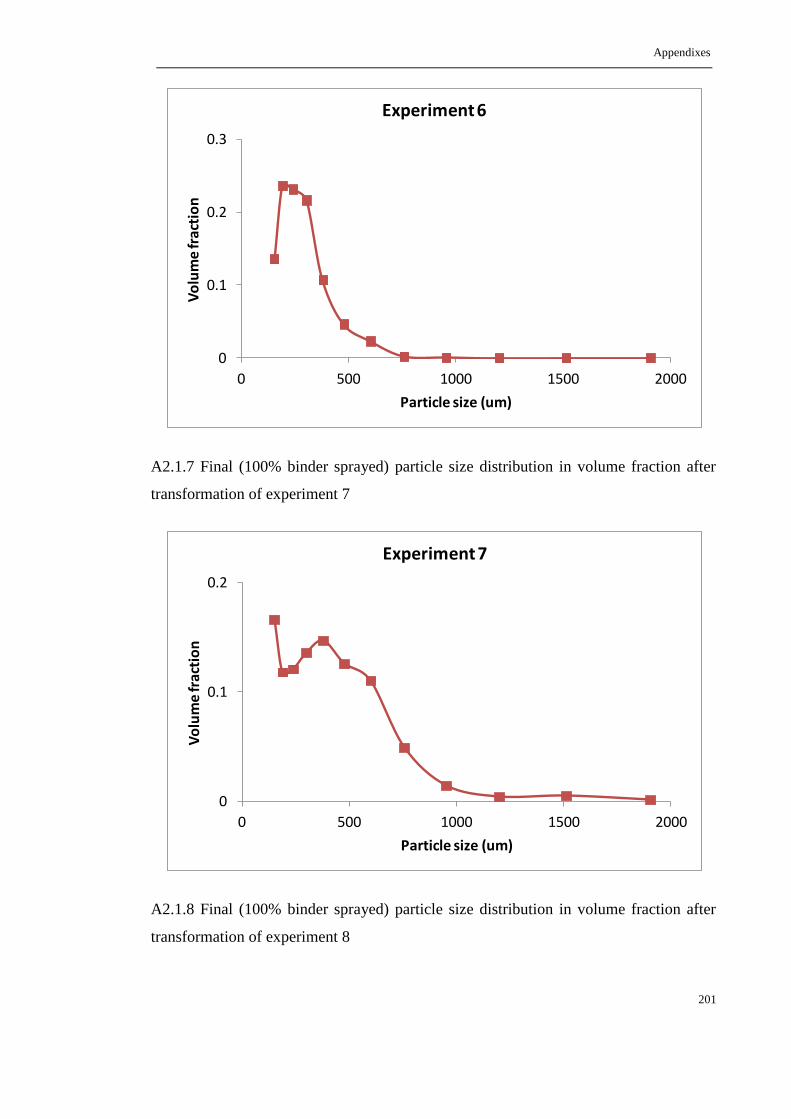
Appendixes
201
A2.1.7 Final (100% binder sprayed) particle size distribution in volume fraction after
transformation of experiment 7
A2.1.8 Final (100% binder sprayed) particle size distribution in volume fraction after
transformation of experiment 8
0
0.1
0.2
0.3
0 500 1000 1500 2000
Vo
lum
e fr
acti
on
Particle size (um)
Experiment 6
0
0.1
0.2
0 500 1000 1500 2000
Vo
lum
e fr
acti
on
Particle size (um)
Experiment 7

Appendixes
202
A2.1.9 Final (100% binder sprayed) particle size distribution in volume fraction after
transformation of experiment 9
A2.1.10 Final (100% binder sprayed) particle size distribution in volume fraction after
transformation of experiment 10
0
0.1
0.2
0 500 1000 1500 2000
Vo
lum
e fr
acti
on
Particle size (um)
Experiment 8
0
0.1
0.2
0 500 1000 1500 2000
Vo
lum
e fr
acti
on
Particle size (um)
Experiment 9

Appendixes
203
A2.1.11 Final (100% binder sprayed) particle size distribution in volume fraction after
transformation of experiment 11
A2.1.12 Final (100% binder sprayed) particle size distribution in volume fraction after
transformation of experiment 12
0
0.1
0.2
0.3
0 500 1000 1500 2000
Vo
lum
e f
ract
ion
Particle size (um)
Experiment 10
0
0.05
0.1
0.15
0.2
0.25
0.3
0 500 1000 1500 2000
Vo
lum
e fr
acti
on
Particle size (um)
Experiment 11
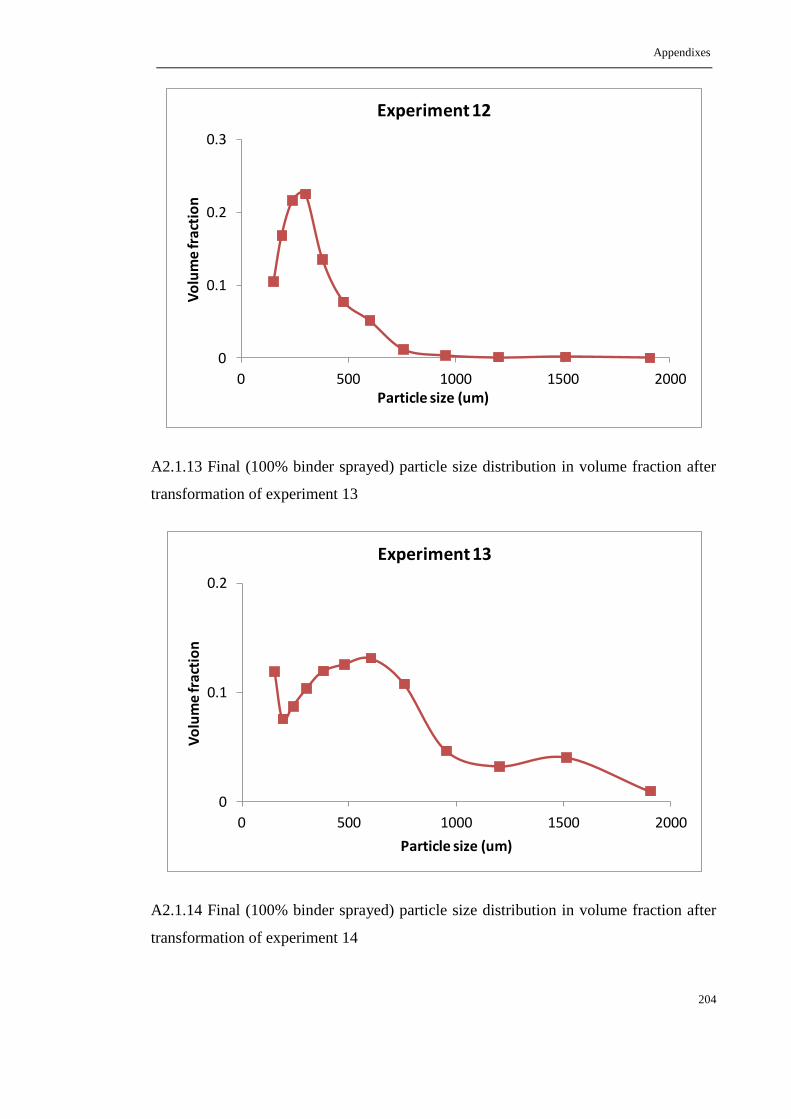
Appendixes
204
A2.1.13 Final (100% binder sprayed) particle size distribution in volume fraction after
transformation of experiment 13
A2.1.14 Final (100% binder sprayed) particle size distribution in volume fraction after
transformation of experiment 14
0
0.1
0.2
0.3
0 500 1000 1500 2000
Vo
lum
e fr
acti
on
Particle size (um)
Experiment 12
0
0.1
0.2
0 500 1000 1500 2000
Vo
lum
e fr
acti
on
Particle size (um)
Experiment 13

Appendixes
205
A2.1.15 Final (100% binder sprayed) particle size distribution in volume fraction after
transformation of experiment 15
A2.2 Figures of validation experiments
A2.2.1 Particle size distribution in volume fraction after transformation at 30%, 70%
0
0.1
0.2
0.3
0.4
0 500 1000 1500 2000
Vo
lum
e fr
acti
on
Particle size (um)
Experiment 14
0
0.1
0.2
0 500 1000 1500 2000
Vo
lum
e fr
acti
on
Particle size (um)
Experiment 15

Appendixes
206
and 100% binder sprayed of validation experiment 2
A2.2.2 Particle size distribution in volume fraction after transformation at 30%, 70%
and 100% binder sprayed of validation experiment 3
0
10
20
30
0 500 1000 1500 2000 2500
Vo
lum
e fr
acti
on
(%)
Particle size (um)
Validation experiment 2
30% sample
70% sample
100% sample
0
10
20
30
40
0 500 1000 1500 2000 2500
Vo
lum
e fr
acti
on
(%
)
Particle size (um)
Validation experiment 3
30% sample
70% sample
100% sample