Embed Size (px)
Citation preview

Model Year 2010 Honda Insight Level-1 Testing Report
Energy Systems Division
ANL/ES/RP-69388
About Argonne National Laboratory Argonne is a U.S. Department of Energy laboratory managed by UChicago Argonne, LLC under contract DE-AC02-06CH11357. The Laboratory’s main facility is outside Chicago, at 9700 South Cass Avenue, Argonne, Illinois 60439. For information about Argonne, see www.anl.gov. Availability of This Report This report is available, at no cost, at http://www.osti.gov/bridge. It is also available on paper to the U.S. Department of Energy and its contractors, for a processing fee, from:
U.S. Department of Energy Office of Scientific and Technical Information P.O. Box 62 Oak Ridge, TN 37831-0062 phone (865) 576-8401 fax (865) 576-5728 [email protected]
Disclaimer This report was prepared as an account of work sponsored by an agency of the United States Government. Neither the United States Government nor any agency thereof, nor UChicago Argonne, LLC, nor any of their employees or officers, makes any warranty, express or implied, or assumes any legal liability or responsibility for the accuracy, completeness, or usefulness of any information, apparatus, product, or process disclosed, or represents that its use would not infringe privately owned rights. Reference herein to any specific commercial product, process, or service by trade name, trademark, manufacturer, or otherwise, does not necessarily constitute or imply its endorsement, recommendation, or favoring by the United States Government or any agency thereof. The views and opinions of document authors expressed herein do not necessarily state or reflect those of the United States Government or any agency thereof, Argonne National Laboratory, or UChicago Argonne, LLC.

ANL/ES/RP-69388
Model Year 2010 Honda Insight
Level-1 Testing Report
9/27/2010
Authors: Eric Rask
Daniel Bocci Michael Duoba
Henning Lohse-Busch
Argonne National Laboratory 9700 South Cass Avenue Argonne ,IL 60439-4815
USA

1 Abstract As a part of the US Department of Energy’s Advanced Vehicle Testing Activity (AVTA), a model year 2010 Honda Insight was procured by eTec (Phoenix, AZ) and sent to ANL’S Advanced Powertrain Research Facility for the purposes of vehicle-level testing in support of the Advanced Vehicle Testing Activity (AVTA). Data was acquired during testing using non-intrusive sensors, vehicle network information, and facilities equipment (emissions and dynamometer data). Standard drive cycles, performance cycles, steady-state cycles and A/C usage cycles were tested. Much of this data is openly available for download in ANL’s Downloadable Dynamometer Database (D3). The major results are shown here in this report. Given the preliminary nature of this assessment, the majority of the testing was done over standard regulatory cycles and seeks to obtain a general overview of how the vehicle performs. These cycles include the US FTP cycle (Urban) and Highway Fuel Economy Test cycle as well as the US06, a more aggressive supplemental regulatory cycle. Data collection for this testing was kept at a fairly high level and includes emissions and fuel measurements from an exhaust emissions bench, high-voltage and accessory current and voltage from a DC power analyzer, and CAN bus data such as engine speed, engine load, and electric machine operation when available. The following sections will seek to explain some of the basic operating characteristics of the MY2010 Insight and provide insight into unique features of its operation and design.
2 Vehicle Description The MY2010 Honda Insight represents one of the more recent hybrid vehicles in Honda’s lineup. The vehicle utilizes an Integrated Motor Assist system (IMA) and a CVT transmission to provide the majority of the fuel economy gains. In contrast to the power-split type systems found in vehicles such as the Toyota Prius, Ford Fusion hybrid, and GM Tahoe Hybrid, this system uses a single, smaller electric machine to provide hybrid functionality. The IMA system is used to provide moderate electric assist, regenerative braking, fuel cut-off operation and idle stop, but the vehicle rarely runs on electric power alone. Vehicle air conditioning is run using accessory power from the engine and thus cannot be run when the engine is at zero speed. The vehicle also provides an Econ mode which adjusts pedal mapping and modifies vehicle behavior, particularly when operating with the air-conditioning active. The following are Honda Insight vehicle specifications according to American Honda Corporation (http://automobiles.honda.com/insight-hybrid/specifications.aspx). Gasoline Engine Drive Type: Front-Wheel Drive Engine type: 1.3L In-line 4 Cylinder Engine with i-VTEC Transmission type: Continuously Variable Transmission (CVT) Peak Horsepower (SAEnet@rpm): 98 @ 5,800 Peak Torque (lb.-ft.@rpm): 123 @ 1,000-1,700

Compression ratio: 10.8:1 Fuel delivery: Multi-Port Electronic Fuel Injection Electric Motor Motor type: Permanent magnet AC synchronous motor Power output: 13 hp (10 kW) @ 1500 rpm Torque: 58 lb.-ft. (78 N•m) Traction Battery Type: Nickel-Metal-Hydride (NiMH) Power Output: 35 hp (26 kW) Voltage: 100.8V Rated Capacity: 5.75 Ahr Mechanical/Performance Front Suspension: MacPherson Strut with Stabilizer Bar Rear Suspension: Torsion-Beam Rear with Stabilizer Bar Steering: Electric Power-Assisted Vehicle Overall height/width/length (in): 56.2/66.7/172.3 Wheelbase(in): 100.4 Tread Width (front/rear in): 58.7/58.1 Curb weight (lb.): 2723 Seating capacity: 5 Passenger volume (cu. ft.): 85 Luggage capacity (cu. ft.): 15.9 Fuel tank (gal.): 10.6 EPA Label Fuel Economy MPG city: 40 MPG highway: 43 MPG combined: 41
3 Vehicle Instrumentation
3.1 Data Acquisition System
Argonne’s chassis dynamometer facility was specifically designed to perform research-oriented testing. Because of this objective, a custom data acquisition and control system was built around the needs for hybrid vehicle testing. The custom design also allows integration with new measurement systems as different vehicles are tested in the lab. All data is collected from the various sources, time-aligned and merged by the Host Computer and saved along with other test information in a 10Hz data file.
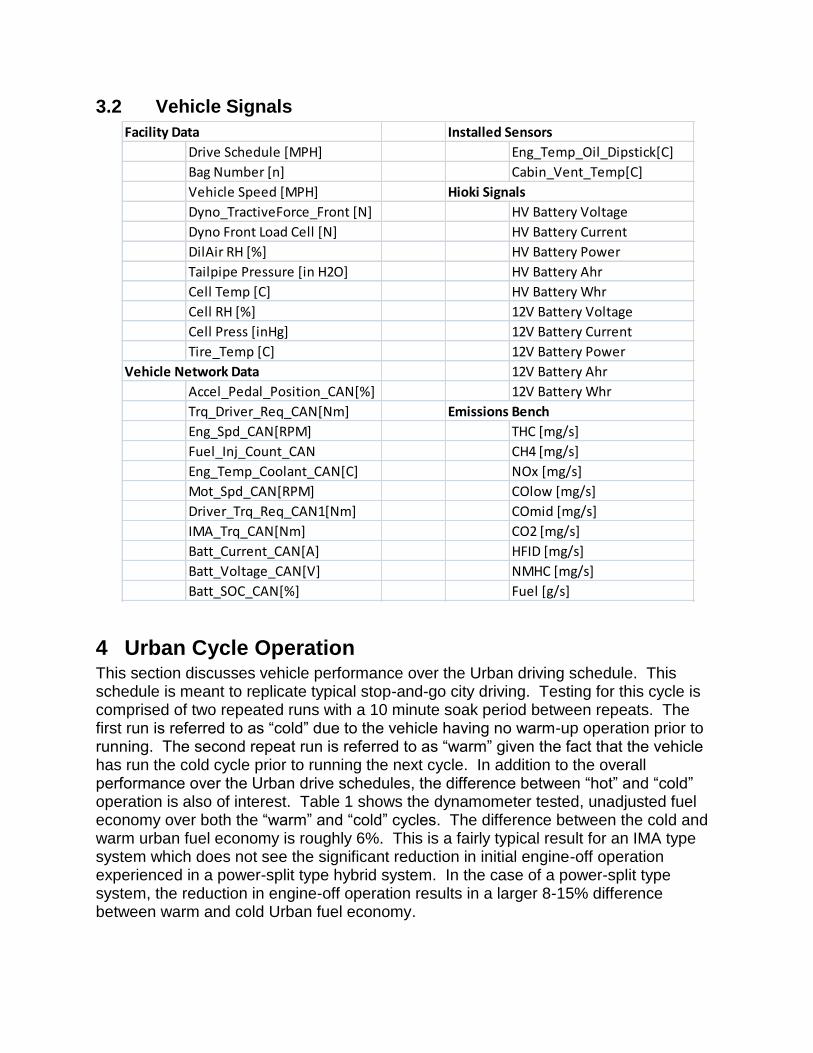
3.2 Vehicle Signals
4 Urban Cycle Operation This section discusses vehicle performance over the Urban driving schedule. This schedule is meant to replicate typical stop-and-go city driving. Testing for this cycle is comprised of two repeated runs with a 10 minute soak period between repeats. The first run is referred to as “cold” due to the vehicle having no warm-up operation prior to running. The second repeat run is referred to as “warm” given the fact that the vehicle has run the cold cycle prior to running the next cycle. In addition to the overall performance over the Urban drive schedules, the difference between “hot” and “cold” operation is also of interest. Table 1 shows the dynamometer tested, unadjusted fuel economy over both the “warm” and “cold” cycles. The difference between the cold and warm urban fuel economy is roughly 6%. This is a fairly typical result for an IMA type system which does not see the significant reduction in initial engine-off operation experienced in a power-split type hybrid system. In the case of a power-split type system, the reduction in engine-off operation results in a larger 8-15% difference between warm and cold Urban fuel economy.
Facility Data Installed Sensors
Drive Schedule [MPH] Eng_Temp_Oil_Dipstick[C]
Bag Number [n] Cabin_Vent_Temp[C]
Vehicle Speed [MPH] Hioki Signals
Dyno_TractiveForce_Front [N] HV Battery Voltage
Dyno Front Load Cell [N] HV Battery Current
DilAir RH [%] HV Battery Power
Tailpipe Pressure [in H2O] HV Battery Ahr
Cell Temp [C] HV Battery Whr
Cell RH [%] 12V Battery Voltage
Cell Press [inHg] 12V Battery Current
Tire_Temp [C] 12V Battery Power
Vehicle Network Data 12V Battery Ahr
Accel_Pedal_Position_CAN[%] 12V Battery Whr
Trq_Driver_Req_CAN[Nm] Emissions Bench
Eng_Spd_CAN[RPM] THC [mg/s]
Fuel_Inj_Count_CAN CH4 [mg/s]
Eng_Temp_Coolant_CAN[C] NOx [mg/s]
Mot_Spd_CAN[RPM] COlow [mg/s]
Driver_Trq_Req_CAN1[Nm] COmid [mg/s]
IMA_Trq_CAN[Nm] CO2 [mg/s]
Batt_Current_CAN[A] HFID [mg/s]
Batt_Voltage_CAN[V] NMHC [mg/s]
Batt_SOC_CAN[%] Fuel [g/s]

Table 1: Tested Urban Fuel Economy
4.1 Engine Operation
Although the Insight does not have significant capability to drive with the engine at zero speed, it does have the ability to operate the engine in fuel cut-off mode during decelerations and limited low-power cruising events. While operating in fuel cut-off mode, the engine is rotating, but no fuel is being provided to the engine. The relatively small difference between warm and cold operation is likely due to Insight’s ability to operate in fuel cut-off mode for both the warm and cold cycles. Following a short vehicle warm-up period, the warm and cold Urban cycles operate very similarly. Table 2 shows the fraction of unfueled engine operation for the warm and cold cycles. As would be expected given the small fuel economy difference, the fraction of unfueled operation time between warm and cold operation is similar. Table 2: Urban Fraction of Unfueled Engine Operation
As can be seen in the time-series plots of engine speed and fuel-rate in Figure 1 and Figure 2 respectively, following the first roughly 100 seconds of cold cycle operation, the vehicle operates very similarly between the cold and warm cycles. This again speaks to the reduced “cold penalty” versus hybrid vehicles with more engine-off capability which leads to longer warm-up times. During the roughly 100 second warm-up period during Cold operation, the vehicle operates the engine at a higher engine speed and fuel rate and reduces the amount of unfueled operation. In contrast, the warm Urban test shows reduced engine speed and some unfueled operation evidenced by near-zero fuel rates in Figure 2.
Figure 1: Urban Cycle Engine Speed
Urban Cold Urban Warm
Unadjusted Fuel Economy (mpg) 51 54
Urban Cold Urban Warm
Unfueled Engine Operation Fraction of Total Time 0.41 0.42

Figure 2: Urban Cycle Fuel Rate
4.2 High Voltage Battery Usage
As with the engine usage, battery usage is also similar between the warm and cold cycles. As can be seen below in Table 3, the peak positive battery power (from battery to powertrain) is slightly higher during the cold cycle, while peak regenerative power (from powertrain to battery) is nearly identical. The slightly higher peak positive power for the cold cycle is due to an engine start that occurs near 200 seconds of the cold cycle operation and appears to use a bit more power than in the warm Urban case. Table 3: Urban Cycle Battery Peak Power
From the detailed battery usage plot in Figure 3 it can also be seen that battery usage between the cold and warm cycles is fairly similar.
Figure 3: Urban Cycle Battery Usage
In addition to measuring battery power, battery State of Charge (SOC) estimates were also taken from the vehicle data bus. Figure 4 shows the SOC versus time for the warm and cold cycles. The maximum SOC swing observed over Urban cycle operation is roughly 11% and is similar for both the warm and cold cycles. On an integrated current basis, the energy swing for both cycles is on the order of 0.35-0.4 A-hr.
Urban Cold Urban Warm
Peak Positive Battery Power (kW) 6.6 5.9
Peak Regen Battery Power (kW) -7.6 -7.4

Figure 4: Urban Cycle State of Charge
5 Highway Cycle Operation This section discusses vehicle operation over the Highway cycle. As its name implies, this cycle is used to evaluate higher-speed, fairly steady-state driving. In contrast to the Urban cycle, only the warm results for this cycle are currently evaluated for regulatory purposes. Table 4 shows the tested fuel economy for this cycle. Table 4: Highway Cycle Fuel Economy
5.1 Engine Operation
As would be expected given the higher vehicle speeds of the Highway cycle, the observed engine speed is higher. Furthermore, at these elevated vehicle speeds, unfueled engine operation is limited and represents roughly 10% of the total operating time. More detailed information regarding engine operation is available in the engine speed and fueling plots of Figure 5 and Figure 6. It is notable that even during the higher speed Highway cycle, the vehicle does display the ability to cut off fueling during decelerations.
Figure 5: Highway Cycle Engine Speed
Hwy Cycle
Unadjusted Fuel Economy (mpg) 61

Figure 6: Highway Cycle Fuel Rate
5.2 High Voltage Battery Usage
During Highway operation, battery usage is fairly minimal with the engine providing the majority of vehicle tractive power. Observed regenerative braking peak power is higher compared to the Urban cycle. Table 5 shows the peak positive and negative power observed during Highway operation. Table 5: Highway Cycle Peak Battery Power
As with the engine data, more detailed, time-series data is provided. Figure 7 and Figure 8 respectively show the battery power and battery state-of-charge over the Highway cycle. As would be expected given the more muted battery use, the maximum SOC swing observed over the Highway cycle is roughly 8% versus 11% for the Urban cycle.
Figure 7: Highway Cycle Battery Power
Hwy Cycle
Peak Positive Battery Power (kW) 5.6
Peak Regen Battery Power (kW) -9.7

Figure 8: Highway Cycle State of Charge
6 US06 Cycle Operation The final regulatory cycle used for this AVTA baseline testing is the US06 cycle. This cycle represents a mix of more aggressive stop-and-go driving and higher speed freeway type driving, at speeds generally higher than the Highway cycle. As with the Highway cycle, only the warm cycle is used for regulatory purposes. Table 6 shows the tested fuel economy over the US06 Cycle. Table 6: US06 Cycle Fuel Economy
6.1 US06 Engine Operation
In a similar manner to the higher-speed Highway engine usage, the Insight shows an increase in engine speed related to the higher vehicle speeds of the US06 cycle. However, even at lower vehicle speeds, the more aggressive driving of the US06 cycle shows much more usage at higher engine speeds due to the need for additional engine power. Due to the stop-and-go nature of certain sections of the cycle, the vehicle still operates the engine unfueled about 28% of the total cycle time. Figure 9 and Figure 10 show more detailed information regarding engine speed and fueling over the US06 cycle. As can be expected with the more aggressive and varying operation, engine speed and fueling show a much greater range of operation.
US06 Cycle
Unadjusted Fuel Economy (mpg) 39

Figure 9: US06 Cycle Engine Speed
Figure 10: US06 Cycle Fuel Rate
6.2 High Voltage Battery Usage
Battery usage over the US06 cycle displays quite a bit of battery assistance and overall shows a higher peak positive power and comparable peak regenerative braking power as compared to the other cycles. Table 7 summarizes the observed peak battery power. The higher peak positive power is due to the US06’s aggressive accelerations, which necessitate fast engine ramp-up and higher-power engine starts Table 7: US06 Peak Battery Power
More detailed information regarding the battery power and state-of-charge is shown in Figure 11 and Figure 12. As mentioned previously, battery power varies much more under these more aggressive conditions. Given this higher range of power use, maximum SOC swing during the US06 cycle is roughly 19%, much larger than the swing observed during Urban and Highway operation.
US06 Cycle
Peak Positive Battery Power (kW) 11.0
Peak Regen Battery Power (kW) -10.7

Figure 11: US06 Battery Power
Figure 12: US06 Battery State of Charge
7 Other Operation In addition to operation over regulatory cycles, this report also provides analysis regarding the Insight’s operation for several additional scenarios. More specifically, this section seeks to discuss the Insight’s behavior over repeated accelerations, operation in Econ mode, and operation with the air-conditioning system activated.
7.1 Repeated Accelerations
For this testing, 9 back-to-back aggressive accelerations were run to assess performance fade, the degradation of performance over repeated aggressive accelerations. Hybrid vehicles typically scale back acceleration performance after a certain number of runs due to battery management issues relating to state-of-charge or thermal management. Figure 13 shows the battery power and vehicle speed over repeated performance cycles for the Insight. From this plot, it can be see that performance stays fairly constant for the first 5 cycles. This consistent performance is due to minimal de-rating of positive battery power. Although the 3rd cycle appears to de-rate battery power, this is suspected to be due to varying driver/vehicle input given the consistent battery usage observed during the 4th and 5th accelerations. Following the 5th acceleration, both the battery assist (positive power) and the regenerative braking power (negative power) are reduced. In fact, it appears that the vehicle lightly

charges the battery during the 6th acceleration given the negative battery power and positive vehicle acceleration. This is a clear case of reducing acceleration performance in order to maintain proper battery conditioning.
Figure 13: Battery Usage for Repeated Accelerations
As mentioned previously, the observed performance fade during these repeated accelerations is typically due to battery management issues. Figure 14 shows the battery SOC during the repeated accelerations. One interesting observation from the data is the jump in battery SOC observed around 450 seconds. This appears to be due to the battery management system recalibrating battery SOC, not a charging event, since there is not a coinciding spike of negative battery power in Figure 13.
Figure 14: Battery SOC over Repeated Accelerations

7.2 Econ Mode Operation
The Insight provides the driver with a selectable Econ mode which primarily changes the accelerator pedal mapping for the vehicle. Using Econ mode over the Urban and US06 cycles, minimal fuel economy change was observed. Figure 15 shows the tested Urban and US06 fuel economy for the Insight while operating in Standard and Econ mode. The observed variation in fuel economy is well within expected test-to-test variation and should be considered negligible.
Figure 15: Normal and Econ Mode Urban Warm and US06 Fuel Economy
Given the nature of pedal remapping, these results are reasonably expected over a prescribed drive trace. Despite this fact, real-world fuel economy is likely to improve when running in Econ mode due to the smoothed accelerator input and the additional effort required to drive the vehicle aggressively. For comparison, Figure 16 shows the pedal position over the Urban cycle for the Standard and Econ modes.
Figure 16: Normal and Econ Mode Pedal Position During Urban Cycle

7.3 Impact of Air Conditioning
In order to assess the impact of air-conditioning on the performance of the Honda Insight’s fuel economy, tests were run with the test cell an elevated temperature while operating the air-conditioning. For this testing, the test-cell temperature was raised to 95F and the Urban and Highway tests were run for a comparative basis to the previously discussed runs without air-conditioning. While air conditioning tests frequently include an additional solar load, this additional load was not included due to test-cell capability limitations. Additionally, the vehicle was run separately in both Normal and Econ mode during the air-conditioning evaluation. During Normal operation, the vehicle does not idle-stop the engine at zero vehicle speed, whereas the vehicle continues to allow idle-stop when the Econ mode is activated. Figure 17 below shows the sizeable impact air-conditioning operation has on vehicle fuel economy. It is worth noting that this number will vary significantly depending on outside temperature and humidity as well as vehicle temperature settings, but these results do help illustrate the large impact air conditioning has on fuel economy. Contrary to the observation in Section 7.2, the Econ mode has a significant fuel economy impact in the case of Urban fuel economy. Allowing for engine-off during vehicle idling significantly reduces the observed penalty for operating the air-conditioning system for the Urban cycle. In contrast, minimal difference between Normal and Econ mode is observed for the Highway cycle given that there are no events with zero vehicle speed.
Figure 17: Fuel Economy Reduction due to Air-Conditioning
When looking at the engine speed and fueling data, the difference in engine speed at standstill related to engine operation can clearly be seen in Figure 18. While the vehicle does not allow for engine-off at idle during Normal operation, decel fuel-cutoff operation is still enabled. Figure 19 shows the measured engine fuel rate for a segment of the Urban Drive Cycle. From this figure, it can be seen that both Econ and Normal fueling rates drop to zero during vehicle decelerations. To summarize operation while air-conditioning is active, the Insight allows for a driver to select between Normal mode which disables engine-off operation during standstill to provide A/C power and Econ
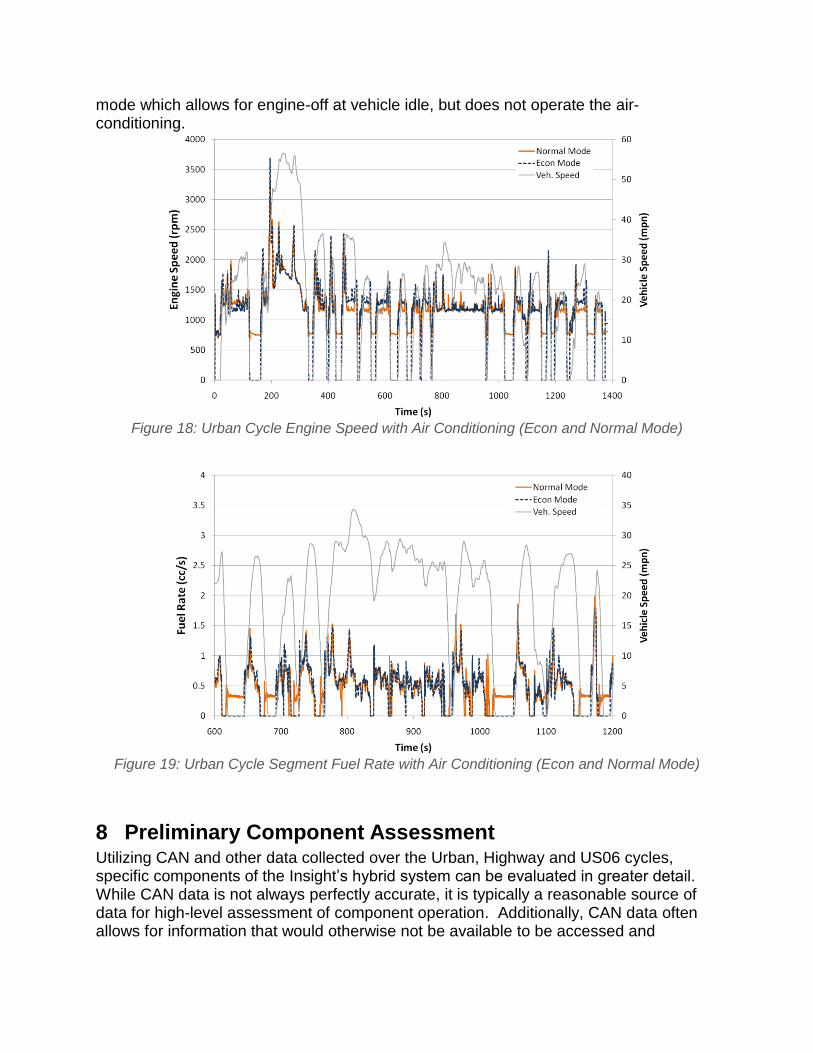
mode which allows for engine-off at vehicle idle, but does not operate the air-conditioning.
Figure 18: Urban Cycle Engine Speed with Air Conditioning (Econ and Normal Mode)
Figure 19: Urban Cycle Segment Fuel Rate with Air Conditioning (Econ and Normal Mode)
8 Preliminary Component Assessment Utilizing CAN and other data collected over the Urban, Highway and US06 cycles, specific components of the Insight’s hybrid system can be evaluated in greater detail. While CAN data is not always perfectly accurate, it is typically a reasonable source of data for high-level assessment of component operation. Additionally, CAN data often allows for information that would otherwise not be available to be accessed and
collected during testing. The following sections seek to discuss some of the major hybrid system components in greater detail.
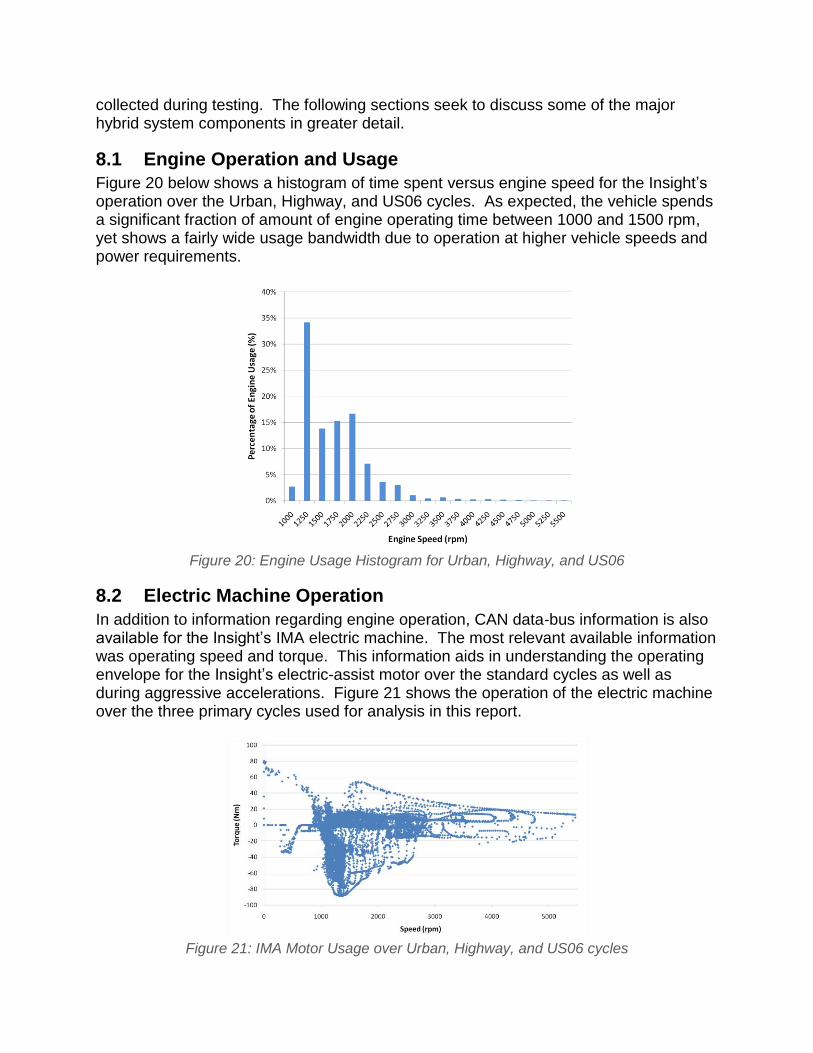
8.1 Engine Operation and Usage
Figure 20 below shows a histogram of time spent versus engine speed for the Insight’s operation over the Urban, Highway, and US06 cycles. As expected, the vehicle spends a significant fraction of amount of engine operating time between 1000 and 1500 rpm, yet shows a fairly wide usage bandwidth due to operation at higher vehicle speeds and power requirements.
Figure 20: Engine Usage Histogram for Urban, Highway, and US06
8.2 Electric Machine Operation
In addition to information regarding engine operation, CAN data-bus information is also available for the Insight’s IMA electric machine. The most relevant available information was operating speed and torque. This information aids in understanding the operating envelope for the Insight’s electric-assist motor over the standard cycles as well as during aggressive accelerations. Figure 21 shows the operation of the electric machine over the three primary cycles used for analysis in this report.
Figure 21: IMA Motor Usage over Urban, Highway, and US06 cycles

In addition to the general operating usage, it is also useful to evaluate the motor’s maximum capability over a range of speeds. During the aggressive acceleration testing, the motor works to provide maximal vehicle tractive effort and thus the motor operation during these maneuvers is useful to understand the peak motor capability. Figure 22 shows the motor operation during the repeated accelerations discussed previously in this report. To help contrast usage during more standard operation, the motor usage over the standard test cycles has also been included in Figure 22. Interestingly, motor operation during the performance cycle and maximal usage seen during the US06 cycle is very similar. This suggests that maximal vehicle performance capability is similar to the capability required to drive the US06 cycle.
Figure 22: Maximum and Typical IMA Motor Usage
8.3 Simple Battery Pack Characterization
Given the high fidelity voltage and current measurements taken during vehicle testing, a basic characterization of the Insight’s high-voltage battery pack can be made. By plotting the measured battery voltage versus the measured current and plotting a best fit line, some basic battery characteristics can be estimated. Figure 23 shows the voltage versus current plot for the Insight over the Urban cycle. Operation over the Highway and US06 cycles is very similar and has been omitted. Observing the slope and offset of the best-fit line, the Insight’s battery pack has an observed resistance of roughly 0.17 Ohms and an observed nominal pack voltage of 114 Volts. It should be noted that the spread observed from the best-fit line represents dynamics other than the basic Voltage = Current x Resistance relationship. Although more accurate dynamic estimates are possible, they will likely not deviate significantly from the basic estimates shown in Figure 23 for most standard operating scenarios.
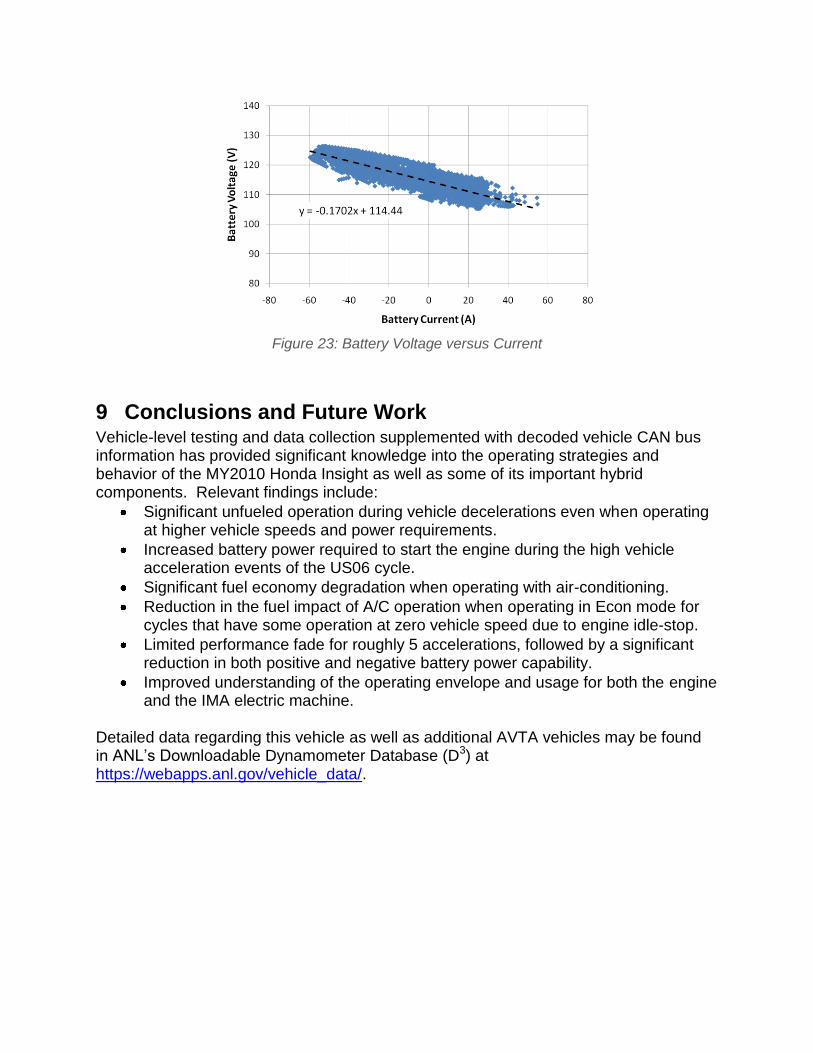
Figure 23: Battery Voltage versus Current
9 Conclusions and Future Work Vehicle-level testing and data collection supplemented with decoded vehicle CAN bus information has provided significant knowledge into the operating strategies and behavior of the MY2010 Honda Insight as well as some of its important hybrid components. Relevant findings include:
Significant unfueled operation during vehicle decelerations even when operating at higher vehicle speeds and power requirements.
Increased battery power required to start the engine during the high vehicle acceleration events of the US06 cycle.
Significant fuel economy degradation when operating with air-conditioning.
Reduction in the fuel impact of A/C operation when operating in Econ mode for cycles that have some operation at zero vehicle speed due to engine idle-stop.
Limited performance fade for roughly 5 accelerations, followed by a significant reduction in both positive and negative battery power capability.
Improved understanding of the operating envelope and usage for both the engine and the IMA electric machine.
Detailed data regarding this vehicle as well as additional AVTA vehicles may be found in ANL’s Downloadable Dynamometer Database (D3) at https://webapps.anl.gov/vehicle_data/.

Energy Systems Division Argonne National Laboratory 9700 South Cass Avenue, Bldg. 362 Argonne, IL 60439-4815 www.anl.gov
Argonne National Laboratory is a U.S. Department of Energy laboratory managed by UChicago Argonne, LLC