Embed Size (px)
Citation preview
Model Surface Pressure Instrumentation for a Hypersonic Shock TunnelRichard C. Jenkins and Harold B. Hopkins Citation: Review of Scientific Instruments 35, 1684 (1964); doi: 10.1063/1.1719256 View online: http://dx.doi.org/10.1063/1.1719256 View Table of Contents: http://scitation.aip.org/content/aip/journal/rsi/35/12?ver=pdfcov Published by the AIP Publishing Articles you may be interested in Modeling of the plasma generated in a rarefied hypersonic shock layer Phys. Fluids 22, 106101 (2010); 10.1063/1.3500680 New Hypersonic Shock Tunnel at the Laboratory of Aerothermodynamics and Hypersonics Prof. Henry T.Nagamatsu AIP Conf. Proc. 997, 173 (2008); 10.1063/1.2931888 Condensation shocks in hypersonic nitrogen tunnels AIP Conf. Proc. 208, 784 (1990); 10.1063/1.39469 Combustion Investigation in the Hypersonic Shock Tunnel Driver Section J. Appl. Phys. 30, 1018 (1959); 10.1063/1.1776974 Estimate of the Generation of Fluctuating Surface Pressures on Hypersonic Vehicles J. Acoust. Soc. Am. 30, 680 (1958); 10.1121/1.1929996
This article is copyrighted as indicated in the article. Reuse of AIP content is subject to the terms at: http://scitationnew.aip.org/termsconditions. Downloaded to IP:
146.189.194.69 On: Sun, 21 Dec 2014 22:19:06
THE REVIEW OF SCIE~TIFIC INSTRUMENTS VOLUME 35, NUMBER 12 DECEMBER 1964
Model Surface Pressure Instrumentation for a Hypersonic Shock Tunnel
RICHARD C. JENKINS AND HAROLD B. HOPKINS
Research Department, Grumman Aircraft, Bethpage, New York
(Received 1 June 1964; and in final form, 31 August 1964)
The design and construction of piezoelectric pressure transducers to meet model surface pressure instrumentation requirements for the Grumman Research hypersonic shock tunnel are described. An accurate method for calibrating the gauges is given. The gauge response to calibration pressures and to pressures measured in the tunnel is analyzed to account for the relatively short time constant of this system.
I. INTRODUCTION
T HE measurement of model surface pressures in a hypersonic shock tunnel consists of accurately de
termining local step changes in pressure. These changes frequently are less than 0.01 psi. Because pressures remain constant or vary slowly during the 2- to 4-msec test time available in a hypersonic shock tunnel, measurement response time of less than 1 msec is necessary. This fast response time can be obtained by locating a miniaturized pressure transducer in the model close to each desired measuring point and photographing the oscilloscope trace of the transducer output. Piezoelectric crystals have the necessary sensitivity and frequency response for this work but are sensitive to acceleration as well as pressure. Double crystal gauges reduce acceleration output but require a preamp with differential input.
Martin, Duryea, and Stevensonl describe a pressure measurement system in which the crystal circuit time constant is long enough to ignore the effects of charge decay during the measurement time and to allow the use of quasisteady transducer calibration techniques. However, this is an expensive solution if multiple simultaneous measurements are required. A low cost system having the capability of measuring 20 pressures simultaneously was developed using Grumman-designed pressure gauges and Tektronix type 122 preamps modified by an order-ofmagnitude increase in input resistance. The choice of an ac-coupled preamp such as the type 122 required the development of a dynamic calibration technique.
A short input circuit time constant can lead to error because of charge decay during the measurement time. An analysis of gauge response is presented to provide techniques and correction factors which essentially eliminate errors in calibration and measurement due to the short time constant. The resulting system was found capable of producing accuracy in surface pressure measurement better than 5% under the most adverse conditions. A more detailed description of the gauge development program may be found in a Grumman Research Department report.2
1 J. F. Martin, G. R. Duryea, and L. M. Stevenson, Paper presented at the Second Symposium on Hypervelocity Techniques, March 1962.
2 R. C. Jenkins and H. B. Hopkins, "Development of Improved Pressure Transducers and Transducer Calibration Techniques for
1684
II. DESCRIPTION OF GAUGES
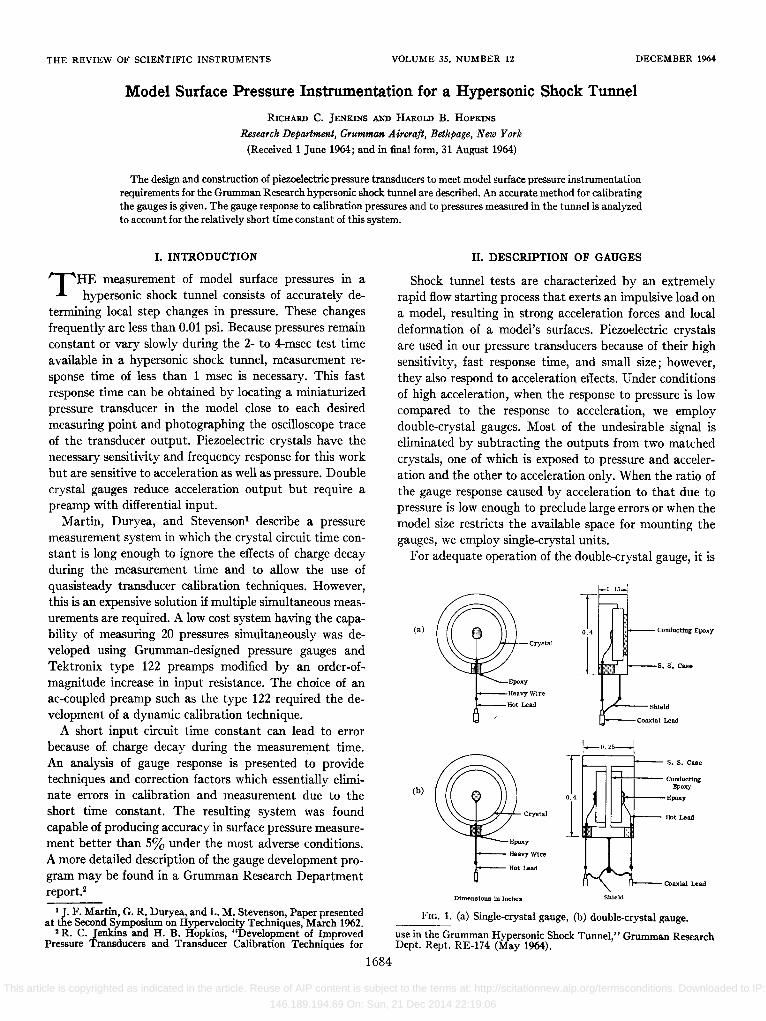
Shock tunnel tests are characterized by an extremely rapid flow starting process that exerts an impulsive load on a model, resulting in strong acceleration forces and local deformation of a model's surfaces. Piezoelectric crystals are used in our pressure transducers because of their high sensitivity, fast response time, and small size; however, they also respond to acceleration effects. Under conditions of high acceleration, when the response to pressure is low compared to the response to acceleration, we employ double-crystal gauges. Most of the undesirable signal is eliminated by subtracting the outputs from two matched crystals, one of which is exposed to pressure and acceleration and the other to acceleration only. When the ratio of the gauge response caused by acceleration to that due to pressure is low enough to preclude large errors or when the model size restricts the available space for mounting the gauges, we employ single-crystal units.
For adequate operation of the double-crystal gauge, it is
f-O. 15..1
(a) Conducting Epoxy
S. s. Case
"---Shleld
Coaxial Lead
S. S. Case
1-+-+-- Conducting
(b) Epoxy
It-+--Epoxy
IIotLead
Hot Lead
Coaxial Lead
Dimensions in Inches Shield
FIG. 1. (a) Single-crystal gauge, (b) double-crystal gauge.
use in the Grumman Hypersonic Shock Tunnel," Grumman Research Dept. Rept. RE-174 (May 1964).
This article is copyrighted as indicated in the article. Reuse of AIP content is subject to the terms at: http://scitationnew.aip.org/termsconditions. Downloaded to IP:
146.189.194.69 On: Sun, 21 Dec 2014 22:19:06
PRESSURE INSTRUMENTATION 1685
necessary that both crystals respond to acceleration with signals that have the same shape and phase. This is accomplished by choosing two crystals with roughly equal masses and resonant frequencies and mounting them in the gauge as symmetrically as possible. We have found that the acceleration crystal also responds to a pure pressure pulse, apparently because of stresses induced in the mounting web. This output does not distort the linearity of the calibration and the polarity of this output is such that it increases the gauge sensitivity.
The two types of gauges presently in use are illustrated in Fig. 1. Both make use of a O.25-in.-diameter, O.05-in.thick lead zirconate crystal which has a resonant frequency of approximately 320 kc. One side of the crystal is attached to the stainless steel case by electrically conducting epoxy. A fine wire attached to the other surface of the crystal passes through the side wall of the case. The cavities in which the crystals are mounted are filled with Eccobond 26 epoxy (manufactured by Emerson and Cuming, Inc., Canton, Massachusetts) to protect the crystals from hot test gases, rough handling, and changes in humidity that
Orifice
Plastic Tab ---=r!d,!:.--.-.....!r!3=>
).tounting Screw
FIG. 2. Sketch showing gauge mounted in model.
cause variations in sensitivity. An electrically conducting silver paint is applied over the epoxy to shield the crystals from effects of static charge close to the gauge. The nominal sensitivity is 60 mV /psi for the single-crystal gauge and 80 m V /psi for the double-crystal gauge.
The gauges are held in place over a cavity and orifice in the inner surface of the model wall by plastic tabs and metal screws, with the tabs bearing on the case as shown in Fig. 2. A O.Ol-in-thick, soft rubber washer between the gauge and cavity provides a pressure seal and acts as a shock mounting. The double-crystal gauge can be run with either side exposed to pressure, the polarity of the output heing determined by which side is chosen to measure pressure.
III. CALmRATION METHODS
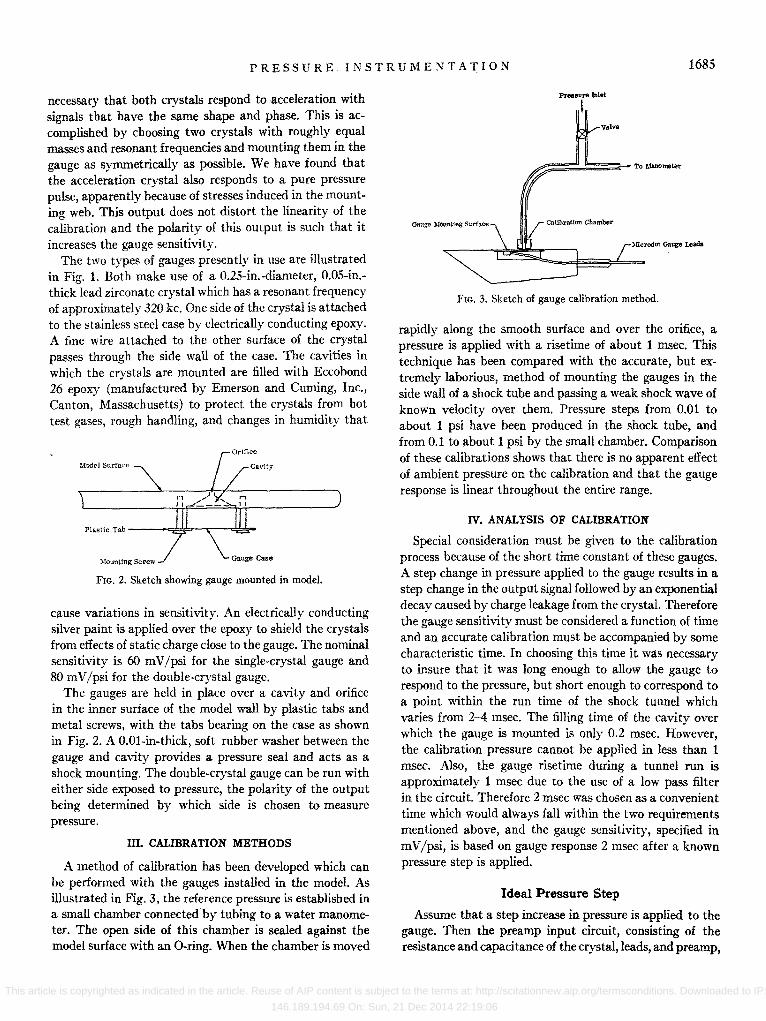
A method of calibration has been developed which Can be performed with the gauges installed in the model. As illustrated in Fig. 3, the reference pressure is established in a small chamber connected by tubing to a. water manometer. The open side of this chamber is sealed against the model surface with an O-ring. When the chamber is moved
Press.'" Inlet
1 Valve
~Ucrodot Gauge Leads
FIG. 3. Sketch of gauge calibration method.
rapidly along the smooth surface and over the orifice, a pressure is applied with a rise time of about 1 msec. This technique has been compared with the accurate, but extremely laborious, method of mounting the gauges in the side wall of a shock tube and passing a weak shock wave of known velocity over them. Pressure steps from 0.01 to about 1 psi have been produced in the shock tube, and from 0.1 to about 1 psi by the small chamber. Comparison of these calibrations shows that there is no apparent effect of ambient pressure on the calibration and that the gauge response is linear throughout the entire range.
IV. ANALYSIS OF CALIBRATION
Special consideration must be given to the calibration process because of the short time constant of these gauges. A step change in pressure applied to the gauge results in a step change in the output signal followed by an exponential decay caused by charge leakage from the crystal. Therefore the gauge sensitivity must be considered a function of time and an accurate calibration must be accompanied by some characteristic time. In choosing this time it was necessary to insure that it was long enough to allow the gauge to respond to the pressure, but short enough to correspond to a point within the run time of the shock tunnel which varies from 2-4 msec. The filling time of the cavity over which the gauge is mounted is only 0.2 msec. However, the calibration pressure cannot be applied in less than 1 msec. Also, the gauge risetime during a tunnel run is approximately 1 msec due to the use of a low pass filter in the circuit. Therefore 2 msec was chosen as a convenient time which would always fall within the two requirements mentioned above, and the gauge sensitivity, specified in m V /psi, is based on gauge response 2 msec after a known pressure step is applied.
Ideal Pressure Step
Assume that a step increase in pressure is applied to the gauge. Then the preamp input circuit, consisting of the resistance and capacitance of the crystal, leads, and preamp,
This article is copyrighted as indicated in the article. Reuse of AIP content is subject to the terms at: http://scitationnew.aip.org/termsconditions. Downloaded to IP:
146.189.194.69 On: Sun, 21 Dec 2014 22:19:06

1686 R. C. JENKINS AND H. B. HOPKINS
can be considered a simple resistance-capacitance circuit which is charged by crystal output. For a constant pressure applied instantaneously, the current in the circuit must equal the rate of decay of crystal charge, and the voltage V across the crystal as a function of time satisfies the (al
equation (1)
where Vo represents the voltage across the gauge at the t = ° and C is the sum of crystal capacitance, lead capacitance, and preamp input capacitance. R is given by (ReRp)/(Rc+Rp)~Rp, where Rc is the dc electrical resistance across the crystal, Rp is the preamp input resistance, and Rc»Rp •
Assume that a gauge sensitivity 51 (mY/psi) is obtained from a voltage measurement at /= t1 msec after application of a known pressure step. From Eq. (1) one can define the theoretical sensitivity 50 at t=O as
50=Sle- c"IRC).
For example, So= 1.051S1, for representative values of RC=40 msec and 11=2 msec. Note that the quantity So is a constant for any given gauge.
Slowly Rising Pressure
The previous analysis is based on the assumption that the pressure step takes place over a period of time which is negligible compared to the gauge time constant. Since this condition cannot be held with the manometer calibration, the effect of a slow pressure rise on the calibration must be considered. Suppose that the pressure increases linearly from some arbitrary constant value. Because charge is continually produced on the crystal surfaces as the pressure increases, Eq. (1) no longer applies.
If the rate of pressure increase is a constant (dp/dt=a) and So is the gauge sensitivity in mY/psi evaluated at t=O, the governing equation is
RC(dV /dt) + V=RCSoa, (2)
where (RCSoa) is a constant. The general solution is
V = Voe-(t l RC)+ RCSoa[l- e-(t/ RC)]. (3)
Applying the initial condition that V =O:when t=O, one obtains the relation
V=RC50a[1-e(tIRC)J, (4)
for the voltage output due to a linearly increasing pressure. Figure 4(a) is an oscilloscope photograph showing gauge
response to identical calibration pressures applied at different rates. Note that the level of the exponential portion of the trace depends on how rapidly the pressure is applied. Figure 4(b) is a sketch of one of these traces with a dashed curve to represent a trace that would be obtained if an instantaneous pressure step could be applied. The dashed curve represents the calibration response desired since it
v
r (b)
-- --t::.:--_ I ~~:--.--
I -I , I I I
FIG. 4. (a) Oscilloscope traces, showing gauge response (sweep speed 1 msec/cm left to right), (b) sketch of oscilloscope trace.
is closely approximated by the rapid pressure rise encountered during shock tunnel tests. It is shown below that to a good approximation the solid curve is brought into alignment with the dashed curve by shifting it a distance T /2 along the t axis, where T represents the time required to apply the pressure step.
The dashed curve can be represented by Eq. (1), and during the period of pressure rise (t< T), the solid curve is given by Eq. (4). During the period of constant pressure which follows the pressure rise (t> T), the solid curve is described by a general exponential relation of the form
V s=RCSoa[l-e-(TIRC)]e-(TIRC),
where T is a new variable chosen such that the abscissa of the solid curve is shifted to bring its exponential portion into alignment with the dashed curve. If we choose T= [t- T /2)J, this expression becomes
V s=RCSoae-(tIRCl[eTI2RC-e-CTI2RC)].
Using the series expansions for eCT/2RC) and e-(TI2RC) and neglecting terms greater than second order in T /2RC, one obtains
Vs=SoaTe-(tIRC), when t>T.
Since Vo=SoaT, the exponential portion of the solid curve represents the dashed curve to second order but is shifted to the right along the t axis a distance T/2.
In practice this means that for a given calibration trace one chooses time t=O at a point midway along the pressure rise. Measurements made on the exponential portion of the
This article is copyrighted as indicated in the article. Reuse of AIP content is subject to the terms at: http://scitationnew.aip.org/termsconditions. Downloaded to IP:
146.189.194.69 On: Sun, 21 Dec 2014 22:19:06

PRESSURE INSTRUMENTATION 1687
trace will yield a valid calibration as long as they are referenced to this point on the t axis. This procedure has been checked with pressure risetimes as long as 5 msec and found to yield calibrations which were independent of risetime.
The use of this calibration method rather than the shock tube was decided upon primarily because of convenience, but it has proven to yield greater accuracy also. Using a manometer to measure the reference pressure, one can ob· tain the gauge sensitivity to within 3%.
V. ANALYSIS OF TUNNEL RUNS
Models tested in the shock tunnel, such as that sketched in Fig. 3, are cantilevered from a support "sting" which carries instrumentation leads out of the test section to the preamps. This support sting is designed to allow movement of the model through a range of angles of attack. The magnitude of acceleration disturbances on a given gauge depends on gauge location, angle of attack, and model shape. These disturbances cover a wide range of frequencies and are caused by model movement, surface distortion, and vibrations transmitted through the sting.
High frequency disturbances can be reduced considerably by the use of low pass filters in the preamp output. Although filtering does not affect the gauge calibrations, it does increase signal response time. Disturbances with frequencies lower than roughly 1000 cps cannot be filtered effectively without producing a signal response time that is of the same order as the shock tunnel testing time. These lower frequency disturbances produce an uncertainty in pressure measurement and must be either eliminated or measured.
Pressure measurements made by single-crystal gauges on surfaces which are almost parallel to the flow show a relatively high acceleration output. The magnitude of this output can be observed by making two consecutive runs at the same conditions, the second run being made with the model orifices covered with Mylar tape. Provided that the runs are identical, the surface pressure can be obtained by subtracting corresponding gauge outputs obtained during the two runs. On models having sufficient room inside, a considerable portion of the acceleration signal can be eliminated by using the double-crystal gauges and a single run is usually sufficient.
Figure 5 shows oscilloscope traces of the output from two double-crystal gauges which were installed in a flat plate with a wedge leading edge. In Fig. Sea) the gauges are responding to pressure and acceleration, and in Fig. S (b) to acceleration only. Note that low pass filters have increased the signal response time from roughly 0.2 to over 1 msec.
Also note from Fig. S that the surface pressure was not constant after the nozzle started but increased slowly throughout the run. This situation is sometimes encoun-
(al
(b)
FIG. 5. Oscilloscope traces showing model surface pressures and accelerations from two transducers. (Test section nominal Mach number 13; model angle of attack 50; positive pressure up for bottom trace, down for top trace; sweep speed 1 msec/cm left to right.) (al Measurement of pressure and acceleration with orifices open, (b) measurement of acceleration only with orifices closed.
tered during shock tunnel operation and is a result of changes in the nozzle stagnation conditions. In order to obtain useful data from this type of test, one must be able to determine the pressure as a function of time from the gauge output. For the usual case of constant test section pressure, the procedure followed is to measure the output signal level 2 msec after the flow starts and use the gauge calibration obtained 2 msec from the midpoint of the calibration pressure rise as described previously. If this same procedure is followed when the test section pressure is rising, one will calculate a pressure which is somewhat higher than the actual pressure.
To determine the magnitude of this error, assume that a pressure step po is followed by a linear increase in pressure. Let VI be the magnitude of the gauge output at time /1
after the initial pressure step. Following the procedure used for constant test section pressure, one would obtain an erroneous pressure PI' at time /1 from a measurement of VI and the relation
(5)
The true pressure can be obtained from the solution of the differential equation which was developed to analyze the calibration process. Using the initial condition
Vo=Sopo
This article is copyrighted as indicated in the article. Reuse of AIP content is subject to the terms at: http://scitationnew.aip.org/termsconditions. Downloaded to IP:
146.189.194.69 On: Sun, 21 Dec 2014 22:19:06
1688 R. C. JENKINS AND H. B. HOPKINS
in Eq. (3), we find
VI = Sopoe(tl/RC)+ RCSoa[1-e-(t1/RC)].
Substituting pO=pl-atl
and dropping terms which are greater than second order in tllRC, we obtain
P l= (Vt!So)[e(tl/RC)]-atl[(tl/2RC)+WI6R2C2)]. (6)
Comparison of Eqs. (5) and (6) yields an expression for the error in PI'. Again retaining only second-order terms,
Pl' - PI (tl/2RC) + (tN6R2C2)
PI (pol atl)+ 1
For most shock tunnel runs this error is less than 2%.
THE REVIEW OF SCIENTIFIC INSTRUMENTS
In view of the accuracy obtainable in the calibration, the over-all accuracy in surface pressure measurement should always be within 5%. The most critical conditions occur when high impulse loads require that a second run be made to evaluate acceleration output. When two tunnel runs are required, unavoidable differences in test section conditions can be offset partially by reducing the data to coefficient form before subtracting the acceleration signal.
ACKNOWLEDGMENTS
The authors wish to express their gratitude to Thomas Lacinski of Grumman for assistance in the experimental work, and Richard A. Scheuing under whose direction the over-all program was conducted.
VOLUME 35. NUMBER 12 DECEMBER 1964
Simple Display System for Recording Time-Resolved Mass Spectra
KENNETH A. LlNCOLN
U. S. Naval Radiological Defense Laboratory, San Francisco, California 94135
(Received 6 August 1964; and in final form, 3 September 1964)
An uncomplicated photographic readout for recording rapidly changing mass spectra (of the order of milliseconds) generated by a time-of-flight instrument is achieved by a combination of two oscilloscopes equipped with Polaroid Land cameras. One of the oscilloscopes is operated by established techniques to display, quantitatively, peak height versus time for anyone of the preselected mass peaks. Simultaneously, the second oscilloscope in the system displays a raster presentation of approximate peak height of all peaks in the spectrum as a function of time. In the latter case, the discrete m/e values are displayed on the horizontal axis as dots and the magnitude of the ion peaks is displayed qualitatively by z-axis modulation (intensification of the dots), while time is presented as the trace is displaced vertically by a raster voltage which is synchronized with the time base of the first 'scope. The z-axis circuitry has been employed to further advantage by applying it to the monitoring oscilloscope during the customary time-of-flight spectral presentation (ion-peak height versus m/e) to intensify all the peaks of the oscilloscopic display, thus enhancing visual observation and photographic recording for all operations of the mass spectrometer.
INTRODUCTION
THE time-of-flight mass spectrometer with its ability to present ten or twenty thousand or more mass
spectra per second lends itself quite well to the study of many types of fast reactions. However, a formidable problem often encountered is the complexity of the auxiliary equipment which is required to record all information available in the short interval of time. Most mass spectrometrists facing this situation have employed high speed drum cameras to photograph the rapidly changing spectral patterns displayed on an oscilloscope.1-3 This paper describes the convenient system we have devised at NRDL to record essentially the same information by employing
1 G. B. Kistiakowsky and P. H. Kydd, J. Am. Chern. Soc. 79, 4825 (1957).
2 J. N. Bradley and G. B. Kistiakowsky, J. Chern. Phys. 35, 256 (1961).
3 R. T. Meyer, Rev. Sci. lnstr. 35, 1064 (1964).
one or two oscilloscopes and a still camera. Two techniques utilizing the same equipment for recording rapid changes in mass spectra are presented. The first yields for each event one oscillogram showing, qualitatively, the height of mass peaks as a function of time for the entire spectrum. In addition, one or more accompanying oscillograms showing, quantitatively, intensity versus time for any preselected mass peaks are available. The second technique produces a single oscillogram showing, quantitatively, the height of mass peaks for the whole spectrum versus time for a limited number of spectrometer cycles. Thus, in both cases, it may be counted among the advantages that the information is available on a small number of Polaroid prints instead of several feet of movie film, and no special short-persistency CRT phosphors are required for this photography. Lack of complexity is, perhaps, the most important feature of the system; no special equipment need
This article is copyrighted as indicated in the article. Reuse of AIP content is subject to the terms at: http://scitationnew.aip.org/termsconditions. Downloaded to IP:
146.189.194.69 On: Sun, 21 Dec 2014 22:19:06