Embed Size (px)
Citation preview

154 TRANSPORTATION RESEARCH RECORD 1307
Model of Slab Cracking for Portland Cement Concrete Pavements
M. POBLETE, P. CEZA, J. DAVID, R. ESPINOSA, A. GARciA, AND
J. GONZALEZ
A predictive model of slab cracking has been developed by considering the actual behavior of Chile's portland cement concrete (PCC) pavements. The approach used is mechanistic-empirical and is based on a structural modeling of the jointed pavement using a finite elements program. The model incorporates realistic boundary conditions of upward concave slabs under yearly cyclic moisture warping and daily cyclic temperature curling, obtained from measurements in the climatic zone of central Chile. Fatigue consumption in the slabs was evaluated for the actual traffic loads passing during each group of hours in each season to determine the different levels of upward concavities. The accumulated fatigue consumption of all pavements was calculated and plotted against the percentage of cracked slabs observed in the field. The resulting model is a unique S-shaped curve that is useful for indicating the effect of many design variables on cracking.
The National Highway Administration of Chile has been engaged in implementing a pavement management system to efficiently administer the financial resources annually allocated to rehabilitation. In order to prepare and evaluate its maintenance and rehabilitation programs, Chile is attempting to use the Highway Design and Maintenance Standards Model (HDM) (J) developed by the World Bank, which includes distress models obtained from research in several countries and covers diverse environments, traffic conditions, and types of asphalt roads. Until recently, no specific applications of distress modeling were developed for rigid pavements.
A previous effort in the development of distress equations for rigid pavements is the COPES empirical approach, developed in the United States at the University of Illinois (2). The results of that approach evidently represent the characteristic environmental and design conditions of U.S. contributing data. In the Chilean case the results of extensive research (3-6) are showing that the actual behavior of in-service pavements seems to differ in some important ways; therefore, the development of appropriate distress models for the Chilean climate has been undertaken. The approach is mechanistic-empirical and is based on a structural modeling of the pavement using a finite element program especially developed to incorporate realistic boundary conditions as observed in the field (7).
This research was conducted by the University of Chile. Precise measurements were carried out periodically on 21 test sections established along the primary highway network (8) . These pavements have joints spaced between 3.5 and 5.0 m
Facultad de Ciencias Fisicas y Matematicas, Insituto de Investigaciones y Ensayes de Materiales , Universidad de Chile, Plaza Ercilla 883, Casillia 1420, Santiago. Chile.
apart, with no dowels. The 0.20- to 0.26-m-thick slabs are supported on granular and cement-treated bases that were mostly reconstructed on old portland cement concrete (PCC) and asphalt concrete (AC) pavements. Shoulders consist of compacted granular material topped with an asphalt surface treatment. Considered as a whole, over 75 percent of the 21 test section pavements are performing satisfactorily after 6 to 12 years of heavy in-service traffic. However, some sections are developing premature cracking, as shown in Figure 1. No significant roughness has yet been measured.
OBSERVED BEHAVIOR OF .CHILEAN P.CC PAVEMENTS
Several years of precise measurements of slab internal temperatures and vertical displacements, as well as joint openings, at the 21 test sections have clearly shown the existence of an upward concavity in all slabs, with the edges and corners tending to remain unsupported most of the time (5). The causes for this condition are related to the combined action of climatic features affecting the pavement since construction .
Daily temperature variations induce upward curling typically during the cooling period between 6:00 p.m. and 10:00 a.m., depending on the season, cloudiness, and site latitude. As a result of semiempirical modeling of internal temperatures, calibrated with actual field measurements, the accumulated hours at various intervals of thermal gradient lead to the conclusion that the pavement remains cooler at the top surface than at the bottom roughly two-thirds of the time (9).
On the other hand, rainfall is highly concentrated in the winter season, followed by long periods of little or no rain, producing yearly variations of moisture differentials through the slab thickness . In fact, the internal moisture has wider variations ne<-tr the smface, which is exposed to evaporation, than at the protected bottom; therefore, the pavement slabs tend to be permanently upward warped, reaching a maximum at the end of autumn and a minimum during the rainy season (10). This effect has been consistently verified with field measurements, particularly through the corner displacements measured at the moment of zero thermal gradient, as shown in Figure 2 for different days in a 3-year period.
Another possible factor contributing to the upward concavity of the pavement slabs is related to the irreversible drying shrinkage of the concrete slab surface that occurs during the first hours of concrete hardening (11).
Considering the additive effects of the irreversible drying shrinkage, the moisture differential, and the thermal gradients

Poblete et al.
1 00 Cracked Slabs [%]
so
ao
40
20
5 10
Ts c:i ...... e.ii,ie,ie,is;,2i UNCFIACKED
• ., t•r e-Q years
15
155
20 Age [years]
FIGURE 1 Evolution of slab cracking in test section pavements (transverse and corner cracks).
UP'NARD DISPLACEl'vlENT [mm]
2 Terno. Grae ... o
i .e
o.e
0 '--~~~~~~~~~~~~~~~~~~~~~~~~~~~~~~~~~
. o+ m······························1 .. ··························· · ·· · · ··········· ···· ····· · ·-~-?..~.:'..~.::'.'. ..... ~.~-1-~.::".':.:.: ... ~'.::1.~! .. ............... I 2:ot ........................ ;;;;·::::·_·1····· .. :·--· .. ·· ................. -. .............. ::::·; ..................................... :·:·: .. iii····=· .. ··. 0,. A .J A 0 0 PA .J A 0 0 PA .J A 0
1 i;ia7 i;iee 1;1e;i --
FIGURE 2 Annual cyclic variations of slab nonload deformations and rainfall for typical test section pavement.
in the concrete, a predominant upward concavity in all pavement slabs is therefore controlling the structural condition to be considered in the stress analysis (see Figure 3a). The downward concavity (see Figure 3b), traditionally considered critical (12), could only be produced during the first hours of high solar radiation on a sunny summer day while the edges are still free to rotate. However, compressions develop at the transverse edges as soon as the mean temperature increases and, therefore, some degree of longitudinal continuity is attained, leading the whole pavement to behave as a rather continuous strip supported along the longitudinal edges (see Figure 3c). As a consequence, the condition of downward concavity is not considered critical as far as the accumulation of fatigue damage is concerned, although the concrete may develop high stresses during short periods of time.
Under the traffic loadings acting on the upward concave slabs, the fatigue of the concrete is manifested by transversal cracking, usually beginning from the middle of the edges. Sometimes, curved corner cracks also develop, as shown in Figure 4. As verified through boreholes at the test section slab, cracking always starts from the upper surface and progresses downward.
Slab-to-slab cracking was measured at each test section by means of a visual survey conducted annually during the 5 years of research. From the analysis of all data, three indexes that were found to be useful for modeling purposes include (a) the percentage of slabs with any type of crack, (b) the accumulated length of cracks (m/km) and (c) the average number of pieces per slab. These indexes were related to the results of the structural analysis of the pavement slabs to generate a model of slab cracking.
DEVELOPMENT OF SLAB CRACKING MODEL
For structural modeling, the pavement is considered to be a system composed of a series of slabs of similar geometry and material characteristics. Boundary conditions of each slab are controlled by the reduced support on the base and by the interaction with adjacent slabs through the joint efficiency, or load transfer, in transversal and longitudinal edges (3). Such a system is simultaneously stressed by the body forces acting on the slabs with varying degrees of upward concavity and by the repeated loads of traffic.

156
Fl=IEE EDGES
1t=~=======--f-,z ____ ;y R ESTFllCTED EDGES ( ·only tren-eversalJ
FIGURE 3 Typical shapes of slabs deformed by temperature: (a) upward concave slabs, (b) and (c) downward concave slabs.
An approach for solving this complex, nonlinear, multivariable problem is the concept of fatigue consumption accumulated in the slab concrete from the first traffic passing over the pavement until the moment of evaluation (12). At that time, the accumulated fatigue consumption is compared with some index of slab cracking actually observed in the field.
In order to calculate stresses under different levels of upward concavity, traffic must not only be known in volume and in axle load distribution but also discriminated by hour and season. A statistical processing of the traffic data (6) showed that average daily traffic (ADT) in the 21 sections ranged between 4,000 and 12,000 veh/day, of which 26 percent are heavy trucks and 9 percent buses, mainly passing between 6:00 a.m. and 8:00 p.m. The heavy vehicles were divided into single, tandem, and tridem axles, with the load distribution shown in Figure 5 based on weigh-in-motion data.
To calculate tensile stresses, the finite element method was used with the slabs being modeled as a system of thick, interacting plates capable of admitting nonlinear distribution of internal tempernture through the slah thickness. The slab support was modeled by a set of continuous springs of subgrade reaction modulus Kw, which are not capable of taking tension. Therefore, iterations are needed until the partial support condition is satisfied. To consider the interaction between slabs, special joint elements were developed to restrict edge displacements and rotations. At longitudinal edges the condition
\ \ '
Heavy Traf fie \ \ _. _J I
shoulder
~ ~
Heavy Traffic \ _. I
shoulder
TRANSPORTATION RESEARCH RECORD 1307
of free border is realistic, both at the exterior edge with the granular shoulder and at the interior edge, where a significant level of deflection is needed to mobilize the effect of adjacent slabs through the keyed longitudinal joint. The program PAVIDIEM, developed for a personal computer, was checked with cases of known direct stress solutions, such as those provided by the Westergaard and Spangler equations (13), and indirectly against such widely used programs as SAP-4 and others using solid elements (14). Most important, the calculated displacements were compared with actual field measurements.
In a previous analysis the most critical position of the three types of loaded axles was investigated on a typical pavement with upward concave slabs. In all cases the maximum tensile stress is at the upper slab surface and toward the central portion of the slab when the loaded axle is crossing the transverse joints, particularly when the outer wheels are at the corner. Tensile stresses are also high at the middle zone of the edges, as shown by the isograms in Figure 6. For evaluation purposes, the wheels are positioned at some distance from the edge, where most traffic actually passes.
These results are in good agreement with the actual pattern of slab cracking (see Figure 4), which typically starts at the edges and progresses down and inward until the complete breakage of the slab. This empirical observation demonstrates that those high stress points are indeed critical in accumulating fatigue consumption.
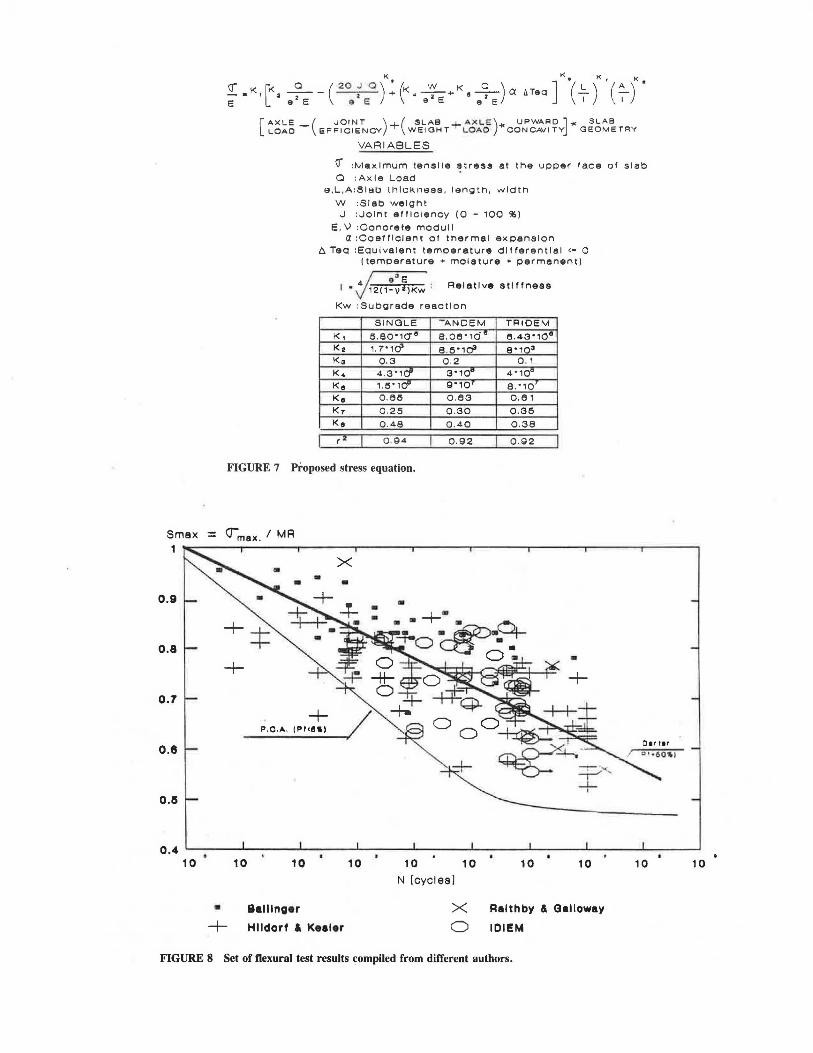
The full range of conditions encountered in the actual pavements includes different slab geometry and material properties; varying degrees of partial support, joint efficiency, and internal temperature and moisture differentials; and the three types of axles and load magnitudes. Considering the great number of cases needed to cover all these conditions, which are excessively time-consuming in a conventional finite element analysis, about 1,800 specific cases were selected to develop a mathematical model of practical use. The resulting dimensionless equation, shown in Figure 7, has an estimated error of less than 10 percent for the finite element solution. In the equation, joint efficiency (J) is the simple ratio of the leave and approach corner deflections when the load is in the approach side (2), and ~Teq is a negative equivalent temperature differential that includes all components of upward concavity, as discussed previously.
\
\ lni tiai
' ) I
~
l \ Advanced
~ I
FIGURE 4 Typical pattern of slab cracking developed in in-service PCC pavements.

Poblete et al. 157
AXLES PER 1000 HEAVY VEHICLcS
TRUCKS BUSES
20'.:===================================~ %
v 115 E H
TAN OEM I c10 L
/~,,-, , . T~ts>.~M
~// '\ ................ · ·-... E s 15
' / ....... .. ....... /·· ·'\·~~~-----o ~o 100 1150 200 2150 300
AXLE LOAD [KN)
FIGURE 5 Traffic composition and axle load composition.
4.5 m
1.5 1.5
I
3.5 m
2.3 1.9 1.5
FIGURE 6 Tensile stresses (MPa) at upper surface of upward concave slab produced by a 110-kN single-axle load.
Kw was derived from the center point deflections under truck wheel loads actually measured in each test section pavement. All deflections measured at the central point of slabs keep practically constant , with reduced magnitude at every season , indicating that the base support remains essentially stable throughout the year. The numerical Kw values are about 10 times greater than were expected from repetitive plate load tests.
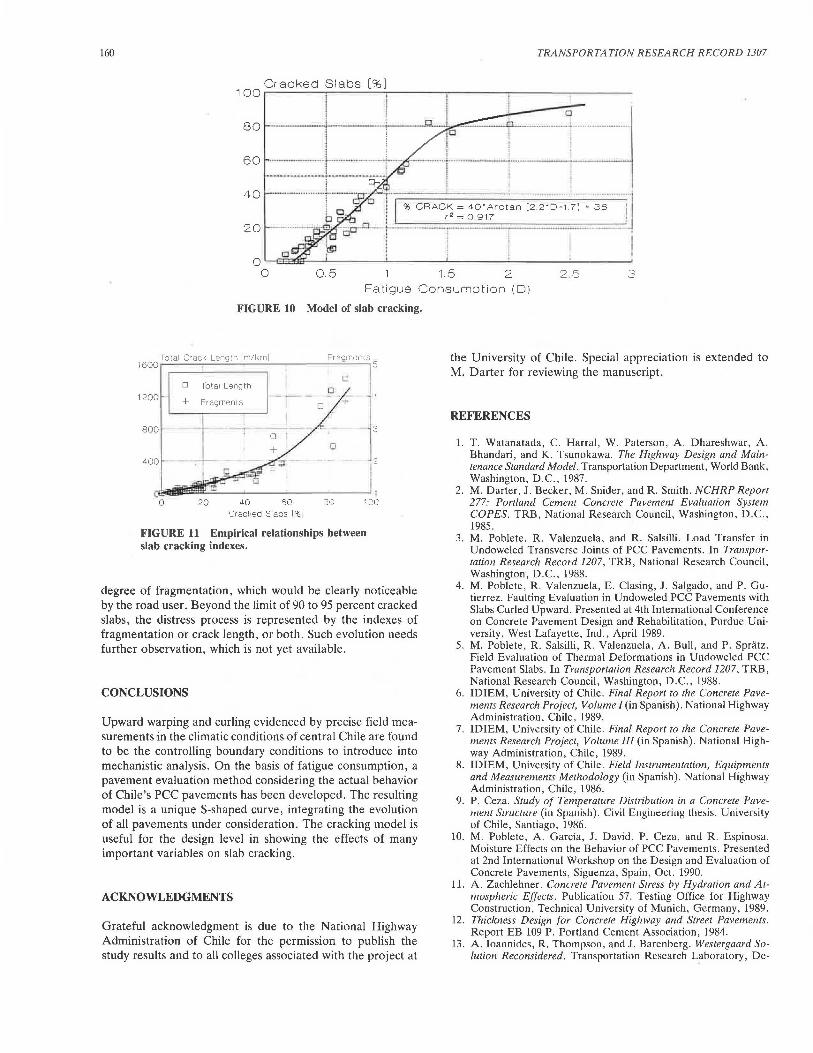
The fatigue consumption was calculated on the basis of an applicable concrete fatigue curve. To that purpose cyclic flexural tests were performed on a prismatic specimen molded with concrete of the same characteristics as those used in the Chilean pavements (15), which verified the general trend of results gathered by Darter (16) and shown in Figure 8. The University of Chile research also emphasized the importance of selecting realistic values of the modulus of rupture (MR) of concrete when calculating Smax = ama.IMR, especially regarding the possible existence of initial cracks in the tensile stressed surface.
The influence of repetitive alternating stresses producing tension on top and bottom surfaces needs to be further researched. For modeling purposes the average trend representing 50 percent probability of failure was selected to correspond with similar probability of slab cracking in the field.
Determining the accumulated fatigue consumption of each climatic parameter that modifies the slab boundary conditions is an extremely complex task. To approach a reasonable solution, a full-year period was discriminated into three seasons; each with separated cloudy, sunny, and partial cloudy weather conditions. At the same time, the daily cyclic temperature variations were divided into three hour groups to account for the conditions of negative, nearly zero, and positive gradients (°C/mm) , as presented in Table 1.
By applying the stress equation to each level of axle loading in each of the previously defined conditions, the number of allowable repetitions (N) can be found using the selected fatigue curve. Letting n represent the number of actual load repetitions, known from traffic data in each environmental
0.9
0.8
0.7
0.8
0.15
0.4 10
[AXLE ( JOINT )+( SLAB + AXl.E)_,. UPWARD l-t< SLAB LOAD - EFFICIENCY WEIGHT l.OAD CONCAVITYj GEOMETRY
VARIABLES
(f" :Maximum tensile stress at the upper race of slab Q :Axle Load ·
a,L,A :81t:iD lhlcknase. lan<;;1th, width
w :Slab weight J :Joint efficiency (O - 100 %)
E, I) :Concrete moduli a :Coe111olent of thermal expansion
t;. Teq :Equivalent temperature differential <• O (temperature • moisture • permanent)
4 e3 E I • 12(1-v•JKw : Relative stiffness
Kw :Subgrade reaction
SINGLE TANDEM TRI OEM
K1 5.eo·1cre e .oe·10" e.43°1oe K2 1. 7"1d' 8 . 1>•1(jl 8"103
K_. 0 . 3 0.2 0 . 1 K,. 4.3"1d' 3·10" 4•10"
Ke U5" 1ct' 9"10' e.-10 Ke 0.65 o.e3 0.61 K, 0.25 0.30 0.31)
Ke 0.48 0.40 0 .38
0.94 0.92 0.92
FIGURE 7 Proposed stress equation.
x • •
• •
• +
P.C.A.
Darter
10 10 10 10 10 10 10 10 N (cycles]
• Ballinger x Ralthby & Galloway
+ Hlldorf & Keeler 0 IDIEM
FIGURE 8 Set of flexural test results compiled from different authors.
10

Poblete et al. 159
TABLE 1 DAILY CYCLIC TEMPERATURE VARIATIONS
HOUR GROUP WEATHER SEASON
9 PM - 9 AM 9-11 AM/ 5-9 PM llAM-5 PM
Sunny s - 0.055 0 + 0.075 w - 0.030 0 + 0.050
Cloudy s - 0.042 0 + 0.055 w - 0.015 0 + 0.025
Partial s - 0.030 0 + 0.040 w - 0.005 0 + 0.010
S: Summer (Jan - Apr) W: Winter (May - Aug) S: Spring (Sept - Dec)
condition, the fatigue consumption was evaluated as n/N. According to Miner, the accumulated fatigue consumption (D) is the aggregation of all individual n/N values, as shown in Figure 9.
Using the accumulated fatigue consumption as a variable that integrates all controlling factors described here, the various curves of slab cracking as a function of age (see Figure 1) have been unified into a single trend, as shown in Figure 10. The proposed curve is the result of a pavement evaluation for a 50 percent probability of slab cracking within a homogeneous section, where the modulus of rupture and other factors are assumed constant. Therefore, it is not surprising to have fatigue consumption values greater than 1 when the slab cracking has affected more than half of the slabs in a pavement section.
COMPARISON OF SLAB CRACKING INDEXES
From an analysis of the visual surveying data, the alternative indexes of total crack length per kilometer and average number of fragments per slab are found to be related to the percentage of cracked slab, as shown in Figure 11. These indexes are complementary to the model and serve to better define the extent of a maintenance or rehabilitation plan.
COMMENTS
The model of cracking explains well the type of cracking occurring in Chile, as shown in Figure 4. The present model
of slab cracking has been developed for the structural condition of a predominant upward concavity producing partial support localized under the central part of the slab. This condition, being characteristic of Chile's PCC pavements, is believed to be much more widespread than currently acknowledged, as in Florida (17), California (18), Spain, and other locations. This approach is substantially different than the traditional theory used by the Portland Cement Association, Darter, and others. The proposed methodology, which is based on the analytical modeling of an empirical behavior, permits the explicit consideration of an ample variety of climatic parameters, conditions of slab support, and joint load transfer. It is well suited for successive future adjustments from additional field data gathered at more advanced states of distress.
The model is also thought to be good for the design of a pavement structure, varying the different parameters of slab geometry, load transfer, and slab support, at any climatic location. The method is capable of introducing a desired final state of cracking, depending on the level of functional distress that can be considered allowable.
The results presented deal with the fatigue consumption associated with structural distress or cracking in rather new pavements, which does not necessarily result in a serviceability loss because there is a time lapse between the appearance of a crack and the subsequent deterioration being noticeable by road users. For instance, if the pavement is reaching a state of 90 percent cracked slabs, four or five fragments can be expected as average in a section, meaning that some specific slabs may be presenting a much higher
P S W H A L
0= 2 2 2 2 2 2 [%-] 1111~
ENVIRONMENT TRAFFIC
P : Period of evaluation, In years
S : Seasons ( Summer, Winter, Spring )
W: Weather conditions (Sunny, Cloudy, Partial)
H : Hour groups In a day
A : Types of ax le ( single, tandem, tridem )
L : Load Intervals
FIGURE 9 Criteria of fatigue consumption aggregation.
160 TRANSPORTATION RESEARCH RECORD 1307
Cracked Slabs [%]
0.5 1. 5 2 25 Fatigue Consumption (0)
FIGURE 10 Model of slab cracking.
Total Crack Length [m/km] Fra~ments 1600~~~~~~~~~~~~~~~~~5
c D Total Length
+ Fragments 1200 -
D
800 f------<.-
_I 400
0 20
FIGURE 11 Empirical relationships between slab cracking indexes.
l l
L r I ~
I
degree of fragmentation, which would be clearly noticeable by the road user. Beyond the limit of 90 to 95 percent cracked slabs, the distress process is represented by the indexes of fragmentation or crack length, or both. Such evolution needs further observation, which is not yet available.
CONCLUSIONS
Upward warping and curling evidenced by precise field measurements in the climatic conditions of central Chile are found to be the controlling boundary conditions to introduce into mechanistic analysis. On the basis of fatigue consumption, a pavement evaluation method considering the actual behavior of Chile's PCC pavements has been developed. The resulting model is a unique S-shaped curve, integrating the evolution of all pavements under consideration. The cracking model is useful for the design level in showing the effects of many important variables on slab cracking.
ACKNOWLEDGMENTS
Grateful acknowledgment is due to the National Highway Administration of Chile for the permission to publish the study results and to all colleges associated with the project at
the University of Chile. Special appreciation is extended to M. Darter for reviewing the manuscript.
REFERENCES
1. T. Watanatada, C. Harral, W. Paterson, A. Dhareshwar, A. Bhandari, and K. Tsunokawa. The Highway Design and Maintenance Standard Model. Transportation Department, World Bank, Washington, D.C., 1987.
2. M. Darter, J. Becker, M. Snider, and R. Smith. NCHRP Report 277: Portland Cement Concrete Pavement Evaluation System COPES. TRB, National Research Council, Washington, D.C., 1985.
3. M. Poblete, R. Valenzuela, and R. Salsilli. Load Transfer in Undoweled Transverse Joints of PCC Pavements. In Transportation Research Record 1207, TRB, National Research Council, Washington, D.C., 1988.
4. M. Poblete, R. Valenzuela, E. Clasing, J. Salgado, and P. Gutierrez. Faulting Evaluation in Undoweled PCC Pavements with Slabs Curled Upward. Presented at 4th International Conference on Concrete Pavement Design and Rehabilitation, Purdue University, West Lafayette, Ind., April 1989.
5. M. Poblete, R. Salsilli, R. Valenzuela, A. Bull, and P. Spratz. Field Evaluation of Thermal Deformations in Undoweled PCC Pavement Slabs. In Transportation Research Record 1207, TRB, National Research Council, Washington, D.C., 1988.
6. IDIEM, University of Chile. Final Report to the Concrete Pavements Research Project, Volume I (in Spanish). National Highway Administration, Chile, 1989.
7. IDIEM, University of Chile. Final Report to the Concrete Pavements Research Project, Volume 111 (in Spanish). National Highway Administration, Chile, 1989.
8. IDIEM, University of Chile. Field Instrumentation, Equipments and Measurements Methodology (in Spanish). National Highway Administration, Chile, 1986.
9. P. Ceza. Study of Temperature Distribution in a Concrete Pavement Siructure (i11 Sµauish). Civil Engineering thesis. University of Chile, Santiago, 1986.
10. M. Poblete, A. Garcia, J. David, P. Ceza, and R. Espinosa. Moisture Effects on the Behavior of PCC Pavements. Presented at 2nd International Workshop on the Design and Evaluation of Concrete Pavements, Siguenza, Spain, Oct. 1990.
11. A. Zachlehner. Concrete Pavement Stress by Hydration and Atmospheric Effects. Publication 57. Testing Office for Highway Construction, Technical University of Munich, Germany, 1989.
12. Thickness Design for Concrete Highway and Street Pavements. Report EB 109 P. Portland Cement Association, 1984.
13. A. Ioannides, R. Thompson, and J. Barenberg. Westergaard Solution Reconsidered. Transportation Research Laboratory, De-

Poblete et al.
partment of Civil Engineering, University of Illinois, Urbana, Champaign, 1986.
14. J. Bathe. SAP 4, A Structural Analysis Program for Static and Dynamic Response of Linear Systems. University of California, Berkeley, 1973.
15. G. Moreno. Concrete Fatigue Characteristics of Chilean PCC Pavements (in Spanish). Civil Engineering thesis. University of Chile, Santiago, 1988.
16. M. Darter. Design of Zero-Maintenance Plain Jointed Pavement. Report FHWA-RD-77-11. FHWA, U.S. Department of Transportation, June 1977.
161
17. J.M. Richardson and J.M. Armaghani. Stress Caused by Temperature Gradient in Portland Cement Concrete Pavements. In Transportation Research Record 1121, TRB, National Research Council, Washington, D.C., 1987, pp. 7-13.
18. W. Ames. Concrete Pavement Design and Rehabilitation in California. Presented at 3rd International Conference on Concrete Pavement Design and Rehabilitation, Purdue University, West Lafayette, Ind., April 1985.
Publication of this paper sponsored by Committee on Rigid Pavement Design.


![[Elearnica.ir]-ABAQUS Model for PCC Slab Cracking](https://img.dokumen.tips/doc/110x75/577cc3c91a28aba711972ae8/elearnicair-abaqus-model-for-pcc-slab-cracking.jpg)