Embed Size (px)
Citation preview

MED
ICA
LSC
IEN
CES
Model-driven mitigation measures for reopeningschools during the COVID-19 pandemicRyan Seamus McGeea,1,2 , Julian R. Homburgerb,1,3 , Hannah E. Williamsb , Carl T. Bergstroma,4 ,and Alicia Y. Zhoub,4
aDepartment of Biology, University of Washington, Seattle, WA 98195; and bScientific Affairs, Color Health, Burlingame, CA 94010
Edited by James J. Bull, University of Idaho, Moscow, ID, and approved July 1, 2021 (received for review May 15, 2021)
Reopening schools is an urgent priority as the COVID-19 pan-demic drags on. To explore the risks associated with returningto in-person learning and the value of mitigation measures, wedeveloped stochastic, network-based models of severe acute res-piratory syndrome coronavirus 2 (SARS-CoV-2) transmission inprimary and secondary schools. We find that a number of mitiga-tion measures, alone or in concert, may reduce risk to acceptablelevels. Student cohorting, in which students are divided into twoseparate populations that attend in-person classes on alternat-ing schedules, can reduce both the likelihood and the size ofoutbreaks. Proactive testing of teachers and staff can help catchintroductions early, before they spread widely through the school.In secondary schools, where the students are more susceptible toinfection and have different patterns of social interaction, con-trol is more difficult. Especially in these settings, planners shouldalso consider testing students once or twice weekly. Vaccinatingteachers and staff protects these individuals and may have a pro-tective effect on students as well. Other mitigations, includingmask wearing, social distancing, and increased ventilation, remaina crucial component of any reopening plan.
SARS-CoV-2 | epidemiology | primary schools | secondary schools
As the COVID-19 pandemic accelerated in early 2020,schools around the world closed in an effort to preempt
school-associated transmission and protect their students, teach-ers, and staff. By mid-April of that year, 195 countries had closedtheir schools in response to COVID-19, affecting more than 1.5billion students (1). In the United States, schools were among thefirst organizations to close, and many remained closed or tran-sitioned to remote learning through the end of the 2019–2020school year. Some remain closed today. While remote learn-ing affords students the opportunity to continue their education,it fails to provide many of the crucial benefits students typi-cally receive through in-person schooling (2). There is an urgentneed to evaluate the effectiveness of evidence-based strategiesthat would allow children, teachers, and staff to safely return toin-person learning.
To date, widespread community transmission, conflicting pub-lic health guidance, and the emergence of new severe acuterespiratory syndrome coronavirus 2 (SARS-CoV-2) variantsassociated with higher transmissibility have compounded thechallenges schools face when reopening (3–5). Numerous epi-demiological models have been developed to forecast the spreadof SARS-CoV-2 or compare the effectiveness of mitigationstrategies in communities or large populations (6–12). How-ever, only a few models have focused on the unique demo-graphic and contact structures of primary and secondary schoolsettings (13–15).
Case studies suggest that primary schools have a lower risk oftransmission compared to secondary schools (16–19). Two prin-cipal causes could be at play. First, younger children are lesslikely than adolescents or adults to become infected with SARS-CoV-2 (20), and less likely to experience symptomatic or severedisease (21, 22). Second, primary and secondary schools havedifferent contact structures. Primary school students have fewer
contacts and typically spend the full day with a single teacher andthe same group of students. By contrast, secondary school stu-dents move between classrooms and encounter multiple teachersand groups of students each day.
We have developed epidemiological models to simulate thespread of SARS-CoV-2 among students, teachers, and staff inboth primary and secondary schools. Here, we use these mod-els to better understand the risks of reopening schools andto explore the effectiveness of different mitigation strategies:cohorting students, proactive testing, quarantine protocols, andvaccinating teachers and staff.
Model and MethodsA Stochastic Network-Based Model of SARS-CoV-2 Transmission. Weuse the SEIRS+ modeling framework (https://github.com/ryansmcgee/seirsplus) to study the dynamics of disease transmis-sion in school populations. SEIRS+ builds upon classic SEIRcompartment models that divide the population into susceptible(S), exposed (E), infectious (I), and recovered (R) individuals
Significance
As the COVID-19 pandemic drags on, we need strategies forreopening those schools that have remained closed. We devel-oped stochastic network models to study the risks associatedwith returning to in-person learning during the COVID-19pandemic, and to explore the value of mitigation mea-sures in reducing these risks. Our models indicate that therisk of school outbreaks increases as community prevalenceincreases, and that secondary schools pose greater controlchallenges than primary schools. The models reveal that anumber of measures can help substantially: dividing studentsinto multiple cohorts who attend school on an alternatingbasis, frequently testing teachers and students, and vaccinat-ing teachers and staff. Basic transmission control strategiessuch as mask use, social distancing, and ventilation remainessential.
Author contributions: R.S.M., J.R.H., H.E.W., C.T.B., and A.Y.Z. designed research; R.S.M.,J.R.H., and H.E.W. performed research; R.S.M. and J.R.H. contributed new computationaltools; R.S.M. and J.R.H. analyzed data; and R.S.M., J.R.H., H.E.W., C.T.B., and A.Y.Z. wrotethe paper.y
Competing interest statement: C.T.B. and R.S.M. consult for Color Health. C.T.B. hasreceived honoraria from Novartis. H.E.W. and A.Y.Z. are currently employed by and haveequity interest in Color Health. J.R.H. was previously employed by and holds an equitystake in Color Health. J.R.H. is currently employed and has an equity interest in MazeTherapeutics.y
This article is a PNAS Direct Submission.y
This open access article is distributed under Creative Commons Attribution License 4.0(CC BY).y1 R.S.M. and J.R.H. contributed equally to this work.y2 To whom correspondence may be addressed. Email: [email protected] Present address: Maze Therapeutics, South San Francisco, CA 94080.y4 C.T.B. and A.Y.Z. contributed equally to this work.y
This article contains supporting information online at https://www.pnas.org/lookup/suppl/doi:10.1073/pnas.2108909118/-/DCSupplemental.y
Published September 13, 2021.
PNAS 2021 Vol. 118 No. 39 e2108909118 https://doi.org/10.1073/pnas.2108909118 | 1 of 10
Dow
nloa
ded
by g
uest
on
Janu
ary
29, 2
022

and track the transitions of individuals among these states(23). The basic SEIR model is a deterministic model of ahomogeneous population with well-mixed interactions. How-ever, accounting for demographic heterogeneity and the struc-ture of contact networks is particularly important when evalu-ating control strategies that perturb the contact network (e.g.,social distancing) or make use of it (e.g., contact tracing) (24, 25).For disease control, modeling stochasticity is crucial to under-stand the distribution of potential outcomes, especially in smallerpopulations.
To incorporate these important aspects of disease dynam-ics, we use the SEIRS+ modeling framework to implement anextended SEIR model of SARS-CoV-2 transmission on stochas-tic dynamical networks. Individuals are represented as nodesin a contact network. Parameters, interactions, interventions,and residence times in each compartment are specified on anindividual-by-individual basis. This allows us to model real-istic heterogeneities in disease, transmission, and behavioralparameters—which are particularly important when consider-ing SARS-CoV-2 transmission dynamics in small, age-stratifiedschool populations. The disease dynamics are summarized in Fig.1 and described in detail in SI Appendix, section A.1. Parametersettings are outlined in SI Appendix, section A.2.
We model infection as transmitted largely along a network ofclose contacts. Close contacts are individuals with whom one hasrepeated, sustained, or close-proximity interactions on a regu-lar basis: classmates, friends, housemates, or other close rela-tionships. Disease transmission can also occur among casualcontacts—individuals who are not on one’s contact network, butwith whom one has incidental, brief, or superficial interactions. Anetwork locality parameter sets the relative frequency and weightof transmission among close and casual contacts (SI Appendix,
Fig. 1. Compartment model. The progression of disease states in theextended SEIR network model is represented by the compartments shown.Susceptible (S) individuals become infected (exposed) following transmis-sive contact with an infectious individual. Newly exposed (E) individualsundergo a latent period, during which time they are infected but not con-tagious. Infected individuals then progress to a presymptomatic infectiousstate (Ipre), in which they are contagious but not yet presenting symptoms.Some infectious individuals go on to develop symptoms (Isym), while oth-ers will remain asymptomatic (Iasym). At the conclusion of the infectiousperiod, infected individuals enter the recovered state (R) and are no longercontagious or susceptible to infection. The unshaded compartments repre-sent quarantined individuals in the respective disease states. Individuals aremoved into a quarantine compartment upon isolation due to symptoms ora positive test (gray arrows).
section A.1.4). In both primary and secondary school settings,we assume that 80% of transmission occurs between close con-tacts specified by the networks (26). Exposure to the communityis modeled by randomly introducing new cases to the school pop-ulation at a rate that corresponds to the community prevalence—see Community Prevalence and Case Introduction Rate.
The likelihood that a susceptible individual becomes infecteddepends on the prevalence of infectious individuals amongtheir contacts, the transmissibilities of these contacts, and theirown susceptibility to infection (SI Appendix, section A.1.4).Because individuals with large numbers of contacts—teachers,for example—are unlikely to interact as closely with each individ-ual contact, we assume a logarithmic rather than linear scalingof transmission opportunity as a function of network degree(SI Appendix, section A.1.4.2). Independent of connectivity, weassume an overdispersed distribution of individual variation inbiological transmissibility (SI Appendix, section A.2.3), whichcorresponds to the observation that 80% of SARS-CoV-2 trans-mission may be attributable to 20% of infectious individuals(27–29). This distribution of individual transmissibilities is cal-ibrated to a nominal basic reproduction number R0 for thepopulation. While the R0 of SARS-CoV-2 varies, many estimatesplace R0 upward of 2.5 to 3.0 without intervention, dependingon the variants that are present in a given population (30–35).As a baseline, we assume that schools will implement sufficientmitigation measures, such as mask wearing, physical distanc-ing, and increased ventilation, to reduce R0 to 1.5 in the schoolpopulation. More aggressive mitigation measures may bring thebaseline R0 in schools closer to 1.0. Results for other values ofR0 are discussed in SI Appendix, section B.
Individuals in any disease state may enter quarantine due tosymptoms or in response to a positive test result. The effect ofisolating individuals is modeled by introducing compartmentsthat represent quarantined individuals who do not make trans-missive contact with others outside of the home (Fig. 1 and SIAppendix, section A.2.4.3). Individuals remain in quarantine for10 d (36), at which time they transition to the nonquarantinecompartment corresponding to their present disease state. Weassume that 20% of symptomatic individuals self-isolate upon theonset of symptoms (37) (SI Appendix, section B.4). At baseline,only the symptomatic or positive individual is isolated, but wego on to consider scenarios where classroom contacts of positivestudents are also isolated (SI Appendix, section A.2.6.4).
Model Considerations for Primary Schools versus Secondary Schools.We use distinct models for primary and secondary schools, withdifferent contact networks reflecting the social structures in eachsetting (SI Appendix, section A.2). We assume primary schoolchildren are 60% as susceptible as adults, while secondary schoolstudents are equally as susceptible as adults (16, 20). Our primaryschool model encompasses a school with 480 students, 24 teach-ers, and 24 additional staff. Primary school students have closecontacts with their teacher, classmates, and other children intheir household (e.g., siblings). For our secondary school model,we simulate a school with 800 students distributed across fourgrades, 125 teachers, and 75 additional staff. Secondary schoolstudents have close contacts with six teachers, with other stu-dents in their grade and social groups, and with other studentsin their households. Secondary school networks are parameter-ized such that connectivity statistics (e.g., mean degree, CV2 ofdegree, clustering coefficient) are in line with empirical studies ofsecondary school contact networks (38–41) (SI Appendix, sectionA.2.4.2). Both settings feature a network of close contacts amongteachers and staff. A new random network is generated for eachsimulation replicate. Example network diagrams for each schoolsetting are shown in Fig. 2. Detailed descriptions of the con-tact network structures and their generation are provided inSI Appendix, section A.2.4.
2 of 10 | PNAShttps://doi.org/10.1073/pnas.2108909118
McGee et al.Model-driven mitigation measures for reopening schools during the COVID-19 pandemic
Dow
nloa
ded
by g
uest
on
Janu
ary
29, 2
022

MED
ICA
LSC
IEN
CES
Fig. 2. Network structures for primary and secondary schools. Each individual is represented by a circle, with gray lines connecting close contacts. (A)Primary school students (blue) are organized into classes with close contacts between all students in each classroom as well as a single teacher (green).School staff (yellow) interact with teachers and other staff. (B) Secondary school students (shades of blue and purple indicating grade levels) move betweenclassrooms and have close contact with six teachers (green) each. School staff (yellow) interact with teachers and other staff. Secondary school students areclustered into loose social groups and are more likely to interact with other students in the same grade. (C and D) Example contact networks for primaryand secondary schools, respectively, on a given day in a cohorting strategy in which students are divided into two groups that alternate in-person learning.Students that are in school on a given day (interior nodes) maintain the same school interactions as in the baseline networks. Students in the out-of-schoolcohort (peripheral nodes) make connections with any students that share their household (students in the same household are assigned to the same cohortin our model), but are disconnected from all other students and teachers. Students alternate between these interaction patterns according to a weekly ordaily cohorting schedule.
Community Prevalence and Case Introduction Rate. To account forthe effect of community prevalence on COVID-19 dynamics inschools, we model scenarios in which new cases are introducedinto the school population stochastically at rates correspond-ing to daily, weekly, or monthly introductions on average (SIAppendix, section A.2.5). When the effective community repro-duction number Reff is in the 1.0 to 2.0 range, these ratesapproximately correspond to the community prevalences shownin SI Appendix, Table A.2.5. We also consider the consequencesof a single introduction; in this scenario, all replicates start offwith the case introduction occurring on the first day of thesimulation.
Simulations. To capture stochastic variability in outcomes, wereport 1,000 replicates for each parameter set. Each repli-cate simulation tracks the progression of an outbreak thatbegins with the introduction of a single infected individual inan otherwise disease-free school population. The simulationbegins on a random day of the week with the introduction ofan initial case. Additional introductions may occur through-out the simulation at a Poisson rate reflecting the communityprevalence. School is in session 5 d a week, and we assumethat no close contacts are made outside of the household onweekends. Weekend transmission among casual contacts does
occur. The simulation proceeds for 150 d to represent a schoolsemester.
To allow comparisons across scenarios with different commu-nity prevalences, we report the percentage of cases attributableto transmissions within the school population (i.e., excludingintroduced cases attributable to exogenous community expo-sure). These transmissions may occur either at school or amongschool-affiliated individuals while off campus, and are here-after collectively described as “school transmission.” We define“sizable outbreaks,” as simulation runs where more than 5% ofthe population becomes infected in school over the course ofthe semester (150 d). While schools that experience sizable out-breaks are likely to stop in-person learning before very largecase counts are realized, these data provide information aboutthe probability of epidemic trajectories that could require suchaction.
ResultsThe Effect of Community Prevalence. The prevalence of COVID-19 in the community impacts the risk of transmission in schools.Fig. 3 shows the percentage of the school population infectedin primary and secondary schools over the course of a semesterwhen only basic mitigation strategies (e.g., distancing, hygiene,and mask wearing) are in place. Higher COVID-19 prevalence in
McGee et al.Model-driven mitigation measures for reopening schools during the COVID-19 pandemic
PNAS | 3 of 10https://doi.org/10.1073/pnas.2108909118
Dow
nloa
ded
by g
uest
on
Janu
ary
29, 2
022

A C
DB
E
F
Fig. 3. Effect of community prevalence. The distributions of school transmission cases as a percentage of the school population when new cases areintroduced at different average rates. In these simulations, all students are in school 5 d a week, and there is no proactive testing. (A and B) Outcomesfor primary schools and secondary schools, respectively, with baseline transmission R0 = 1.5. Black and orange lines represent median and 95th percentileoutcomes, respectively. Under each jitter distribution, we list the percentage of simulations where more than 5% (gray dashed line) of the population areinfected in school. (C and D) Outcomes for primary and secondary schools in scenarios with heightened transmission R0 = 2.25 due to the predominance ofa highly transmissible strain. (E and F) Heatmaps show the fraction of simulations where more than 5% of the student or teacher population are infected inprimary and secondary schools, respectively, across a range of R0 values and introduction rates.
the surrounding community increases the probability of a sizableoutbreak in primary and secondary schools alike. When commu-nity prevalence is so high that new introductions occur on a dailybasis (between 0.25 and 1.0%), our simulations suggest that evenaggressive mitigation strategies cannot prevent sizable outbreaks(Fig. 4).
The probabilities of sizable outbreaks are higher in secondaryschools than in primary schools, and the outbreaks tend to belarger in secondary schools. This difference holds across therange of parameters and interventions that we explore, and isprimarily attributable to the difference in susceptibility betweenprimary and secondary school students (SI Appendix, sectionB.3). Model outcomes are less sensitive to differences in thecontact networks that characterize these settings (SI Appendix,section B.3.2).
The Effect of Highly Transmissive Variants. As of spring 2021, sev-eral SARS-CoV-2 variants have evolved higher transmissibilityrelative to their ancestors (35, 42–47). For example, the B.1.1.7lineage that emerged from the United Kingdom appears to be 30to 70% more transmissible than previous SARS-CoV-2 variants(35, 42–44). To understand how highly transmissible variants mayimpact transmission dynamics where they become predominant,we look at the consequences of a 50% increase in transmissibility,which increases the assumed baseline R0 for the school environ-
ment from R0 = 1.5 to R0 = 2.25. Results for more incrementalincreases in mean transmission rates that approximate interme-diate penetrance of such strains can be found in SI Appendix,section B.1.1.
Fig. 3 illustrates how community prevalence, as modeled byintroduction rate, influences school transmissions when schoolsare confronted by this more transmissible strain. Even under amonthly rate of new case introductions, schools face the riskof a major outbreak. With more frequent introductions, sub-stantive outbreaks become the most likely outcome. Aggressivecontrols mitigate the risk somewhat, but are considerably lesseffective for a strain with R0 = 2.25 than for a strain withR0 = 1.5 (Fig. 4).
The Effects of Interventions.Cohorting. Cohorting, wherein students are divided into two ormore groups that alternate in-person learning, is a common strat-egy for mitigating outbreaks in school settings (48–50). In ourmodel, we represent cohorting by shifting the contact networksaccording to which students are on campus (SI Appendix, sec-tion A.2.4.5). While off campus, students are disconnected fromthe school network but maintain household connections andtransmission to casual contacts (the latter representing out-of-school interactions among the student body). Teachers remainon campus across all cohorts.
4 of 10 | PNAShttps://doi.org/10.1073/pnas.2108909118
McGee et al.Model-driven mitigation measures for reopening schools during the COVID-19 pandemic
Dow
nloa
ded
by g
uest
on
Janu
ary
29, 2
022

MED
ICA
LSC
IEN
CES
Fig. 4. Effects of cohorting and testing strategies. Heatmaps illustrate the interactions of three student cohorting strategies and five proactivetesting strategies (horizontal axis) across a range of transmission levels (R0) and new case introduction rates (vertical axis). The color of eachcell indicates the fraction of 1,000 simulations for the given parameter set that result in sizable outbreaks where more than 5% of the popula-tion is infected. Outcomes are shown for student and teacher populations in primary and secondary schools as indicated by the title above eachheatmap.
Fig. 5 shows the effects of three common cohorting strate-gies: 1) All students belong to a single cohort that is on campusfull time; 2) students are divided into two cohorts, A and B,which are on campus on alternating days; and 3) students aredivided into two cohorts which are on campus on alternatingweeks (SI Appendix, section A.2.6.3). We find that, relative to nocohorting, both alternating day and alternating week strategiescan improve outcomes substantially. Cohorting with alternatingweeks generally outperforms cohorting with alternating days, butthe marginal benefit of weekly cohorting is small when in-schooltransmission is limited (SI Appendix, section B.1.1). In primaryschools, student cohorting alone dramatically reduces the riskof outbreak among students. In secondary schools, cohorting ishelpful but insufficient on its own to keep the likelihood of anoutbreak low among students or among teachers and staff.Proactive testing. The purpose of proactive testing is to iden-tify individuals who are infected but not currently showingsymptoms, so that they can be quarantined (51, 52). We con-sider five proactive testing strategies, detailed in SI Appendix,section A.2.6.2: 1) a baseline of no testing; 2) once-weeklytesting among teachers and staff only; 3) twice-weekly testingamong teachers and staff only; 4) once-weekly testing cadence
among students, teachers, and staff; and 5) twice-weekly test-ing among students, teachers, and staff. We assume that 75%of students and 100% of teachers and staff are compliant withtesting (53). Previous work suggests that long test turnaroundtimes severely curtail the value of testing (51, 54, 55). Toaccount for this, we use a test turnaround time of 24 h andassume positive individuals enter quarantine immediately. In ourbasic model, only those who test positive are quarantined. Wewill later consider the consequences of quarantining all mem-bers of a primary school classroom when an individual thereintests positive.
Fig. 4 illustrates the effects of cohorting and testing on theprobability of sizable outbreaks. In our model, proactive testingconsistently reduces the risk of outbreaks among teachers andstudents (Fig. 4 and SI Appendix, section B). While cohortingalone does not completely mitigate the risk of sizable outbreaksin secondary schools, the combination of cohorting and testingcan keep this risk in check when baseline transmissibility in theschool is sufficiently low.
Fig. 6 highlights the interactions between testing and cohort-ing measures in their effect on outbreak size in a secondaryschool environment. More aggressive testing helps reduce the
A B
Fig. 5. Effects of cohorting strategies. The distributions of school transmission cases as a percentage of school population for 1,000 simulations underdifferent student cohorting strategies in (A) primary schools and (B) secondary schools with R0 = 1.5, approximately weekly new case introductions, and notesting. Under each jitter distribution, we list the percentage of simulations that result in outbreaks affecting more than 5% of the population.
McGee et al.Model-driven mitigation measures for reopening schools during the COVID-19 pandemic
PNAS | 5 of 10https://doi.org/10.1073/pnas.2108909118
Dow
nloa
ded
by g
uest
on
Janu
ary
29, 2
022

Fig. 6. Relative effects of testing and cohorting in a secondary school setting. A heatmap of pairwise comparisons of testing and cohorting interventionsillustrates the effects of various combinations on mean outbreak sizes. Each cell is colored according to the log-ratio of mean outbreak sizes for the twointerventions, which represents the effect of the column intervention relative to the row intervention. A blue cell indicates that the column interventionachieves a lower mean outbreak size than the row intervention; a red cell indicates that the column intervention has worse outcomes than the rowintervention on average. Symbols in cells denote statistically significant differences in outbreak size distributions according to the Mann−Whitney U test atthe 0.01 (~) and 0.05 (∗) levels. Results are shown for scenarios where R0 = 1.5, case introductions occur weekly on average, and only the positive individualis quarantined when cases are detected.
size of outbreaks, as does cohorting. Testing and cohortingtogether outperform either measure alone. Interventions thathelp students also help teachers, and vice versa.Isolation protocols. When an infected individual is identifiedby proactive testing, that person should be immediately iso-lated to prevent further transmission. In primary schools whereclassroom organization is stable, school administrators may addi-tionally consider quarantining the entire classroom—studentsand teacher.
Our model indicates that classroom-level quarantine canreduce outbreak risk (SI Appendix, Fig. A4). For students and forteachers, with weekly introductions, the distribution of outcomesfrom isolating classrooms is stochastically smaller than the distri-bution of outcomes from isolating individuals (Mann−WhitneyU test, p� 0.01). This means that, if one takes the outcome ofa randomly drawn simulation run with classroom-level isolationand another with individual-level isolation, the classroom-levelsimulation run is significantly more likely to have the betteroutcome. When introductions are less frequent, benefits of class-room isolation may not be statistically significant. One importantconsideration for quarantining at the classroom level is thatthis approach imposes more quarantine days on the popula-tion. When the level of in-school transmission is relatively low(e.g., R0 =1.5), classroom-level isolation confers about the sameamount of risk mitigation as moving from a weekly to semiweeklytesting cadence, but classroom isolation leads to a large increasein the number of in-person learning days lost (SI Appendix,section B.8).Vaccination. Pfizer-BioNTech and Moderna have reportedextremely successful results from their phase III and phase
IV COVID-19 vaccine trials, with 90% or greater efficacy atblocking symptomatic disease (56–61). The Johnson & Johnsonvaccine has somewhat lower efficacy but requires only a sin-gle dose. Distribution of all three vaccines is well underway inthe United States, with over a third of the US population fullyvaccinated as of early May 2021.
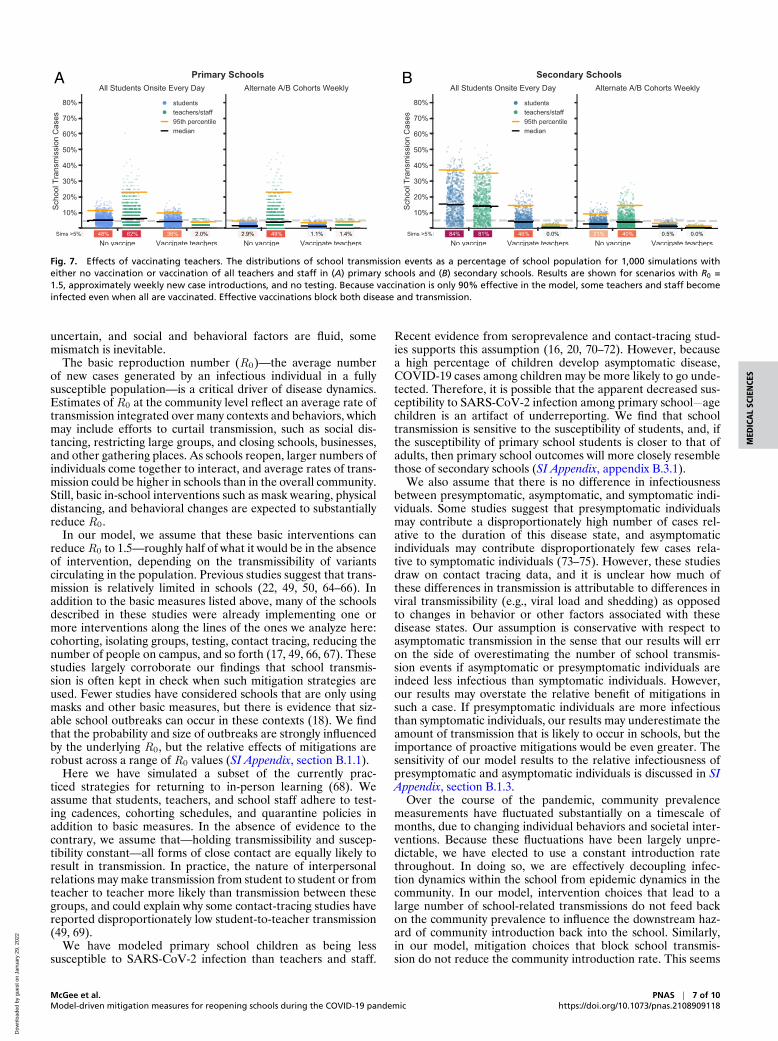
Teachers and staff who have been vaccinated against COVID-19 are well protected against infection (Fig. 7). While initialphase III trial data focused only on diagnosis of symptomatic dis-ease as a primary end point, current evidence suggests that thevaccines block transmission as well as symptomatic disease (59,60, 62, 63). Vaccinating teachers can also reduce the risk of out-breaks among students, particularly when paired with cohorting.The combination of vaccinating teachers and cohorting studentscontinues to substantially reduce the risk of outbreaks at higherlevels of transmissibility, which suggests this strategy may offera proactive defense against the spread of more transmissivevariants.
LimitationsLike all epidemiological models, ours is a simplification of acomplex, highly variable world. Our model is built on a seriesof assumptions and parameters; to the degree that these donot accurately reflect the real world, the model will be inef-fective at predicting even the range of possible outcomes. Wehave attempted to account for uncertainty by embracing realisticheterogeneity and stochasticity in our model and by evaluat-ing the sensitivity of outcomes across plausible ranges of val-ues for critical parameters (SI Appendix, section B). Still, in anovel pandemic where many epidemiological parameters remain
6 of 10 | PNAShttps://doi.org/10.1073/pnas.2108909118
McGee et al.Model-driven mitigation measures for reopening schools during the COVID-19 pandemic
Dow
nloa
ded
by g
uest
on
Janu
ary
29, 2
022
MED
ICA
LSC
IEN
CES
A B
Fig. 7. Effects of vaccinating teachers. The distributions of school transmission events as a percentage of school population for 1,000 simulations witheither no vaccination or vaccination of all teachers and staff in (A) primary schools and (B) secondary schools. Results are shown for scenarios with R0 =1.5, approximately weekly new case introductions, and no testing. Because vaccination is only 90% effective in the model, some teachers and staff becomeinfected even when all are vaccinated. Effective vaccinations block both disease and transmission.
uncertain, and social and behavioral factors are fluid, somemismatch is inevitable.
The basic reproduction number (R0)—the average numberof new cases generated by an infectious individual in a fullysusceptible population—is a critical driver of disease dynamics.Estimates of R0 at the community level reflect an average rate oftransmission integrated over many contexts and behaviors, whichmay include efforts to curtail transmission, such as social dis-tancing, restricting large groups, and closing schools, businesses,and other gathering places. As schools reopen, larger numbers ofindividuals come together to interact, and average rates of trans-mission could be higher in schools than in the overall community.Still, basic in-school interventions such as mask wearing, physicaldistancing, and behavioral changes are expected to substantiallyreduce R0.
In our model, we assume that these basic interventions canreduce R0 to 1.5—roughly half of what it would be in the absenceof intervention, depending on the transmissibility of variantscirculating in the population. Previous studies suggest that trans-mission is relatively limited in schools (22, 49, 50, 64–66). Inaddition to the basic measures listed above, many of the schoolsdescribed in these studies were already implementing one ormore interventions along the lines of the ones we analyze here:cohorting, isolating groups, testing, contact tracing, reducing thenumber of people on campus, and so forth (17, 49, 66, 67). Thesestudies largely corroborate our findings that school transmis-sion is often kept in check when such mitigation strategies areused. Fewer studies have considered schools that are only usingmasks and other basic measures, but there is evidence that siz-able school outbreaks can occur in these contexts (18). We findthat the probability and size of outbreaks are strongly influencedby the underlying R0, but the relative effects of mitigations arerobust across a range of R0 values (SI Appendix, section B.1.1).
Here we have simulated a subset of the currently prac-ticed strategies for returning to in-person learning (68). Weassume that students, teachers, and school staff adhere to test-ing cadences, cohorting schedules, and quarantine policies inaddition to basic measures. In the absence of evidence to thecontrary, we assume that—holding transmissibility and suscep-tibility constant—all forms of close contact are equally likely toresult in transmission. In practice, the nature of interpersonalrelations may make transmission from student to student or fromteacher to teacher more likely than transmission between thesegroups, and could explain why some contact-tracing studies havereported disproportionately low student-to-teacher transmission(49, 69).
We have modeled primary school children as being lesssusceptible to SARS-CoV-2 infection than teachers and staff.
Recent evidence from seroprevalence and contact-tracing stud-ies supports this assumption (16, 20, 70–72). However, becausea high percentage of children develop asymptomatic disease,COVID-19 cases among children may be more likely to go unde-tected. Therefore, it is possible that the apparent decreased sus-ceptibility to SARS-CoV-2 infection among primary school−agechildren is an artifact of underreporting. We find that schooltransmission is sensitive to the susceptibility of students, and, ifthe susceptibility of primary school students is closer to that ofadults, then primary school outcomes will more closely resemblethose of secondary schools (SI Appendix, appendix B.3.1).
We also assume that there is no difference in infectiousnessbetween presymptomatic, asymptomatic, and symptomatic indi-viduals. Some studies suggest that presymptomatic individualsmay contribute a disproportionately high number of cases rel-ative to the duration of this disease state, and asymptomaticindividuals may contribute disproportionately few cases rela-tive to symptomatic individuals (73–75). However, these studiesdraw on contact tracing data, and it is unclear how much ofthese differences in transmission is attributable to differences inviral transmissibility (e.g., viral load and shedding) as opposedto changes in behavior or other factors associated with thesedisease states. Our assumption is conservative with respect toasymptomatic transmission in the sense that our results will erron the side of overestimating the number of school transmis-sion events if asymptomatic or presymptomatic individuals areindeed less infectious than symptomatic individuals. However,our results may overstate the relative benefit of mitigations insuch a case. If presymptomatic individuals are more infectiousthan symptomatic individuals, our results may underestimate theamount of transmission that is likely to occur in schools, but theimportance of proactive mitigations would be even greater. Thesensitivity of our model results to the relative infectiousness ofpresymptomatic and asymptomatic individuals is discussed in SIAppendix, section B.1.3.
Over the course of the pandemic, community prevalencemeasurements have fluctuated substantially on a timescale ofmonths, due to changing individual behaviors and societal inter-ventions. Because these fluctuations have been largely unpre-dictable, we have elected to use a constant introduction ratethroughout. In doing so, we are effectively decoupling infec-tion dynamics within the school from epidemic dynamics in thecommunity. In our model, intervention choices that lead to alarge number of school-related transmissions do not feed backon the community prevalence to influence the downstream haz-ard of community introduction back into the school. Similarly,in our model, mitigation choices that block school transmis-sion do not reduce the community introduction rate. This seems
McGee et al.Model-driven mitigation measures for reopening schools during the COVID-19 pandemic
PNAS | 7 of 10https://doi.org/10.1073/pnas.2108909118
Dow
nloa
ded
by g
uest
on
Janu
ary
29, 2
022

reasonable when schools are not important drivers of the com-munity prevalence of SARS-CoV-2 infection, as appears to bethe case especially for K-5 schools (17, 49, 76). Where schools areimportant drivers of community dynamics, however, our modelrisks underestimating the consequences of mitigation efforts.When schools drive community prevalence, planners must alsoconsider the cost of the additional community infections thatresult from reopening schools—which we have not done here.
SummaryWe have presented results from a simulation model of reopen-ing schools during the COVID-19 pandemic. The purpose of thismodel is to provide a scenario-simulating tool that, when usedin concert along with other credible sources of information anddata, can aid decisions around school reopening policies.
We attempt to make reasonable assumptions about epidemi-ological parameters and aspects of human behavior that drivedisease transmission. Our results tend to be robust to thesechoices, and the qualitative findings that we report—advantagesto cohorting, testing, and vaccination—are expected to hold upmore broadly. In SI Appendix, section B, we provide detailed sen-sitivity analyses for a number of important parameters, includ-ing transmissibility, student susceptibilities, contact networkstructures, and compliance with intervention strategies. Ouronline webapp (https://www.color.com/return-to-school-model)provides a way to explore the range of parameters interac-tively, which can be used to assist in dynamic decision-makingin response to uncertain and changing local circumstances.
Our model suggests that dividing students into cohorts thatattend school in person on alternating schedules can be a pow-erful strategy for mitigating risk. Cohorting is effective in ourmodel because students largely restrict in-person interactions toother individuals within their own groups, and this takes placeonly while at school. The cohorting strategy is fairly robust tostudents interacting off campus as well, provided that studentscontinue to limit their contacts to students in their own cohort (SIAppendix, section B.6). However, when students socialize beyondtheir close contacts and across cohort boundaries outside ofschool—as students are wont to do—the effectiveness of cohort-ing is reduced (SI Appendix, section B.2). Schools could considerfurther efforts to reduce the mixing of the student body at school,which has a significant impact on the risk of transmission in allcontexts (SI Appendix, section B.2). This might include restruc-turing lunch periods, passing periods, transportation logistics,and other scenarios in which incidental transmission could occurbetween otherwise “unconnected” individuals.
Teachers and staff are more susceptible to the virus thanprimary school students and at higher risk of severe diseasethan students of any age. Moreover, teachers serve as con-duits for outbreaks to move among classrooms within the schoolnetwork. Frequent, proactive testing of teachers and staff caninterrupt such transmission chains and further protect them frominfection.
Vaccinating teachers and staff is a powerful tool for pro-tecting this critical workforce. If vaccines effectively block
SARS-CoV-2 transmission in addition to COVID-19 symptoms,vaccinating teachers and staff can significantly dampen outbreakdynamics in both primary and secondary schools. The resultwould be fewer cases among adults and students alike.
The success of reopening efforts will hinge on the amountof transmission that occurs in schools. The higher the trans-missibility, parameterized here as R0, the greater the chanceof substantial outbreaks in a school setting. Physical distancing,diligent use of masks, and other environmental controls offera first-line approach to reducing transmission and will be animportant component of reopening plans.
For both primary and secondary schools, the risk of an out-break increases as cases in the surrounding community rise. Oneof the most effective ways to safely reopen schools is by con-trolling COVID-19 in the community. Surveillance should be inplace to monitor levels of community transmission, and schoolsshould be prepared to respond flexibly.
Because highly transmissible variants such as B.1.1.7 poseincreased risks for outbreaks, schools need to be vigilant onmultiple fronts. First, where genomic surveillance is available,school districts and counties need to monitor the introductionand spread of these variants. Second, irrespective of the vari-ants involved, it will be important to monitor epidemic dynamicswithin any given school and to respond quickly should uncon-trolled spread take place. An additional virtue of testing is thatit facilitates early detection of such events. We have not explic-itly modeled surveillance testing and response, but general publichealth guidance should be followed. For example, schools couldimplement “tripwire” strategies, returning to distance learningfor a period of time in response to in-school outbreaks or risingcommunity prevalence. In the event of isolated cases appearingat higher than expected rates, administrators should recon-sider assumptions about the rate of community introduction andintensify control measures accordingly.
Our model suggests that, under certain parameters, it maybecome difficult or impossible to keep the probability of out-breaks low across the schools of an entire district. Tripwirestrategies may be necessary under these circumstances.
While gaps remain in our understanding of transmissionin school settings, both real-world experience and models—including the one presented here—suggest a path forward forschools to reopen, particularly when community transmission islow and when it is possible to deploy and consistently implementthe mitigation measures we have modeled here.
Data Availability. Python code used to instantiate and run themodels, and the simulation data tables, have been deposited inZenodo (https://doi.org/10.5281/zenodo.5237328) (77).
ACKNOWLEDGMENTS. We thank Martin Rosvall for help in developing thecontact network structures used in the SEIRS+ model. Ted Bergstrom, NatalieDean, Bill Hanage, Michael Lachmann, and Marc Lipsitch provided valuablefeedback in developing the model and adapting it to the school scenar-ios considered here. This work was facilitated through the use of advancedcomputational, storage, and networking infrastructure provided by theHyak supercomputer system and funded by the student technology fee atthe University of Washington.
1. United Nations Educational, Scientific and Cultural Organization, 1.3 billion learnersare still affected by school or university closures. https://en.unesco.org/news/13-billion-learners-are-still-affected-school-university-closures-educational-institutions.Accessed 9 November 2020.
2. E. Hanushek, L. Woessmann, The economic impacts of learning losses.https://doi.org/10.1787/21908d74-en. Accessed 1 February 2021.
3. A. Nierenberg, A. Pasick, Will any more schools reopen in 2020? NY Times,11 November 2020. https://www.nytimes.com/2020/11/11/us/will-any-more-schools-reopen-in-2020.html. Accessed 1 February 2021.
4. E. Leidman, COVID-19 trends among persons aged 0–24 years — United States,March 1–December 12, 2020. MMWR Morb. Mortal. Wkly. Rep. 70, 88–94(2021).
5. R. P., Walensky, H. T. Walke, A. S. Fauci, SARS-CoV-2 variants of concern in the UnitedStates challenges and opportunities. JAMA 325, 1037–1038 (2021).
6. G. Giordano et al., Modelling the COVID-19 epidemic and implementation ofpopulation-wide interventions in Italy. Nat. Med. 26, 855–860 (2020).
7. Centers for Disease Control and Prevention, COVID-19 forecasts: Deaths.https://www.cdc.gov/coronavirus/2019-ncov/covid-data/forecasting-us.html. Accessed7 January 2021.
8. M. Neil, Ferguson. Report 9: Impact of Non-pharmaceutical Interventions (NPIs) toReduce COVID19 Mortality and Healthcare Demand (Imperial College London, 2020).
9. J. Adam et al.; Centre for Mathematical Modelling of Infectious Diseases COVID-19 working group, Early dynamics of transmission and control of COVID-19: Amathematical modelling study. Lancet Infect. Dis. 20, 553–558 (2020).
10. M. Corey et al., Individual quarantine versus active monitoring of contacts for themitigation of COVID-19: A modelling study. Lancet Infect. Dis. 20, 1025–1033 (2020).
11. A. Aleta et al., Modelling the impact of testing, contact tracing and householdquarantine on second waves of COVID-19. Nat. Hum. Behav. 4, 964–971 (2020).
8 of 10 | PNAShttps://doi.org/10.1073/pnas.2108909118
McGee et al.Model-driven mitigation measures for reopening schools during the COVID-19 pandemic
Dow
nloa
ded
by g
uest
on
Janu
ary
29, 2
022

MED
ICA
LSC
IEN
CES
12. X. Wang et al., Effects of cocooning on coronavirus disease rates after relaxing socialdistancing. Emerg. Infect. Dis. 26, 3066–3068 (2020).
13. A. Bershteyn, H.-Y. Kim, J. B. McGillen, R. Scott Braithwaite, Which policies mosteffectively reduce SARS-CoV-2 transmission in schools? medRxiv [Preprint] (2020).https://doi.org/10.1101/2020.11.24.20237305 (Accessed 1 February 2021).
14. C. Bracis et al., Widespread testing, case isolation and contact tracing may allow safeschool reopening with continued moderate physical distancing: A modeling analysisof King County, WA data. Infect. Dis. Model. 6, 24–35 (2020).
15. A. M. Bilinski, J. A. Salomon, J. Giardina, A. Ciaranello, M. Fitzpatrick, Passing thetest: A model-based analysis of safe school-reopening strategies. medRxiv [Preprint](2021). https://doi.org/10.1101/2021.01.27.21250388 (Accessed 1 February 2021).
16. E. Goldstein, M. Lipsitch, M. Cevik, On the effect of age on the transmission ofSARS-CoV-2 in households, schools and the community. J. Infect. Dis. 223, 362–369(2021).
17. S. A. Ismail, V. Saliba, J. Lopez Bernal, M. E. Ramsay, S. N. Ladhani, SARS-CoV-2 infec-tion and transmission in educational settings: A prospective, cross-sectional analysisof infection clusters and outbreaks in England. Lancet Infect. Dis. 21, 344–353(2021).
18. C. Stein-Zamir et al., A large COVID-19 outbreak in a high school 10 days after schools’reopening, Israel, May 2020. Euro Surveill. 25, 2001352 (2020).
19. AASA, The School Superintendents Association, Covid-19 school response dashboard.https://covidschooldashboard.com. Accessed 11 December 2020.
20. M. R. Viner et al., Susceptibility to SARS-CoV-2 infection among children and adoles-cents compared with adults: A systematic review and meta-analysis. JAMA Pediatr.175, 143–156 (2021).
21. R. Assaker et al., Presenting symptoms of COVID-19 in children: A meta-analysis ofpublished studies. Br. J. Anaesth. 125, e330–e332 (2020).
22. L. Rajmil, Role of children in the transmission of the COVID-19 pandemic: A rapidscoping review. BMJ Paediatr. Open 4, e000722 (2020).
23. M. J. Keeling, P. Rohani, Modeling Infectious Diseases in Humans and Animals(Princeton University Press, 2011).
24. L. Danon, T. A. House, J. M. Read, M. J. Keeling, Social encounter networks: Col-lective properties and disease transmission. J. R. Soc. Interface 9, 2826–2833(2012).
25. J. Badham, R. Stocker, The impact of network clustering and assortativity on epidemicbehaviour. Theor. Popul. Biol. 77, 71–75 (2010).
26. J. Mossong et al., Social contacts and mixing patterns relevant to the spread ofinfectious diseases. PLoS Med. 5, e74 (2008).
27. A. Endo, S. Abbott, A. Kucharski, S. Funk, Estimating the overdispersion in COVID-19 transmission using outbreak sizes outside China. Wellcome Open Res. 5, 67(2020).
28. A. Dillon et al., Clustering and superspreading potential of severe acute respiratorysyndrome coronavirus 2 (SARS-CoV-2) infections in Hong Kong. Nat. Med. 26, 1714–1719 (2020).
29. M. B. Althouse et al., Stochasticity and heterogeneity in the transmission dynamicsof SARS-CoV-2. arXiv [Preprint] (2020). https://arxiv.org/abs/2005.13689 (Accessed 1February 2021).
30. Q. Li et al., Early transmission dynamics in Wuhan, China, of novel coronavirus-infected pneumonia. N. Engl. J. Med. 382, 1199–1207 (2020).
31. The Royal Society, Royal society publishes rapid review of the science of the reproduc-tion number and growth rate of COVID-19. https://royalsociety.org/news/2020/09/set-c-covid-r-rate/. Accessed 17 January 2021.
32. J. M. Read, J. R. E. Bridgen, D. A. T. Cummings, A. Ho, C. P. Jewell, Novel coronavirus2019-nCoV: Early estimation of epidemiological parameters and epidemic predictions.medRxiv [Preprint] (2020). https://doi.org/10.1101/2020.01.23.20018549 (Accessed 1February 2021).
33. Centers for Disease Control and Prevention, Healthcare workers. https://www.cdc.gov/coronavirus/2019-ncov/hcp/planning-scenarios.html. Accessed 17 January 2021.
34. Y. Liu, A. A. Gayle, A. Wilder-Smith, J. Rocklov, The reproductive number ofCOVID-19 is higher compared to SARS coronavirus. J. Travel Med. 27, taaa021(2020).
35. S. E. Galloway et al., Emergence of SARS-CoV-2 b.1.1.7 lineage — United States,December 29, 2020–January 12, 2021. MMWR Morb. Mortal. Wkly. Rep. 70 95–99(2021).
36. Centers for Disease Control and Prevention, Options to reduce quarantine forcontacts of persons with SARS-CoV-2 infection using symptom monitoring anddiagnostic testing. https://www.cdc.gov/coronavirus/2019-ncov/more/scientific-brief-options-to-reduce-quarantine.html. Accessed 16 December 2020.
37. J. Poline et al., Systematic SARS-CoV-2 screening at hospital admission in children: AFrench prospective multicenter study. Clin. Infect. Dis. 72, 2215–2217 (2020).
38. M. Salathe et al., A high-resolution human contact network for infectious diseasetransmission. Proc. Natl. Acad. Sci. U.S.A. 107, 22020–22025 (2010).
39. C. V. Barclay et al., Positive network assortativity of influenza vaccination at a highschool: Implications for outbreak risk and herd immunity. PLoS One 9, e87042(2014).
40. J. Zhang et al., Age profile of susceptibility, mixing, and social distancing shape thedynamics of the novel coronavirus disease 2019 outbreak in China. medRxiv [Preprint](2020). https://doi.org/10.1101/2020.03.19.20039107 (Accessed 1 February 2021).
41. J. M. Read, K. T. D. Eames, W. John Edmunds, Dynamic social networks and theimplications for the spread of infectious disease. J. R. Soc. Interface 5, 1001–1007(2008).
42. B. Korber et al.; Sheffield COVID-19 Genomics Group, Tracking changes in SARS-CoV-2 spike: Evidence that D614G increases infectivity of the COVID-19 virus. Cell 182,812–827.e19 (2020).
43. K. Leung, M. H. Shum, G. M. Leung, T. T. Lam, J. T. Wu. Early transmissibility assess-ment of the N501Y mutant strains of SARS-CoV-2 in the United Kingdom, October toNovember 2020. Euro Surveill. 26, 2002106 (2021).
44. N. Davies et al., Data from “Estimated transmissibility and impact of SARS-CoV-2lineage B.1.1.7 in England.” GitHub. https://cmmid.github.io/topics/covid19/uk-novel-variant.html. Accessed 1 February 2021.
45. L. N. Washington et al., Genomic epidemiology identifies emergence and rapidtransmission of SARS-CoV-2 B.1.1.7 in the United States. medRxiv [Preprint] (2021).https://doi.org/10.1101/2021.02.06.21251159 (Accessed 1 February 2021).
46. C. A. B. Pearson et al., Data from “Estimates of severity and transmissibility ofnovel SARS-CoV-2 variant 501Y.V2 in South Africa.” GitHub. https://cmmid.github.io/topics/covid19/sa-novel-variant.html. Accessed 1 February 2021.
47. M. Hoffmann et al., SARS-CoV-2 variant B.1.617 is resistant to Bamlanivimab andevades antibodies induced by infection and vaccination. bioRxiv [Preprint] (2021).https://doi.org/10.1101/2021.05.04.442663 (Accessed 1 May 2021).
48. O. Karin et al., Cyclic exit strategies to suppress COVID-19 and allow economic activ-ity. medRxiv [Preprint] (2020). https://doi.org/10.1101/2020.04.04.20053579 (Accessed1 February 2021).
49. O. K. Zimmerman et al.; ABC Science Collaborative, Incidence and secondarytransmission of SARS-CoV-2 infections in schools. Pediatrics 147, e2020048090(2021).
50. E. Otte Im Kampe, A.-S. Lehfeld, S. Buda, U. Buchholz, W. Haas, Surveillance of COVID-19 school outbreaks, Germany, March to August 2020. Euro Surveill. 25, 2001645(2020).
51. B. D. Larremore et al., Test sensitivity is secondary to frequency and turnaround timefor COVID-19 screening. Sci. Adv. 7, eabd5393 (2020).
52. N. T. Denny et al., Implementation of a pooled surveillance testing program forasymptomatic SARS-CoV-2 infections on a college campus – Duke University, Durham,North Carolina, August 2–October 11, 2020. MMWR Morb. Mortal. Wkly. Rep. 69,1743–1747 (2020).
53. J. L. Faherty et al., “COVID-19 testing in KSchools: Insights from early adopters” (Res.Rep. RR-A1103-1, RAND Corporation, 2021).
54. T. Bergstrom, C. T. Bergstrom, H. Li, Frequency and accuracy of proactive testingfor COVID-19. medRxiv [Preprint] (2020). https://doi.org/10.1101/2020.09.05.20188839(Accessed 1 February 2021).
55. J. Homburger, H. Williams, A. Zhou, Return to on-site SARS-CoV-2 test-ing protocols. https://www.color.com/wp-content/uploads/2020/08/FINAL-v7-Color-Return-to-On-Site-Testing v7C 072320.pdf. Accessed 1 July 2020.
56. R. L. Baden et al., Efficacy and safety of the mRNA-1273 SARS-CoV-2 vaccine. N. Engl.J. Med. 384, 403–416 (2020).
57. P. F. Polack et al., Safety and efficacy of the BNT162b2 mRNA covid-19 vaccine. N. Engl.J. Med. 383, 2603–2615 (2020).
58. N. Dagan et al., BNT162b2 mRNA covid-19 vaccine in a nationwide mass vaccinationsetting. N. Engl. J. Med. 384, 1412–1423 (2021).
59. J. E. Haas et al., Impact and effectiveness of mRNA BNT162b2 vaccine againstSARS-CoV-2 infections and COVID-19 cases, hospitalisations, and deaths followinga nationwide vaccination campaign in Israel: An observational study using nationalsurveillance data. Lancet 397, 1819–1829 (2021).
60. G. M. Thompson, Interim estimates of vaccine effectiveness of BNT162b2 and mRNA-1273 COVID-19 vaccines in preventing SARS-CoV-2 infection among health carepersonnel, first responders, and other essential and frontline workers eight U.S. loca-tions, December 2020 March 2021. MMWR Morb. Mortal. Wkly. Rep. 70, 495–500(2021).
61. D. M. Swift, et al., Effectiveness of mRNA COVID-19 vaccines against SARS-CoV-2infection in a cohort of healthcare personnel. Clin. Infect. Dis., 10.1093/cid/ciab361(2021).
62. E. Petter et al., Initial real world evidence for lower viral load of individuals who havebeen vaccinated by BNT162b2. medRxiv [Preprint] (2021). https://doi.org/10.1101/2021.02.08.21251329 (Accessed 1 February 2021).
63. M. Levine-Tiefenbrun et al., Initial report of decreased SARS-CoV-2 viral load afterinoculation with the BNT162b2 vaccine. Nat. Med. 27, 790–792 (2021).
64. S. A. Ismail, V. Saliba, J. Lopez Bernal, M. E. Ramsay, S. Ladhani, SARS-CoV-2 infec-tion and transmission in educational settings: Cross-sectional analysis of clustersand outbreaks in England. medRxiv [Preprint] (2020). https://doi.org/10.1101/2020.08.21.20178574 (Accessed 1 February 2021).
65. L. Heavey, G. Casey, C. Kelly, D. Kelly, G. McDarby, No evidence of secondary trans-mission of COVID-19 from children attending school in Ireland, 2020. Euro Surveill.25, 2000903 (2020).
66. K. Macartney et al.; NSW COVID-19 Schools Study Team, Transmission of SARS-CoV-2in Australian educational settings: A prospective cohort study. Lancet Child Adolesc.Health 4, 807–816 (2020).
67. J. Panovska-Griffiths et al., Determining the optimal strategy for reopening schools,the impact of test and trace interventions, and the risk of occurrence of a secondCOVID-19 epidemic wave in the UK: A modelling study. Lancet Child Adolesc. Health4, 817–827 (2020).
68. Centers for Disease Control and Prevention, Operating schools during COVID-19. https://www.cdc.gov/coronavirus/2019-ncov/community/schools-childcare/schools.html. Accessed 17 January 2021.
69. D. L. Gillespie, The experience of two independent schools with in-person learningduring the covid-19 pandemic. J. Sch. Health 91, 347–355 (2021).
70. R. Carsetti et al., The immune system of children: The key to understanding SARS-CoV-2 susceptibility? Lancet Child Adolesc. Health 4, 414–416 (2020).
71. S. Bunyavanich, A. Do, A. Vicencio, Nasal gene expression of angiotensin-convertingenzyme 2 in children and adults. JAMA 323, 2427–2429 (2020).
McGee et al.Model-driven mitigation measures for reopening schools during the COVID-19 pandemic
PNAS | 9 of 10https://doi.org/10.1073/pnas.2108909118
Dow
nloa
ded
by g
uest
on
Janu
ary
29, 2
022

72. T. Rebecca et al., COVID-19 trends among school-aged children – United States,March 1–September 19, 2020. MMWR Morb. Mortal. Wkly. Rep. 69, 1410–1415(2020).
73. L. Ferretti et al., Quantifying SARS-CoV-2 transmission suggests epidemic control withdigital contact tracing. Science 368 eabb6936 (2020).
74. M. S. Moghadas et al., The implications of silent transmission for the con-trol of COVID-19 outbreaks. Proc. Natl. Acad. Sci. U.S.A. 117, 17513–17515(2020).
75. A. A. Sayampanathan, Infectivity of asymptomatic versus symptomatic COVID-19.Lancet 397, 93–94 (2021).
76. T. L. Brandal et al., Minimal transmission of SARS-CoV-2 from paediatric COVID-19 cases in primary schools, Norway, August to November 2020. Euro Surveill. 26,2002011 (2021).
77. R. S. McGee, J. Homburger, H. Williams, C. T. Bergstrom, A. Zhou, Model-driven mit-igation measures for reopening schools during the COVID-19 pandemic. Zenodo.https://doi.org/10.5281/zenodo.5237328. Deposited 23 August 2021.
10 of 10 | PNAShttps://doi.org/10.1073/pnas.2108909118
McGee et al.Model-driven mitigation measures for reopening schools during the COVID-19 pandemic
Dow
nloa
ded
by g
uest
on
Janu
ary
29, 2
022