Embed Size (px)
Citation preview
1
Model-Based
Flight Software Development
Flight Software Pathfinder
2011 Flight Software Workshop
October 19-21, 2011
Claire Hopkins [email protected]
Gary Shubert [email protected]
Lockheed Martin Space Systems Company
© 2011 Lockheed Martin Corporation. All Rights Reserved

2
FSW Pathfinder – Introduction
The Flight Software Pathfinder
• A software modeling demonstration activity
• Performed to directly compare the productivity,
quality, advantages, and disadvantages of: • A typical heritage, documentation centric flight software
development process
• Integrated, model based flight software development process using graphical modeling tools
3
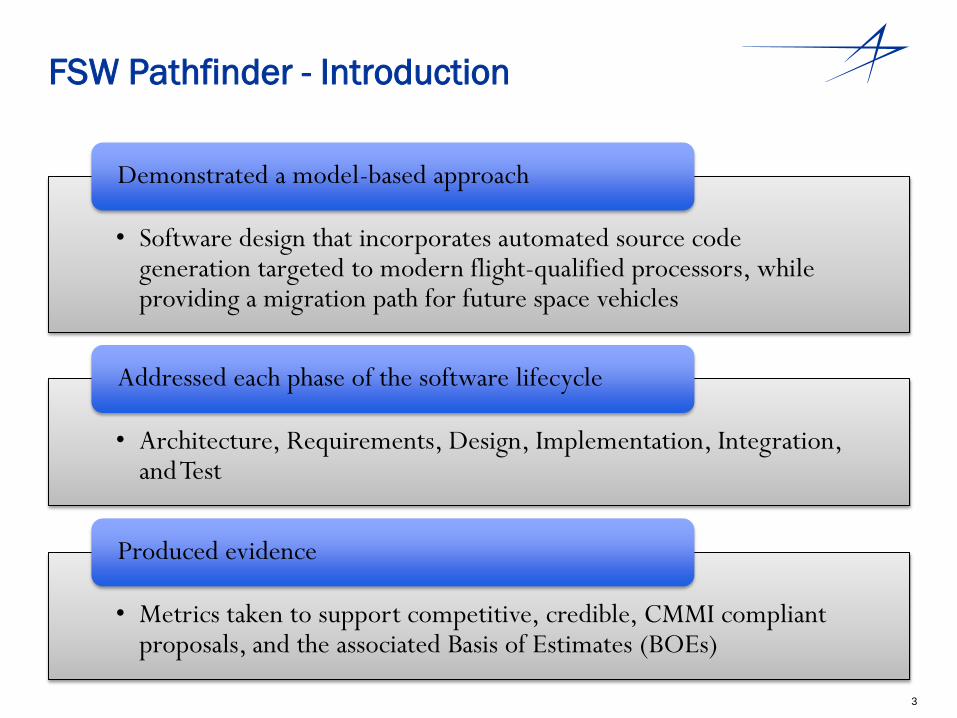
FSW Pathfinder - Introduction
• Software design that incorporates automated source code generation targeted to modern flight-qualified processors, while providing a migration path for future space vehicles
Demonstrated a model-based approach
• Architecture, Requirements, Design, Implementation, Integration, and Test
Addressed each phase of the software lifecycle
• Metrics taken to support competitive, credible, CMMI compliant proposals, and the associated Basis of Estimates (BOEs)
Produced evidence
4
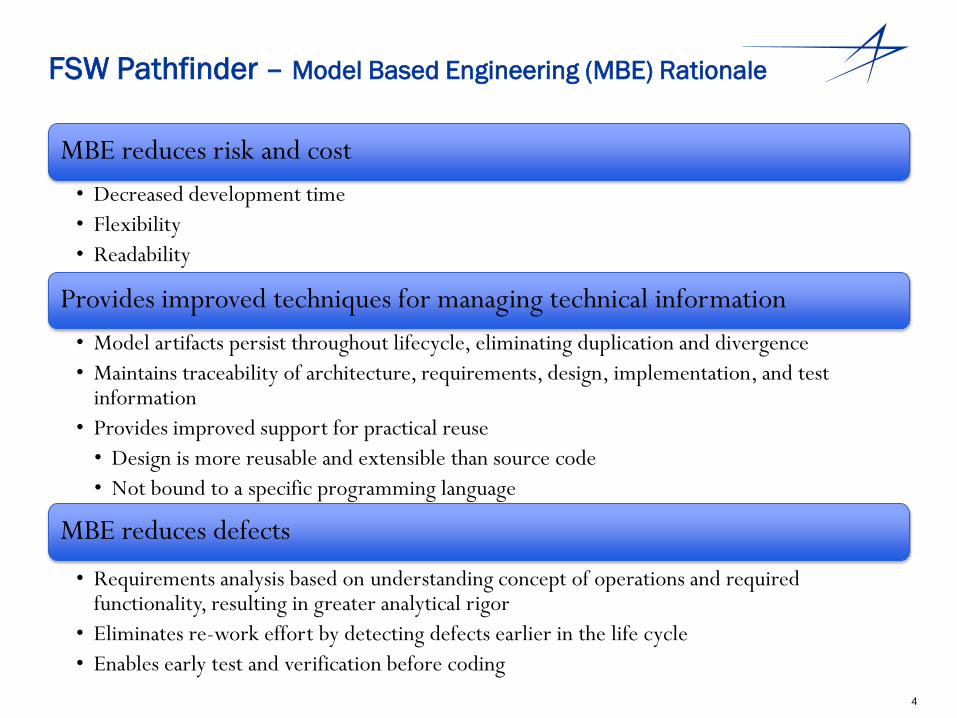
MBE reduces risk and cost
• Decreased development time
• Flexibility
• Readability
Provides improved techniques for managing technical information
• Model artifacts persist throughout lifecycle, eliminating duplication and divergence
• Maintains traceability of architecture, requirements, design, implementation, and test information
• Provides improved support for practical reuse
• Design is more reusable and extensible than source code
• Not bound to a specific programming language
MBE reduces defects
• Requirements analysis based on understanding concept of operations and required functionality, resulting in greater analytical rigor
• Eliminates re-work effort by detecting defects earlier in the life cycle
• Enables early test and verification before coding
FSW Pathfinder – Model Based Engineering (MBE) Rationale

5
FSW Pathfinder – Objectives
1. Leverage Model Based System Design (MBSD) to: – Increase software productivity & quality
– Reduce software risk & schedule
2. Demonstrate the fundamental tenets of an efficient Model Based approach to flight software development, integration, and test
– Modeling Maturity
– Model Driven Architecture
– Graphical Models & Domain Specific Languages
– Code & Test Automation
3. Compare the efficiency and quality of the MBSD approach for software lifecycle activities against the heritage approach
– Collect, analyze and report both quantitative and qualitative measures for each approach.
– Prove the value of MBSD for flight software development, integration, and test.
4. Produce supporting products for use by programs applying MBSD software development.
– Standard Modeling Methods process guidebook for modeling tools and methods.
– Basis of Estimate templates & supporting metrics for proposing MBSD software activities.
– Identify deficiencies and the associated improvements required to optimize the processes and tools.

6
FSW Pathfinder – Process (slide 1 of 2)
Model-Based
• Both GNC and EPS use UML for Architecture and Requirements analysis
• GNC using domain specific tools Matlab / Simulink
• Fully auto-generated code
• EPS using general OOA/D UML with IBM Rational Rhapsody
• Semi auto generated code, adding implementation detail by hand
Heritage
• Documentation centric approach
• Documents and drawings using Microsoft Office
• Hand generated code
• Develop 3 Incremental Subsets of Flight Software Functionality – GNC and EPS subject matter domains.
– 2 independent SW engineers per domain.
• Each SW engineer applies both approaches incrementally
7
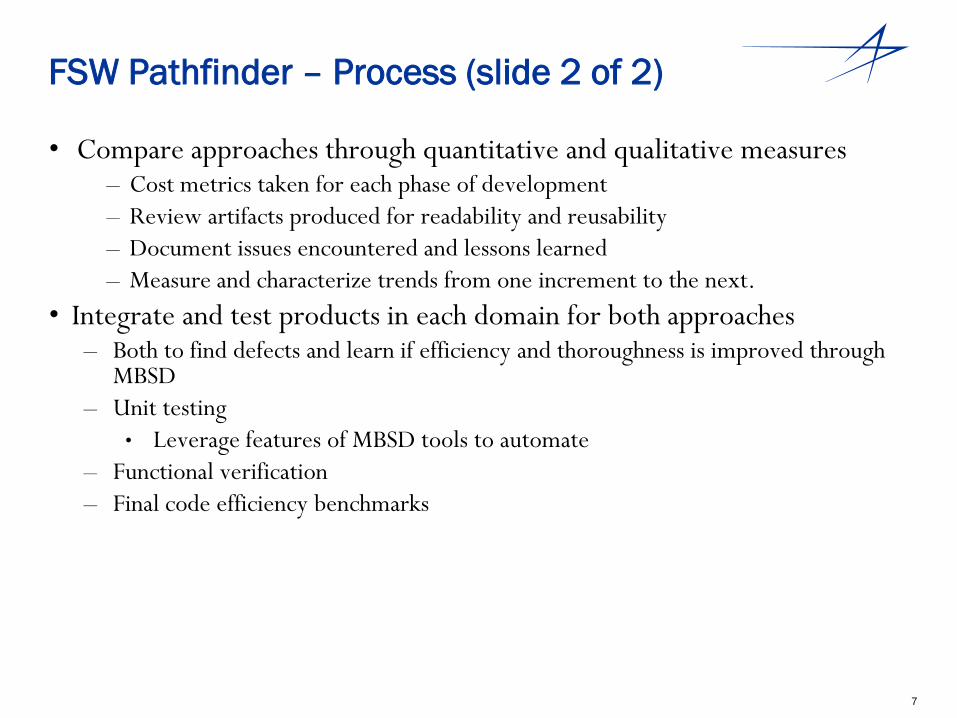
FSW Pathfinder – Process (slide 2 of 2)
• Compare approaches through quantitative and qualitative measures – Cost metrics taken for each phase of development
– Review artifacts produced for readability and reusability
– Document issues encountered and lessons learned
– Measure and characterize trends from one increment to the next.
• Integrate and test products in each domain for both approaches – Both to find defects and learn if efficiency and thoroughness is improved through
MBSD
– Unit testing
• Leverage features of MBSD tools to automate
– Functional verification
– Final code efficiency benchmarks

8
FSW Pathfinder – Modeling Tools

9
FSW Pathfinder – MBSD Artifacts
Package Diagram
Systems Functionality
Sequence & Timing Description
(SV-10 A,B,C)
A B CNodes
Time
T1
T2
T3
System Functionality Description
(SV-4)
Systems – System Matrix
(SV-3)
Activity to System Function
(SV-5)
Systems Data Exchange Matrix
(SV-6)
Systems Performance Matrix
(SV-7)
Information Exchange Matrix
(OV-3)
Technical Architecture Profile
(TV-1)
Standards Technology Forecast
(TV-2)
Systems Technology Forecast
(SV-9)
Physical Schema
(SV-11)
Systems Interface Description
(SV-1)
Systems Evolution Description
(SV-8)
Operational Activity
Sequence & Timing Description
(OV-6 A,B,C)
A B CNodes
Time
T1
T2
T3
Operational Concept Description
(OV-1)
Node Connectivity Description
(OV-2)
Operational Activity Model
(OV-5)
Organizational Relationships Chart
(OV-4)
Systems Communications Description
(SV-2)
Logical Data Model
(OV-7)
Block Definition Diagram Internal Block Diagram Parametric Diagram
Requirements Diagram
Use Case Diagram Activity DiagramSequence Diagram State Chart DiagramDepicts
Model
Organization
Of
Domain Specific Modeling
Platform Independent Modeling
Systems Engineering – Models Subsystems, Components and the Associated Activities, Functionality, Requirements, Interfaces, Technologies & Performance
Use Case Diagram Sequence DiagramDomain Diagram
Software System Engineering – Models Component Structure, Functionality, Requirements, Interfaces, Technologies & Performance
Software Engineering – Models Domains
Activity Diagram
DoDAF
UML/SysML
UML/SysML
Component &
Platform Specific
Modeling
Depicts
Requirement
Hierarchy
Of
Systems Engineering – Models SoS, Systems & Nodes and the Associated Activities, Functionality, Requirements, Interfaces, Technologies & Performance
State Chart DiagramClass Diagram
MatrxX / Matlab / Simulink Object Oriented / UML Graphical User Interface Data BaseLabViews
Parametric Diagram
Package DiagramPackage Diagram
Systems Functionality
Sequence & Timing Description
(SV-10 A,B,C)
A B CNodes
Time
T1
T2
T3
Systems Functionality
Sequence & Timing Description
(SV-10 A,B,C)
A B CNodes
Time
T1
T2
T3
A B CNodes
Time
T1
T2
T3
System Functionality Description
(SV-4)
System Functionality Description
(SV-4)
Systems – System Matrix
(SV-3)
Systems – System Matrix
(SV-3)
Activity to System Function
(SV-5)
Activity to System Function
(SV-5)
Systems Data Exchange Matrix
(SV-6)
Systems Data Exchange Matrix
(SV-6)
Systems Performance Matrix
(SV-7)
Systems Performance Matrix
(SV-7)
Information Exchange Matrix
(OV-3)
Information Exchange Matrix
(OV-3)
Technical Architecture Profile
(TV-1)
Technical Architecture Profile
(TV-1)
Standards Technology Forecast
(TV-2)
Standards Technology Forecast
(TV-2)
Systems Technology Forecast
(SV-9)
Systems Technology Forecast
(SV-9)
Physical Schema
(SV-11)
Physical Schema
(SV-11)
Systems Interface Description
(SV-1)
Systems Interface Description
(SV-1)
Systems Evolution Description
(SV-8)
Systems Evolution Description
(SV-8)
Operational Activity
Sequence & Timing Description
(OV-6 A,B,C)
A B CNodes
Time
T1
T2
T3
Operational Activity
Sequence & Timing Description
(OV-6 A,B,C)
A B CNodes
Time
T1
T2
T3
A B CNodes
Time
T1
T2
T3
Operational Concept Description
(OV-1)
Operational Concept Description
(OV-1)
Node Connectivity Description
(OV-2)
Node Connectivity Description
(OV-2)
Operational Activity Model
(OV-5)
Operational Activity Model
(OV-5)
Organizational Relationships Chart
(OV-4)
Organizational Relationships Chart
(OV-4)
Systems Communications Description
(SV-2)
Systems Communications Description
(SV-2)
Logical Data Model
(OV-7)
Logical Data Model
(OV-7)
Block Definition DiagramBlock Definition Diagram Internal Block DiagramInternal Block Diagram Parametric DiagramParametric Diagram
Requirements DiagramRequirements Diagram
Use Case DiagramUse Case Diagram Activity DiagramActivity DiagramSequence DiagramSequence Diagram State Chart DiagramState Chart DiagramDepicts
Model
Organization
Of
Domain Specific Modeling
Platform Independent Modeling
Systems Engineering – Models Subsystems, Components and the Associated Activities, Functionality, Requirements, Interfaces, Technologies & Performance
Use Case DiagramUse Case Diagram Sequence DiagramSequence DiagramDomain DiagramDomain Diagram
Software System Engineering – Models Component Structure, Functionality, Requirements, Interfaces, Technologies & Performance
Software Engineering – Models Domains
Activity DiagramActivity Diagram
DoDAF
UML/SysML
UML/SysML
Component &
Platform Specific
Modeling
Depicts
Requirement
Hierarchy
Of
Systems Engineering – Models SoS, Systems & Nodes and the Associated Activities, Functionality, Requirements, Interfaces, Technologies & Performance
State Chart DiagramState Chart DiagramClass DiagramClass Diagram
MatrxX / Matlab / Simulink Object Oriented / UML Graphical User Interface Data BaseLabViewsMatrxX / Matlab / Simulink Object Oriented / UML Graphical User Interface Data BaseLabViews
Parametric DiagramParametric Diagram
Focus of 2011 SW Pathfinder
Focus
of 2010
FSW
Pathfinder
10
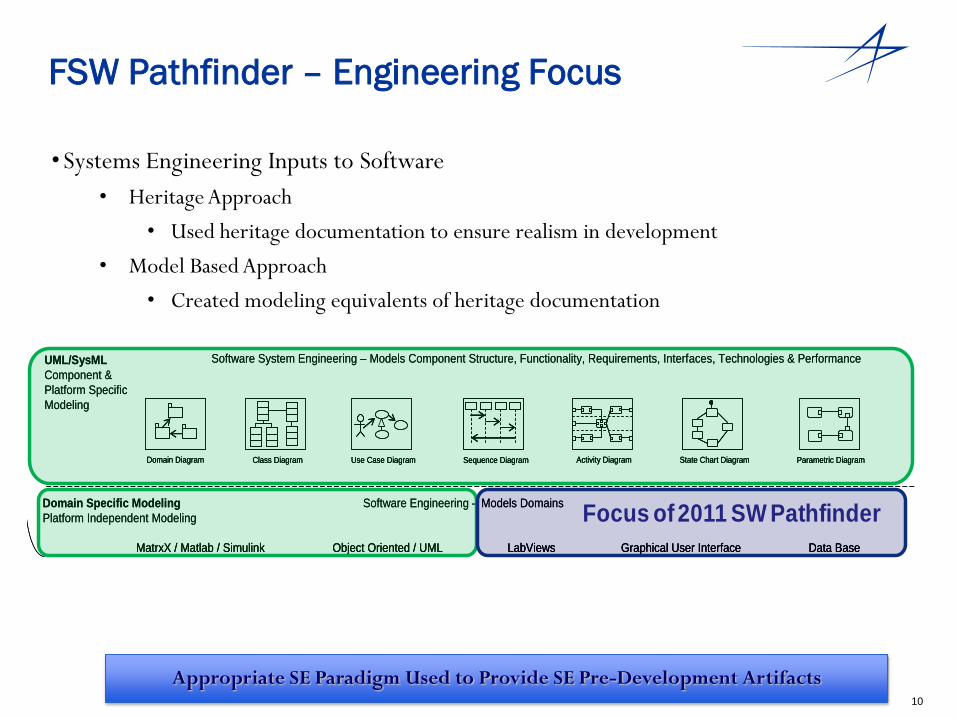
FSW Pathfinder – Engineering Focus
Appropriate SE Paradigm Used to Provide SE Pre-Development Artifacts
•Systems Engineering Inputs to Software
• Heritage Approach
• Used heritage documentation to ensure realism in development
• Model Based Approach
• Created modeling equivalents of heritage documentation Package Diagram
Systems Functionality
Sequence & Timing Description
(SV-10 A,B,C)
A B CNodes
Time
T1
T2
T3
System Functionality Description
(SV-4)
Systems – System Matrix
(SV-3)
Activity to System Function
(SV-5)
Systems Data Exchange Matrix
(SV-6)
Systems Performance Matrix
(SV-7)
Information Exchange Matrix
(OV-3)
Technical Architecture Profile
(TV-1)
Standards Technology Forecast
(TV-2)
Systems Technology Forecast
(SV-9)
Physical Schema
(SV-11)
Systems Interface Description
(SV-1)
Systems Evolution Description
(SV-8)
Operational Activity
Sequence & Timing Description
(OV-6 A,B,C)
A B CNodes
Time
T1
T2
T3
Operational Concept Description
(OV-1)
Node Connectivity Description
(OV-2)
Operational Activity Model
(OV-5)
Organizational Relationships Chart
(OV-4)
Systems Communications Description
(SV-2)
Logical Data Model
(OV-7)
Block Definition Diagram Internal Block Diagram Parametric Diagram
Requirements Diagram
Use Case Diagram Activity DiagramSequence Diagram State Chart DiagramDepicts
Model
Organization
Of
Domain Specific Modeling
Platform Independent Modeling
Systems Engineering – Models Subsystems, Components and the Associated Activities, Functionality, Requirements, Interfaces, Technologies & Performance
Use Case Diagram Sequence DiagramDomain Diagram
Software System Engineering – Models Component Structure, Functionality, Requirements, Interfaces, Technologies & Performance
Software Engineering – Models Domains
Activity Diagram
DoDAF
UML/SysML
UML/SysML
Component &
Platform Specific
Modeling
Depicts
Requirement
Hierarchy
Of
Systems Engineering – Models SoS, Systems & Nodes and the Associated Activities, Functionality, Requirements, Interfaces, Technologies & Performance
State Chart DiagramClass Diagram
MatrxX / Matlab / Simulink Object Oriented / UML Graphical User Interface Data BaseLabViews
Parametric Diagram
Package DiagramPackage Diagram
Systems Functionality
Sequence & Timing Description
(SV-10 A,B,C)
A B CNodes
Time
T1
T2
T3
Systems Functionality
Sequence & Timing Description
(SV-10 A,B,C)
A B CNodes
Time
T1
T2
T3
A B CNodes
Time
T1
T2
T3
System Functionality Description
(SV-4)
System Functionality Description
(SV-4)
Systems – System Matrix
(SV-3)
Systems – System Matrix
(SV-3)
Activity to System Function
(SV-5)
Activity to System Function
(SV-5)
Systems Data Exchange Matrix
(SV-6)
Systems Data Exchange Matrix
(SV-6)
Systems Performance Matrix
(SV-7)
Systems Performance Matrix
(SV-7)
Information Exchange Matrix
(OV-3)
Information Exchange Matrix
(OV-3)
Technical Architecture Profile
(TV-1)
Technical Architecture Profile
(TV-1)
Standards Technology Forecast
(TV-2)
Standards Technology Forecast
(TV-2)
Systems Technology Forecast
(SV-9)
Systems Technology Forecast
(SV-9)
Physical Schema
(SV-11)
Physical Schema
(SV-11)
Systems Interface Description
(SV-1)
Systems Interface Description
(SV-1)
Systems Evolution Description
(SV-8)
Systems Evolution Description
(SV-8)
Operational Activity
Sequence & Timing Description
(OV-6 A,B,C)
A B CNodes
Time
T1
T2
T3
Operational Activity
Sequence & Timing Description
(OV-6 A,B,C)
A B CNodes
Time
T1
T2
T3
A B CNodes
Time
T1
T2
T3
Operational Concept Description
(OV-1)
Operational Concept Description
(OV-1)
Node Connectivity Description
(OV-2)
Node Connectivity Description
(OV-2)
Operational Activity Model
(OV-5)
Operational Activity Model
(OV-5)
Organizational Relationships Chart
(OV-4)
Organizational Relationships Chart
(OV-4)
Systems Communications Description
(SV-2)
Systems Communications Description
(SV-2)
Logical Data Model
(OV-7)
Logical Data Model
(OV-7)
Block Definition DiagramBlock Definition Diagram Internal Block DiagramInternal Block Diagram Parametric DiagramParametric Diagram
Requirements DiagramRequirements Diagram
Use Case DiagramUse Case Diagram Activity DiagramActivity DiagramSequence DiagramSequence Diagram State Chart DiagramState Chart DiagramDepicts
Model
Organization
Of
Domain Specific Modeling
Platform Independent Modeling
Systems Engineering – Models Subsystems, Components and the Associated Activities, Functionality, Requirements, Interfaces, Technologies & Performance
Use Case DiagramUse Case Diagram Sequence DiagramSequence DiagramDomain DiagramDomain Diagram
Software System Engineering – Models Component Structure, Functionality, Requirements, Interfaces, Technologies & Performance
Software Engineering – Models Domains
Activity DiagramActivity Diagram
DoDAF
UML/SysML
UML/SysML
Component &
Platform Specific
Modeling
Depicts
Requirement
Hierarchy
Of
Systems Engineering – Models SoS, Systems & Nodes and the Associated Activities, Functionality, Requirements, Interfaces, Technologies & Performance
State Chart DiagramState Chart DiagramClass DiagramClass Diagram
MatrxX / Matlab / Simulink Object Oriented / UML Graphical User Interface Data BaseLabViewsMatrxX / Matlab / Simulink Object Oriented / UML Graphical User Interface Data BaseLabViews
Parametric DiagramParametric Diagram
Focus of 2011 SW Pathfinder
Focus
of 2010
FSW
Pathfinder
11
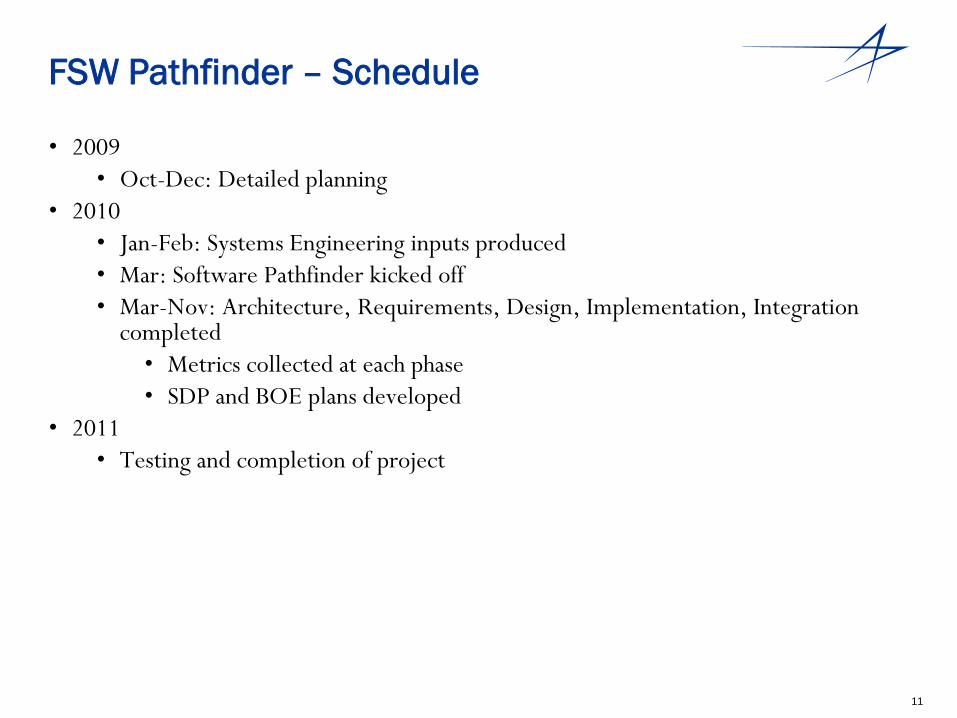
FSW Pathfinder – Schedule
• 2009
• Oct-Dec: Detailed planning
• 2010
• Jan-Feb: Systems Engineering inputs produced
• Mar: Software Pathfinder kicked off
• Mar-Nov: Architecture, Requirements, Design, Implementation, Integration completed
• Metrics collected at each phase
• SDP and BOE plans developed
• 2011
• Testing and completion of project

12
FSW Pathfinder - Context
• Development
– Defined as the Architecture, Requirements, Design and Implementation Activities
– Development comprises approximately 48% of the total NRE software lifecycle cost
• Test & Verification – Defined as the Unit, Integration, and Formal Verification / Qualification Test
Activities
– Test & Verification comprises approximately 52% of the total NRE software lifecycle cost
Method Average Software Development, Test & Verification Lifecycle Percent Relative Effort
0% 10% 20% 30% 40% 50% 60% 70% 80% 90% 100%
1
Ph
ase
/ Act
ivit
y
% of Total
Architecture Requirements Design Implementation Development Test Formal Verif ication
Development Productivity Metrics Test & Verification Metrics
13
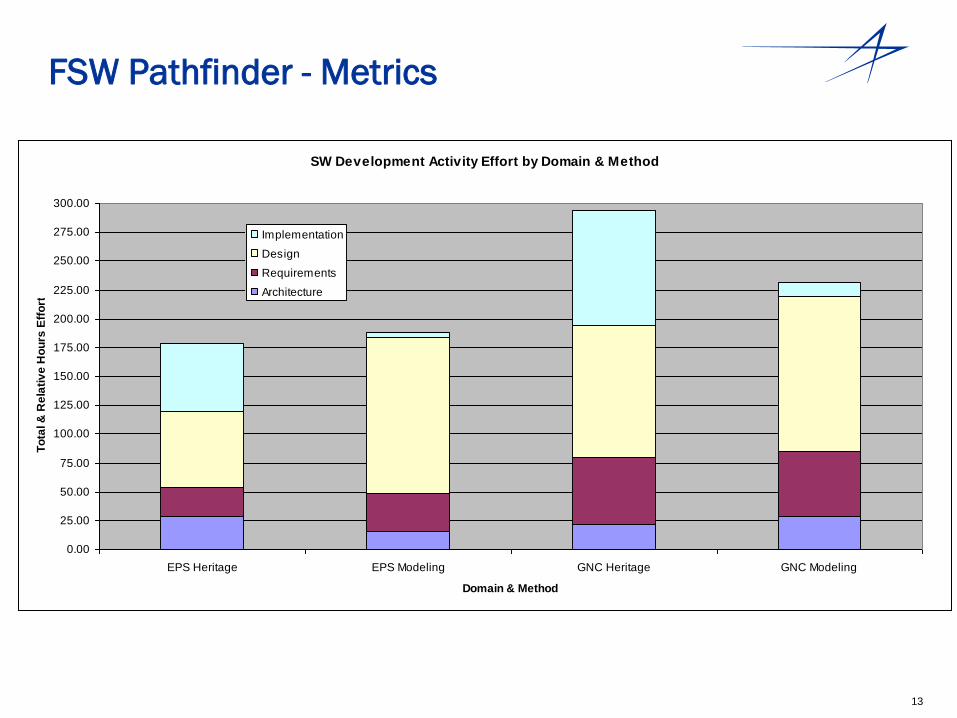
FSW Pathfinder - Metrics
SW Development Activity Effort by Domain & Method
0.00
25.00
50.00
75.00
100.00
125.00
150.00
175.00
200.00
225.00
250.00
275.00
300.00
EPS Heritage EPS Modeling GNC Heritage GNC Modeling
Domain & Method
To
tal &
Re
lati
ve
Ho
urs
Eff
ort
Implementation
Design
Requirements
Architecture

14
FSW Pathfinder – Results (slide 1 of 2)
SW Development Phase Model Based Phase
Development Cost Change
from Heritage Baseline
Model Based Percent Cost
Change of Total
Development
Software Architecture 12% Reduction 1% Reduction
Software Requirements Analysis 10% Increase 2% Increase
Software Design &
Implementation
Simulink: 32% Reduction
UML: 11% Increase
Simulink: 23% Reduction
UML: 8% Increase
Development
(Unit/Integration) Test
Simulink: 60% Reduction
UML: 0% No Difference
Simulink: 11% Reduction
UML: 0% No Difference
Formal Verification /
Qualification
Simulink: 33% Reduction
UML: 5% Reduction
Simulink: 6% Reduction
UML: 1% Reduction

15
FSW Pathfinder – Results (slide 1 of 2)
Net Delta of Development Cost Simulink: 22% Reduction
UML: 8% Increase
Net Delta of total Development, Testing, and
Validation Cost
Simulink: 39% Reduction
UML: 7% Increase (without T&V
improvements)
UML: 8% Reduction (with T&V
improvements)
Defects & Errors Defect Reduction 44%
Error Reduction 50%
Total Results using MBSD

16
FSW Pathfinder – Observations (slide 1 of 2)
Cost Productivity improvements better for both methods with larger code increments
The development effort is reduced for Model-Based Architecture due to greater support
for automated document generation
Model-based Requirements Analysis effort increases slightly due to greater process rigor
More significant Design effort in model-based, due to the increased implementation
detail necessary for model execution. Resulting in significantly decreased Implementation effort
The Testing effort is drastically reduced for the domain specific (Simulink) modeling. Similar benefits are possible for other executable modeling languages
Modeling produced more modular, encapsulated code Higher complexity under static analysis, requires more throughput
Easier to read, debug, and reuse
17
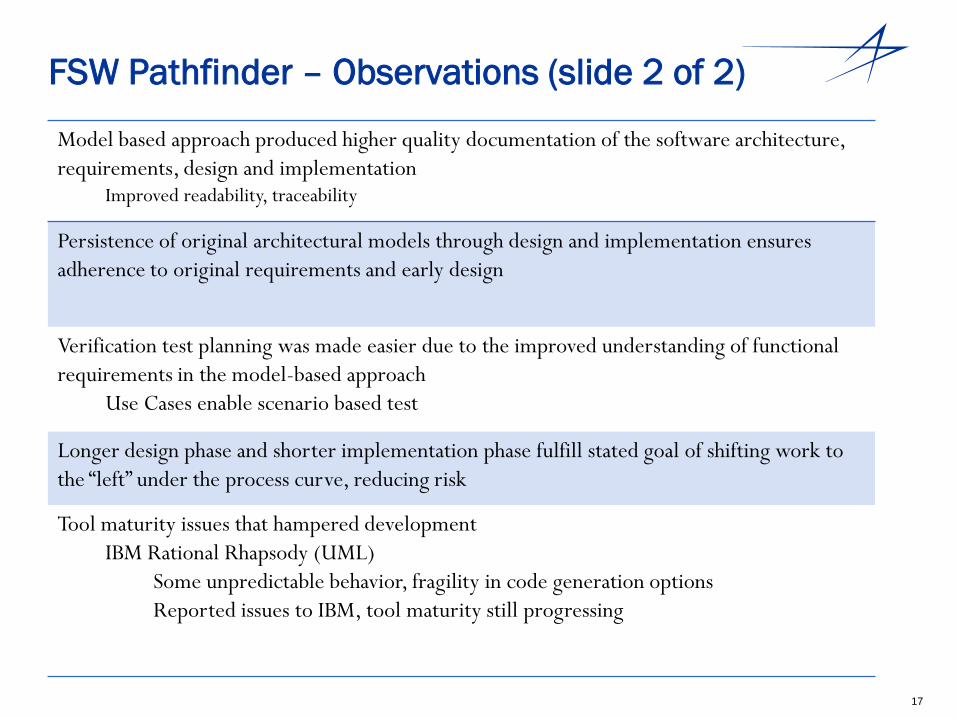
FSW Pathfinder – Observations (slide 2 of 2)
Model based approach produced higher quality documentation of the software architecture,
requirements, design and implementation Improved readability, traceability
Persistence of original architectural models through design and implementation ensures
adherence to original requirements and early design
Verification test planning was made easier due to the improved understanding of functional
requirements in the model-based approach
Use Cases enable scenario based test
Longer design phase and shorter implementation phase fulfill stated goal of shifting work to
the “left” under the process curve, reducing risk
Tool maturity issues that hampered development
IBM Rational Rhapsody (UML)
Some unpredictable behavior, fragility in code generation options
Reported issues to IBM, tool maturity still progressing

18
FSW Pathfinder - Caveats
• The effect of the learning curve was significant
– As developers grew more comfortable with the tools, development time decreased
dramatically (2-3x)
– Once learning curve passed, experienced engineers became more productive with
model-based vs heritage
• Code efficiency was worse for model-based/auto-generated code
– This is consistent with earlier results provided by other programs
– Possible to utilize optimizations and expert features in the tools to improve this
– Code bloat factor of ~2.5 for auto-generated code

19
FSW Pathfinder - Conclusions
• In our results, a 39% reduction from heritage baseline using domain specific modeling for both development and testing
• Generic UML modeling resulted in a small cost increase for development alone, but overall cost decrease when modeling used in testing and verification as well
• Fewer defects and errors reduce cost of rework
• In addition to quantitative cost/time benefits, qualitative benefits of modularity, readability, and reusability are significant
Model-Based Engineering reduces risk and cost of FSW
• For software design and implementation, use domain-specific tools that support executable models, such as Simulink
• Leverage available tools, especially for unit testing and automation
Use the right tools
• Schedule must account for learning curve for first-time developers
• Current capabilities of code generators results in a loss of execution efficiency
• Code optimizations should be investigated and used where possible
• Vendors must improve the quality of their code generators
Avoid pitfalls


![Software Model Checking of ARINC-653 Flight Code with … · Software Model Checking of ARINC-653 Flight Code with MCP ... [13]; it consists of ... rather than on a mod el that has](https://img.dokumen.tips/doc/110x75/5b1ca3e57f8b9aef288b51bc/software-model-checking-of-arinc-653-flight-code-with-software-model-checking.jpg)