Embed Size (px)
Citation preview

Model-Based Evaluation of Expert CellPhone Menu Interaction
ROBERT ST. AMANT and THOMAS E. HORTON
North Carolina State University
and
FRANK E. RITTER
The Pennsylvania State University
We describe concepts to support the analysis of cell phone menu hierarchies, based on cognitive
models of users and easy-to-use optimization techniques. We present an empirical study of user
performance on five simple tasks of menu traversal on an example cell phone. Two of the models
applied to these tasks, based on GOMS and ACT-R, give good predictions of behavior. We use the
empirically supported models to create an effective evaluation and improvement process for menu
hierarchies. Our work makes three main contributions: a novel and timely study of a new, very
common HCI task; new versions of existing models for accurately predicting performance; and a
search procedure to generate menu hierarchies that reduce traversal time, in simulation studies,
by about a third.
Categories and Subject Descriptors: H.5.2 [Information Interfaces and Presentation]: User
Interfaces—Evaluation/methodology
General Terms: Human Factors, Design
ACM Reference Format:St. Amant, R., Horton, T. E., and Ritter, F. E. 2007. Model-based evaluation of expert cell phone
menu interaction. ACM Trans. Comput.-Hum. Interact. 14, 1, Article 1 (May 2007), 24 pages. DOI
= 10.1145/1229855.1229856 http://doi.acm.org/10.1145/1229855.1229856
This research was supported by the National Science Foundation (NSF) (IIS-0083281 and ITR-
046852), the Space and Naval Warfare Systems Center, San Diego (N66001-1047-411F), and the
Office of Naval Research (N00014-02-1-0021, N00014-03-1-0248, and N00014-06-1-0164).
The information in this article does not necessarily reflect the position or policies of the U.S. gov-
ernment, and no official endorsement should be inferred.
Authors’ addresses: R. St. Amant and T. E. Horton, Department of Computer Science, North
Carolina State University, Raleigh, NC 27695; email:{stamant; horton}@csc.ncsu.edu; F. E. Ritter,
College of Information Sciences and Technology, The Pennsylvania State University, University
Park, PA 16802; email: [email protected].
Permission to make digital or hard copies of part or all of this work for personal or classroom use is
granted without fee provided that copies are not made or distributed for profit or direct commercial
advantage and that copies show this notice on the first page or initial screen of a display along
with the full citation. Copyrights for components of this work owned by others than ACM must be
honored. Abstracting with credit is permitted. To copy otherwise, to republish, to post on servers,
to redistribute to lists, or to use any component of this work in other works requires prior specific
permission and/or a fee. Permissions may be requested from Publications Dept., ACM, Inc., 2 Penn
Plaza, Suite 701, New York, NY 10121-0701 USA, fax +1 (212) 869-0481, or [email protected]© 2007 ACM 1073-0616/2007/05-ART1 $5.00 DOI 10.1145/1229855.1229856 http://doi.acm.org/
10.1145/1229855.1229856
ACM Transactions on Computer-Human Interaction, Vol. 14, No. 1, Article 1, Publication date: May 2007.
2 • R. St. Amant et al.
1. INTRODUCTION
There are 2 billion cellular telephones in use today, and this number is expectedto reach 3 billion in 2008 [DiPrima 2006]. Cell phones are used for more thanmaking calls; they now include tools for managing contact information, voicemail, and hardware settings, and often software for playing games, browsingthe Web, and connecting to specialized information services. The market pen-etration of cell phones is much higher than that of conventional computers,which raises significant opportunities and challenges for HCI.
This article presents techniques for evaluating and improving cell phoneusability, in particular the usability of the hierarchical menus that provideaccess to most functionality aside from dialing and data entry. While cell phonemenu interfaces may appear simple at first glance, they pose a nontrivial designproblem. Consider the menu hierarchy for the Kyocera 2325 cell phone, the first25 items of which are shown in Table I. If we count as terminals those selectionsthat open an application (e.g., a game), a list of data (e.g., recent calls), or aset of choices in the cell phone equivalent of a dialog box (e.g., for setting theringer volume), then this hierarchy contains 98 terminals, reachable through22 intermediate selections. The longest menu contains 12 items–all associatedwith the selection of different sounds. The shortest menu contains a single item,for entering a voice memo. Terminals in the hierarchy are up to four levels deep,and the mean number of actions to reach an item (scrolling plus selection), overall 98 terminals, is 13.3, taking on the order of 7 seconds for an experienceduser.
This menu hierarchy is as large as that of a moderately sized desktop ap-plication (e.g., Eudora 5.2 with 103 items). This is not unusual for cell phones;the menu hierarchy for the Samsung MM-A800, which includes a digital cam-era, contains a remarkable 583 items [Pogue 2005]. Designing menu systemsfor any platform, including desktop systems, can be challenging, but for cellphones the problem is made more difficult by several factors:
—Discrete selection actions in the form of button presses1 are usually neededto move between menu items, because most cell phones lack more directselection capabilities (e.g., a mouse or touch screen).
—Cell phone displays are small, allowing only a few menu items to be displayedat a single time. Many cell phones lack functionality for paging up or down,making display limitations even more significant.
—There is less standardization in hardware supporting menu traversal for cellphones than for desktop machines. Some phones have two-way directionalbuttons, others four-way; some have a labeled “Menu” button, while othersrely on a button with overloaded functionality. Button placement can varysignificantly, with “Cancel” and “OK” buttons reversed from one phone toanother. If interfaces are developed for the lowest common denominator, in-dependently of specific hardware (which is common practice at the mobileapplication level), then even cell phones with elaborate interaction supportbecome less efficient.
1We use the terms “button presses” and “key presses” interchangeably.
ACM Transactions on Computer-Human Interaction, Vol. 14, No. 1, Article 1, Publication date: May 2007.

Evaluation of Expert Cell Phone Menu Interaction • 3
Table I. The First 25 of 120 Elements in
the Kyocera 2325 Menu Hierarchy
Menu
Contacts
View All <list>
Add New
Phone Number <entry>
Email Address <entry>
Street Address <entry>
URL <entry>
Find Name <entry>
Add Voice Dial <entry>
Speed Dial List <list>
Voice Dial List <list>
Business List <list>
Personal List <list>
Information <info>
Messages
Voicemail <list>
Send New
Recent List <list>
Enter from Scratch <entry>
Contacts List <list>
Text InBox <list>
Net Alerts <app>
Text OutBox <list>
Filed <list>
Erase Msgs <choices>
. . .
These factors suggest that cell phone menu interfaces deserve close analysis,and that they need specialized techniques for their development and evaluation,which this article takes up in two parts.
In Section 2, we describe an empirical study of the traversal of cell phonemenus, along with three models for predicting user performance: a Fitts’law model [Fitts 1954], a GOMS model [John and Kieras 1996a, 1996b;Kieras 1999], and an ACT-R model [Anderson et al. 2004]. All the modelsgive good accounts of qualitative patterns in user behavior, and the lattertwo models give good to very good quantitative predictions of behavior, atboth aggregate and detailed levels of analysis. In Section 3, we use our em-pirical results to define a novel evaluation metric for the efficiency of cellphone menu traversal. We define a search procedure that generates improve-ments to a menu hierarchy with respect to a given set of characteristic userprofiles.
This article makes several contributions to the HCI literature: a novel andtimely study of a very common new HCI task (menu use on cell phones), newmodels for accurately predicting performance on this task, and a simple, theor-etically motivated search procedure that generates menu hierarchies that re-duce traversal time in simulation studies by a third, which should be generallyapplicable to all menu-based systems.
ACM Transactions on Computer-Human Interaction, Vol. 14, No. 1, Article 1, Publication date: May 2007.

4 • R. St. Amant et al.
Fig. 1. Kyocera 2325.
2. A PERFORMANCE STUDY
Our interest is in expert (i.e., practiced and error-free) use of cell phone menusystems. For control purposes, it was not feasible to collect data from expe-rienced users on their own cell phones, with all the potential differences inhardware and software. As a compromise, we had users practice a small num-ber of tasks, so that all tasks could be remembered easily, and then carry themout on a single cell phone. Though restrictive, these conditions give a reasonablestarting point for an empirical study and model validation.
We used a Kyocera 2325, as shown in Figure 1. At the top level of its internalmenu, the Kyocera display shows a single selectable icon. The OK button se-lects the current item; on the four-way scrolling button, RIGHT and LEFT movethrough the item list horizontally. For lower-level menus, three items are dis-played at a time, oriented vertically. Each new menu list is displayed with thetop item highlighted. The OK button, on the left, is used to select the currentlyhighlighted item in these menus, while the CLR button, on the right, returns tothe previous level in the hierarchy. The UP and DOWN regions of the four-waybutton move through the menu. Downward scrolling is incremental, with itemsappearing one at a time at the bottom of the screen.
2.1 Procedures
We recruited fourteen experienced cell phone users for our study, students whotook part for course credit. The first two users acted as participants in a pilotphase of the experiment, in which software for data collection and analysis wastested and procedures were refined; their data were also used in developing (but
ACM Transactions on Computer-Human Interaction, Vol. 14, No. 1, Article 1, Publication date: May 2007.

Evaluation of Expert Cell Phone Menu Interaction • 5
Table II. Task Duration in s, with Mean (and Standard Deviation) Shown
Task N actions Duration
Menu > > > Settings > > Sounds > Ringer Volume 10 4.954 (1.077)
Menu > > > > Tools & Games > > Tip Calculator 9 4.027 (0.921)
Menu, Contacts, View All 3 1.271 (0.412)
Menu > > > > Tools & Games, Scheduler, View Day 8 4.393 (0.971)
Menu > > > > > > Web Browser 8 3.391 (0.827)
not validating) the models described in later sections. The remaining twelveusers, male undergraduates in computer science, provided the main body ofdata for the study. All were right handed. All but one used their right hand tohold the cell phone, and all used the thumb of the right hand to press keys.
To collect data, we recorded the tone produced by each key press as transmit-ted through the earphone jack of the cell phone. Collection was initiated by thefirst key pressed by the participant and ended with the last key pressed. Theonset of each key press is detectable by a threshold test on the audio outputwaveform from the earphone jack, using software we wrote for this purpose.Each tone lasts approximately 0.095 s, during which time the display changes,before the key is released. System responses are much faster than key pressesand are treated as occurring within elementary key press actions and not con-tributing to the duration of user actions.
Participants started with a practice stage, in which they familiarized them-selves with the cell phone and its menu system. We gave each participant apaper form describing how five terminal menu items were to be reached, asshown in the first column of Table II. Each “>” represents a scrolling action,with commas separating consecutive selection actions. Reaching each of theterminal items (those at the end of each sequence) constituted a task in thestudy. Participants practiced each task until they could carry it out three timesin a row without error.
Each trial in the study required reaching one of the five target terminalitems without access to the paper form. Tasks were presented to participantsin a randomized order. We obtained five correct trials per participant (i.e., with-out errors or extraneous actions), discarding fewer than 10 trials across allparticipants, less than 3% of the data. This means that our cleaned datasetcontains only OK and RIGHT/DOWN key press actions, 2,280 observations intotal (2,280 = 12 users × 5 repetitions × (10 + 9 + 3 + 8 + 8) actions per task).
Table II shows the mean duration per task, over all participants in the study.User performance is much slower than for single-level menu selection witha mouse on a standard desktop platform [Byrne 2001], which highlights theimportance of specialized models for this task, as we discuss below.
2.2 Models of User Behavior
We predicted user performance with three models, each supported by a con-siderable background literature. A Fitts’ law model, a GOMS model, and anACT-R model were developed independently of each other, based on data from
ACM Transactions on Computer-Human Interaction, Vol. 14, No. 1, Article 1, Publication date: May 2007.
6 • R. St. Amant et al.
one task carried out by one of the users in the pilot stage of the experiment.2
The three models run in the same software framework that evolved over thecourse of this research. The framework provides a common specification of theKyocera cell phone, including the sizes and positions of keys and the distancesbetween them, as measured on the physical device. The framework also sup-ports a common representation of the menu hierarchy shown in Table I. Themodels use the same software environment that includes a simulation of thecell phone’s interface and produces output in a consistent form.
2.2.1 A Fitts’ Law Model. Our model is based on MacKenzie’s [2003] ver-sion of Fitts’ Law for one-finger typing for text entry on mobile phones. Move-ment time in seconds for thumb input is
M T = 0.176 + 0.064 log2 (D/W + 1), (1)
where D represents the distance (amplitude) of the movement and W the widthof the target. The value for D in our study was 14.5 mm, which separates theOK button and the DOWN button area, with widths W of 6 mm and 10 mm, asprovided by the cell phone specification. This model, as with the other modelsdescribed below, makes the simplifying assumption that all scrolling actions canbe represented by DOWN key presses, even though the first action is a RIGHTkey press, with a slightly different size and distance from the OK button.
To execute the Fitts’ law model for each of the five tasks, a path is gener-ated from the root of the menu hierarchy to the terminal item for the task.Each step on the path is associated with a movement action or a key pressaction. Durations for all the steps are accumulated to produce an overall taskduration.
2.2.2 A GOMS Model. The second model is a GOMS model [Kieras 1999;John 2003]. GOMS methods for task analysis produce hierarchical descriptionsof methods and operators needed to accomplish goals; some GOMS models havebeen strikingly successful in critical HCI domains [Gray et al. 1993]. In ourmodel, a method is defined for each task in the study. All of the methods areautomatically generated from the menu hierarchy specification, based on thesame path traversals used for the Fitts’ law model. Within a method, each stepcorresponds to the selection of a menu item. The GOMS method for selectingthe terminal item Ringer Volume is shown at the top of Figure 2.
Each of the steps in this method in turn decomposes into a selection method,such as Select Menu or Select Sound, which involves scrolling until a specificitem in the sequence is reached—selection in a menu at a single level. There isone selection method for each menu item, from Select Settings to Select RingerVolume. All of the selection methods have the same form, as shown in theexample at the bottom of Figure 2. Specifications of these lower-level methodsare created automatically from a generic template.
2Preliminary versions of the GOMS and ACT-R models described in an earlier conference pa-
per [St. Amant et al. 2004b] contained minor inconsistencies; these inconsistencies were removed in
revision. Performance was altered by no more than a few percentage points. The qualitative behav-
ior of the models and comparisons between them remain unchanged from their earlier description.
ACM Transactions on Computer-Human Interaction, Vol. 14, No. 1, Article 1, Publication date: May 2007.

Evaluation of Expert Cell Phone Menu Interaction • 7
Fig. 2. The GOMS method for selecting the Ringer Volume item, and a sample single-level menu
selection for the Settings item.
Processing in a selection method involves iterating through a sequence offour exhaustive tests of whether or not the target intermediate or terminalitem is currently highlighted and whether the finger is on the appropriate keyfor selection or scrolling. The durations of the steps follow the guidelines es-tablished by Kieras [1999] in his work on GOMSL and GLEAN3 (including aversion of Fitts Law). Each test in a decision step requires 0.050 s, plus the timeto execute any actions in the body of the decision if the test succeeds. Steps thatinvolve key presses last 0.280 seconds plus the duration of tests or auxiliary op-erations (0.330 seconds in total). Moving to the DOWN key lasts 0.083 seconds(0.133 seconds in total); moving to the OK key lasts 0.113 seconds (0.163 sec-onds in total). Movement times are based on the movement component of theFitts’ law model in the previous section. The model assumes negligible systemresponse time and that there are no verification steps. Further, the initial visualaction to acquire the first menu item occurs before the first key press (timingbegins at the first key press), and as the highlighted menu item changes novisual re-acquisition is needed during selection or scrolling activity. Processingis entirely sequential, with no overlapping of steps.
Modeling results, based on the description above, are generated by a GOMSinterpreter that we implemented specifically for this project. While there wouldhave been some benefit to using existing GOMS modeling tools and environ-ments (e.g., GLEAN3 [Kieras 1999]), we judged that the value of a single sim-ulation and modeling framework (despite its limitations), for the Fitts’ law,GOMS, and ACT-R models, and the phone simulation would provide a worth-while degree of consistency across our evaluation.
2.2.3 An ACT-R Model. The third model is based on the ACT-R 5.0 cogni-tive architecture [Anderson et al. 2004]. We picked ACT-R as a representativecognitive modeling architecture and as a common choice in HCI work. ACT-R
ACM Transactions on Computer-Human Interaction, Vol. 14, No. 1, Article 1, Publication date: May 2007.
8 • R. St. Amant et al.
integrates theories of cognition, visual attention, and motor movement and hasbeen the basis for a number of models in HCI (e.g., Ritter and Young [2001]).ACT-R models simulate the time course and information processing of cognitivemechanisms, such as changes of attention and memory retrievals, as well asexternal actions, such as movement of the fingers. Roughly speaking, ACT-Rmodels provide details that can explain behavior in cognitive terms at a levelnot addressed by the coarser GOMS representation.
In our ACT-R model, a virtual (simulated) display maintains a representationof the current items in the cell phone’s menu interface hierarchy. Menu itemsare presented in a vertical list, and one of the menu items is always highlighted.All items are presented for each list, independent of the physical display size.When an item is selected in the virtual display, the list is refreshed with theappropriate submenu.
The model’s memory is initialized with a set of declarative memory chunksthat represent the parent-child relationships between the intermediate menuitems needed to reach terminal items. For example, for the Ringer Volume task,pairs of declarative memory chunks for the Menu/Settings, Settings/Sounds,and Sounds/Ringer Volume relationships are included. Chunks representingthe parent–child relationships are generated automatically via traversal of themenu hierarchy specification. ACT-R’s model of the hand is initialized with thethumb on the OK button.
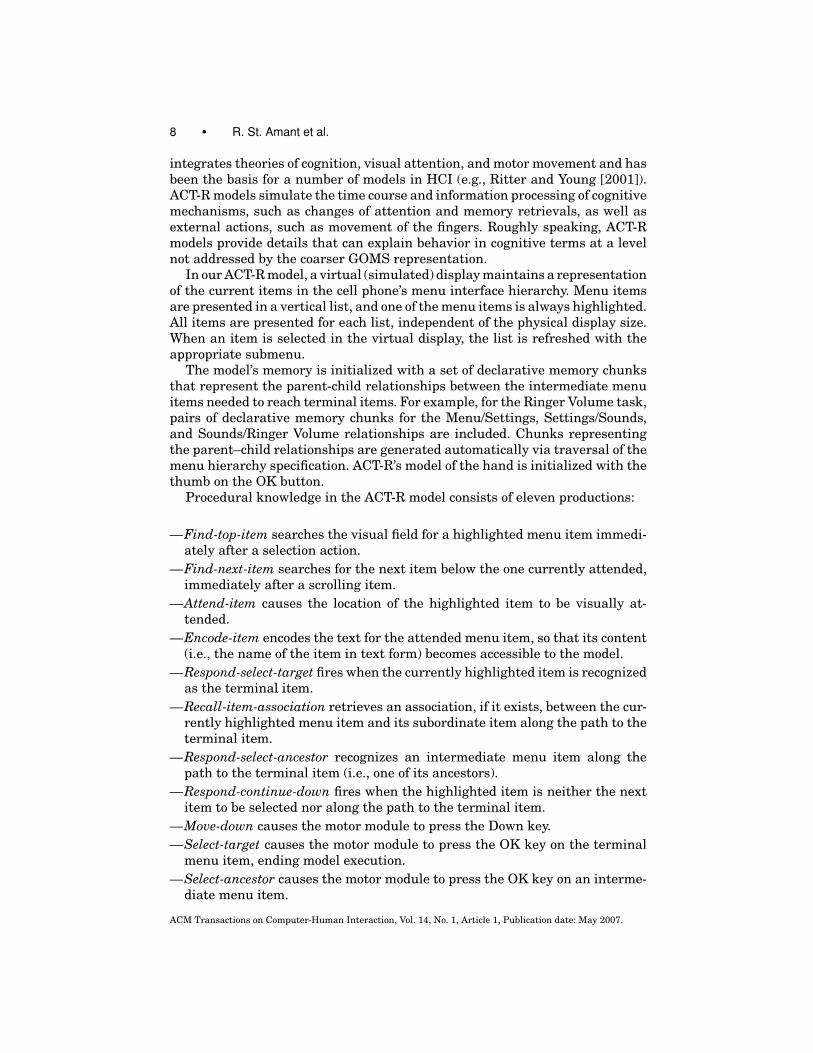
Procedural knowledge in the ACT-R model consists of eleven productions:
—Find-top-item searches the visual field for a highlighted menu item immedi-ately after a selection action.
—Find-next-item searches for the next item below the one currently attended,immediately after a scrolling item.
—Attend-item causes the location of the highlighted item to be visually at-tended.
—Encode-item encodes the text for the attended menu item, so that its content(i.e., the name of the item in text form) becomes accessible to the model.
—Respond-select-target fires when the currently highlighted item is recognizedas the terminal item.
—Recall-item-association retrieves an association, if it exists, between the cur-rently highlighted menu item and its subordinate item along the path to theterminal item.
—Respond-select-ancestor recognizes an intermediate menu item along thepath to the terminal item (i.e., one of its ancestors).
—Respond-continue-down fires when the highlighted item is neither the nextitem to be selected nor along the path to the terminal item.
—Move-down causes the motor module to press the Down key.
—Select-target causes the motor module to press the OK key on the terminalmenu item, ending model execution.
—Select-ancestor causes the motor module to press the OK key on an interme-diate menu item.
ACM Transactions on Computer-Human Interaction, Vol. 14, No. 1, Article 1, Publication date: May 2007.

Evaluation of Expert Cell Phone Menu Interaction • 9
The model starts with the goal of selecting a specific terminal menu item.The simulation environment shows a single highlighted item. The model firstretrieves a target intermediate item to be selected. It then searches for the cur-rently highlighted menu item in its field of view. Once found, the visible item isattended and then encoded, so that its text representation becomes accessible.If the text matches the target item and this is the same as the terminal item,then the model initiates motor actions to move the thumb to the OK button(if necessary) and press it. Model execution completes at this point. If the textmatches the target item but it is not the terminal item, then this means thatthe currently highlighted item is on the path to the terminal. The OK button ispressed and another target item is retrieved from memory. Visual processingrepeats as before. If the text of the highlighted item does not match the targetitem, then motor actions are initiated to move the thumb to the DOWN but-ton and press it. Control is transferred to the visual search action, as before.In the model, manual scrolling actions can trail behind visual processing byan unspecified amount (determined by processing in the model such as mem-ory retrievals); the visual and manual modules become synchronized when anew menu is presented. User errors, such as pressing an incorrect key, are notmodeled. Model execution is deterministic, with no noise parameters used.
Our model is defined in the ACT-R modeling language, but its execution de-pends on an extension to perceptual-motor processing in the architecture. Theperceptual and motor components of ACT-R 5.0 have some bias toward desktopactivities, such as selecting menu items with the mouse and navigating throughwindows and dialog boxes [Anderson et al. 2004; Byrne 2001]. In ACT-R, thekeyboard is represented as an array of locations. Neighboring keys are a unitdistance apart in a rectilinear arrangement, and each key has unit width andheight. Standard key presses are modeled as finger movements from locationson the home row to the location of a target key. To handle interaction with acell phone keypad, more flexibility is needed in models of finger movements andthe keyboard. We extended the ACT-R environment representation to supporta layout-based keypad in which the size and placement of keys can be specifiedindividually. The new representation allows us to build specifications of differ-ent cell phone keypads that can be integrated with ACT-R motor processingin a straightforward way. Fingers are modeled as moving between locations,which, in the case of this experiment, are key locations, but may be arbitraryif needed.
2.3 Model Performance
We can describe the performance of the models at two levels: the accuracy withwhich the models predict the overall duration of tasks, and the accuracy of theirpredictions of the duration of individual actions. These two levels are discussedin the sections below. Other factors commonly explored by modeling, such aslearning behavior and the occurrence of errors, are excluded by the design ofthe experiment.
2.3.1 Task-Level Performance. Table III shows summary model perfor-mance and user data broken down by task. Figures 3 through 7 show more
ACM Transactions on Computer-Human Interaction, Vol. 14, No. 1, Article 1, Publication date: May 2007.

10 • R. St. Amant et al.
Table III. Model and User Performance Across Tasks, in s. Upper and
Lower 99% Confidence Intervals are Shown in Parentheses for User Data
Task User Performance GOMS ACT-R Fitts’ law
Ringer Volume 4.954 (4.584 5.325) 5.059 5.267 2.173
Tip Calculator 4.027 (3.710 4.343) 4.233 4.482 1.801
View All 1.271 (1.129 1.413) 1.160 1.280 0.352
View Day 4.393 (4.059 4.727) 3.707 3.883 1.428
Web Browser 3.391 (3.107 3.676) 3.407 3.883 1.428
Fig. 3. Model predictions and user data by task: Ringer Volume. Each user data point (shown
with a circle), plus 99% confidence interval, represents the mean of 60 sample points. Confidence
intervals smaller than 200 ms are not shown.
detailed views of the same data in graphical form. Both the GOMS and ACT-Rmodels give good approximations of user performance. GOMS predictions arewithin the 99% confidence interval for mean overall task duration for all targetitems except View Day. ACT-R predictions are within this interval for two ofthe target items.
The Fitts’ law model does less well, for reasons that are worth discussing.Many models of cell phone interaction, such as keypad dialing and one-fingertext entry [MacKenzie 2003], have been based on Fitts’ law, which motivatedthis aspect of our evaluation. Our Fitts’ law model performs relatively poorly,despite the success of such models elsewhere. The Fitts’ law model producestimes that are about half of the observed times. This is not surprising—muchof the activity of this menu selection task is outside the scope of the model.Silfverberg et al. [2000] describe a comparable example of where Fitts’ lawmodels break down, in a discussion of text entry on mobile phones. For somecell phones, text entry is aided by lexicon-based word disambiguation. Whiletyping, the user ordinarily refers to the display in order to decide whetherthe system has correctly disambiguated the word being typed. In text entry,such cognitive processing may not be needed by expert users familiar with thedisambiguation system. In this menu selection task, however, we assume that
ACM Transactions on Computer-Human Interaction, Vol. 14, No. 1, Article 1, Publication date: May 2007.
Evaluation of Expert Cell Phone Menu Interaction • 11
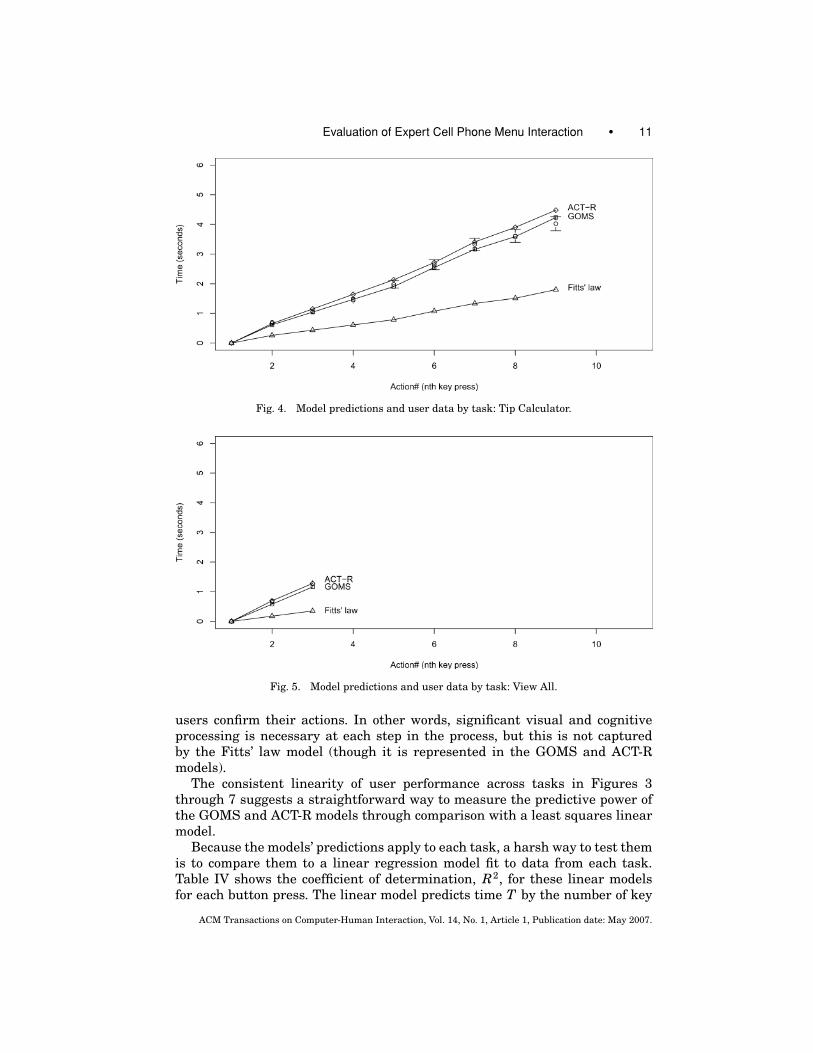
Fig. 4. Model predictions and user data by task: Tip Calculator.
Fig. 5. Model predictions and user data by task: View All.
users confirm their actions. In other words, significant visual and cognitiveprocessing is necessary at each step in the process, but this is not capturedby the Fitts’ law model (though it is represented in the GOMS and ACT-Rmodels).
The consistent linearity of user performance across tasks in Figures 3through 7 suggests a straightforward way to measure the predictive power ofthe GOMS and ACT-R models through comparison with a least squares linearmodel.
Because the models’ predictions apply to each task, a harsh way to test themis to compare them to a linear regression model fit to data from each task.Table IV shows the coefficient of determination, R2, for these linear modelsfor each button press. The linear model predicts time T by the number of key
ACM Transactions on Computer-Human Interaction, Vol. 14, No. 1, Article 1, Publication date: May 2007.

12 • R. St. Amant et al.
Fig. 6. Model predictions and user data by task: View Day.
Fig. 7. Model predictions and user data by task: Web Browser.
presses k plus a constant. The remaining columns show analogous values forthe ACT-R and GOMS models.
A linear model can also be fit to the aggregation of performance data for alltasks and all users:
T = −0.500 + 0.531k. (2)
This aggregate linear model has an R2 of 0.834. Although neither the GOMS northe ACT-R model accounts for as much variance as a general linear equation,both are close; the comparable values are 0.809 for the GOMS model and 0.796for the ACT-R model.
The aggregate linear model has appealing conceptual and computationalsimplicity; we use Eq. (2) in Section 3 for just this reason. As a general modelof performance, though, it has several shortcomings in comparison with the
ACM Transactions on Computer-Human Interaction, Vol. 14, No. 1, Article 1, Publication date: May 2007.
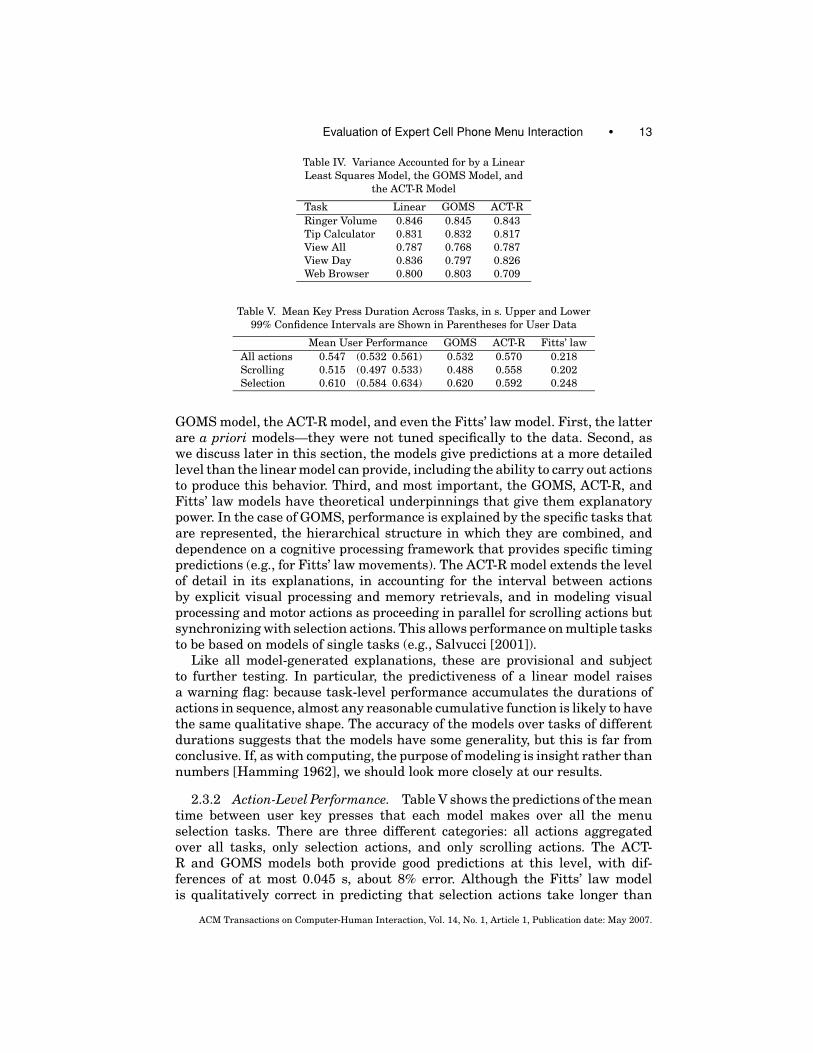
Evaluation of Expert Cell Phone Menu Interaction • 13
Table IV. Variance Accounted for by a Linear
Least Squares Model, the GOMS Model, and
the ACT-R Model
Task Linear GOMS ACT-R
Ringer Volume 0.846 0.845 0.843
Tip Calculator 0.831 0.832 0.817
View All 0.787 0.768 0.787
View Day 0.836 0.797 0.826
Web Browser 0.800 0.803 0.709
Table V. Mean Key Press Duration Across Tasks, in s. Upper and Lower
99% Confidence Intervals are Shown in Parentheses for User Data
Mean User Performance GOMS ACT-R Fitts’ law
All actions 0.547 (0.532 0.561) 0.532 0.570 0.218
Scrolling 0.515 (0.497 0.533) 0.488 0.558 0.202
Selection 0.610 (0.584 0.634) 0.620 0.592 0.248
GOMS model, the ACT-R model, and even the Fitts’ law model. First, the latterare a priori models—they were not tuned specifically to the data. Second, aswe discuss later in this section, the models give predictions at a more detailedlevel than the linear model can provide, including the ability to carry out actionsto produce this behavior. Third, and most important, the GOMS, ACT-R, andFitts’ law models have theoretical underpinnings that give them explanatorypower. In the case of GOMS, performance is explained by the specific tasks thatare represented, the hierarchical structure in which they are combined, anddependence on a cognitive processing framework that provides specific timingpredictions (e.g., for Fitts’ law movements). The ACT-R model extends the levelof detail in its explanations, in accounting for the interval between actionsby explicit visual processing and memory retrievals, and in modeling visualprocessing and motor actions as proceeding in parallel for scrolling actions butsynchronizing with selection actions. This allows performance on multiple tasksto be based on models of single tasks (e.g., Salvucci [2001]).
Like all model-generated explanations, these are provisional and subjectto further testing. In particular, the predictiveness of a linear model raisesa warning flag: because task-level performance accumulates the durations ofactions in sequence, almost any reasonable cumulative function is likely to havethe same qualitative shape. The accuracy of the models over tasks of differentdurations suggests that the models have some generality, but this is far fromconclusive. If, as with computing, the purpose of modeling is insight rather thannumbers [Hamming 1962], we should look more closely at our results.
2.3.2 Action-Level Performance. Table V shows the predictions of the meantime between user key presses that each model makes over all the menuselection tasks. There are three different categories: all actions aggregatedover all tasks, only selection actions, and only scrolling actions. The ACT-R and GOMS models both provide good predictions at this level, with dif-ferences of at most 0.045 s, about 8% error. Although the Fitts’ law modelis qualitatively correct in predicting that selection actions take longer than
ACM Transactions on Computer-Human Interaction, Vol. 14, No. 1, Article 1, Publication date: May 2007.
14 • R. St. Amant et al.
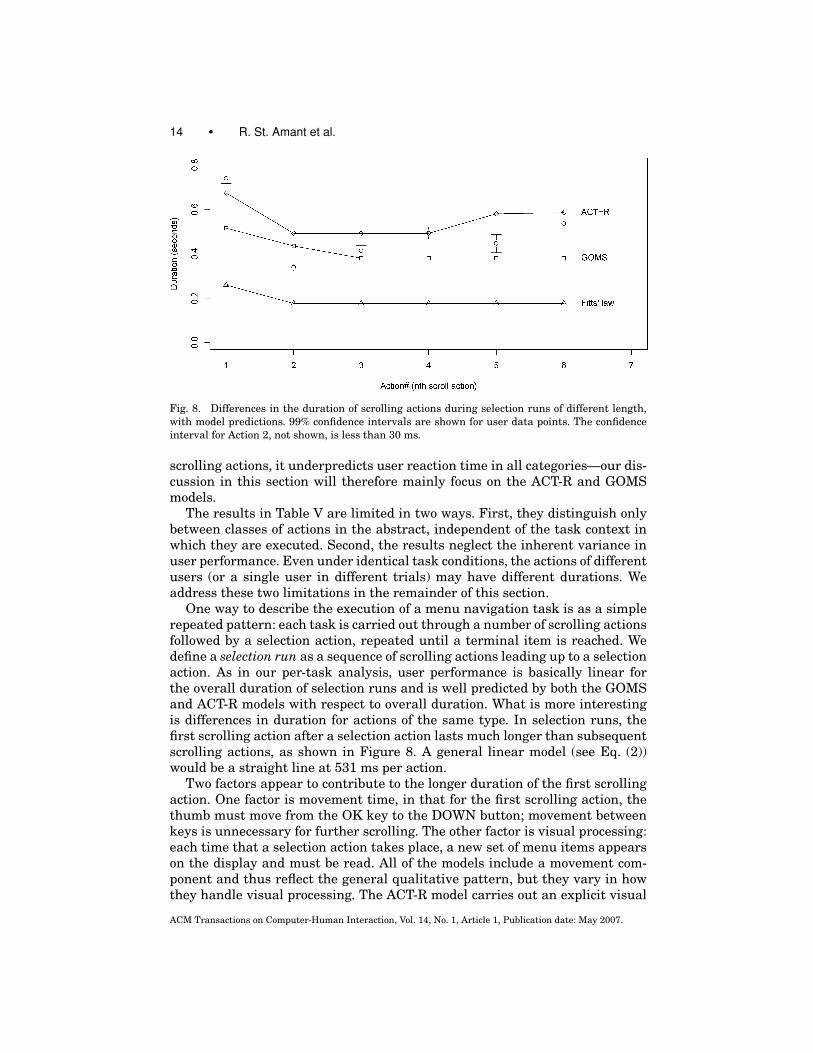
Fig. 8. Differences in the duration of scrolling actions during selection runs of different length,
with model predictions. 99% confidence intervals are shown for user data points. The confidence
interval for Action 2, not shown, is less than 30 ms.
scrolling actions, it underpredicts user reaction time in all categories—our dis-cussion in this section will therefore mainly focus on the ACT-R and GOMSmodels.
The results in Table V are limited in two ways. First, they distinguish onlybetween classes of actions in the abstract, independent of the task context inwhich they are executed. Second, the results neglect the inherent variance inuser performance. Even under identical task conditions, the actions of differentusers (or a single user in different trials) may have different durations. Weaddress these two limitations in the remainder of this section.
One way to describe the execution of a menu navigation task is as a simplerepeated pattern: each task is carried out through a number of scrolling actionsfollowed by a selection action, repeated until a terminal item is reached. Wedefine a selection run as a sequence of scrolling actions leading up to a selectionaction. As in our per-task analysis, user performance is basically linear forthe overall duration of selection runs and is well predicted by both the GOMSand ACT-R models with respect to overall duration. What is more interestingis differences in duration for actions of the same type. In selection runs, thefirst scrolling action after a selection action lasts much longer than subsequentscrolling actions, as shown in Figure 8. A general linear model (see Eq. (2))would be a straight line at 531 ms per action.
Two factors appear to contribute to the longer duration of the first scrollingaction. One factor is movement time, in that for the first scrolling action, thethumb must move from the OK key to the DOWN button; movement betweenkeys is unnecessary for further scrolling. The other factor is visual processing:each time that a selection action takes place, a new set of menu items appearson the display and must be read. All of the models include a movement com-ponent and thus reflect the general qualitative pattern, but they vary in howthey handle visual processing. The ACT-R model carries out an explicit visual
ACM Transactions on Computer-Human Interaction, Vol. 14, No. 1, Article 1, Publication date: May 2007.

Evaluation of Expert Cell Phone Menu Interaction • 15
search, which occurs in parallel with the motor movement. The GOMS modeldoes not include an explicit visual processing step, but each selection entailsdecision-making tests as well as a call to a new method, adding to the durationof motor movement. Both models produce slight underpredictions of the dura-tion of the first scrolling action. (An alternative explanation for this pattern isoffered by the EPIC architecture but is based on different low-level cognitiveassumptions [Hornof and Kieras 1997].)
A less obvious pattern is also present in Figure 8. For users, the first scrollingaction lasts the longest, the second the shortest, and all succeeding actions inbetween. We believe that three factors explain the increase in duration be-tween the second and remaining actions. The first factor is an environmentalconstraint on users’ visual processing. Because only three menu items are pre-sented on the display at a time, we can expect the duration of the fourth andsucceeding scrolling actions to be slower than the second and third, because theitems to be traversed are not immediately available for visual processing. Thesecond factor is a possible strategy that users took in dealing with menus thatare known, via practice, to be long: users may quickly execute several scrollingactions with less attention to the display, until the approximate region of thetarget item is reached. The third factor is parallelism in visual processing andmotor action. Related experiments on menu selection with a mouse [Byrne2001] suggest that eye movement is not strictly synchronized with motor ac-tivity in the discrete menu traversal actions of our domain; this means thatthe eyes may scan ahead of the items being highlighted by button presses. Thefirst factor is not reproduced by our simulation environment and the second isnot yet included in the model. The third factor, parallelism in motor and visualbehavior, is represented in the ACT-R model. This parallelism accounts for theincrease in duration after the fourth scrolling action, as the duration of motoractions dominates that of visual processing. The exact point in the user data atwhich the increase occurs is not captured by any of these models; neither is theremaining variability in the duration of scrolling actions.
Finally, we note that the cognitive and visual processing component of actionsin selection runs is much higher than the movement component. The Fitt’s lawmodel provides a baseline for movement-only duration, but underpredicts theduration of user actions by a factor of two to three. The GOMS and ACT-Rmodels, for reasons discussed above, come much closer to user performance.Overall, the mean error for mean action duration during all selection runs isabout 14% for the GOMS model, 19% for the ACT-R model, and 60% for theFitts’ law model.
Our results so far show that the GOMS and ACT-R models give accuratepredictions of the mean duration of user actions, when actions are grouped intoclasses or, as in the analysis of selection runs, associated with a specific taskcontext. These predictions, however, give no information about the accuracyof the models for specific instances of actions. In evaluating model predictionsat the action level, the issue of inherent variability in user performance isperhaps the most important.
Two common measures of error that give insight into this issue are root meansquared error (RMSE) and mean absolute error (MAE). Table VI shows RMSE
ACM Transactions on Computer-Human Interaction, Vol. 14, No. 1, Article 1, Publication date: May 2007.

16 • R. St. Amant et al.
Table VI. Model Prediction Errors for Action Duration, in Seconds, for the Three Models and for
a Mean Duration Model
Root Mean Squared Error Mean Absolute Error
GOMS ACT-R Fitts’ law MD GOMS ACT-R Fitts’ law MD
All actions 0.230 0.228 0.411 0.192 0.175 0.177 0.330 0.142
Scrolling 0.218 0.215 0.390 0.188 0.159 0.170 0.313 0.138
Selection 0.248 0.261 0.452 0.208 0.205 0.190 0.362 0.151
and MAE for the three models, for all actions and for the categories of scrollingand selection actions. The prediction error for the GOMS and ACT-R models,per action duration, is much higher than for mean duration, about 42% of themean action duration (as given in Table V) for the RMSE measure and 32%for MAE. The values are similar for the subcategories of scrolling and selectionactions. By these measures, the models are very close in performance, withneither GOMS or ACT-R having an obvious advantage.
While these values of RMSE and MAE are disappointingly high for theGOMS and ACT-R models, it is worth asking how much they might be improved.As in our task-level analysis, we can define a post hoc model, based on the userdata, for comparison with the models we have built. We begin by observing thatthe predictions of the models abstract away performance differences betweenindividual users and across trials. For example, a model will give the same pre-dicted duration for the sixth action in the Ringer Volume task, regardless ofwhich of the twelve users or which of their five trials is involved. The variancein the 60 data points per unique action, in context, gives rise to the error mea-sured in Table VI. How well would an optimal model perform? For a sample ofdata points, the best estimator with respect to mean squared error is simplythe mean of the sample. The best post hoc model (with respect to least squareserror) thus returns the mean duration for each unique action, over users andtrials. The error for this model is shown in the MD (Mean Duration) columns ofTable VI. These errors are lower than but still relatively close to those producedby the GOMS and ACT-R models. As percentages of mean action duration, themodels might improve from 42% to 35% with respect to RMSE and from 32%to 26% for MAE. This comparison suggests that the GOMS and ACT-R modelsare performing almost as well as is possible in predicting user behavior at theaction level, given the variance in the user data.
2.4 Discussion
All of the models we have presented have proved robust in our analysis, thoughat a sufficiently detailed level they break down (as all models do). Our resultsindicate that detailed, rigorous models of low-level interaction with cell phonesis possible, and that such models make good predictions. Aside from the useof this work as a possible exemplar of the application of cognitive modelingtechniques to HCI evaluation, we can note a few observations.
Modelers need to consider the trade-off between modeling effort and the valueof increasingly veridical results. The GOMS model developed here is as good as
ACM Transactions on Computer-Human Interaction, Vol. 14, No. 1, Article 1, Publication date: May 2007.

Evaluation of Expert Cell Phone Menu Interaction • 17
or better than the ACT-R model, and was much cheaper to build. For modelingefficiency, a reasonable heuristic is to apply simple formalisms to model simpleprocedures. This is especially relevant if the simple formalism can predict allthe observable information or all the needed behavior. All the data we have inthis study (keystroke times by expert users) can be predicted by both ACT-Rand GOMS, though in other situations (e.g., if we had eye-tracking data andwanted to predict eye movements or to model concurrent tasks), GOMS wouldbe at a distinct disadvantage.
Further, GOMS offers considerable flexibility in modeling. A coarser formal-ism does not necessarily imply stricter constraints on modeling, which is per-haps an unintuitive observation; rather, the reverse can be the case. In ourGOMS model, for example, the specific ordering of decision steps, as shown inFigure 2, is not governed by cognitive constraints. A different ordering (e.g.,one that tested whether an OK key press was appropriate before rather thanafter scrolling) would have produced different predictions. It turns out, in ourcase, that user behavior is sufficiently regular that the GOMS model we de-veloped for a single user’s behavior generalized very well to a larger sample; ifthis had not been the case, the modeling flexibility we describe would not havebeen helpful. Our ACT-R model, for the same task, does not allow such directfine-tuning to be carried out in the same way, because of tighter architecturalconstraints on the interactions between visual and motor actions.
The remaining differences between the models’ predictions and the datasuggest further improvements to the models are possible. Most importantly,the comparison in Figure 8 shows that only the ACT-R model starts to accountfor the faster second keystroke, and none of the models predict this (or the laterchanges) very well.
There are limitations to this work so far, aside from model performance.For example, many cell phones have additional interaction features, such asshortcut menus and non-linear graphical icon displays, that are not capturedby the models we have built. Further studies, perhaps extending to includenovice users, could take error types and error distributions into account, tohelp extend the range of application of these models. We believe, nevertheless,that our work lays out clear directions for future research. One issue we havebegun to explore is the performance differences between the GOMS and ACT-R models. As can be seen in the evolution of cognitive modeling architecturessuch as ACT-R and EPIC [Kieras and Meyer 1997], there is considerable overlapin basic assumptions about the way that perceptual-motor constraints shouldbe modeled [Byrne 2001; Kieras 2002], and so it is not unreasonable that themodels produce similar predictions.
Nevertheless, because ACT-R represents behavior at a greater level of de-tail than GOMS, the ACT-R model is capable of more detailed performancepredictions than the GOMS model. That GOMS outperforms ACT-R in someareas of our study is disappointing from a cognitive modeling standpoint, butnot entirely unexpected, for the reasons described above. Further, the modelswere developed independently of each other, and different modeling paradigmsand modelers can lead to different opportunities for errors in modeling to oc-cur [Ritter 1991]. There has been recent work toward automatically translating
ACM Transactions on Computer-Human Interaction, Vol. 14, No. 1, Article 1, Publication date: May 2007.
18 • R. St. Amant et al.
between models at different levels of abstraction, which would help reduce orat least formalize such errors, but this research is in its early stages [John et al.2004; St. Amant et al. 2004a; Ritter et al. 2006; Salvucci and Lee 2003].
3. USER PROFILES AND SEARCH
Once models of menu traversal have been built, the models can be applied to-ward improving menu hierarchies so that end users can traverse menus morequickly. This is a key concern for developers who may be less interested in mod-eling theory or model development than in the pragmatic issues of increasingusability.
An evaluation of a menu hierarchy independent of usage patterns wouldbe uninformative: different users choose different items, and items are chosenwith varying frequency. In other words, different usage patterns favor differentdesigns. We define a user profile to be a probability distribution over the set ofterminal items in a menu hierarchy that specifies the probability of each termi-nal being chosen, relative to the entire set. Each user profile is also associatedwith the frequency that the menu system is accessed. For the entire populationof users of the menu hierarchy, there may be many different user profiles, somemore common than others, a distribution captured by the coverage of individ-ual profiles. As an example, imagine that 20% of the users of a given cell phoneaccess only two items, Recent Calls and View All Contacts, each on averagetwice a day. In the probability distribution of the profile for this set of users,these two items have probability 0.5 and all others have 0.0; the coverage ofthe profile is 0.20; and its frequency is 4 (a value that becomes meaningful inthe context of the per-day usage values of other profiles).
In formal terms, the design problem involves the construction of a mapping(in the form of a hierarchical ordering h) between T , the set of terminal menuitems, and U , the set of all user profiles defined on T . A reasonable evaluationmeasure for a given menu hierarchy h is its efficiency: the expected cost ofreaching a terminal item. This turns out to be straightforward to represent.Expected cost is given by
EC(h) =∑
t∈T
p(t)ch(t), (3)
where p(t) is the probability of the occurrence of a specific terminal t, and ch(t)is the cost of reaching terminal t in hierarchy h.
In some situations, it may be possible to estimate p(t) directly through usagestatistics across user profiles. This would mean maintaining a local log of menuselections on individual cell phones, to be uploaded opportunistically to a centralrepository, or making these local actions visible remotely as they are carried out.If this is not practical due to storage or bandwidth constraints, an alternativeis possible. We can express the probability p(t) as follows:
p(t) =∑
u∈U
p(t|u)p(u). (4)
That is, the probability of the occurrence of t is the conditional probability ofits occurrence in a specific user profile u, scaled by the probability of u and
ACM Transactions on Computer-Human Interaction, Vol. 14, No. 1, Article 1, Publication date: May 2007.
Evaluation of Expert Cell Phone Menu Interaction • 19
summed over all user profiles. The conditional probability p(t|u) is given by thedistribution associated with each user profile as described above. Values forp(u) can be estimated from the coverage and frequency of a profile at the timethe profile is assigned to a user. In practice, we can imagine individual usersbeing asked questions about their cell phone usage when they are assigned to aspecific user profile: how often they will access their cell phone’s menu systemand the types of functions they expect to use. The trade-off, compared withdirect sampling of p(t), is between accuracy and resource demands.
All that remains is to define a specific cost function ch, which we can do withour study results. For pragmatic reasons, we use the easiest metric availableto compute cost, the linear regression given in Eq. (2) (the GOMS or ACT-Rmodel could have been used, with comparable accuracy but with a significantincrease in processing time). The factors that make the linear regression lessappropriate for modeling do not apply here. Our choice for ch means that EC(h)produces the expected duration of choosing an arbitrary terminal menu itemin hierarchy h.
This measure can be used by an automated search algorithm to identifyalternative designs of the menu hierarchy that improve user performance. Acomplication is that the automated modification of a menu hierarchy cannotarbitrarily rearrange structure purely for efficiency. Changes should respectthe semantic relationships between the items. That is, the item Ringer Volumeis under the Settings category rather than vice-versa for good reason. To avoidthe difficulties of representing and reasoning about menu item semantics (weleave this for future work), we rely on two search operators that produce onlysmall changes. For a terminal item with non-zero probability, these operatorscan be applied:
—Promote item moves an item to the beginning of its menu list, to reducescrolling time.
—Promote subtree moves an ancestor of the item up one level in the hierarchy,to reduce the number of intermediate items that must be selected to reachthe terminal.
An item or subtree rooted at an ancestor may only be promoted once. Evenwith these constraints, the search space size is exponential in the number oftarget items with non-zero probability in any profile (e.g., if all non-zero itemsin a user profile are in one menu list, then all permutations of these items willbe considered). Exhaustive search is thus impractical for the phone hierarchyshown in Table I; for just the menu containing 12 items mentioned in Section 1,half a billion permutations are possible. A best-first search algorithm, however,gives good results after as few as 100 steps.
3.1 Results
Ideally, we would be able to validate the search procedure based on real userprofiles found in the most commonly used cell phones. We have been unable toacquire such data, unfortunately. Lacking real cell phone user profiles, we canonly illustrate the search procedure in practice, but our results are promising.
ACM Transactions on Computer-Human Interaction, Vol. 14, No. 1, Article 1, Publication date: May 2007.
20 • R. St. Amant et al.
Table VII. Menu Traversal Times, in Seconds,
Showing the Effect of the Optimization of Menu
Structure
Profile Size Initial Cost Final Cost Savings
20 7.325 4.530 37.5%
30 6.962 4.762 31.5%
40 7.009 4.940 29.4%
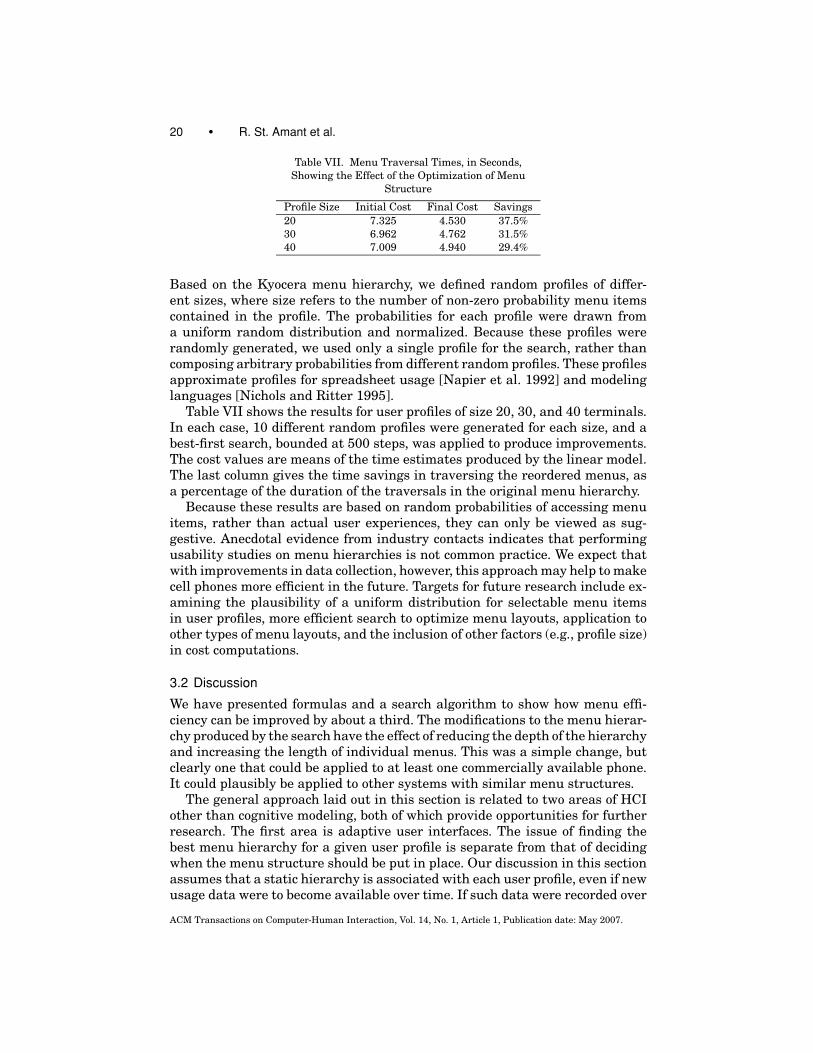
Based on the Kyocera menu hierarchy, we defined random profiles of differ-ent sizes, where size refers to the number of non-zero probability menu itemscontained in the profile. The probabilities for each profile were drawn froma uniform random distribution and normalized. Because these profiles wererandomly generated, we used only a single profile for the search, rather thancomposing arbitrary probabilities from different random profiles. These profilesapproximate profiles for spreadsheet usage [Napier et al. 1992] and modelinglanguages [Nichols and Ritter 1995].
Table VII shows the results for user profiles of size 20, 30, and 40 terminals.In each case, 10 different random profiles were generated for each size, and abest-first search, bounded at 500 steps, was applied to produce improvements.The cost values are means of the time estimates produced by the linear model.The last column gives the time savings in traversing the reordered menus, asa percentage of the duration of the traversals in the original menu hierarchy.
Because these results are based on random probabilities of accessing menuitems, rather than actual user experiences, they can only be viewed as sug-gestive. Anecdotal evidence from industry contacts indicates that performingusability studies on menu hierarchies is not common practice. We expect thatwith improvements in data collection, however, this approach may help to makecell phones more efficient in the future. Targets for future research include ex-amining the plausibility of a uniform distribution for selectable menu itemsin user profiles, more efficient search to optimize menu layouts, application toother types of menu layouts, and the inclusion of other factors (e.g., profile size)in cost computations.
3.2 Discussion
We have presented formulas and a search algorithm to show how menu effi-ciency can be improved by about a third. The modifications to the menu hierar-chy produced by the search have the effect of reducing the depth of the hierarchyand increasing the length of individual menus. This was a simple change, butclearly one that could be applied to at least one commercially available phone.It could plausibly be applied to other systems with similar menu structures.
The general approach laid out in this section is related to two areas of HCIother than cognitive modeling, both of which provide opportunities for furtherresearch. The first area is adaptive user interfaces. The issue of finding thebest menu hierarchy for a given user profile is separate from that of decidingwhen the menu structure should be put in place. Our discussion in this sectionassumes that a static hierarchy is associated with each user profile, even if newusage data were to become available over time. If such data were recorded over
ACM Transactions on Computer-Human Interaction, Vol. 14, No. 1, Article 1, Publication date: May 2007.
Evaluation of Expert Cell Phone Menu Interaction • 21
time for individual users, then a new search could be carried out incremen-tally to find improved menu hierarchies. This function should not be performedlightly, but one now quite real possibility is to treat the automated adaptationof the menu hierarchy as a customization option that users can select at theirown discretion, whenever they choose. It should also be possible to incorporatea theory of learning that could predict when to do this and the costs involvedin learning the new menu structure.
The second related area is support for navigation. A menu hierarchy is asmall, restricted information space in comparison with other spaces such asthe World Wide Web. The modifications explored by the search procedure areonly a small subset of possible transformations that might be applied to an in-terface. Nevertheless, some of the same conceptual issues apply to the analysisof navigation in general. For example, usage frequency could be used for improv-ing navigation on a web site by promoting links upward toward the site entrypage and move specific links closer to the top of their pages [Ritter et al. 2005].
In practice, the most effective approach to navigation redesign addresses thesemantics of the information space rather than focusing only on its surface orga-nization and presentation [Young 1998]. For menu hierarchy modification, thisimplies that greater potential benefits can be gained from examining the seman-tic relationships between menu categories and menu items than their ordering.
The most relevant research along these lines is Pirolli’s work on optimal-foraging theory and information scent [Pirolli 1997, 2003]. Optimal-foragingtheory explains behavior adaptations in terms of resource availability and con-straints. In its application to menu navigation, information scent is a metaphorfor visible semantic cues that lead users to information they seek. Pirolli hasdeveloped an extension of ACT-R, called ACT-IF, to evaluate a foraging model ofinformation navigation. ACT-IF relies on a spreading activation network to cap-ture associations in memory processing. The models described in our article arebased on the assumption that associations between menu items such as Soundsand Ringer Volume can be directly retrieved from memory by an expert user. Amore general model, based on ACT-IF, might be able to explain the strength ofthese associations, based on measures of semantic distance. With such flexibil-ity in representation, it would be possible to explore additional modeling issues,such as how novice users might traverse an unfamiliar menu hierarchy, whichpaths through the hierarchy are more likely to result in errors, and how re-naming or recategorizing menu items could influence navigation performancemore than just reordering.
4. CONCLUSION
In this article we have described a set of evaluation concepts and tools to supportcell phone menu design. The GOMS model is able to predict user performancevery well. The ACT-R model performs almost as well. It took more effort tocreate, but also provide more detailed predictions and could be used for a widerrange of analyses. Although our work has relied on a simpler performancemodel, both of these models could be used by a simple, efficient algorithm tooptimize the redesign of cell phone menus. The redesign could let users on
ACM Transactions on Computer-Human Interaction, Vol. 14, No. 1, Article 1, Publication date: May 2007.

22 • R. St. Amant et al.
average perform their tasks about 30% faster, based on plausible assumptionsabout usage.
This menu redesign approach is simple; we believe it is simple enough tobe taught to and used by designers. This approach is based on knowing users(through the models) and knowing their tasks. In its simplest form, the ap-proach is to reorder the menu items to put the most commonly used tasks ear-lier and higher in the hierarchy. Where users’ task frequencies are not known orvary widely between users, it appears reasonable to allow the system to reorderitself upon a user’s request after a sufficient break-in period. Of course, the se-mantics of the task and the semantics of the task titles will have a role to playas well, which we did not explore here. Others are working with ACT-R to createmodels that start to take account of this aspect of interaction [Pirolli 2003].
These models and the optimization algorithm bring together several inter-esting aspects of human behavior and show how a simple AI algorithm canhelp in HCI design. It also gives rise to both theoretical and practicalimplications.
Theoretically, novice user actions, learning, error recovery behavior, perfor-mance under stress, and generality across different devices are now areas ripefor further exploration. Having the models in hand also let us explore and ex-plain new regularities in user behavior, such as the variations in key press timeshown in Figure 8.
From a practical standpoint, developers have models that are ready for use—these models are general enough that they do not require cognitive modelingexpertise or programming skill to apply them to different traversal tasks, indifferent menu hierarchies, or on different cell phones. Our longer-term goals forthis research include the application of modeling techniques to provide insightsinto usability issues [Nichols and Ritter 1995] and the development of bettercognitive modeling tools for evaluating and designing more general classes ofuser interfaces [Ritter et al. 2006; St. Amant et al. 2004a].
We believe that as modeling concepts and techniques become more accessibleto HCI developers, they will become increasingly significant in their contribu-tion to improving user interfaces. Wide application of the menu design approachin this article could, for example, save significant amounts of time. If 2 billionusers were to use their cell phone menus every day for just three seconds, ourimprovements could save almost 30 years of user time per day.
ACKNOWLEDGMENTS
The authors would like to thank three anonymous reviewers for their incisivecomments, which significantly improved the analysis and discussion in thisarticle.
REFERENCES
ANDERSON, J. R., BOTHELL, D., BYRNE, M. D., DOUGLASS, S., LEBIERE, C., AND QUIN, Y. 2004. An
integrated theory of the mind. Psych. Rev. 111, 4, 1036–1060.
BYRNE, M. D. 2001. ACT-R/PM and menu selection: Applying a cognitive architecture to HCI.
Int. J. Human-Comput. Stud. 55, 1, 41–84.
ACM Transactions on Computer-Human Interaction, Vol. 14, No. 1, Article 1, Publication date: May 2007.

Evaluation of Expert Cell Phone Menu Interaction • 23
DIPRIMA, D. 2006. Cellular market rising above 2.14 billion subscribers. telecombeat.com (http://
www.telecombeat.com/content/view/4689).
FITTS, P. M. 1954. The information capacity of the human motor system in controlling the am-
plitude of movement. J. Exper. Psych. 47, 381–391.
GRAY, W. D., JOHN, B. E., AND ATWOOD, M. E. 1993. Project Ernestine: Validating a GOMS analysis
for predicting and explaining real-world task performance. Human-Comput. Interac. 8, 3, 237–
309.
HAMMING, R. W. 1962. Numerical Methods for Scientists and Engineers. Dover, New York.
HORNOF, A. J. AND KIERAS, D. E. 1997 Cognitive modeling reveals menu search is both random
and systematic. In Proceedings of the ACM Conference on Human Factors in Computing Systems(CHI ’97) (Atlanta, GA). ACM, New York, 107–114.
JOHN, B. E. 2003. Information processing and skilled behavior. In HCI Models, Theories, andFrameworks, J. M. Carroll, Ed. Morgan Kaufman, San Francisco, CA.
JOHN, B. E. AND KIERAS, D. E. 1996a. Using GOMS for user interface design and evaluation: Which
technique? ACM Trans. Comput.-Hum. Interact. 3, 4, 287–319.
JOHN, B. E. AND KIERAS, D. E. 1996b. The GOMS family of user interface analysis techniques:
Comparison and contrast. ACM Trans. Comput.-Hum. Interact. 3, 4, 320–351.
JOHN, B. E., PREVAS, K., SALVUCCI, D. D., AND KOEDINGER, K. 2004. Predictive human performance
modeling made easy. In Proceedings of the ACM Conference on Human Factors in ComputingSystems (CHI ’04) (Vienna, Austria). ACM, New York, 455–462.
KIERAS, D. 1999. A Guide to GOMS Model Usability Evaluation using GOMSL and GLEAN3.
University of Michigan, Ann Arbor, MI.
KIERAS, D. E. 2002. Model-based evaluation. In The Human-Computer Interaction Handbook,
J. A. Jacko and A. Sears, Eds. LEA, Mahwah, NJ.
KIERAS, D. AND MEYER, D. E. 1997. An overview of the EPIC architecture for cognition and
performance with application to human-computer interaction. Hum.-Comput. Interact. 12, 4,
391–438.
MACKENZIE, I. S. 2003. Motor behavior models for human-computer interaction. In HCI Models,Theories, and Frameworks, J. M. Carroll, Ed. Morgan Kaufman, San Francisco, CA.
NAPIER, A., BATSELL, R., LANE, D. M., AND GUADAGNO, N. 1992. Knowledge of command us-
age in a spreadsheet program: Impact on user interface design and training. Data BASE 23,
13–21.
NEWELL, A. 1990. Unified Theories of Cognition. Harvard University Press, Cambridge, MA.
NICHOLS, S. AND RITTER, F. E. 1995. A theoretically motivated tool for automatically generating
command aliases. In Proceedings of the ACM Conference on Human Factors in Computing Systems(CHI ’95). ACM, New York, 393–400.
PIROLLI, P. 1997. Computational models of information scent-following in a very large browsable
text collection. In Proceedings of the ACM Conference on Human Factors in Computing Systems(CHI ’97). ACM, New York, 3–10.
PIROLLI, P. 2003. Exploring and finding information. In HCI Models, Theories, and Frameworks,
J. M. Carroll, Ed. Morgan Kaufman, San Francisco, CA.
POGUE, D. 2005. The cellphone that does everything imaginable, at least sort of. The New YorkTimes, May 12, 2005.
RITTER, F. E. 1991. Towards fair comparisons of connectionist algorithms through automatically
generated parameter sets. In Proceedings of the 13th Annual Conference of the Cognitive ScienceSociety. 877-881.
RITTER, F. E., FREED, A. R., AND HASKETT, O. L. 2005. User information needs: The case of university
department web sites. ACM Interact. 12, 5, 19–27.
RITTER, F. E., HAYNES, S. R., COHEN, M., HOWES, A., JOHN, B., BEST, B., LEBIERE, C., JONES, R. M.,
CROSSMAN, J., LEWIS, R. L., ST. AMANT, R., MCBRIDE, S. P., URBAS, L., LEUCHTER, S., AND VERA, A.
2006. High-level behavior representation languages revisited. In Proceedings of ICCM—2006—Seventh International Conference on Cognitive Modeling. D. Fum, F. del Missier and A. Stocco,
Eds. Edizioni Goliardiche, Trieste, Italy, 404–407.
RITTER, F. E. AND YOUNG, R. M. 2001. Embodied models as simulated users: Introduction to
this special issue on using cognitive models to improve interface design. Int. J. Hum.-Comput.Stud. 55, 1, 1–14.
ACM Transactions on Computer-Human Interaction, Vol. 14, No. 1, Article 1, Publication date: May 2007.

24 • R. St. Amant et al.
ST. AMANT, R., FREED, A., AND RITTER, F. E. 2004a. Specifying ACT-R models of user interaction
with a GOMS language. Cog. Syst. Res. 6, 1, 71–88.
ST. AMANT, R., HORTON, T. E., AND RITTER, F. E. 2004b. Model-based evaluation of cell phone menu
interaction. In Proceedings of the ACM Conference on Human Factors in Computing (CHI ’04).ACM, New York, 343–350.
SALVUCCI, D. 2001. Predicting the effects of in-car interface use on driver performance: An inte-
grated model approach. Int. J. Hum.-Comput. Stud. 55, 1, 85–107.
SALVUCCI, D. D. AND LEE, F. J. 2003. Simple cognitive modeling in a complex cognitive architecture.
In Proceedings of the ACM Conference on Human Factors in Computing Systems (CHI ’03) (Fort
Lauderdale, FL). ACM, New York, 265–272.
SILFVERBERG, M., MACKENZIE, I. S., AND KORHONEN, P. 2000. Predicting text entry speed on mo-
bile phones. In Proceedings of the ACM Conference on Human Factors in Computing Systems(CHI ’00). ACM, New York, 9–16.
YOUNG, R. M. 1998. Rational analysis of exploratory choice. In Rational models of cognition, M.
Oaksford & N. Chater, Eds. Oxford University Press, Oxford, UK, 469–500.
Received August 2004; revised April 2006; accepted May 2006 by Robin Jeffries
ACM Transactions on Computer-Human Interaction, Vol. 14, No. 1, Article 1, Publication date: May 2007.


![STATEMENT OF EXPERT EVALUATIONrossprobatejuvenile.com/17.1 Statement of Expert Evaluation.pdfSTATEMENT OF EXPERT EVALUATION [Sup. R. 66 & R.C. 2111.49] Definition of Incompetent [O.R.C](https://img.dokumen.tips/doc/110x75/5fb2c161d5b056658e4ea89c/statement-of-expert-evaluatio-statement-of-expert-evaluationpdf-statement-of-expert.jpg)