Embed Size (px)
Citation preview

University of PennsylvaniaScholarlyCommons
Senior Design Reports (CBE) Department of Chemical & BiomolecularEngineering
4-1-2010
MODEL-BASED CONTROL WITHSTOCHASTIC SIMULATORS: BUILDINGPROCESS DESIGN AND CONTROLSOFTWARE FOR CATALYTICALLYENHANCED MICROSYSTEMSMatthew T. CurnanUniversity of Pennsylvania
Arjun GopalratnamUniversity of Pennsylvania
Charles G. SlominskiUniversity of Pennsylvania
Eric WangUniversity of Pennsylvania
This paper is posted at ScholarlyCommons. http://repository.upenn.edu/cbe_sdr/18For more information, please contact [email protected].

MODEL-BASED CONTROL WITH STOCHASTIC SIMULATORS:BUILDING PROCESS DESIGN AND CONTROL SOFTWARE FORCATALYTICALLY ENHANCED MICROSYSTEMS
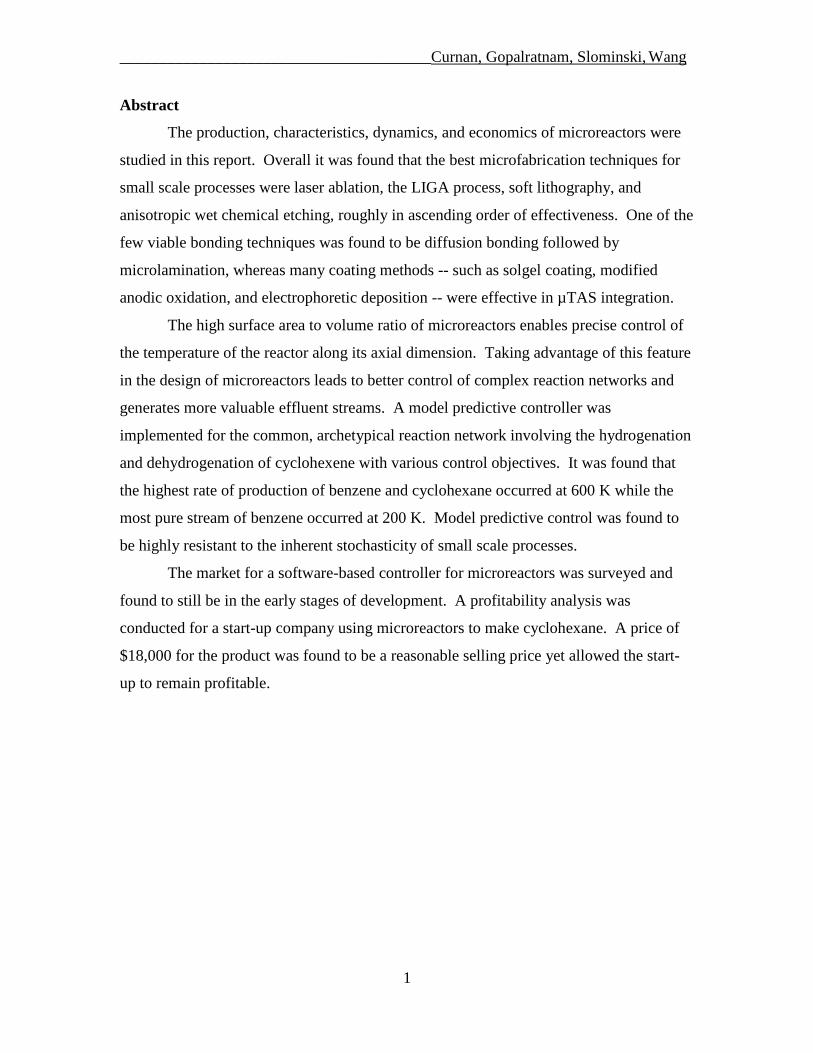
AbstractThe production, characteristics, dynamics, and economics of microreactors were studied in this report.Overall it was found that the best microfabrication techniques for small scale processes were laser ablation, theLIGA process, soft lithography, and anisotropic wet chemical etching, roughly in ascending order ofeffectiveness. One of the few viable bonding techniques was found to be diffusion bonding followed bymicrolamination, whereas many coating methods -- such as solgel coating, modified anodic oxidation, andelectrophoretic deposition -- were effective in μTAS integration.
The high surface area to volume ratio of microreactors enables precise control of the temperature of thereactor along its axial dimension. Taking advantage of this feature in the design of microreactors leads to bettercontrol of complex reaction networks and generates more valuable effluent streams. A model predictivecontroller was implemented for the common, archetypical reaction network involving the hydrogenation anddehydrogenation of cyclohexene with various control objectives. It was found that the highest rate ofproduction of benzene and cyclohexane occurred at 600 K while the most pure stream of benzene occurred at200 K. Model predictive control was found to be highly resistant to the inherent stochasticity of small scaleprocesses.
The market for a software-based controller for microreactors was surveyed and found to still be in the earlystages of development. A profitability analysis was conducted for a start-up company using microreactors tomake cyclohexane. A price of $18,000 for the product was found to be a reasonable selling price yet allowedthe start-up to remain profitable.
This working paper is available at ScholarlyCommons: http://repository.upenn.edu/cbe_sdr/18
Department of Chemical & Biomolecular Engineering
Senior Design Reports
University of Pennsylvania 2010
Model-Based Control with Stochastic Simulators:
Building Process Design and Control Software
for Catalytically Enhanced Microsystems
Matthew T. Curnan University of Pennsylvania
Arjun Gopalratnam University of Pennsylvania
Charles G. Slominski University of Pennsylvania
Eric Wang University of Pennsylvania


Model-Based Control with Stochastic Simulators:
Building Process Design and Control Software for
Catalytically Enhanced Microsystems
Chemical and Biomolecular Engineering 459
Professor Leonard A. Fabiano
April 27, 2010
Matthew T. Curnan
Arjun Gopalratnam
Charles G. Slominski
Eric Wang
Department of Chemical and Biomolecular Engineering
University of Pennsylvania
Project Advisor: Dr. Talid R. Sinno
Project Recommended By: Dr. Talid R. Sinno, University of Pennsylvania


April 27, 2010
Department of Chemical and Biomolecular Engineering
School of Engineering and Applied Science
University of Pennsylvania
220 S. 34th
Street
Philadelphia, PA 19104
Dear Drs. Talid Sinno and Warren Seider, and Professor Leonard Fabiano,
Enclosed in this book is the final copy of our Senior Design Report on Model-Based
Control with Stochastic Simulators: Building Process Design and Control Software for
Catalytically Enhanced Microsystems. A software product consisting of a model
predictive controller for use with stochastic processes was developed using kinetic Monte
Carlo simulations to model chemical reactions carried out in a microreactor. The
controller optimizes processes for a range of control goals and is capable of handling
stochasticity inherent in reactions carried out in microreactors. The capability of the
controller was tested through simulations of cyclohexene hydrogenation and
dehydrogenation.
The current marketplace for a microreactor controller was found to be limited since
microreactors have not yet been widely accepted in industry. A profitability analysis was
performed to determine the feasibility and price of selling a microreactor controller to a
start-up company producing benzene through the dehydrogenation of cyclohexene.
Sincerely,
Matthew T. Curnan Arjun Gopalratnam
Charles G. Slominski
Eric Wang

Table of Contents
Abstract ...............................................................................................................................1
1 Introduction to Microreactors .......................................................................................2
1.1 Definition and Characteristics of Microreactors ............................................................2
1.2 Advantages and Considerations when Using Microreactors .........................................2
1.3 A Selection of Applications of µTAS and Microreactors ..............................................6
1.4 Overview of Production Techniques .............................................................................8
1.5 Project Charter .............................................................................................................20
1.6 Innovation Map ............................................................................................................21
2 Method of Solution ........................................................................................................22
2.1 Modeled Reactor Types ...............................................................................................22
2.2 Stochastic Processes.....................................................................................................23
2.3 The Kinetic Monte Carlo Method ................................................................................23
2.4 SPPARKS ....................................................................................................................25
2.5 Description of the Numerical Method .........................................................................25
2.6 General Control Goals and Strategies ..........................................................................26
3 Control of Cyclohexene Hydrogenation and Dehydrogenation................................27
3.1 Introduction to Catalyzed Hydrogenation and Dehydrogenation Reactions ...............27
3.2 Description of Reaction Networks, Mechanisms, and Initial Catalysts.......................38
3.3 Heterogenous Catalyst Analysis and Selection ............................................................33
4 Results of the Microreactor Simulations ....................................................................35
4.1Temperature Effects ......................................................................................................35
4.2 Tanks-in-a-series Approximation Results ....................................................................37
4.3 Meeting Control Goals .................................................................................................37
4.4 Conclusions of the Microreactor Simulations..............................................................39
5 Financial Analysis .........................................................................................................41
5.1 Microreactor Market ....................................................................................................41
5.2 Profitability Analysis ...................................................................................................42
6 Conclusions ....................................................................................................................47
7 Acknowledgements .......................................................................................................48
8 Bibliography ..................................................................................................................49
Appendix A. SPPARKS Commands ..............................................................................51
Appendix B. PHP Code ...................................................................................................59

_______________________________________Curnan, Gopalratnam, Slominski, Wang
1
Abstract
The production, characteristics, dynamics, and economics of microreactors were
studied in this report. Overall it was found that the best microfabrication techniques for
small scale processes were laser ablation, the LIGA process, soft lithography, and
anisotropic wet chemical etching, roughly in ascending order of effectiveness. One of the
few viable bonding techniques was found to be diffusion bonding followed by
microlamination, whereas many coating methods -- such as solgel coating, modified
anodic oxidation, and electrophoretic deposition -- were effective in µTAS integration.
The high surface area to volume ratio of microreactors enables precise control of
the temperature of the reactor along its axial dimension. Taking advantage of this feature
in the design of microreactors leads to better control of complex reaction networks and
generates more valuable effluent streams. A model predictive controller was
implemented for the common, archetypical reaction network involving the hydrogenation
and dehydrogenation of cyclohexene with various control objectives. It was found that
the highest rate of production of benzene and cyclohexane occurred at 600 K while the
most pure stream of benzene occurred at 200 K. Model predictive control was found to
be highly resistant to the inherent stochasticity of small scale processes.
The market for a software-based controller for microreactors was surveyed and
found to still be in the early stages of development. A profitability analysis was
conducted for a start-up company using microreactors to make cyclohexane. A price of
$18,000 for the product was found to be a reasonable selling price yet allowed the start-
up to remain profitable.

_______________________________________Curnan, Gopalratnam, Slominski, Wang
2
1 Introduction to Microreactors
1.1 Definition and Characteristics of Microreactors
In the context of chemical microsystems, microreactors can generally be defined
as miniature reaction systems operating from the nanometer to the sub-millimeter scale
that are constructed through the methods and devices implemented in micro- and
nanofabrication (Ehrfeld 2000). Traditionally these reactors were small, tubular, and
used almost exclusively to test the performance of catalysts; however, recent
improvements in the microfabrication of sensors and actuators on the same scale has
allowed for their integration with microreactors to form micro-total-analysis-systems
(μTAS). These systems are comprised of individual components – such as heat
exchangers, mixers, and separators – that are known as elements. Upon integrating these
elements into a single system via a continuously flowing fluid stream, each of them
constitutes a fundamental structure or unit of the microsystem. By virtue of this
construction, microreactor units are conducive to being linked in series to accomplish the
tasks typically undertaken by macroscale reactors (Jensen 2001). Through this design
project, microreactors will be studied in reaction – rather than analysis – systems. In the
latter case, devices such as pulse microreactor-chromatographs are used to gather
chemical data not directly involved in the optimization of an industrial process; a prime
example of this is the acquisition of rate constants and energies of activation of the
isomerization reactions of xylene over a zeolite catalyst (Li 1992). In contrast, reaction
systems aim to find the optimal conditions at which a process should be run (Ehrfeld
2000), such as the control of cyclohexene hydrogenation and dehydrogenation to
maximize the final concentration of either benzene or cyclohexane products (Nassar
2006).
1.2 Advantages and Considerations in Using Microreactors
In order to more fully appreciate the characteristic differences between typical
macroscale reactors and microreactors, the differences themselves should be thought of
as either property or production oriented. The differences in chemical properties largely
allow microreactors to conduct reactions at more extreme conditions and thus achieve
higher yields; specifically, the properties that enable this are:

_______________________________________Curnan, Gopalratnam, Slominski, Wang
3
Heat Transfer Properties: In microreactors and the microfluidic channels leading
to them, heat and mass transfer properties – such as heat transfer coefficients (h),
hydraulic diameter (Dh), and Reynolds Number (Re) – are largely improved. This
augmentation results from the high surface-to-volume ratio of microfluidic
channels themselves, which is equivalent to their low values of Dh. For instance,
the surface-volume ration of a 1.5 mL microreactor is 200 as compared to 0.6 for
a 1 m3 reactor. Considering that h is inversely proportional to Dh, heat transfer
must increase with decreasing channel diameter. In addition, Re is directly related
to Dh, meaning that outside of extreme cases, convection can almost always be
modeled assuming laminar fluid flow holds (Incropera 2007).
o For gaseous systems, continuum heat transfer equations are invalidated
when Dh is on the same order of magnitude as or is less than the mean free
path of the reacted gas.
o In liquid reactions, approximations of velocity distributions and pressure
drops of the fluid flow over the channels are invalidated when Dh < 1 μm.
Pressure Drop: Due to the inverse relationship between the microchannel aspect
ratio and the pressure drop (ΔP) in packed bed microreactors, higher, more
dangerous pressure drops must be counteracted by decreasing channel length. In
order to do this, cross-sectional channel area (Ac) must be maximized, which can
be accomplished by splitting fluid flow over several channels and maintaining a
high surface-to-volume ratio (Jensen 2001).
Mass Transfer Properties: In packed bed reactors, the increase in surface-to-
volume ratio of smaller catalyst pellets – which can be used here without raising
ΔP unreasonably – has a similar effect on mass transfer. As an example of this,
the cyclohexene hydrogenation reaction spread over multiple channels has a mass
transfer coefficient of approximately 5-15 s-1
, significantly higher than that of
standard reactors (0.01-0.08 s-1
). Therefore, mass transfer-limited processes can
occur in microreactors while maintaining high productivity (Jensen 2001).
Thermal Response Times: The thinness of the interior walls of the microchannels
– which provides low thermal mass and strong thermal contact with the catalysts

_______________________________________Curnan, Gopalratnam, Slominski, Wang
4
lining them – have quick open-loop thermal response times (~10 milliseconds).
This property is critical in temperature control applications, and considering that
this response time is not limiting in achieving hydrogen flux, hydrogenation and
dehydrogenation reactions can be carried out effectively (Jensen 2001).
The Laminar Flow Regime: As mentioned before, laminar flow describes the flow
in microchannels due to favorable heat transfer properties such as larger values of
h (1,500-20,000 W/m2K) and small values of Dh (Incropera 2007). As a result,
uniform, nearly ideal temperature conditions can be applied over microreactors in
very exothermic reactions, avoiding problems such as hot spots, dead zones, and
explosive conditions that limit conventional reactors (Rawlings 2002).
Reaction Pathways: On the macroscopic level, certain reaction pathways once
considered too difficult to pursue in appreciable yields will now become more
feasible due to the increase in heat transfer (Jensen 2001).
Microreactors differ from their macroscale counterparts in production-oriented
and physical ways as well, leading to other distinctions between the two:
Thinness of Channel Walls: As mentioned previously, volatile reactions such as
oxidation, partial oxidation, and highly exothermic reactions are easier to run in
microreactors as a result of their laminar flow and fast thermal response times.
Mechanically, this occurs because the catalyst temperature – which typically lines
the lower three walls of the microchannels and the microreactor itself – can be
controlled within greater precision than in conventional reactors, as almost all of
the heat loss of the microsystem occurs through its thin top walls. Varying the
thickness and thermal conductivity of this wall, dissipation of the heat of reaction
can be effectively controlled. In practice, this significantly dampens the
overshoot and decay of temperature in feedback control loops, allowing the use of
more extreme reaction conditions (Ehrfeld 2000).
Costs of Scale-Up and Application: In microsystems, the connection of multiple
well-stirred microreactors (functionally a set of CSTRs) in parallel – known as
_______________________________________Curnan, Gopalratnam, Slominski, Wang
5
“numbering up” – is essential to the design of μTAS. Despite the advantages of
such systems, they exhibit diminishing economies of scale, as the
microfabrication and precision engineering of microreactors in parallel costs more
than the production of an equally productive conventional reactor typically.
However, these diminishing economies of scale are compensated by any of the
aforementioned benefits of using microreactors, such as using continuous flow
rather than batch reactors, higher selectivity and conversion, less required catalyst,
or improved heat and mass transfer properties (Ehrfeld 2000).
Safety of Microsystems: Several safety-oriented advantages of microreactors have
already been mentioned, such as the ability to operate under highly exothermic
conditions or within explosive limits. By virtue of the multichannel and serial
organization of microsystems, sensors can be placed to immediately detect the
failure of individual microreactors. Microreactors, which release potentially
dangerous chemicals at significantly lower levels than conventional reactors due
to the difference in size, could be efficiently isolated and replaced without
disrupting the entire microsystem. Furthermore, point-of-use microreactor
fabrication is much more feasible, i.e. microsystems are far easier to create on-site
as opposed to being shipped from other locations, which limits the need to
transport and store reactive or hazardous chemicals (Ehrfeld 2000).
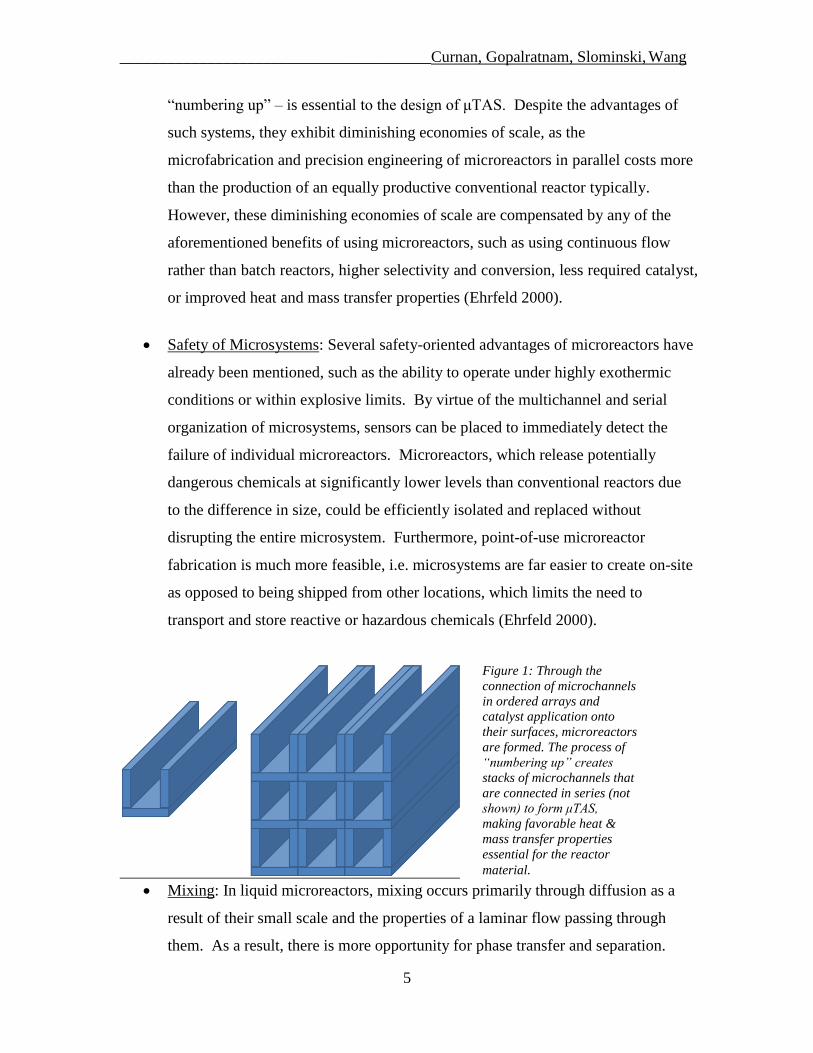
Mixing: In liquid microreactors, mixing occurs primarily through diffusion as a
result of their small scale and the properties of a laminar flow passing through
them. As a result, there is more opportunity for phase transfer and separation.
Figure 1: Through the
connection of microchannels
in ordered arrays and
catalyst application onto
their surfaces, microreactors
are formed. The process of
“numbering up” creates
stacks of microchannels that
are connected in series (not
shown) to form μTAS,
making favorable heat &
mass transfer properties
essential for the reactor
material.

_______________________________________Curnan, Gopalratnam, Slominski, Wang
6
The diffusion length must however retain its small size. This is typically done by
running multiple microchannels of fluid next to one another, separated into
several rows along a line parallel to their interfacial mixing zone. Upon
combination, the diffusion length will be reduced in inverse proportion to the
number of streams combined this way, rapidly mixing the streams prior to
reaction (Jensen 2001).
Concerns of Kinetic Properties and Production: Given that the microreactors
themselves are produced on the micro rather than the nano scale, the general
kinetic relationships governing reaction networks remain unaffected. Despite this,
slight to moderate levels of noise may be present in concentration levels,
reflecting the discrete nature of the chemical reactions in the system and justifying
the use of kinetic Monte Carlo (KMC) methods in modeling feedback control.
Resulting from the highly efficient mass transfer and absence of major flow
irregularities in microsystems, the measurement of the kinetic properties of a
microreactor is more accurate than that of a conventional one (Jensen 2001).
1.3 A Selection of Applications of μTAS and Microreactors
Currently, microreactors are applied to a wide range of disciplines in industry and
academia; these applications range from high throughput screening and combinatorial
chemistry in pharmaceuticals to the fabrication of Micro-electromechanical systems
(MEMS) in electrical engineering. Within the domain of chemical engineering, there are
more applications of microreactors in analysis and reaction systems than can be suitably
explained here. Listed below are several specific chemical engineering applications of
microreactors that have already been put into practice or are particularly promising:
The partial oxidation of an isooctane liquid hydrocarbon feed in a fixed-bed
microreactor, with the intent of producing hydrogen gas via other fuel reformation
reactions, using one of several noble-metal based catalysts (e.g.: Pt-CeO2). A
kinetic model has been established using a Langmuir-Hinschelwood-Hougen-
Watson (LHHW) formulation and the water-gas shift (WGS) reaction that
_______________________________________Curnan, Gopalratnam, Slominski, Wang
7
converts carbon monoxide and water into carbon dioxide and hydrogen gas has
been taken into account (Pacheco 2003).
A pulse microreactor-chromatograph is used in an analysis system to study the
diffusion, adsorption, and reaction kinetics of the isomerization of xylene into its
ortho, meta, and para-substituted forms, in addition to conversion into toluene.
The dynamic analysis used to account for all of these processes occurs over a
HZSM-5 zeolite catalyst, and the rate constants and activation energies of the
Arrhenius form reaction rate expressions are determined with it (Li 1992).
The production of dilute hydrogen peroxide (H2O2) through direct combination of
H2 and O2 in a gaseous microreactor at typically flammable H2 concentrations.
The conventional anthraquinone autoxidation (AO) method used to produce H2O2
is not typically cost effective unless higher concentrations of H2O2 are produced
due to transportation expenses, which are reduced via point-of-use synthesis of
μTAS (Voloshin 2007). In similar studies conducted within the explosive regime,
Pt and Al2O3 were tested for suitability as catalysts for this reaction (Hessel 2005).
In another study, the HZSM-5 zeolite catalyst is used in a purely reaction kinetic
study of methanol conversion to light olefins in a membrane microreactor using
the SAPO-34 molecular sieve. This reaction network, ultimately useful for
modeling the catalytic formation of paraffins, considers the deactivating effects of
carbon coke formation, the effects of methanol partial pressure, and other factors
typically absent from pure Arrhenius expressions of rate equations (Chen 1999).
A comprehensive summary of many kinetic models and reaction networks
planned for synthesis in microreactors is performed in a review conducted by
Watts and Wiles. Among liquid phase pressure-driven microreactors, diazonium
salt synthesis, esterification of boc-glycine, Swern oxidations, are several of the
many reactions referred to and reviewed. Electrochemical synthetic and gas-
liquid phase reactions are also considered in this review (Watts 2006).

_______________________________________Curnan, Gopalratnam, Slominski, Wang
8
1.4.1 Overview of Production Techniques – Structuring
In the mass production of μTAS and microreactors, the most pressing issue of
technical feasibility is microfabrication cost, stemming from the specialized methods and
amount of material required to produce them. For mid to large-scale microreactors – the
microchannel hydraulic diameters of which range from 100-500 μm – metals are the most
common manufacturing material. Typically, these metals are stainless steel alloys, with
compositions dictated by the operating temperature and other conditions of their
contained reactions. High temperature applications, such as hydrocarbon reforming with
the WGS reaction and partial oxidation, frequently use Ni or FeCrAl alloys, the latter of
which is desirable also for the unique method by which catalyst coatings are applied to its
inner surface. For lower temperature applications that require isothermal operating
conditions, such as alcohol reformation and gas purification, Cu and Al are more suitable,
with thermal conductivities (k) of 401 and 236 W/m×K, respectively. For reference,
stainless steel has a k of approximately 15 W/m×K (Hessel 2005).
However, for smaller devices on the order of microelectromechanical machines
(MEMS), or with microchannel Dh of less than 100 μm, quartz, polymers, ceramics, and
glass can be used in high temperature applications (Watts 2006). The most common
material for the uppermost layer of microreactors and microchannels surfaces is Si3N4
due to its temperature insulation effects, while the remaining parts of both are made from
Si for its high heat conductivity (Hessel 2005). Though the insulation provided by Si3N4
is typically favorable, as the catalyst become thermally isolated and power no longer
needs to be supplied to it following reactor ignition, microreactor operation in this
autothermal mode is impractical in applications involving temperature control. For
reactions that reach steady state at intermediate temperatures, such as the hydrogenation
and dehydrogenation of cyclohexene, their selectivities cannot be maximized when
conditions such as flow rate and the surrounding temperature are varied (Jensen 2001).
Even without this insulation wall, temperature control remains problematic due to the
extremely high h values of the pure Si channels (~41,000 W/m2×K), leading to excessive
heat dissipation. In order to minimize energy losses resulting from this, microreactors and
microchannels are typically manufactured from Si-rich materials with less insulation,
such as borosilicate glass, soda-lime-silica glass, PDMS, and PMMA (Watts 2006).
_______________________________________Curnan, Gopalratnam, Slominski, Wang
9
Aware of the materials from which MEMS-scale microreactors can be fabricated,
a number of mass manufacturing methods can be considered for. Several fabrication
methods, although effective in laboratory settings or on conventional reactors, are not
suitable for the mass manufacture of microreactors with Dh below 100 μm, including:
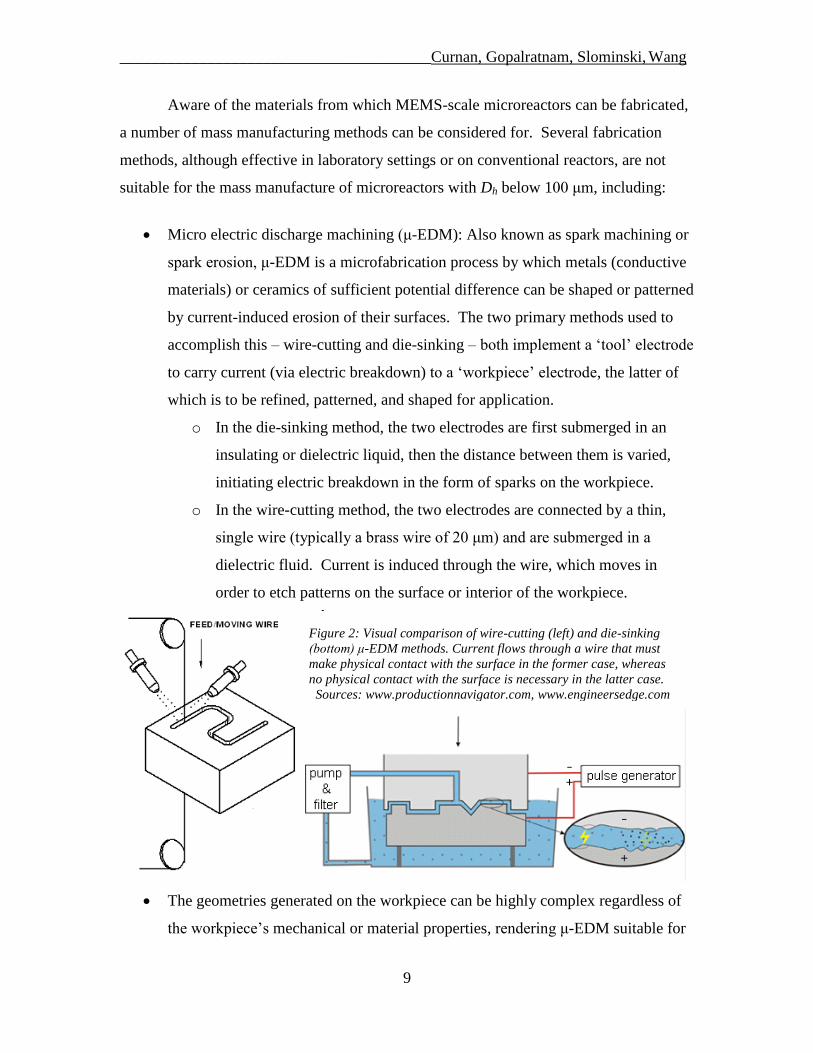
Micro electric discharge machining (μ-EDM): Also known as spark machining or
spark erosion, μ-EDM is a microfabrication process by which metals (conductive
materials) or ceramics of sufficient potential difference can be shaped or patterned
by current-induced erosion of their surfaces. The two primary methods used to
accomplish this – wire-cutting and die-sinking – both implement a „tool‟ electrode
to carry current (via electric breakdown) to a „workpiece‟ electrode, the latter of
which is to be refined, patterned, and shaped for application.
o In the die-sinking method, the two electrodes are first submerged in an
insulating or dielectric liquid, then the distance between them is varied,
initiating electric breakdown in the form of sparks on the workpiece.
o In the wire-cutting method, the two electrodes are connected by a thin,
single wire (typically a brass wire of 20 μm) and are submerged in a
dielectric fluid. Current is induced through the wire, which moves in
order to etch patterns on the surface or interior of the workpiece.
The geometries generated on the workpiece can be highly complex regardless of
the workpiece‟s mechanical or material properties, rendering μ-EDM suitable for
Figure 2: Visual comparison of wire-cutting (left) and die-sinking
(bottom) μ-EDM methods. Current flows through a wire that must
make physical contact with the surface in the former case, whereas
no physical contact with the surface is necessary in the latter case.
Sources: www.productionnavigator.com, www.engineersedge.com

_______________________________________Curnan, Gopalratnam, Slominski, Wang
10
microreactor materials that are chemically resistive, hard, or have larger grain
sizes. In addition, the lack of material contact significantly reduces the cost of
cleaning eroded edges of burr, and patterns can be etched into surfaces of high
aspect ratio. Despite these benefits, however, they are not cost effective in mass
microfabrication and are limited in their precision by the diameter of the wire or
the nature of the fluid in which they are submerged (Hessel 2005).
Micro-milling: Similar to its conventional counterpart, micro-milling involves the
physical pulverization of materials that have already been crushed into more
refined shapes via physical impact. Proven effective in generating architectures
of or below 100 μm, micro milled structures often need further drilling, turning,
and sawing to become useful for application. Primarily, micro-milling is effective
in producing parallel microchannels from iron or aluminum, which require
ceramic or monocrystalline diamond beaters to structure them, respectively. Due
to the equipment needed and difficulties in accurately replicating microchannels,
micro-milling is typically not considered in industrial applications (Hessel 2005).
Micro-punching: A technique typically used in metalworking, micro-punching
can be described as the use of a pressurized drill to create holes and indentations
in a substrate, typically made of metal. Despite its reliability, reproducibility, and
low cost in mass production, most industrial drill bits are limited in creating
channels several hundred micrometers wide, and are accurate to within 50 μm. In
addition, punching techniques are generally only capable of producing straight
channel systems, which is a limiting factor when considering integration into
μTAS that implement non-cross flow heat exchangers. Thus, micro-punching is
too limiting for systems that would require KMC control (Hessel 2005).
Beyond technologies that are impractical for mass microfabrication below 100 μm,
there exists several etching techniques applicable to microreactor manufacturing that
resemble those used in Si wafer photolithography. These include wet (chemical) and dry
(plasma) etching processes, both of which involve subjecting a material surface to UV
radiation after applying a resistive mask over it, the mask itself being patterned to
_______________________________________Curnan, Gopalratnam, Slominski, Wang
11
generate the contour of the microchannel. In the former case, the exposed surface is
eroded by a chemical solution such as FeCl3 or HF, whereas a low pressure plasma or ion
beam is implemented in the latter (Hessel 2005). Specifically, these microfabrication
techniques are applicable to μTAS and microreactors as follows:
Isotropic wet chemical etching: typically used to pattern metal foils, isotropic
etching erodes the silicon surface uniformly in every direction. As a result, it
eliminates surface material underneath the restrictive mask and produces a nearly
cylindrical channel. This contouring, which cannot be controlled, is subject to
severe limitations, such as its imprecision at length scales less than 300 μm. More
importantly, only smaller aspect ratios can be etched isotropically; channels with
significantly greater depth than length will be structurally unstable (the side walls
will be eroded entirely), while those with much larger widths will waste material.
As a result, isotropic wet etching is inadequate for MEMS-scale microreactor
fabrication (Ehrfeld 2000).
Anisotropic wet chemical etching: Originally developed from the micromachining
of both bulk and surface single-crystalline silicon, anisotropic etching features
chemicals (KOH, SbF6, HF, etc.) that erode at different velocities with respect to
crystalline direction. Etching velocity, now a function of radial direction, can be
controlled such that Si underneath the UV mask remains unaffected and different
channel geometries can be created. Even though it is significantly more costly
than isotropic etching and requires a clean room, automation is cost-effective for
small-series production. With the newfound precision control offered by
anisotropic etching, batch processing can create several different structures on a
single wafer in parallel, such as grooves, channels, cantilevers, pumps, valves,
and static mixers. The construction of several of these analytical components on a
single wafer can significantly reduce manufacturing costs, as will be shown later
(Ehrfeld 2000). Thus, anisotropic wet chemical etching is the first viable
microfabrication option introduced here, offering advantages such as:
o Easy combination with thin films, sensors, heaters, and catalysts
_______________________________________Curnan, Gopalratnam, Slominski, Wang
12
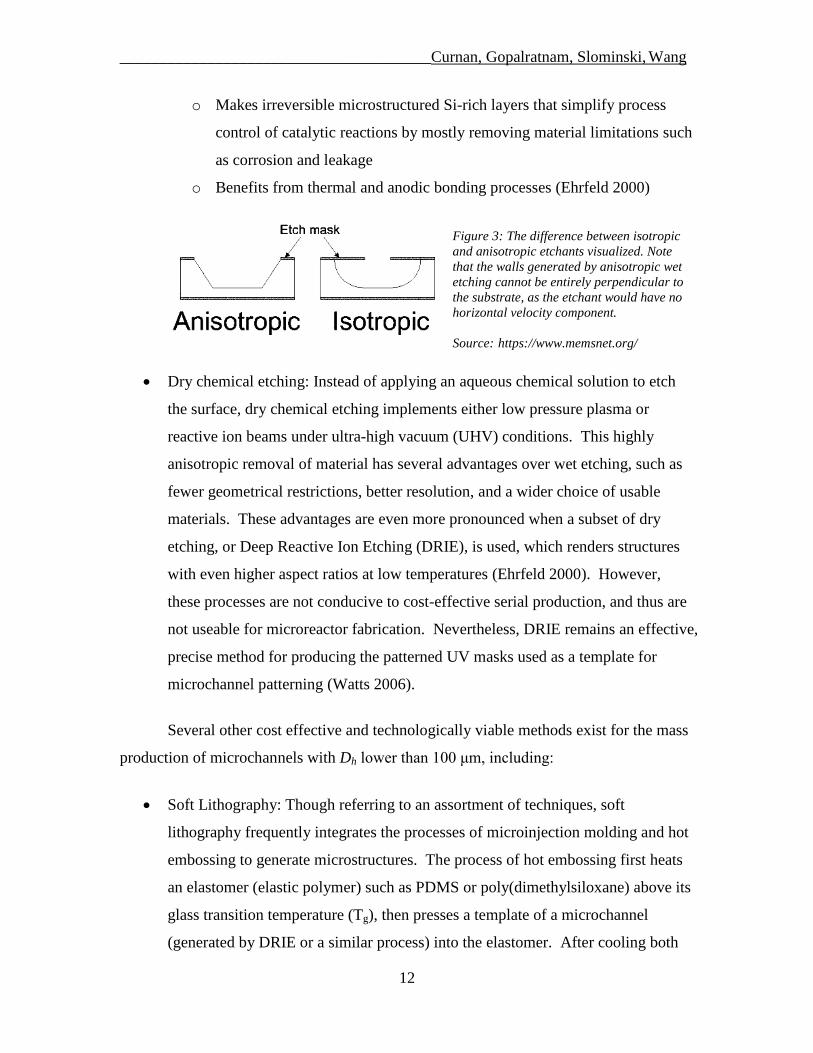
Figure 3: The difference between isotropic
and anisotropic etchants visualized. Note
that the walls generated by anisotropic wet
etching cannot be entirely perpendicular to
the substrate, as the etchant would have no
horizontal velocity component.
Source: https://www.memsnet.org/
o Makes irreversible microstructured Si-rich layers that simplify process
control of catalytic reactions by mostly removing material limitations such
as corrosion and leakage
o Benefits from thermal and anodic bonding processes (Ehrfeld 2000)
Dry chemical etching: Instead of applying an aqueous chemical solution to etch
the surface, dry chemical etching implements either low pressure plasma or
reactive ion beams under ultra-high vacuum (UHV) conditions. This highly
anisotropic removal of material has several advantages over wet etching, such as
fewer geometrical restrictions, better resolution, and a wider choice of usable
materials. These advantages are even more pronounced when a subset of dry
etching, or Deep Reactive Ion Etching (DRIE), is used, which renders structures
with even higher aspect ratios at low temperatures (Ehrfeld 2000). However,
these processes are not conducive to cost-effective serial production, and thus are
not useable for microreactor fabrication. Nevertheless, DRIE remains an effective,
precise method for producing the patterned UV masks used as a template for
microchannel patterning (Watts 2006).
Several other cost effective and technologically viable methods exist for the mass
production of microchannels with Dh lower than 100 μm, including:
Soft Lithography: Though referring to an assortment of techniques, soft
lithography frequently integrates the processes of microinjection molding and hot
embossing to generate microstructures. The process of hot embossing first heats
an elastomer (elastic polymer) such as PDMS or poly(dimethylsiloxane) above its
glass transition temperature (Tg), then presses a template of a microchannel
(generated by DRIE or a similar process) into the elastomer. After cooling both

_______________________________________Curnan, Gopalratnam, Slominski, Wang
13
down, the elastomer becomes a mold of the template ready for on-site self-
replication via microinjection molding or a related process. Microinjection
molding then inserts a heated liquid mass of the desired microreactor material into
the mold, which will solidify to form the reactors themselves. Several advantages
exist in using soft lithography technology, including (Ehrfeld 2000):
o Rapid replication through a template is one of the least expensive, viable
options available for making microchannels with Dh less than 100 μm
o Can be used for the fabrication of mixed ceramic, polymeric, and metallic-
based μTAS (Watts 2006)
o Mass produces high-quality features reliably (Hessel 2005)
However, several limitations also exist in the use of soft lithography technology,
none of which are insurmountable, rendering soft lithography a viable solution for
MEMS-scale microchannel synthesis. These include:
o The mold (typically PDMS) must have higher glass transition and melting
temperatures than that of the channel material
o In microinjection molding, the required size of the needle used to insert
the replicated channel limits the fabrication of sub-micrometer features
o Common, inexpensive mold materials such as PDMS usually swell in the
presence of organic solvents and have limited temperature stability
Therefore, the microchannels will possess the same temperature
limitations as the mold material (Ehrfeld 2000)
o The integration of similarly scaled heat exchanges and controllers
becomes challenging, even in laboratory settings (Hessel 2005)
Laser ablation: In the context of micromachining, laser ablation implements a
pulse laser to heat undesired sections of a solid material, which absorb the energy
and sublime. Though generally considered infeasible due to cost, laser ablation
has become economically viable for small-scale mass production of features
below 100 μm. For microchannel applications that would require KMC control of
reaction kinetics, this is a viable solution, though it is typically more cost effective
when integrated with other production methods such as LIGA (Hessel 2005).
_______________________________________Curnan, Gopalratnam, Slominski, Wang
14
Deep lithography + electroforming and molding (LIGA process): One of the most
advanced microfabrication technologies, LIGA (Lithographie, Galvanoformung,
Abformtechnik) is a refined combination of several of the methods presented
previously. Initially, microchannels are formed by photolithography, and are
subjected to an energy source determined by a trade-off between production cost
and resolution of featuers. In order of increasing resolution and cost, typical
energy sources include standard UV radiation, X-ray radiation, high-energy
electron or ion beams, and lasers. After the photoresisting mask is removed, the
Si-rich contoured substrate is used to generate a metal template via electroforming,
or the deposition of Ni, Cu, or Au into the eroded contours of the substrate via an
electrolytic reaction between the metal (cathode) and an ionized etchant solution
(anode). Lastly, the mold created in this fashion is subjected to microinjection
molding or a related process to mass manufacture microchannels. Within the
domain of Dh below 100 μm, UV or X-ray radiation would be suitable, and
subject to the following advantages and limitations (Ehrfeld 2000):
Advantages:
o Aspect ratios on the order of 100:1 with high qualitative surface quality,
structural details on the μm scale can be replicated over centimeters
o Micropumps and control devices have already been integrated into LIGA,
accompanied with ceramic binders
o Channel walls can be made more closely perpendicular (~89.95°) to their
substrate (more rectangular) than can be realized in wet etching methods
o Materials such as metals, metallic alloys, ceramics, and polymers can be
used, though non-metals have limitations in mass production
o The temperature tolerance of the mold, which is now composed of metal,
does not limit that of the MEMS-scale devices (Ehrfeld 2000)
Limitations:
o Polymer-binded ceramics are limited by sintering and warpage in quality
o Surface roughness cannot be controlled on the micrometer scale
o Difficulties associated with plating into non-metal molds:

_______________________________________Curnan, Gopalratnam, Slominski, Wang
15
Voids, indicated by hydrogen bubble nucleation in etchant solution
Chemical incompatibility between the Si-rich substrate and the
electroplated metal is common
Mechanical incompatibility between the metal plating and the
substrate causes can cause loss of adhesion (Ehrfeld 2000)
1.4.2 Overview of Production Techniques – Bonding & Coating
Microreactors that require KMC control device implementation, namely those
with reactor microchannels with hydraulic diameter of less than 100 μm, can only be
manufactured in a cost effective fashion under specific conditions. Namely, the channels
themselves must be manufactured from Si-rich materials – such as borosilicate glass,
soda-lime-silica glass, PDMS, and PMMA – and can only be fabricated using soft
lithography, anisotropic wet chemical etching, laser ablation, or the LIGA process.
Reducing the selection of microfabrication method candidates to the former and latter as
a result of microscopic resolution and implementation issues, the types of bonding
techniques available for integration with μTAS systems are heavily limited. Typically,
anodic bonding of borosilicate (Pyrex) glass covers is used for this purpose, but unless
modified, this method is not cost effective for mass production (Hessel 2006).
In addition, gaskets are impractical due to the scale of the system, and all forms of
welding (conventional, laser, electron beam, etc.) are cost ineffective as a result of the
heat transfer and melting properties of the microchannel materials. Similar to non-
precision welding methods, the low-cost methods of brazing and soldering are severely
limited by the presence of heavy metal catalysts that are highly reactive at temperatures
lower than the melting point of the microchannel material. Sintering, or the heating of
powdered substrates at near-melting point temperatures to adhere them together, is also
impractical due to the poor microscopic resolution generated by the technique. One of
the few adequate techniques for this is diffusion bonding, in which a large contact
pressure (on the order of several hundred bar) is applied to separate substrate materials at
high temperature (50-80% of their melting point) and under UHV conditions (Hessel
2006). Through this technique, microchannels can be sealed irreversibly, but

_______________________________________Curnan, Gopalratnam, Slominski, Wang
16
interconnection of them must proceed through a special technique called microlamination
(Ehrfeld 2006).
Similar to its macroscopic counterpart, microlamination interconnects several thin
metal sheets (also known as shims or laminates) with thickness on the order of several
hundred micrometers. These sheets, which can contain various microstructures such as
heat exchangers, micropumps, and open channel systems, are usually fabricated through
wet chemical etching and laser cutting rather than soft lithography (Ehrfeld 2006). There
are few limitations on the types of materials that can be microlaminated, and the method
has seen widespread use in fuel evaporation and reforming applications. Individual
components of microreactors can be achieved by laminating pattered ceramic (Si) tapes,
and three-dimensional architectures can be actualized through systemized stacking of
multiple laminates. For these reasons, anisotropic wet chemical etching proves to be the
most versatile of the industrial manufacturing methods presented thus far, considering
such factors as cost, μTAS integration, and previous implementation (Jensen 2001).
Unlike microfabrication and bonding methods, which are highly limited by cost
efficiency, feature resolution, and other factors, the coating of microchannels with
catalytically active material can be pursued successfully through multiple methods for
MEMS-scale devices. The coating process, which effectively creates microreactors from
catalyst covered microchannels (Jensen 2001), is a more cost effective alternative to
fabricating microchannels purely from the catalyst itself. In addition, it is required in
industrial applications, as processes such as sputtering and chemical vapor deposition
(CVD) do not generate enough surface area upon which catalysts can be deposited to
achieve sufficient reactor productivity (Hessel 2006). Currently, three methods of
coating are most widely seen in industrial applications (Ouyang 2003):
Sol-gel Coating: The use of a sol-gel – a chemical solution formed into a gel by
being subjected to several forms of hydrolysis and polycondensation – is
convenient for coating microreactors by virtue of its low viscosity. As a result,
low viscosity gels of titania (TiO2), silica (SiO2), and alumina (Al2O3) can be
formed and simply pumped through the microchannels to coat them. Extensive
research has been performed in optimizing this coating process for application in

_______________________________________Curnan, Gopalratnam, Slominski, Wang
17
industry, and has determined that the adhesion of the coat to the microchannel is
greatly enhanced by the prior addition of a thin alumina layer. Cost minimization
in this fashion, however, causes phase transition from alumina to corundum and
sintering at high temperatures (~800 °C). As a result, the use of this highly cost
effective method encourages the use of heavy, more expensive metal catalysts
such as Pt and Pd; a common combination of coating layer and catalyst that can
be applied to μTAS involving KMC controllers is Pt/Al2O3 (Hessel 2006).
Anodic Oxidation: Through the use of an electrolytic cell – similar to that seen in
μ-EDM – an amorphous hydrated alumina can be deposited onto a “workpiece”
anode containing a microchannel array from an aluminum-based cathode. This
arrangement, producing an array of hexagonal cells that contain a pore at their
center, creates highly uniform coating layers with highly ordered pores. However,
the exact oxidation method used in laboratories is cost ineffective for industry
applications, and is modified appropriately. Specifically, the modifications entail
the use of the aluminum alloy AlMg3 on the cathode, the connection of the two
electrodes with thin aluminum wires, and the impregnation of the catalyst carriers
with Pt. With this reduction in process design cost, anodic oxidation is rendered
an adequate method for the industrial coating of microreactors (Hessel 2006).
Electrophoretic Deposition: Encompassing a larger range of coating techniques
that coat microstructures with catalyst powders in industry, this process deposits
particles suspended in a liquid colloid via induction from an electrical field.
Similar to anodic oxidation, particles deposited onto the “workpiece” electrode
and portions of the microchannels themselves must contain an inherent charge, a
surmountable challenge in the case of Si-rich MEMS-scale devices. Most
experimental work attempting to achieve this has involved the deposition of
alumina and Pd layers. In the event that this requirement can be overcome,
electrophoretic deposition has several advantages, such as high coating speed,
high purity, and facile control of coating layer thickness (Hessel 2006).

_______________________________________Curnan, Gopalratnam, Slominski, Wang
18
Figure 4: Implementation
of soft lithography (left) hot
embossing method and
anodic oxidation (right) to
pattern a substrate. The
substrate masked with a
photoresist is molded by
physical means before
photolithography and wet
chemical etching are used
to refine its features and
remove the resist. Physical
contact between the mold
and the substrate is not
necessary for anodic
oxidation, as is seen here.
Source: www.ntt-review.jp
1.4.3: Overview of Production Techniques – Micropumps
Upon integration into μTAS that would require KMC controllers, accurate
pumping mechanisms are required to provide information to the control software.
Though many mechanisms exist that can accomplish this, they are typically classified as
either mechanical or non-mechanical, the latter group containing the important subset of
electrokinetic flow. Mechanical micropumps, which are generally powered by the
movement of a membrane, deliver any type of fluid or gas in discrete units, usually
leading to the disadvantage of pulsed rather than continuous flow. This can create non-
uniform flow, leaking between the pump and the device, and higher dead volume,
problems which are challenging to overcome. Non-mechanical pumps, on the other hand,
have almost the exact opposite benefits and limitations. Based on the direct transfer of
energy, they are continuous and employ capillary or evaporative forces that heavily
reduce leaking, and involve no moving mechanical parts subject to breakdown. On the
other hand, pump performance is almost entirely dictated by the nature of the fluid. Thus,
non-mechanical micropumps are almost universally preferred, given that the feed stream
has favorable properties such as low viscosity and density. Inasmuch as KMC control of
the feed flow is concerned, electrokinetic field induced flow – which acts as both a valve
and a pump – allows for control of both the direction and the magnitude of fluid flow, an
advantageous feature that reduces leaks and thus process design costs (Watts 2006).

_______________________________________Curnan, Gopalratnam, Slominski, Wang
19

_______________________________________Curnan, Gopalratnam, Slominski, Wang
20
1.5 Project Charter

_______________________________________Curnan, Gopalratnam, Slominski, Wang
21
1.6 Innovation Map

_______________________________________Curnan, Gopalratnam, Slominski, Wang
22
Figure 5 shows a common microreactor design (Znidarsic-Plazl 2007). Two reactants enter from different
wells on the left, are mixed at the Y-shaped junction, then react along the length of the reactor. The product
stream is divided into two and sent to different outlets.
2 Method of Solution
2.1 Modeled Reactor Types
Microreactors are generally continuous-flow reactors, as opposed to batch
reactors, since continuous-flow reactors achieve higher throughputs, convert material
faster, transfer heat faster, can be better optimized, and do not need to be emptied and
refilled. Continuous-flow reactors are either tubular or duct reactors, or continuous tank
reactors. Tubular or duct reactors are the preferred microstructure since they require less
total volume, are more spread out, are more easily stacked, are better controlled, and
simultaneously transport material further than continuous tank reactors. A common
microreactor structure is shown in Figure 5.
While flow through microreactors can be simulated with computational fluid
dynamics, such rigor is often unnecessary. In this study, a microreactor of fixed volume
is modeled using a single continuous stirred-tank reactor (CSTR) or series of CSTRs, also
referred to as the tanks-in-a-series model. A depiction of these two models is shown in
Figure 6. The plug flow reactor model is achieved in the limit of an infinite number of
tanks with infinitesimal volume. The serpentine structure and fast relative rate of
diffusion at small length scales justifies the assumption of perfect mixing in these models.

_______________________________________Curnan, Gopalratnam, Slominski, Wang
23
Figure 6a) shows a single CSTR model while Figure 6b shows the tanks-in-a-series model for four tanks. The total
volume is the same in both models.
2.2 Stochastic Processes
A deterministic process is a process whose outcome is determined. The solutions
of ordinary differential equations with initial conditions and partial differential equations
with boundary values are examples of deterministic processes. On the contrary,
stochastic processes are inherently random processes whose outcomes can differ each
time the process is executed for a given set of parameters. While all real processes
involve some degree of stochasticity, it can often be ignored when a large number of
discrete elements are present. Any process involving a relatively small number of
discrete elements where the occurrence of a single event is significant is stochastic. The
stochastic process examined in this study is the kinetic behavior of a relatively small
number of molecules. Other stochastic processes include the growth of a thin film in a
surface deposition process, the risk of assets in a stock portfolio, the medical statistics of
rare diseases, and roulette.
2.3 The Kinetic Monte Carlo Method
The Kinetic Monte Carlo (KMC) method is used to simulate models of stochastic
processes (Gillespie 1992). Process parameters and initial conditions are specified at the
beginning of the simulation. For the ith
time, the rate of each process,rij, corresponding to
the event wj, is computed. The total rate for the ith
time, Ri, is calculated by summing the
individual rates:

_______________________________________Curnan, Gopalratnam, Slominski, Wang
24
Figure 7 gives an example of how events are selected in a KMC simulation. For every time step, each event is
assigned a probability equal to the ratio of its rate to the sum of the rates of all the events for that time step. Each
event is given a range on the interval (0,1) corresponding to the probability it will be selected. Then a random
number is selected on the interval (0,1). The event corresponding to the range in which the random number falls is
chosen for that time step.
𝑅𝑖 = 𝑟𝑖𝑗
𝑀
𝑗=1
where M is the number of processes. The probability that the ith
process will occur is
entered into a vector, P, where:
𝑃1 = 0
and
𝑃𝑗+1 =𝑟𝑗
𝑅+ 𝑃𝑗
To determine which event happens over the current time step, a random number,
𝑢1 ∈ (0,1), is chosen using a random number generator. Then a binary search is
performed on the vector P to find Pk such that 𝑃𝑘−1 < 𝑢1 ≤ 𝑃𝑘 . The event wk-1
corresponding to Pk is chosen to occur. A representation of this process is shown in
Figure 7.
To determine how long of a time step to take, another random number, 𝑢2 ∈ (0,1),
is chosen. It can be shown that the time step for a KMC simulation is (Gillespie 1992):
∆𝑡 = −ln 𝑢2
𝑅
To better understand this time step, consider that the expected value of -ln(u2) is 1. The
system time is incremented by Δt following the selection of an event and its time:
𝑡𝑗+1 = 𝑡𝑗 + 𝛥𝑡
It should be noted that the time step is chosen independently of which event is chosen.
This algorithm is iterated until the system passes a fixed time or is determined to be at
steady state.

_______________________________________Curnan, Gopalratnam, Slominski, Wang
25
2.4 SPPARKS
SPPARKS (Stochastic Parallel PARticle Kinetic Simulator) is a Monte Carlo
code developed by Steve Plimpton, Aidan Thompson, and Alex Slepoy at Sandia
National Laboratories. The code is written in C++ and can be run on a number of
platforms on a single processor or in parallel on multiple processors and/or machines.
SPPARKS is an open source code distributed under the terms of the GNU General Public
License (GPL).
SPPARKS includes kinetic Monte Carlo (KMC), rejection kinetic Monte Carlo
(rKMC), and Metropolis Monte Carlo (MMC) algorithms. An application, either
packaged with SPPARKS or added by the user, defines events and their probabilities and,
together with a solver or a sweeper, determines the evolution of the system. Instructions
for setting up a simulation and select details are presented in Appendix A.
2.5 Description of the Numerical Method
A KMC simulation was set up in SPPARKS for each run. To achieve a CSTR
model, an appropriate molecular flow rate was added and subtracted from the reactor
after 0.2 seconds of each simulation elapsed, as shown in Figure 8. The inlet flow rate is
specified in molecules/second, corresponding to a particular mass flow rate, 𝑚in . The
outlet mass flow rate was set to be equal to the inlet mass flow rate:
𝑚 out = 𝑚 in
Particles were removed in proportion to their mole fractions in the reactor as
dictated by the ideal gas assumption. This led to negligible errors in the mass balance
over time since the mass that needed to be removed from the reactor at each time step
was not always possible given the mole fractions of the species in the reactor.
Figure 8 depicts the method used to add, remove, and react particles and to advance time.
_______________________________________Curnan, Gopalratnam, Slominski, Wang
26
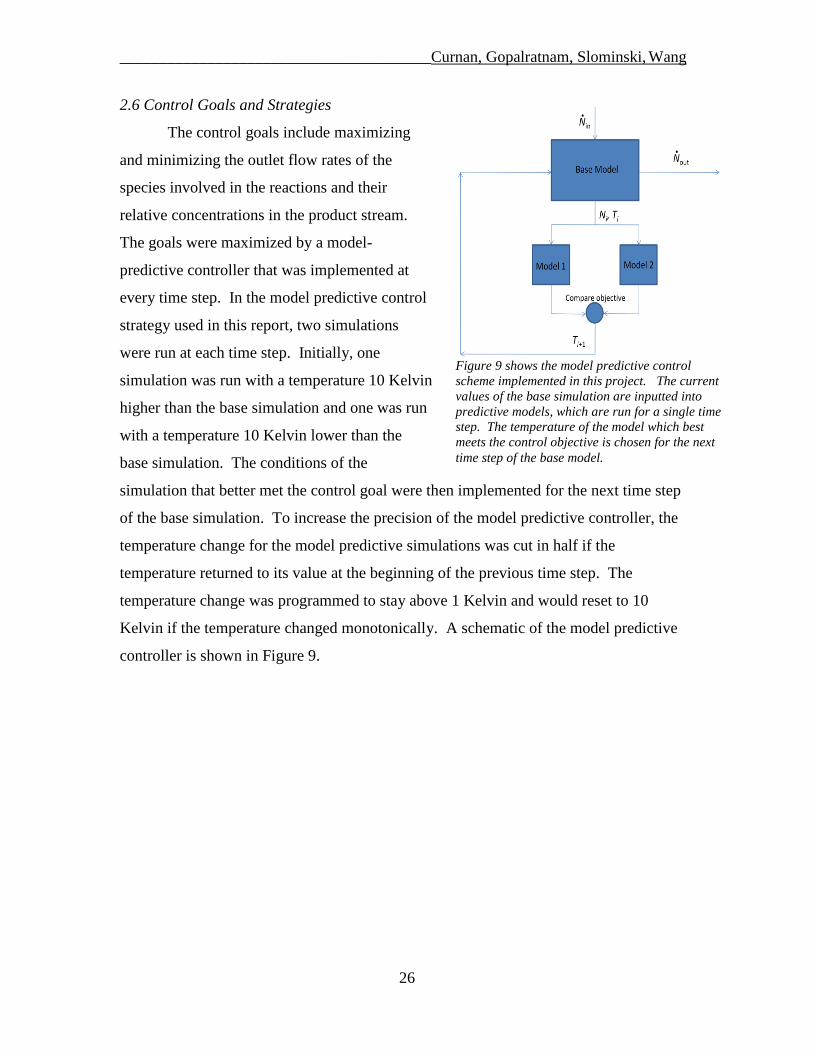
Figure 9 shows the model predictive control
scheme implemented in this project. The current
values of the base simulation are inputted into
predictive models, which are run for a single time
step. The temperature of the model which best
meets the control objective is chosen for the next
time step of the base model.
2.6 Control Goals and Strategies
The control goals include maximizing
and minimizing the outlet flow rates of the
species involved in the reactions and their
relative concentrations in the product stream.
The goals were maximized by a model-
predictive controller that was implemented at
every time step. In the model predictive control
strategy used in this report, two simulations
were run at each time step. Initially, one
simulation was run with a temperature 10 Kelvin
higher than the base simulation and one was run
with a temperature 10 Kelvin lower than the
base simulation. The conditions of the
simulation that better met the control goal were then implemented for the next time step
of the base simulation. To increase the precision of the model predictive controller, the
temperature change for the model predictive simulations was cut in half if the
temperature returned to its value at the beginning of the previous time step. The
temperature change was programmed to stay above 1 Kelvin and would reset to 10
Kelvin if the temperature changed monotonically. A schematic of the model predictive
controller is shown in Figure 9.

_______________________________________Curnan, Gopalratnam, Slominski, Wang
27
3 Control of Cyclohexene Hydrogenation and Dehydrogenation
3.1 Introduction to Catalyzed Hydrogenation and Dehydrogenation Reactions
The use of KMC model-based controllers in adequately scaled microreactors has
been considered for several chemical reactions networks, one of which contains the
competing hydrogenation and dehydrogenation reactions of cyclohexene (C6H10). In
organic chemistry, a hydrogenation reaction can be defined as the addition of hydrogen
(H2) to an organic compound – such as a hydrocarbon – in order to saturate one of its
double or triple bonds. Hydrogenation reactions typically occur on catalyst surfaces, thus
syn or same-side addition of hydrogen atoms generally occurs across the unsaturated
bond. Though mechanistically dissimilar to their complement, dehydrogenation reactions
involve the removal of H2 to unsaturate bonds and release hydrogen gas; in experimental
work, the concentration of the released gas in a sealed chamber is frequently used to
indicate rates of reaction and other kinetic information. The competing hydrogenation
and dehydrogation reactions in this network are, respectively (Nassar 2006):
C6H10 + H2 → C6H12 (1; represented by k1)
C6H10 → C6H6 + 2H2 (g) (2; represented by k2)
Table 1: Rate constant and Energy of Activation Data for Cyclohexene Reaction Network
Reaction Type k (L/min) Ea (J/mol)
Hydrogenation (1) 218. 21,700
Dehydrogenation (2) 0.160 1920.
The rate equations governing these competing processes are generally Arrhenius
in form; the hydrogenation reaction is second-order with respect to both cyclohexene and
hydrogen, while the dehydrogenation reaction is first-order with respect to cyclohexene.
They can be written as (Nasser 2006):
𝑟d = 𝑁C6H10𝑉𝑁𝑎𝑣𝑜
𝑘dexp −𝐸dR𝑇
𝑟h = 𝑁C6H10𝑉𝑁𝑎𝑣𝑜
𝑁H2
𝑉𝑁𝑎𝑣𝑜 𝑘hexp −
𝐸hR𝑇
where r is the reaction rate in moles/liter-second, Ni is the number of molecules of type i,
V is the volume in liters, Navo is Avogadro's Number, 6.022*1023
molecules/mole, kd is
_______________________________________Curnan, Gopalratnam, Slominski, Wang
28
the dehydrogenation reaction rate constant in 1/second, kh is the hydrogenation reaction
rate constant in liters/mole-second, E is the activation energy in joules, R is the gas
constant, 8.314 joules/mole-Kelvin, and T is the temperature in Kelvin.
3.2 Description of Reaction Networks, Mechanisms, and Initial Catalysts
In addition to producing cyclohexane (C6H12) and benzene (C6H6), this network
features several side reactions – such as the decomposition of benzene into graphitic or
atomic carbon (Henn 1992) under extreme conditions (high temperature, pressure, etc.)
and formation of 1,3 and 1,4-cyclohexadiene (Su 1999) – that can occur depending on
catalyst, substrate, and pressure conditions. They are explicitly written, respectively, as:
C6H6 → 6C(s) + 3H2(g) (3)
C6H10 → C6H8 + H2(g) (4)
However, these reactions are not pursued in the KMC modeling of this network
for several reasons. The formation of cyclohexadiene, which occurs only on some
catalyst surfaces over limited temperature ranges, is a mechanistic intermediate in the
catalytic surface chemistry of cyclohexene. Even though it affects the final concentration
of benzene in the outlet stream of the microreactor mainly as a function of temperature,
cyclohexadiene would either not be represented as a final product of the reaction network
or only be present as a trace element due to the kinetic unfavorability of its desorption
from the catalytic surface (Su 1999). Therefore, modeling this formation reaction would
only be important on the scale of molecular deposition and not for general, equation-
based reaction mechanisms. In the KMC control scheme implemented, noise in product
concentration levels represents the discreteness of the process occurring in each
microreactor that cannot be accounted for by continuum relationships. In attempting to
control this noise in product concentration levels with temperature and inert gas flow rate,
we are only concerned about factors that directly affect concentration control. Therefore,
reactions such as the formation of cyclohexadiene, which only directly affect surface
conditions such as roughness and film growth rate but not product selectivity or yields –
are not included. The decomposition reaction of benzene, though not excluded from
consideration, is avoided by keeping reactor temperature low (Xu 1994). In addition to
_______________________________________Curnan, Gopalratnam, Slominski, Wang
29
saving energy and thus reducing process design costs, the maintenance of a sufficiently
low reactor temperature – specific to each catalyst surface – is maintained in all KMC
simulations performed. However, none of these simulations account for the type of
catalyst used because they do not account for surface conditions; therefore, the operating
temperatures at which optimized reactions proceed in our simulations will either validate
or invalidate the use of specific catalysts.
In industrial applications, hydrogenation and dehydrogenation reactions require
control due to their exothermic nature and catalysts to increase their reactivity and yields.
Though homogenous catalysts are implemented in laboratory settings due to their ease of
use and simplicity, heterogeneous catalysts dominate industry due to their increased
reliability, performance over time, and general prevention of undesired surface reactions.
A critical first step to selecting a catalyst is to select an initial base (Ni, Cu, Co, etc.) or
precious (Pt, Pd, Rh, etc.) homogenous metal to which solid state additives can be applied.
In cases where temperature and pressure produce no physical or chemical disadvantages,
Ni is generally the selected hydrogenating catalyst due to its proven reliability and cost
efficiency relative to almost all other catalysts. However, for reactions occurring on a
smaller scale that are sensitive to temperature – such as the hydrogenation of cyclohexene
in a microreactor – more precious metals such as Pt are preferred for their greater
selectivity at smaller loadings (0.5-1.0%) and less extreme required operating conditions
(Rase 2000). To solidify this assumption, Rase recommends the precious metals Pd and
Pt, along with the base metal Ni, as initial catalysts in olefin to alkane reactions or vice
versa (Rase 2000). The particular selection of catalyst, in addition to specific questions
regarding reaction mechanisms and kinetics, will be expounded upon later.
_______________________________________Curnan, Gopalratnam, Slominski, Wang
30
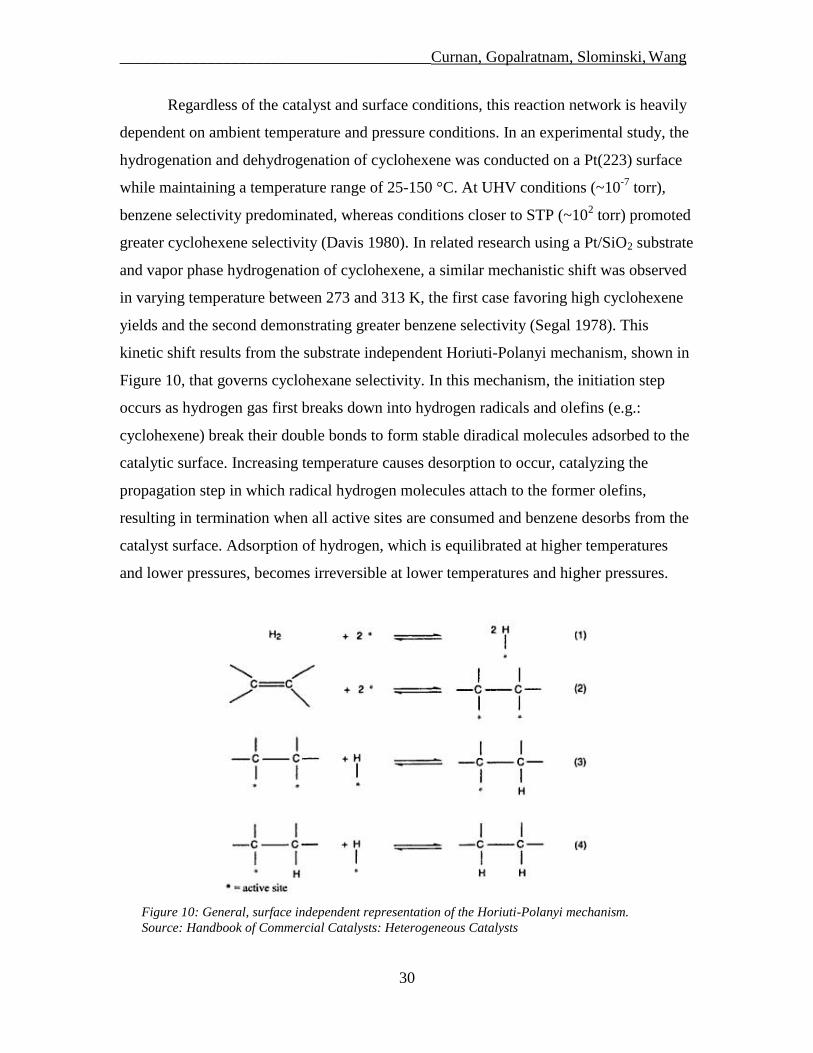
Figure 10: General, surface independent representation of the Horiuti-Polanyi mechanism.
Source: Handbook of Commercial Catalysts: Heterogeneous Catalysts
Regardless of the catalyst and surface conditions, this reaction network is heavily
dependent on ambient temperature and pressure conditions. In an experimental study, the
hydrogenation and dehydrogenation of cyclohexene was conducted on a Pt(223) surface
while maintaining a temperature range of 25-150 °C. At UHV conditions (~10-7
torr),
benzene selectivity predominated, whereas conditions closer to STP (~102 torr) promoted
greater cyclohexene selectivity (Davis 1980). In related research using a Pt/SiO2 substrate
and vapor phase hydrogenation of cyclohexene, a similar mechanistic shift was observed
in varying temperature between 273 and 313 K, the first case favoring high cyclohexene
yields and the second demonstrating greater benzene selectivity (Segal 1978). This
kinetic shift results from the substrate independent Horiuti-Polanyi mechanism, shown in
Figure 10, that governs cyclohexane selectivity. In this mechanism, the initiation step
occurs as hydrogen gas first breaks down into hydrogen radicals and olefins (e.g.:
cyclohexene) break their double bonds to form stable diradical molecules adsorbed to the
catalytic surface. Increasing temperature causes desorption to occur, catalyzing the
propagation step in which radical hydrogen molecules attach to the former olefins,
resulting in termination when all active sites are consumed and benzene desorbs from the
catalyst surface. Adsorption of hydrogen, which is equilibrated at higher temperatures
and lower pressures, becomes irreversible at lower temperatures and higher pressures.

_______________________________________Curnan, Gopalratnam, Slominski, Wang
31
Figure 11: “Standing-up” conformation of the
intermediate (multiple stable C6H9 resonance
structures) that forms on Pt(111) surfaces,
among other structures.
Source: (Su 1999)
Given this information and the mechanism below, the aforementioned kinetic shift results
from the inability of radical hydrogen to reversibly bond with a cyclohexene intermediate
formed on their mutually adsorbed surface, forcing it to desorb as cyclohexane at low
temperatures or under insufficiently energetic conditions (Segal 1978).
For the lower temperature, higher pressure conditions that favor cyclohexene
formation specified previously, structural insensitivity – or independence of surface
chemistry on the concentrations of reaction – is found to be a very reasonable modeling
assumption. On the other hand, structural sensitivity is noticeable under UHV conditions
and at temperatures conducive to carbon coking (i.e.: graphitic atomic carbon formation)
or optimal levels of benzene formation (Segal 1980), thus surface chemistry should be
considered under these conditions. In order to understand the mechanism of cyclohexene
hydrogenation in a surface specific fashion, a basic homogenous catalyst – Pt(111) – will
be provided as an example due to its extensive use in hydrogenation reactions performed
in laboratories and its role as a basis of comparison for other heterogenous catalysts. A
prerequisite for cyclohexene conversion into another species in fluidic microchannels is
adsorption onto their catalytic surface, which typically occurs at 95-100 K in the form of
two singular σ-bonds between the now radical cyclohexene and the surface. When heated
to 180-220 K, a C6H9 intermediate is formed on the surface, in which one radical bond of
the aforementioned cyclohexene olefin
intermediate bonds with a radical hydrogen
atom while the other remains adsorbed to the
surface. Currently, a “standing-up”
conformation, as pictured in Figure 11, is
hypothesized to accurately model the geometry
of this intermediate on Pt(111), but more
extensive research is being conducted on
specific conformations of other financially
viable homogenous and heterogeneous
catalysts (Xu 1994).

_______________________________________Curnan, Gopalratnam, Slominski, Wang
32
Figure 12: Visual Representation of the
cis and trans conformations of the C6H9
surface intermediate. Dehydrogenation
is hypothesized to occur only in the trans
case, while the intermediate adsorbs and
stabilizes in the cis (i.e. syn addition)
case to avoid steric interference.
Source: (Xu 1994)
At this point, cyclohexene develops several resonance structures, which occur in
higher yields as temperature is increased beyond
220 K. These ultimately lead to the formation of
benzene at approximately 300 K, though the
specific reaction mechanism that enables this
formation is still being studied (Xu 1994).
Currently, it is hypothesized that the
cyclohexene intermediate alternates between cis
(“sitting-down”) and trans (“standing-up”)
states on the surface of the catalyst, as shown in
Figure 12. Intuitively, the cis conformation
would be assumed more energetically favorable
due to the lower steric interference caused by
rendering an entire C6H9 complex parallel rather
than perpendicular to the surface of the catalyst.
Though this is true when the complex is being
stabilized to the surface, the trans conformation becomes more stable when double bonds
are being formed. This occurs because the hydrogen atoms, which would become
radicalized once again upon desaturation of the complex, are close enough to the surface
in the trans case to be readsorbed. The predominant resonance structures, which – at any
given time – occur over the two unsaturated bonds closest to the surface, change as a
double bond is added to the intermediate in its trans phase. The molecule, which rotated
to change from cis to trans conformations in producing a single double bond, rotates once
again in that same direction to produce a second cis state with resonance structures
occurring over another two adjacent single bonds. This process, upon creating two more
double bonds in an alternating pattern over four more single bonds, leads to desorption of
the former intermediate (which is now the final product benzene) and reformation of the
hydrogen radicals, which desorb from the surface as hydrogen gas. This entire process
constitutes the dehydrogenation of cyclohexene on a catalyst surface (Henn 1992).
The dehydrogenation process peaks at 350-400 K on Pt(111), at which the
number of active sites on the catalyst is saturated at approximately 30% of its surface

_______________________________________Curnan, Gopalratnam, Slominski, Wang
33
area. Above 450-500 K, side reactions such as carbon coking induced by benzene
decomposition have significant selectivity, rendering both main reaction rates lower and
producing reaction conditions undesirable for industrial applications (Xu 1994). A
summary of this primary reaction network, accounting for different cyclohexadiene forms
of the surface intermediate (i.e.: double bonds located in different places on the cyclic
complex) and favorable reaction conditions, is presented in Figure 13.
3.3 Heterogenous Catalyst Analysis and Selection
As mentioned before, long-term exposure of a homogenous catalyst – such as
Pt(111) – to adsorbed hydrocarbons eventually leads to the carbon coking on its surface,
also known as carbon poisoning of its uppermost monolayer. To extend the lifetime of
the catalytic metal and thus improve its application in industry, a second metal – such as
Re, Ir, or Sn – or other additive is combined with it via a reformation reaction. The alloys
formed in this fashion generally demonstrate greater aromatic selectivity, in addition to
their primary purpose of avoided hydrocarbon side product formation. Prior to selecting
candidates for heterogeneous catalysis in this reaction network, note that only alloys with
Pt will be considered due to the inadequacy of the other initial catalysts – Pd and Ni –
proposed by Rase (Rase 2000). The reaction mechanism for Pd(111) proceeds identically
to that of Pt(111) up until 220 K, in which an intermediate is not appreciably formed on
the catalyst surface and desorption of the hydrogenation product cyclohexane is almost
Figure 13 summaries the primary reaction network and the relevant intermediates.
_______________________________________Curnan, Gopalratnam, Slominski, Wang
34
immediate at all temperatures below 400 K, after which decomposition of cyclohexene
and cyclohexane induces carbon coking on the catalyst surface in significant quantities
(Hunka 1999). Despite being used in ketone surface adsorption reactions, practical base
metal catalysts such as Raney Nickel require higher operating temperatures and pressures
than would be cost effective in the microchannels designed for μ-TAS control schemes
(Chang 2000). Several heterogeneous Pt-alloyed catalysts have been considered and
analyzed extensively in cyclohexene reaction networks, the additives of which typically
change properties such as optimal dehydrogenation and hydrogenation temperatures and
pressures by minimal amounts. They include:
Sn / Pt(111) [Xu 1994]
C / Mo(110) [Xu 1994]
xSiO2 – (1 - x)Al2O3 / Pt(111) [Hassan 1995]
Of the three cases studied above, Sn / Pt(111) surface alloys have been studied the
most extensively and have substantial benefits, such as not allowing the decomposition of
benzene under UHV conditions. In addition, fewer layers of chemisorbed benzene on the
alloy surface are needed to induce significant desorption rates from it, thereby improving
the selectivity of benzene and reducing the time required to achieve high benzene yields.
However, the optimal temperature for benzene selectivity under UHV conditions is
increased to 400-450 K and decomposition occurs closer to 500 K, thus slight increases
in process design costs result. Lastly, the presence of Sn in the catalyst has no effect on
the adsorption kinetics of the reaction, implying that the kinetic models applied to the
Pt(111) or surface insensitive reactions mentioned previously are still valid here (Xu
1994). Unlike the other two alloys or reformed metallic compounds, note that xSiO2 – (1
- x)Al2O3 / Pt(111) is in fact a carrier surface for Cobalt phthalocaynine (CoPc), which
selectively enters silica pores on inclined edges and lies flat over alumina pores. This
creates a variegated surface texture that hinders carbon coking differently depending on
the concentrations of silica and alumina present on the surface (Hassan 1995).
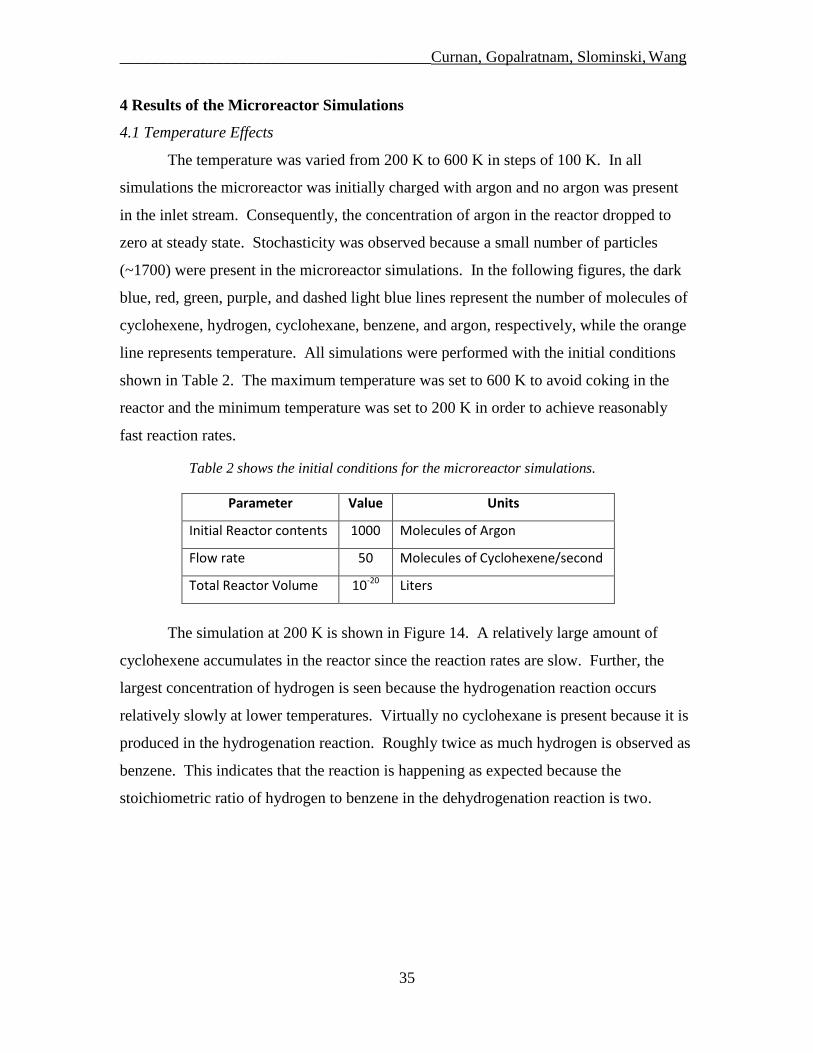
_______________________________________Curnan, Gopalratnam, Slominski, Wang
35
Table 2 shows the initial conditions for the microreactor simulations.
Parameter Value Units
Initial Reactor contents 1000 Molecules of Argon
Flow rate 50 Molecules of Cyclohexene/second
Total Reactor Volume 10-20 Liters
4 Results of the Microreactor Simulations
4.1 Temperature Effects
The temperature was varied from 200 K to 600 K in steps of 100 K. In all
simulations the microreactor was initially charged with argon and no argon was present
in the inlet stream. Consequently, the concentration of argon in the reactor dropped to
zero at steady state. Stochasticity was observed because a small number of particles
(~1700) were present in the microreactor simulations. In the following figures, the dark
blue, red, green, purple, and dashed light blue lines represent the number of molecules of
cyclohexene, hydrogen, cyclohexane, benzene, and argon, respectively, while the orange
line represents temperature. All simulations were performed with the initial conditions
shown in Table 2. The maximum temperature was set to 600 K to avoid coking in the
reactor and the minimum temperature was set to 200 K in order to achieve reasonably
fast reaction rates.
The simulation at 200 K is shown in Figure 14. A relatively large amount of
cyclohexene accumulates in the reactor since the reaction rates are slow. Further, the
largest concentration of hydrogen is seen because the hydrogenation reaction occurs
relatively slowly at lower temperatures. Virtually no cyclohexane is present because it is
produced in the hydrogenation reaction. Roughly twice as much hydrogen is observed as
benzene. This indicates that the reaction is happening as expected because the
stoichiometric ratio of hydrogen to benzene in the dehydrogenation reaction is two.
[Type a quote from the
document or the summary of an
interesting point. You can
position the text box anywhere
in the document. Use the Text
Box Tools tab to change the
formatting of the pull quote text
box.]
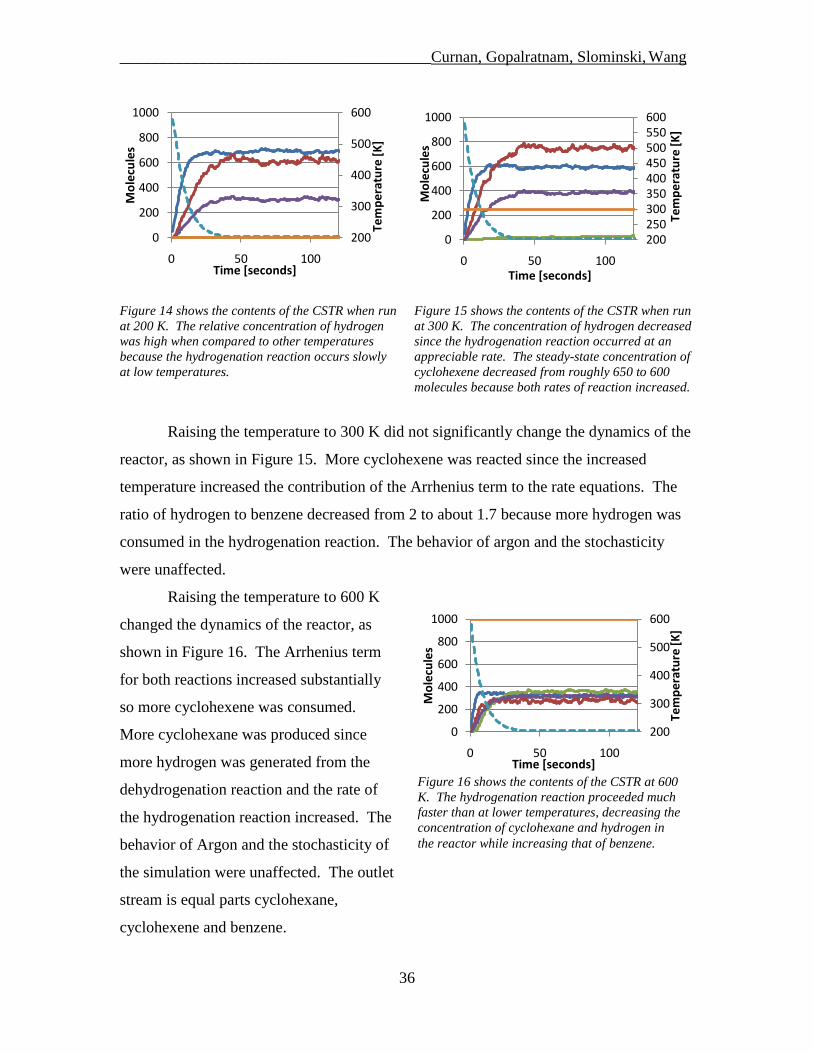
_______________________________________Curnan, Gopalratnam, Slominski, Wang
36
Figure 16 shows the contents of the CSTR at 600
K. The hydrogenation reaction proceeded much
faster than at lower temperatures, decreasing the
concentration of cyclohexane and hydrogen in
the reactor while increasing that of benzene.
200
300
400
500
600
0
200
400
600
800
1000
0 50 100
Tem
pe
ratu
re [
K]
Mo
lecu
les
Time [seconds]
Figure 14 shows the contents of the CSTR when run
at 200 K. The relative concentration of hydrogen
was high when compared to other temperatures
because the hydrogenation reaction occurs slowly
at low temperatures.
Figure 15 shows the contents of the CSTR when run
at 300 K. The concentration of hydrogen decreased
since the hydrogenation reaction occurred at an
appreciable rate. The steady-state concentration of
cyclohexene decreased from roughly 650 to 600
molecules because both rates of reaction increased.
Raising the temperature to 300 K did not significantly change the dynamics of the
reactor, as shown in Figure 15. More cyclohexene was reacted since the increased
temperature increased the contribution of the Arrhenius term to the rate equations. The
ratio of hydrogen to benzene decreased from 2 to about 1.7 because more hydrogen was
consumed in the hydrogenation reaction. The behavior of argon and the stochasticity
were unaffected.
Raising the temperature to 600 K
changed the dynamics of the reactor, as
shown in Figure 16. The Arrhenius term
for both reactions increased substantially
so more cyclohexene was consumed.
More cyclohexane was produced since
more hydrogen was generated from the
dehydrogenation reaction and the rate of
the hydrogenation reaction increased. The
behavior of Argon and the stochasticity of
the simulation were unaffected. The outlet
stream is equal parts cyclohexane,
cyclohexene and benzene.
200
300
400
500
600
0
200
400
600
800
1000
0 50 100
Tem
pe
ratu
re [
K]
Mo
lecu
les
Time [seconds]
200250300350400450500550600
0
200
400
600
800
1000
0 50 100
Tem
pe
ratu
re [
K]
Mo
lecu
les
Time [seconds]
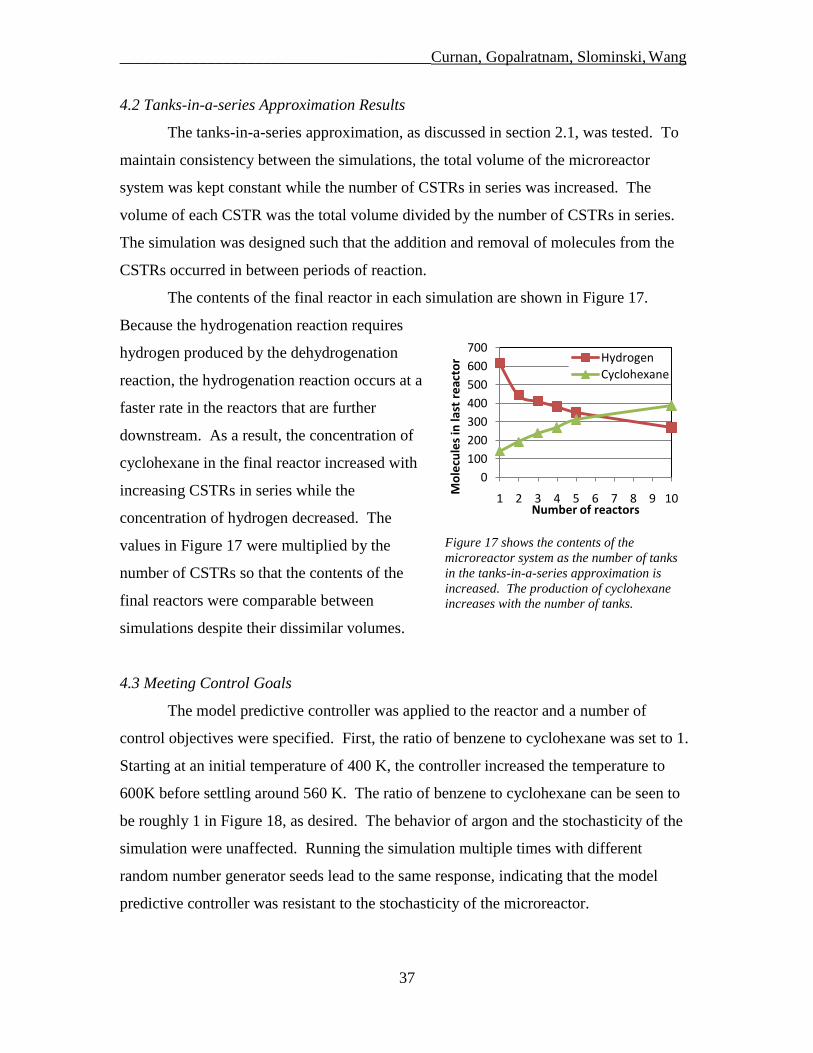
_______________________________________Curnan, Gopalratnam, Slominski, Wang
37
Figure 17 shows the contents of the
microreactor system as the number of tanks
in the tanks-in-a-series approximation is
increased. The production of cyclohexane
increases with the number of tanks.
d
0
100
200
300
400
500
600
700
1 2 3 4 5 6 7 8 9 10
Mo
lecu
les
in la
st r
eac
tor
Number of reactors
Hydrogen
Cyclohexane
4.2 Tanks-in-a-series Approximation Results
The tanks-in-a-series approximation, as discussed in section 2.1, was tested. To
maintain consistency between the simulations, the total volume of the microreactor
system was kept constant while the number of CSTRs in series was increased. The
volume of each CSTR was the total volume divided by the number of CSTRs in series.
The simulation was designed such that the addition and removal of molecules from the
CSTRs occurred in between periods of reaction.
The contents of the final reactor in each simulation are shown in Figure 17.
Because the hydrogenation reaction requires
hydrogen produced by the dehydrogenation
reaction, the hydrogenation reaction occurs at a
faster rate in the reactors that are further
downstream. As a result, the concentration of
cyclohexane in the final reactor increased with
increasing CSTRs in series while the
concentration of hydrogen decreased. The
values in Figure 17 were multiplied by the
number of CSTRs so that the contents of the
final reactors were comparable between
simulations despite their dissimilar volumes.
4.3 Meeting Control Goals
The model predictive controller was applied to the reactor and a number of
control objectives were specified. First, the ratio of benzene to cyclohexane was set to 1.
Starting at an initial temperature of 400 K, the controller increased the temperature to
600K before settling around 560 K. The ratio of benzene to cyclohexane can be seen to
be roughly 1 in Figure 18, as desired. The behavior of argon and the stochasticity of the
simulation were unaffected. Running the simulation multiple times with different
random number generator seeds lead to the same response, indicating that the model
predictive controller was resistant to the stochasticity of the microreactor.

_______________________________________Curnan, Gopalratnam, Slominski, Wang
38
Figure 21 shows the behavior of the reactor
when the outlet flow rate of cyclohexane is
minimized. The temperature quickly drops off
to the minimum temperature of 200 K.
200
300
400
500
600
0
200
400
600
800
1000
0 50 100
Tem
pe
ratu
re [
K]
Mo
lecu
les
Time [seconds]
Figure 19 shows controlled response of the CSTR
when the model predictive controller is set to
maximize the effluent flow rate of benzene.
200
300
400
500
600
0
200
400
600
800
1000
0 50 100
Tem
pe
ratu
re [
K]
Mo
lecu
les
Time [seconds]
Figure 20 shows the contents of the CSTR when the
concentration of cyclohexane is maximized. The
temperature quickly rises to the maximum -- 600 K.
200
300
400
500
600
0
200
400
600
800
1000
0 50 100
Tem
pe
ratu
re [
K]
Mo
lecu
les
Time [seconds]
Figure 18 shows the controlled response of the
CSTR when the ratio of benzene to cyclohexane in
the effluent stream is set to 1.
200
300
400
500
600
0
200
400
600
800
1000
0 50 100
Tem
pe
ratu
re [
K]
Mo
lecu
les
Time [seconds]
Next, the model predictive controller was set to maximize the amount of benzene
in the effluent stream. The steady-state value for this control objective was found to be
the maximum temperature of 600 K when starting from an initial temperature of 400 K.
This is nearly the same temperature as that found for the previous control objective,
indicating that the operating temperature where benzene is set to cyclohexane is also
where the maximum flow rate of benzene is achieved. The transient and steady-state
contents of the CSTR are shown in Figure 19. These results imply that separation of the
products would be necessary if the production of benzene is maximized. Running the
simulation multiple times with different random number seeds leads to the same response.
The model predictive controller was then set to maximize the amount of
cyclohexane produced. The control behavior was nearly identical to that for the previous
two control objectives. The results are shown in Figure 20. The model predictive
controller was again found to be resistant to the stochasticity of the microreactor.
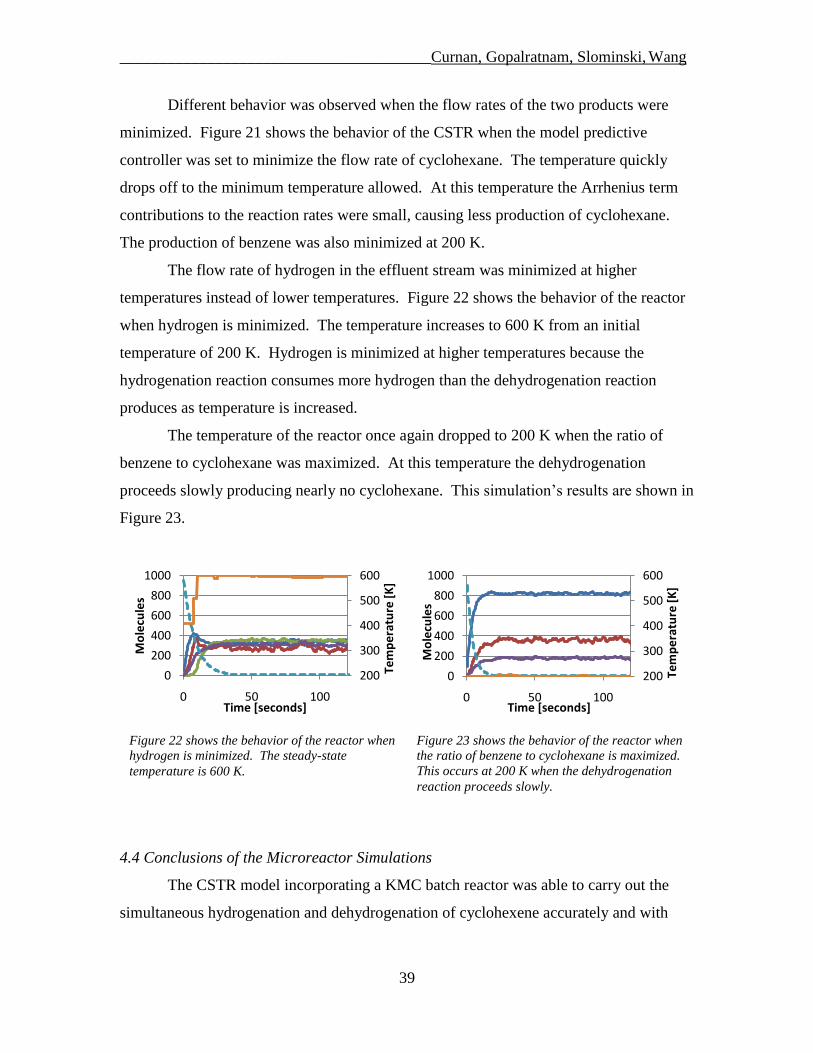
_______________________________________Curnan, Gopalratnam, Slominski, Wang
39
Figure 23 shows the behavior of the reactor when
the ratio of benzene to cyclohexane is maximized.
This occurs at 200 K when the dehydrogenation
reaction proceeds slowly.
200
300
400
500
600
0
200
400
600
800
1000
0 50 100
Tem
pe
ratu
re [
K]
Mo
lecu
les
Time [seconds]
Figure 22 shows the behavior of the reactor when
hydrogen is minimized. The steady-state
temperature is 600 K.
200
300
400
500
600
0
200
400
600
800
1000
0 50 100
Tem
pe
ratu
re [
K]
Mo
lecu
les
Time [seconds]
Different behavior was observed when the flow rates of the two products were
minimized. Figure 21 shows the behavior of the CSTR when the model predictive
controller was set to minimize the flow rate of cyclohexane. The temperature quickly
drops off to the minimum temperature allowed. At this temperature the Arrhenius term
contributions to the reaction rates were small, causing less production of cyclohexane.
The production of benzene was also minimized at 200 K.
The flow rate of hydrogen in the effluent stream was minimized at higher
temperatures instead of lower temperatures. Figure 22 shows the behavior of the reactor
when hydrogen is minimized. The temperature increases to 600 K from an initial
temperature of 200 K. Hydrogen is minimized at higher temperatures because the
hydrogenation reaction consumes more hydrogen than the dehydrogenation reaction
produces as temperature is increased.
The temperature of the reactor once again dropped to 200 K when the ratio of
benzene to cyclohexane was maximized. At this temperature the dehydrogenation
proceeds slowly producing nearly no cyclohexane. This simulation‟s results are shown in
Figure 23.
4.4 Conclusions of the Microreactor Simulations
The CSTR model incorporating a KMC batch reactor was able to carry out the
simultaneous hydrogenation and dehydrogenation of cyclohexene accurately and with
_______________________________________Curnan, Gopalratnam, Slominski, Wang
40
reasonable stochasticity for the given reactor volumes. Future studies of the behavior of
stochastic microreactors should look to use a similar model in their investigations.
The model predictive controller was able to meet its control objective while also
being resistant to the inherent stochasticity of small scale microreactors. For this
particular reaction network, the ratio of benzene to cyclohexane in the effluent
approached unity and the production of cyclohexane and benzene were maximized at the
maximum temperature of 600 K. Running the reactor above 600 K was undesirable
because of the potential for clogging due to coking. At 200 K the hydrogenation
proceeded extremely slowly producing very little benzene. Model predictive control
incorporating additional manipulated variables, such as the flow rate of an inert species,
could achieve greater specificity of the products and better control of the effluent stream.
_______________________________________Curnan, Gopalratnam, Slominski, Wang
41
5 Financial Analysis
5.1 Microreactor Market
Microreactors are not established units in industrial processes but have found
some limited applications. For instance, China's Xi'an Huian Chemical is using
microreactors to produce nitroglycerin at a rate of about 10 kilograms per hour, or about
97 short tons annually. Chemical companies Clariant, SAFC, BASF, Evonik Industries,
DSM, and DuPont, pharmaceutical companies Schering-Plough, Sanofi Aventis, Roche,
GlaxoSmithKline, Novartis, and Astra Zeneca, and consumer products company Procter
& Gamble have experimented or are currently experimenting with microreactor
technologies. However, there is little information on the application, scale, scope, or size
of the experimental microreactors (Boswell), and successful applications do not seem to
be easily generalized. In 2004, Sigma-Aldrich was reported to have purchased the Cytos
Lab System, a microreactor system produced by Cellular Process Chemistry Systems that
sells for $70,000 to $200,000 depending on the size, for about $187,000 (Microreactors
eyed for industrial use 2004). The Cytos Lab System is reported to be capable of
operating from milligram to low tonnage production annually.
Because microreactors are not expected to become widely used in industry for at
least another ten years, it is difficult to assess the overall size of the microreactor market
at this time. It is estimated that 30% of fine chemicals and drugs currently in production
could be produced more efficiently using microreactors. Once the challenges facing
microreactor implementation have been addressed, one-fifth of chemical producers are
expected to use microreactors in their processes. Currently, research and development
departments and highly specialized orders define the microreactor market (Boswell).
The proposed software product, a model predictive controller for stochastic
processes for use with microreactors, seeks to overcome challenges with controlling and
optimizing microreactors. Since microreactors are still in their early development, there
are currently very few customers in need of such a controller. However, online control
for microreactors is necessary for the practical implementation of microreactor systems in
industry. Therefore, controllers such as the proposed product have great potential
because they will have an immediate market as soon as microreactor technologies gain
widespread acceptance in industry.

_______________________________________Curnan, Gopalratnam, Slominski, Wang
42
Table 4 summarizes the equipment costs for a microreactor start-up in Philadelphia, PA
Equipment Description
Purchase
Cost
Bare Module
Factor Bare Module Cost
Microreactor System $187,000 3.05 $570,350
Computer $2,000 1.40 $2,800
Fume Hood $2,000 2.10 $4,200
Vacuum System $15,000 3.30 $49,500
Storage Tanks $28,000 4.16 $116,480
Gas Chromatograph $3,200 2.72 $8,714
Pt (per g powder, 99.99% pure) $1,024 1.27 $1,299
Table 3 gives the prices of the chemical species used in the control simulations.
Species Price Quantity Description
Cyclohexene $50 1L 125431-1L on Sigma-Aldrich
Benzene $60 1L 401765-1L on Sigma-Aldrich
Hydrogen $165 56L 295396-56L on Sigma-Aldrich
Cyclohexane $65 1L 227048-1L on Sigma-Aldrich
5.2 Profitability Analysis
To determine the profitability and price of a model predictive controller for a
µTAS, the viability of selling such a controller to a start-up company producing
cyclohexane from the hydrogenation of cyclohexene was explored. Prices of the
chemicals involved in the cyclohexene reaction network are given in Table 3.
The bare module costs of the equipment for a hypothetical microreactor start-up
company are summarized in Table 4. The price of the Cytos Lab System was used as a
general estimate for a microreactor system. The price of a properly outfitted computer
was estimated from Dell. The prices of the fume hood, vacuum system, gas
chromatograph and catalysts were taken from online vendors. The price of the storage
tanks, which were designed to hold up to a month's worth of reactants and products, and
the bare model factors were estimated using the metrics in Product and Process Design
Principles: Synthesis, Analysis and Evaluation (Seider 2010).
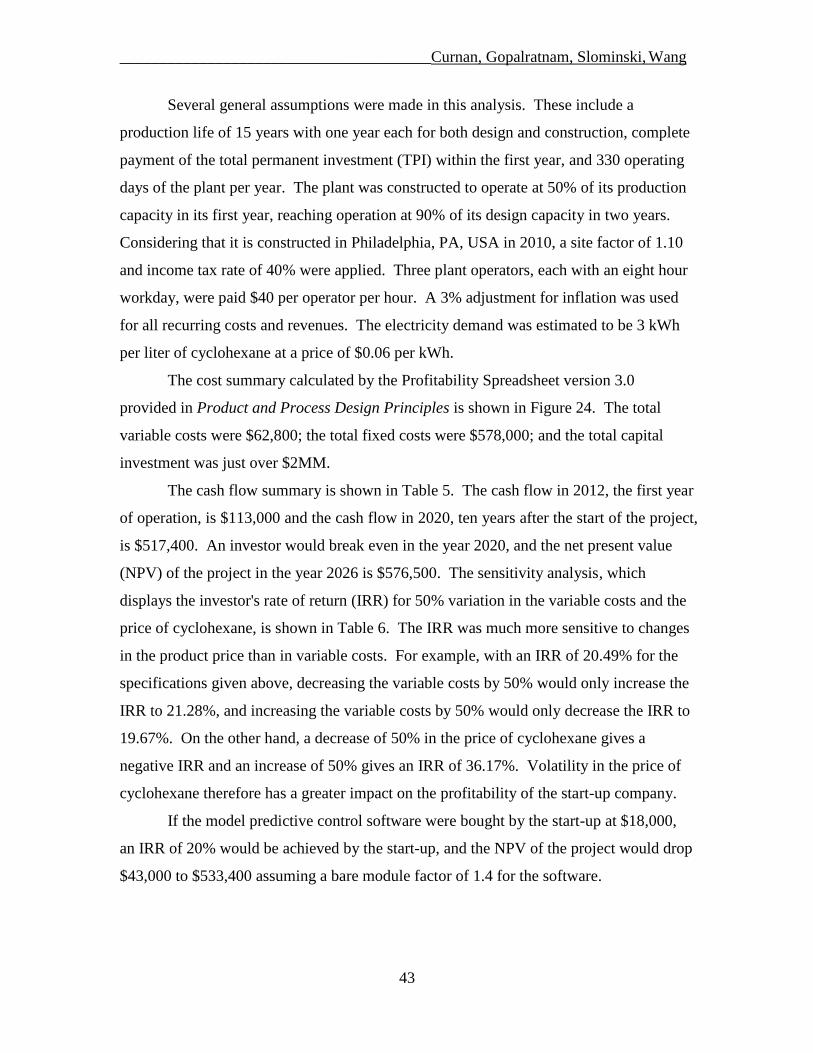
_______________________________________Curnan, Gopalratnam, Slominski, Wang
43
Several general assumptions were made in this analysis. These include a
production life of 15 years with one year each for both design and construction, complete
payment of the total permanent investment (TPI) within the first year, and 330 operating
days of the plant per year. The plant was constructed to operate at 50% of its production
capacity in its first year, reaching operation at 90% of its design capacity in two years.
Considering that it is constructed in Philadelphia, PA, USA in 2010, a site factor of 1.10
and income tax rate of 40% were applied. Three plant operators, each with an eight hour
workday, were paid $40 per operator per hour. A 3% adjustment for inflation was used
for all recurring costs and revenues. The electricity demand was estimated to be 3 kWh
per liter of cyclohexane at a price of $0.06 per kWh.
The cost summary calculated by the Profitability Spreadsheet version 3.0
provided in Product and Process Design Principles is shown in Figure 24. The total
variable costs were $62,800; the total fixed costs were $578,000; and the total capital
investment was just over $2MM.
The cash flow summary is shown in Table 5. The cash flow in 2012, the first year
of operation, is $113,000 and the cash flow in 2020, ten years after the start of the project,
is $517,400. An investor would break even in the year 2020, and the net present value
(NPV) of the project in the year 2026 is $576,500. The sensitivity analysis, which
displays the investor's rate of return (IRR) for 50% variation in the variable costs and the
price of cyclohexane, is shown in Table 6. The IRR was much more sensitive to changes
in the product price than in variable costs. For example, with an IRR of 20.49% for the
specifications given above, decreasing the variable costs by 50% would only increase the
IRR to 21.28%, and increasing the variable costs by 50% would only decrease the IRR to
19.67%. On the other hand, a decrease of 50% in the price of cyclohexane gives a
negative IRR and an increase of 50% gives an IRR of 36.17%. Volatility in the price of
cyclohexane therefore has a greater impact on the profitability of the start-up company.
If the model predictive control software were bought by the start-up at $18,000,
an IRR of 20% would be achieved by the start-up, and the NPV of the project would drop
$43,000 to $533,400 assuming a bare module factor of 1.4 for the software.

_______________________________________Curnan, Gopalratnam, Slominski, Wang
44
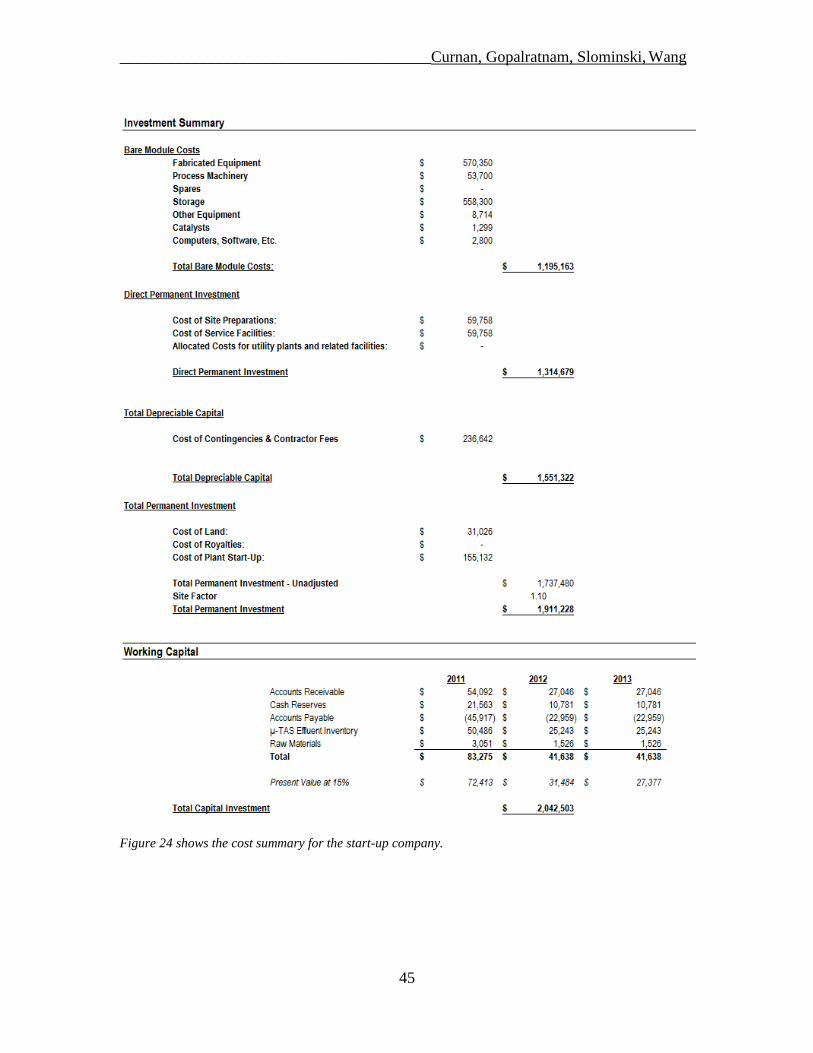
_______________________________________Curnan, Gopalratnam, Slominski, Wang
45
Figure 24 shows the cost summary for the start-up company.
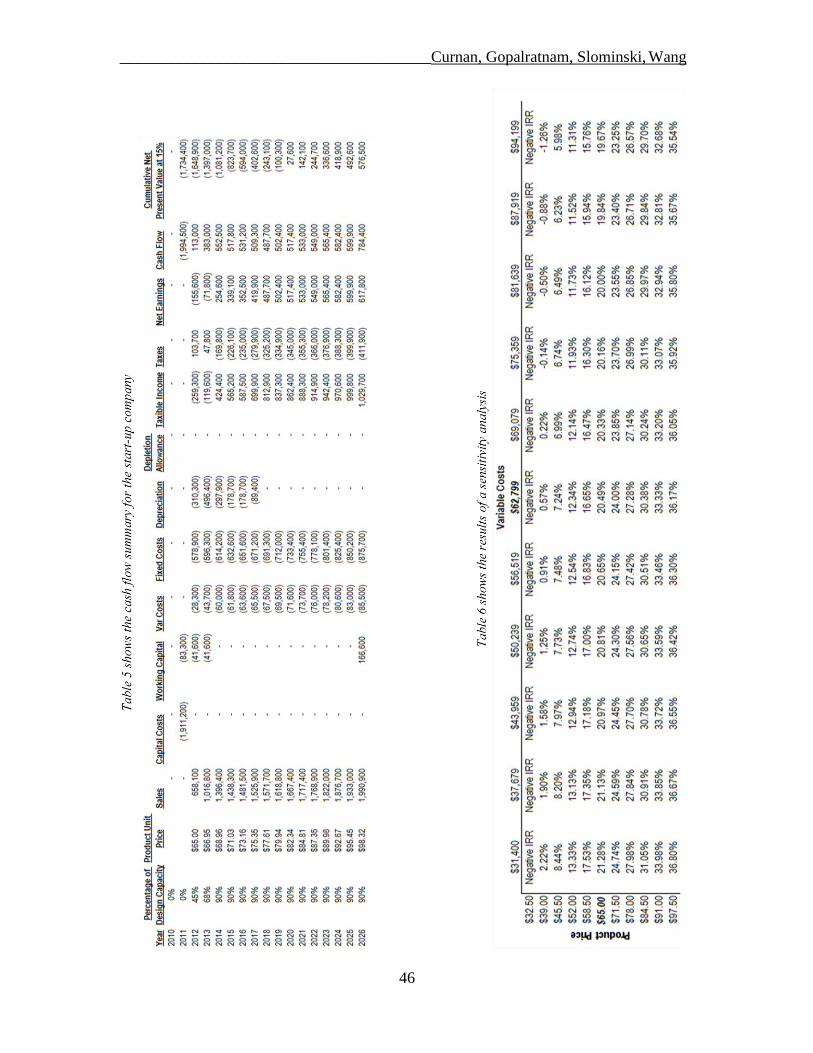
_______________________________________Curnan, Gopalratnam, Slominski, Wang
46
With 20% IRR, Model Predictive Control can cost up to $18,000 with bare module cost
of 1.40 and an ROI of 16%. 22,500 L / year cyclohexane product flow rate, 5 year
depreciation schedule, 28 days inventory due to tanks.

_______________________________________Curnan, Gopalratnam, Slominski, Wang
47
6. Conclusions
In this report, the production methods and economics of a μTAS integrating
model-based control in its microreactors were studied for a reaction network consisting of
the hydrogenation and dehydrogenation of cyclohexene. Given the current technology
readily available for industrial applications, one of the most cost effective manufacturing
process for microreactors would implement anisotropic wet chemical etching for channel
fabrication, diffusion bonding followed by microlamination for creating microarrays, and
modified anodic oxidation for coating the channels with Sn / Pt(111) alloy catalyst.
The model predictive controller successfully achieved its goals and was found to
be highly resistant to the inherent stochasticity of the small-scale processes like those run
in microreactors. At volumes of approximately 10-20
L, the number of particles was small
enough to warrant stochastic control. The controller adjusted the reactor temperature to
obtain various effluent stream compositions and regularly reached steady state within 20-
30 seconds. The tanks-in-a-series approximation was used to emulate a PFR. Greater
production of cyclohexane was observed with increasing number of CSTRs in series. In
future studies, the effects of varying the temperature in each of the CSTRs in series
should be investigated. Higher quality and/or more valuable effluent streams may be
possible with such a control scheme. Further, varying an inert flow rate would also
improve control of the effluent stream but may not be profitable.
The market for microreactors is still developing. In ten years, it is projected that
20% of chemical companies will make use of microreactors. Having a robust controller
will be necessary for the optimal operation of microreactors on an industrial scale.
Through a profitability analysis for a start-up microreactor company based in
Philadelphia, PA, USA, a price of $18,000 per license was calculated for the software-
based controller in order to achieve a 20% IRR and a break-even point in 2020.
Depending on the development of the microreactor industry and the emergence of
competitors, this price may need to be reevaluated.
This study is only a preliminary attempt at assessing the functionality and
profitability of a software-based controller for stochastic processes. Given the anticipated
expansion of microreactor technologies, the proposed product has strong potential to be
profitable in the coming years.

_______________________________________Curnan, Gopalratnam, Slominski, Wang
48
7 Acknowledgements
The authors would like to express their gratitude for the invaluable advice
provided by Professor Leonard A. Fabiano, Dr. Warren Seider, and Dr. Talid R.
Sinno. Professor Fabiano provided the group with general guidance regarding the writing
and timeline of the report. Dr. Seider provided assistance in implementing effective
control strategies and taught the fundamental skills required to complete a successful
product design project through our design course last fall. Dr. Sinno explained the details
of the kinetic Monte Carlo method and shaped the strategy that was used to tackle the
control and display issues. Additionally, the design consultants provided useful
suggestions and advice from an industrial perspective.

_______________________________________Curnan, Gopalratnam, Slominski, Wang
49
8 Bibliography
ACS Publications. C&EN: Microreactors eyed for industrial use. Web. 10 Apr. 2010.
<http://pubs.acs.org/cen/news/8226/8226earlysci2.html>.
ACS Publications. C&EN: Microreactors for the chemical masses. Web. 10 Apr. 2010.
<http://pubs.acs.org/cen/news/8248/8248earlybus.html>.
Boswell, C. Microreactors Gain Popularity Among Producers. ICIS Chemical Business.
[Online] Apr 30, 2009.
http://www.icis.com/Articles/2009/05/04/9211877/microreactors-gain-popularity-
among-producers.html (accessed Apr 15-16, 2010).
Chen, D., Moljord, K., Fuglerud, T., and Holmen, A., Microporous and Mesoporous
Materials 29 (1999), p. 191-203
Davis, S.M. and Somoriai, G.A. J. Catal. 65 (1980), p. 78.
Ehrfeld, W. , Hessel, V., and Lowe, L. Microreactors: New Technology for Modern
Chemistry, Wiley–VCH, Weinheim, Germany (2000) p. 2-29.
Henn, F.C., Diaz, A.L., Bussell, M.E., Hugenschmidt, M.B., Domagala, M.E., and
Campbell, C.T. J. Phys. Chem. 96 (1992), p. 5965.
Hessel, V., Löwe, H., Müller, A., and Kolb, G., Chemical Micro Process Engineering:
Processing and Plants, Wiley–VCH, Weinheim, Germany (2006) p. 324, 385-400
Incropera, F. P., DeWitt, D. P., Bergman, T. L., and Lavine, A. S., Fundamentals of Heat
and Mass Transfer, John Wiley & Sons Inc., New York, NY (2007) pp. 524-7.
LabX. Fume Hoods. http://www.labx.com/v2/newad.cfm?catid=9 (accessed Apr 20,
2010).
Li, Y.-(guang), Chang, X., and Zeng, Z., Ind. Eng. Chem. Res. 31 (1992) p. 187-92
Nassar, R., Hu, J., Palmer, J., and Dai, W., Catal. Today 120 (2007) p. 121-4
Ouyang, X. and Besser, R.S. Catal. Today 84 (2003), p. 33.
Pacheco, M., Sira, J., and Kopasz, J., Applied Catal. A, 250 (2003) p. 161-75
Rase, H. F., Handbook of Commercial Catalysts : Hetergeneous Catalysts, CRC Press,
Washington, D.C. (2000) p. 105-15
Rawlings, J. B. and Ekerdt, J. G., Chemical Analysis and Design Fundamentals, Nob Hill
Publishing, Madison, WI (2002) pp. 220-3
_______________________________________Curnan, Gopalratnam, Slominski, Wang
50
Sci-bay. Gow-Mac Series 580 Gas Chromatograph. http://www.sci-
bay.com/catalog.asp?prodid=356857&showprevnext=1 (accessed Apr 23, 2010).
Segal, E., Madon, R.J., and Boudart, M.J. J. Catal. 52 (1978), p. 45.
Seider, W. D., Seader, J.D., Lewin, D.R., Widagdo, S. Product and Process Deisgn
Principles: Synthesis, Analysis and Evaluation, 3rd ed.; Wiley: Hoboken, NJ, 2009.
Sigma-Aldrich. Platinum catalyst
pricing. http://www.sigmaaldrich.com/catalog/Lookup.do?N5=All&N3=mode%2Bmatc
hall&N4=platinum&D7=0&D10=&N25=0&N1=S_ID&ST=RS&F=PR (accessed Apr 19,
2010).
Solaronix. Pt coating service. http://www.solaronix.com/services/ptcoating/ (accessed
Apr 19, 2010).
Su, K., Kung, K.Y., Lahtinen, J., Shen, Y.R. and Somorjai, G.A. J. Mol. Catal. A: Chem.
141 (1999), p. 9.
Thompson, A and Plimpton, S. "SPPARKS Users Manual." Sandia National
Laboratories. http://www.sandia.gov/~sjplimp/spparks/doc/
Manual.html (accessed Apr 16, 2010).
Voloshin, Y., Halder, R., and Lawal, A., Catal. Today 125 (2007), p. 40-7.
Voorhoeve, R. J. H. , Remeika, J. P. , Freeland, P. E. , Matthias, P. T. Rare-earth oxides
of manganese and cobalt rival platinum for the treatment of carbon monoxide in auto
exhaust. Science 177, 353 (1972).
Watts, P. and Wiles, C., Chem. Commun. 1 (2006), p. 443-67
Xu, C. and Koel, B.E. Surf. Sci. 304 (1994), p. 249.
Zindarsic-Plazl, P. "Steroid Extraction in a Microchannel System - Mathematical
Modelling and Experiments." Lab Chip 7 (2007): 883-89.
Zumdahl, S.S. Chemical Principles, 5th ed.; Houghton Mifflin: Boston, MA, 2007.
_______________________________________Curnan, Gopalratnam, Slominski, Wang
51
Appendix A. Setting Up a Problem in SPPARKS
A.1 Input File Structure
A SPPARKS input file consists of three sections. The first section contains
commands used to initialize a simulation. These commands include choice of application
and choice of solving method. The second section includes commands for various
settings and commands specifying simulation parameters. The third section consists of a
command to perform the simulation. The second and third sections can be repeated as
necessary in order to change settings and/or simulation parameters during the course of a
simulation.
The required commands used to perform the simulations presented are explained
in the following sections. Some commands are optional and only necessary when a value
different from the default is needed. Default values for optional commands can be found
in the documentation for SPPARKS. Additional information about using SPPARKS can
also be found in the documentation.
Note that SPPARKS accepts values in scientific notation. For example, a value of
1.0 × 10³ would be entered as 1.0e3, and a value of 1.0 × 10
-3 would be entered as 1.0e-
3 in SPPARKS.

_______________________________________Curnan, Gopalratnam, Slominski, Wang
52
A.2 seed
Each input file begins with the seed command. The value set by this command is
used as a seed by a master random number generator to initialize auxiliary random
number generators that generate random numbers for all operations requiring random
numbers. The command is of the form
seed Nvalue
in which Nvalue, which must be a positive integer, is the value of the seed. For example,
a seed value of 459 would be set as shown below.
seed 459
Because SPPARKS is a stochastic simulator, this command must appear in every input
file. For a given system, performing simulations with different seed values will give
varied results.
_______________________________________Curnan, Gopalratnam, Slominski, Wang
53
A.3 app_style
The seed command is followed by the choice of application for the simulation,
specified by the app_style command. The command is of the form
app_style style args
in which style is the name of the application chosen for the simulation and args
includes zero or more arguments specific to the application chosen. In this case, the
app_style chemistry application for a system of coupled chemical reactions, which
takes no additional arguments, is chosen. Thus, the command takes the following form.
app_style chemistry
_______________________________________Curnan, Gopalratnam, Slominski, Wang
54
A.4 solve_style, sweep
A choice of solution method follows the choice of application. The app_style
chemistry application is not an on-lattice application involving defined lattice sites and
must be solved with a KMC algorithm. Because the sweep command instructs
SPPARKS to use a rKMC algorithm only suitable for on-lattice applications, a KMC
solver must be chosen for the simulation. The command is of the form
solve_style style args keyword value ...
in which style is the name of the chosen solver. args, keyword, and value are only
applicable to the group solver and will not be elaborated here, as explained below. Three
solvers are available: solve_style linear, solve_style tree, and solve_style
group. For a simulation with few events from which to choose, the solve_style
linear solver, which chooses events from a list of events, is appropriate and is chosen.
The command thus takes the following form.
solve_style linear
The solve_style tree and solve_style group solvers are more appropriate for
simulations with greater numbers of possible events and/or large numbers of sites.
Depending on the complexity of the system, these solvers may give shorter simulation
times. As they were unnecessary for the simulations presented, they will not be discussed
further. Instructions for using these solvers, with information about the algorithms they
employ, can be found in the documentation for SPPARKS.

_______________________________________Curnan, Gopalratnam, Slominski, Wang
55
A.5 volume
The volume command sets the volume of the system in the app_style
chemistry application. The command is of the form
volume V
in which V is the volume of the system in liters. For example, a volume of 1 μL or 1 ×
10-6
L would be entered as shown below.
volume 1e-6

_______________________________________Curnan, Gopalratnam, Slominski, Wang
56
A.6 add_species
Chemical species are added to the system via the add_species command. The
command is of the form
add_species name1 name2 ...
in which name1 and name2 are names of chemical species. Multiple species may be
added in a single command, or species may be added individually in multiple commands.
More species may be added in a single command, represented by ... above. For
example, species A, B, and C may be added either in a single command or in a series of
commands as shown below.
add_species A B C
or
add_species A
add_species B
add_species C
Names may contain any non-whitespace characters. For example, species C6H6 may be
added as shown below.
add_species C6H6
A system may contain any number of species.

_______________________________________Curnan, Gopalratnam, Slominski, Wang
57
A.7 add_reaction
Chemical reactions are defined with the add_reaction command. The command
is of the form
add_reaction reactant1 reactant2 rate product1 product2 ...
in which reactant1 and reactant2 are names of reactants, rate is the rate constant, and
product1 and product2 are names of products. A reaction may involve one or two
reactants and one or more products. Their names are those specified by the add_species
command. The number of reactants participating in a reaction determines the unit(s) of
the rate constant: s-1
for one reactant, or L mol-1
s-1
or M-1
s-1
for two reactants. For
example, a reaction A + B → C involving the species from above with a rate constant of
1 L mol-1
s-1
or 1 M-1
s-1
would be entered as shown below.
add_reaction A B 1 C
Any number of reactions may be defined for a system.
Reactions involving zero reactants or zero products are allowed and can be
utilized to add or remove particles to or from a system in order to simulate a CSTR, for
example.
_______________________________________Curnan, Gopalratnam, Slominski, Wang
58
A.8 count
The count command sets the initial number of particles of a species and is of the
form
count species N
in which species is the name of the species and N is the initial number of particles of the
species. The name is that specified by the add_species command. For example, an
initial number of 106 particles of species A from above would be entered as shown below.
count A e6
Note that the count command does not accept values
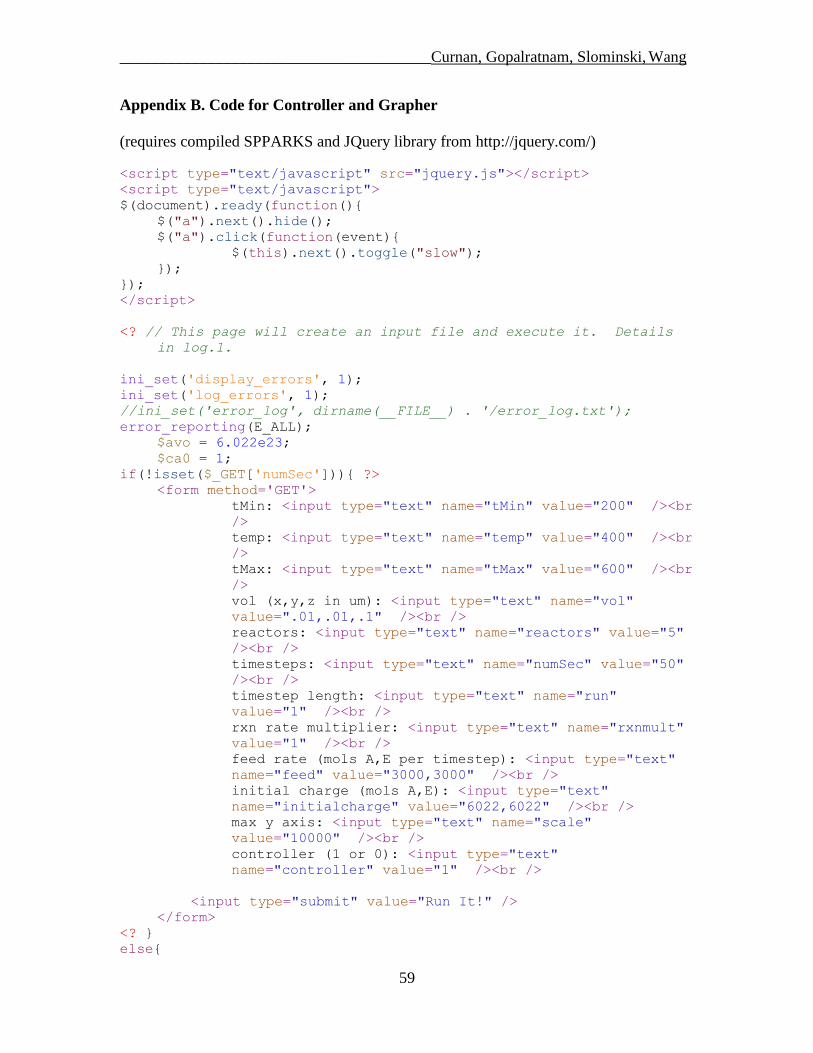
_______________________________________Curnan, Gopalratnam, Slominski, Wang
59
Appendix B. Code for Controller and Grapher
(requires compiled SPPARKS and JQuery library from http://jquery.com/)
<script type="text/javascript" src="jquery.js"></script>
<script type="text/javascript">
$(document).ready(function(){
$("a").next().hide();
$("a").click(function(event){
$(this).next().toggle("slow");
});
});
</script>
<? // This page will create an input file and execute it. Details
in log.1.
ini_set('display_errors', 1);
ini_set('log_errors', 1);
//ini_set('error_log', dirname(__FILE__) . '/error_log.txt');
error_reporting(E_ALL);
$avo = 6.022e23;
$ca0 = 1;
if(!isset($_GET['numSec'])){ ?>
<form method='GET'>
tMin: <input type="text" name="tMin" value="200" /><br
/>
temp: <input type="text" name="temp" value="400" /><br
/>
tMax: <input type="text" name="tMax" value="600" /><br
/>
vol (x,y,z in um): <input type="text" name="vol"
value=".01,.01,.1" /><br />
reactors: <input type="text" name="reactors" value="5"
/><br />
timesteps: <input type="text" name="numSec" value="50"
/><br />
timestep length: <input type="text" name="run"
value="1" /><br />
rxn rate multiplier: <input type="text" name="rxnmult"
value="1" /><br />
feed rate (mols A,E per timestep): <input type="text"
name="feed" value="3000,3000" /><br />
initial charge (mols A,E): <input type="text"
name="initialcharge" value="6022,6022" /><br />
max y axis: <input type="text" name="scale"
value="10000" /><br />
controller (1 or 0): <input type="text"
name="controller" value="1" /><br />
<input type="submit" value="Run It!" />
</form>
<? }
else{
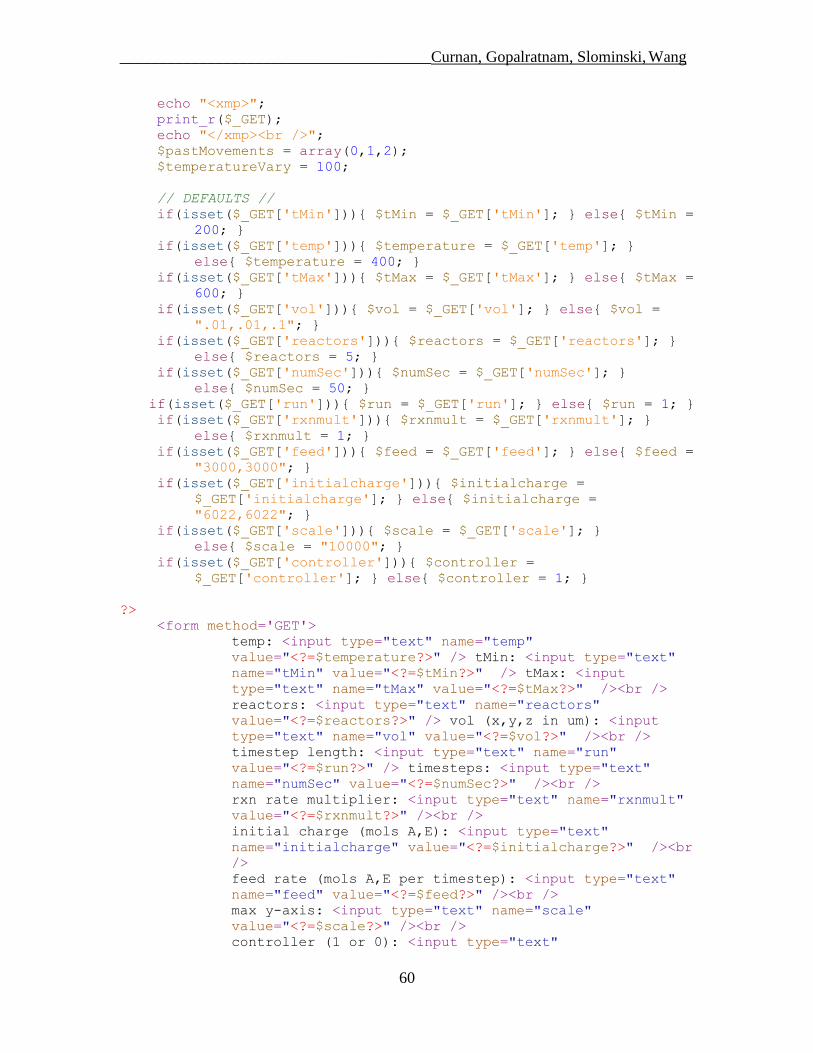
_______________________________________Curnan, Gopalratnam, Slominski, Wang
60
echo "<xmp>";
print_r($_GET);
echo "</xmp><br />";
$pastMovements = array(0,1,2);
$temperatureVary = 100;
// DEFAULTS //
if(isset($_GET['tMin'])){ $tMin = $_GET['tMin']; } else{ $tMin =
200; }
if(isset($_GET['temp'])){ $temperature = $_GET['temp']; }
else{ $temperature = 400; }
if(isset($_GET['tMax'])){ $tMax = $_GET['tMax']; } else{ $tMax =
600; }
if(isset($_GET['vol'])){ $vol = $_GET['vol']; } else{ $vol =
".01,.01,.1"; }
if(isset($_GET['reactors'])){ $reactors = $_GET['reactors']; }
else{ $reactors = 5; }
if(isset($_GET['numSec'])){ $numSec = $_GET['numSec']; }
else{ $numSec = 50; }
if(isset($_GET['run'])){ $run = $_GET['run']; } else{ $run = 1; }
if(isset($_GET['rxnmult'])){ $rxnmult = $_GET['rxnmult']; }
else{ $rxnmult = 1; }
if(isset($_GET['feed'])){ $feed = $_GET['feed']; } else{ $feed =
"3000,3000"; }
if(isset($_GET['initialcharge'])){ $initialcharge =
$_GET['initialcharge']; } else{ $initialcharge =
"6022,6022"; }
if(isset($_GET['scale'])){ $scale = $_GET['scale']; }
else{ $scale = "10000"; }
if(isset($_GET['controller'])){ $controller =
$_GET['controller']; } else{ $controller = 1; }
?>
<form method='GET'>
temp: <input type="text" name="temp"
value="<?=$temperature?>" /> tMin: <input type="text"
name="tMin" value="<?=$tMin?>" /> tMax: <input
type="text" name="tMax" value="<?=$tMax?>" /><br />
reactors: <input type="text" name="reactors"
value="<?=$reactors?>" /> vol (x,y,z in um): <input
type="text" name="vol" value="<?=$vol?>" /><br />
timestep length: <input type="text" name="run"
value="<?=$run?>" /> timesteps: <input type="text"
name="numSec" value="<?=$numSec?>" /><br />
rxn rate multiplier: <input type="text" name="rxnmult"
value="<?=$rxnmult?>" /><br />
initial charge (mols A,E): <input type="text"
name="initialcharge" value="<?=$initialcharge?>" /><br
/>
feed rate (mols A,E per timestep): <input type="text"
name="feed" value="<?=$feed?>" /><br />
max y-axis: <input type="text" name="scale"
value="<?=$scale?>" /><br />
controller (1 or 0): <input type="text"
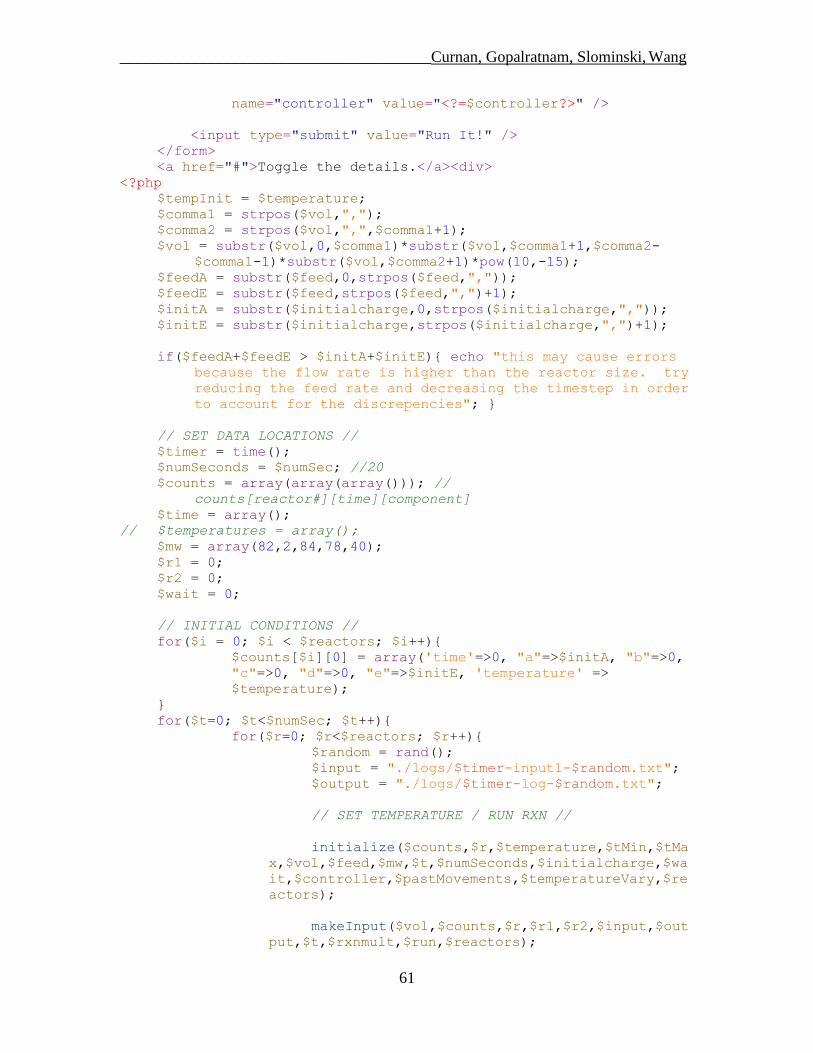
_______________________________________Curnan, Gopalratnam, Slominski, Wang
61
name="controller" value="<?=$controller?>" />
<input type="submit" value="Run It!" />
</form>
<a href="#">Toggle the details.</a><div>
<?php
$tempInit = $temperature;
$comma1 = strpos($vol,",");
$comma2 = strpos($vol,",",$comma1+1);
$vol = substr($vol,0,$comma1)*substr($vol,$comma1+1,$comma2-
$comma1-1)*substr($vol,$comma2+1)*pow(10,-15);
$feedA = substr($feed,0,strpos($feed,","));
$feedE = substr($feed,strpos($feed,",")+1);
$initA = substr($initialcharge,0,strpos($initialcharge,","));
$initE = substr($initialcharge,strpos($initialcharge,",")+1);
if($feedA+$feedE > $initA+$initE){ echo "this may cause errors
because the flow rate is higher than the reactor size. try
reducing the feed rate and decreasing the timestep in order
to account for the discrepencies"; }
// SET DATA LOCATIONS //
$timer = time();
$numSeconds = $numSec; //20
$counts = array(array(array())); //
counts[reactor#][time][component]
$time = array();
// $temperatures = array();
$mw = array(82,2,84,78,40);
$r1 = 0;
$r2 = 0;
$wait = 0;
// INITIAL CONDITIONS //
for($i = 0; $i < $reactors; $i++){
$counts[$i][0] = array('time'=>0, "a"=>$initA, "b"=>0,
"c"=>0, "d"=>0, "e"=>$initE, 'temperature' =>
$temperature);
}
for($t=0; $t<$numSec; $t++){
for($r=0; $r<$reactors; $r++){
$random = rand();
$input = "./logs/$timer-input1-$random.txt";
$output = "./logs/$timer-log-$random.txt";
// SET TEMPERATURE / RUN RXN //
initialize($counts,$r,$temperature,$tMin,$tMa
x,$vol,$feed,$mw,$t,$numSeconds,$initialcharge,$wa
it,$controller,$pastMovements,$temperatureVary,$re
actors);
makeInput($vol,$counts,$r,$r1,$r2,$input,$out
put,$t,$rxnmult,$run,$reactors);

_______________________________________Curnan, Gopalratnam, Slominski, Wang
62
exec("./spk_mac < $input");
// GATHER DATA AND PUT IT IN ARRAYS 'A' AND
'B' //
getData($counts,$r,$t,$output,$mw,$ca0,$vol,$
avo,$temperature);
echo "<hr />";
}
}
echo "</div><br /><br />";
// OUTPUT THE DATA // counts[reactor#][time][component]
$reactorPlot = count($counts)-1/*0*/;
$chd = "$initA,";
foreach($counts[$reactorPlot] as
$tempval){ $chd.=$tempval['a'].","; }
$chd = substr($chd, 0, -1);
$chd .= "|0,";
foreach($counts[$reactorPlot] as
$tempval){ $chd.=$tempval['b'].","; }
$chd = substr($chd, 0, -1);
$chd .= "|0,";
foreach($counts[$reactorPlot] as
$tempval){ $chd.=$tempval['c'].","; }
$chd = substr($chd, 0, -1);
$chd .= "|0,";
foreach($counts[$reactorPlot] as
$tempval){ $chd.=$tempval['d'].","; }
$chd = substr($chd, 0, -1);
$chd .= "|$initE,";
foreach($counts[$reactorPlot] as
$tempval){ $chd.=$tempval['e'].","; }
$chd = substr($chd, 0, -1);
if($controller){
$chd .= "|$tempInit,";
foreach($counts[$reactorPlot] as
$tempval){ $chd.=$tempval['temperature'].","; }
$chd = substr($chd, 0, -1);
} ?>
<body>
<form action='http://chart.apis.google.com/chart' method='POST'
id='chartForm' target="_blank">
<input type="hidden" name="cht" value="lc" />
<input type="hidden" name="chs" value="750x400" />
<input type="hidden" name="chxt" value="x,x,y" /> <!-- name
the axes -->
<input type="hidden" name="chxr"
value="0,0,<?=$numSeconds*$run?>,<?=$numSeconds*$run/10?>
|2,0,<?=$scale?>,<?=$scale/10?>" />
<input type="hidden" name="chxl" value="1:|Time (s)" />
<input type="hidden" name="chf" value="a,s,000000" />
<input type="hidden" name="chxp" value="1,50|3,50" />
_______________________________________Curnan, Gopalratnam, Slominski, Wang
63
<input type="hidden" name="chco"
value="FF0000,0000FF,00FF00,666666,000000,8B3A62" /> <!--
color of lines -->
<input type="hidden" name="chds" value="0,<?=$scale?>" /> <!--
height of graph -->
<input type="hidden" name="chg" value="10,10" /> <!-- spacing
of the dotted lines -->
<input type="hidden" name="chdl" value="C6H10 (cyclohexene,
82)|H2 (hydrogen, 2)|C6H12 (cyclohexane, 84)|C6H6
(benzene, 78)|Inert (argon, 40)<?php
if($controller){?>|Temperature (K)<? } ?>" /> <!-- legend
text -->
<input type="hidden" name="chtt" value="<?=$reactors?>
Reactors, Vol = <?=$vol?>L, Final Temperature =
<?=round($temperature)?>K, Rxn 1 Rate = <?=$rxnmult?>|
Feed = <?=$feed?> molecules, Initial =
<?=$initialcharge?> Timestep = <?=$run?>" /> <!-- title
text -->
<input type="hidden" name="chd" value="t:<?=$chd?>"/> <!--
data -->
<input type="submit" value="Graph It!" />
</form>
<?
echo "<a href=\"#\">Toggle the logs.</a><div><br /> Logs are in
/logs/$random<br />
</body><xmp>";
$i=$reactors-1;
foreach($counts[$i] as $times){
echo
$times['time'].",".$times['a'].",".$times['b'].",".$tim
es['c'].",".$times['d'].",".$times['e'].",".$times['tem
perature']."\r\n";
}
echo "</xmp><hr /><xmp>";
echo "</xmp></div></body>";
}
// INITIALIZE ALL VARIABLES //
function
initialize($counts,$r,$temperature,$tMin,$tMax,$vol,$feed,$mw,$t
,$numSeconds,$initialcharge,$wait,$controller,$pastMovements,$te
mperatureVary,$reactors){
global
$time,$counts,$r1,$r2,$temperature,$vol,$avo,$wait,$pastMov
ements,$temperatureVary; //make these accessible outside
this function //
// THESE DON'T CHANGE //
$avo = 6.022e23;
$boltz = 1.381e-23;
$R = 8.314; // J/molK
$n1 = 1;

_______________________________________Curnan, Gopalratnam, Slominski, Wang
64
$n2 = 1;
$ca0 = 1; //.03447 = 400K, 11604 K per eV
$E1 = 21700; // J/mol
$E2 = 1920; // J/mol
$k1 = 218; // L/min
$k2 = 0.160; // L/mol
if($controller) $temperature =
chooseTemp($vol,$tMin,$tMax,$t,$numSeconds,$temperature,$co
unts,$r,$R,$E1,$E2,$k1,$k2,$wait,$pastMovements,$temperatur
eVary,$reactors);
else $temperature = $temperature;
//print_r($counts);
//echo "<br />";
$pressure = $counts[$r][count($counts[$r])-1];
$pressure =
$pressure['a']+$pressure['b']+$pressure['c']+$pressure['d']
+$pressure['e'];
// echo "num mols = $pressure";
$pressure = $pressure / $avo * 0.08206 * $temperature / $vol;
echo "Pressure = ".round($pressure,1)." atm.";
$r1 = $k1*exp(-$E1/($R*$temperature));
$r2 = $k2*exp(-$E2/($R*$temperature));
// echo "r1 = $r1, r2 = $r2<br />";
$feedA = substr($feed,0,strpos($feed,","));
$feedE = substr($feed,strpos($feed,",")+1);
$initA = substr($initialcharge,0,strpos($initialcharge,","));
$initE = substr($initialcharge,strpos($initialcharge,",")+1);
// echo "$initA.$initE";
if($r==0 && $t==0){ // FEED STREAM PLUS INITIAL CHARGE
$push = array("a"=>$feedA, "b"=>0, "c"=>0,
"d"=>0,'e'=>$feedE);
$tempy = array("a"=>$initA/$reactors, "b"=>0, "c"=>0,
"d"=>0,'e'=>$initE/$reactors); //EDITS
}
elseif($r == 0){ // FEED STREAM FLOW RATE
$push = array("a"=>$feedA, "b"=>0, "c"=>0,
"d"=>0,'e'=>$feedE);
$tempy = $counts[$r][$t-1];
}
elseif($t == 0){ // INITIAL CHARGE
$push = $counts[$r-1][$t]['push'];
$tempy = array("a"=>$initA/$reactors, "b"=>0, "c"=>0,
"d"=>0,'e'=>$initE/$reactors); //EDITS
}
else{ // QUANTITY PUSHED TO ARRAY
// echo "amount pushed to this array";
// print_r($counts[$r-1][$t]);
$push = $counts[$r-1][$t]['push'];

_______________________________________Curnan, Gopalratnam, Slominski, Wang
65
$tempy = $counts[$r][$t-1];
}
$particlesInitial = $initA + $initE;
$particlesPushed =
$push['a']+$push['b']+$push['c']+$push['d']+$push['e'];
if($particlesInitial == 0){ $ratio = 1; echo "ERROR!"; }
else{ $ratio = $particlesPushed/$particlesInitial; }
$counts[$r][$t] = array('a'=>round($tempy['a']*(1-
$ratio)+$push['a']), 'b'=>round($tempy['b']*(1-
$ratio)+$push['b']), 'c'=>round($tempy['c']*(1-
$ratio)+$push['c']), 'd'=>round($tempy['d']*(1-
$ratio)+$push['d']), 'e'=>round($tempy['e']*(1-
$ratio)+$push['e']), 'push'=>
array('a'=>round($tempy['a']*$ratio),
'b'=>round($tempy['b']*$ratio),
'c'=>round($tempy['c']*$ratio),
'd'=>round($tempy['d']*$ratio),
'e'=>round($tempy['e']*$ratio)));
}
// CONTROLLER //
function
chooseTemp($vol,$tMin,$tMax,$t,$numSeconds,$temperature,$counts,
$r,$R,$E1,$E2,$k1,$k2,$wait,$pastMovements,$temperatureVary,$rea
ctors){
global $temperature,$wait,$pastMovements,$temperatureVary;
$numToCount = 5; // will use this many closest and one step away
further
$tolerance = .1; // how close do the numbers need to be?
$percentDone = $t / $numSeconds;
$recents = array_slice($counts[$r], count($counts[$r])-
2*$numToCount);
$recentShort = array_slice($recents, count($recents)-
$numToCount);
$longAverage = 0;
foreach($recents as $temp){
$longAverage+= $temp['a'];
}
$longAverage /= 2*$numToCount;
$shortAverage = 0;
foreach($recentShort as $temp){
$shortAverage+= $temp['a'];
}
$shortAverage /= $numToCount;
// echo "avg1 = $longAverage, avg2 = $shortAverage";
if($wait >= 5 && $longAverage!=0 && $longAverage*(1+$tolerance)
> $shortAverage && $longAverage/(1+$tolerance) <
$shortAverage){

_______________________________________Curnan, Gopalratnam, Slominski, Wang
66
if($pastMovements[count($pastMovements)-
1]==$pastMovements[count($pastMovements)-3]){
$temperatureVary /= 2;
if($temperatureVary < 1) $temperatureVary=1;
echo "gonna vary by $temperatureVary";
}else { }
$temperatureVary = 7;
echo " <b>STEADY STATE</b> @ t=",$counts[$r][$t-
1]['time'];
$timer = time();
$random = rand();
$inputHigh = "./logs/$timer-input1-$random-high.txt";
$outputHigh = "./logs/$timer-log-$random-high.txt";
$inputLow = "./logs/$timer-input1-$random-low.txt";
$outputLow = "./logs/$timer-log-$random-low.txt";
if($temperature+$temperatureVary < $tMax){ $tHigh =
$temperature+$temperatureVary; } else { $tHigh =
$tMax; }
if($temperature-$temperatureVary > $tMin){ $tLow =
$temperature-$temperatureVary; } else { $tLow = $tMin; }
$r1high = $k1*exp(-$E1/($R*$tHigh));
$r2high = $k2*exp(-$E2/($R*$tHigh));
$r1low = $k1*exp(-$E1/($R*$tLow));
$r2low = $k2*exp(-$E2/($R*$tLow));
$countsTemp = $counts[$r][count($counts[$r])-1];
$rtemp =
array(0=>array(0=>array('a'=>$countsTemp['a']*100,
'b'=>$countsTemp['b']*100, 'c'=>$countsTemp['c']*100,
'd'=>$countsTemp['d']*100, 'e'=>$countsTemp['e']*100)));
makeInput($vol*100,$rtemp,0,$r1high,$r2high,$inputH
igh,$outputHigh,0,1,.2,$reactors);
makeInput($vol*100,$rtemp,0,$r1low,$r2low,$inputLow
,$outputLow,0,1,.2,$reactors);
exec("./spk_mac < $inputHigh");
exec("./spk_mac < $inputLow");
$file2High = fopen("./".$outputHigh, 'r') or die("can't
open file2");
$dataHigh = fread($file2High,
filesize("./".$outputHigh));
fclose($file2High);
$dataHigh = explode("\n",$dataHigh);
$tempHigh = preg_split("/[\s]+/", $dataHigh[21]);
// print_r($temporary);
$file2Low = fopen("./".$outputLow, 'r') or die("can't
open file2");
$dataLow = fread($file2Low, filesize("./".$outputLow));
fclose($file2Low);
$dataLow = explode("\n",$dataLow);
$tempLow = preg_split("/[\s]+/", $dataLow[21]);
_______________________________________Curnan, Gopalratnam, Slominski, Wang
67
// 3 = cyclohexene
// 4 = hydrogen
// 5 = cyclohexane
// 6 = benzene
// $highConversion = $tempHigh[5]/$tempHigh[6];
//MAXIMIZE BENZ
// $lowConversion = $tempLow[5]/$tempLow[6];
//MAXIMIZE BENZ
// if($highConversion > $lowConversion){ $temperature = $tHigh; }
$highConversion = $tempHigh[6]/$tempHigh[5];
// COMPARING BENZ AND CYCLOHEX
$lowConversion = $tempLow[6]/$tempLow[5];
// COMPARING BENZ AND CYCLOHEX
if(abs($highConversion-1) < abs($lowConversion-1))
{ $temperature = $tHigh; }
else
{ $temperature = $tLow; }
echo ". Move temp to $temperature. ";
$pastMovements[] = $temperature;
$wait = 0;
}
else{
if(isset($counts[$r][$t-1]['time'])) $tima =
$counts[$r][$t-1]['time']; else $tima = 0;
echo " <i>NOT STEADY STATE</i> @ t=$tima. Keep temp
at $temperature. ";
$wait++;
}
return $temperature;
}
// MAKE THE INPUT FILE // vol = 1.9098395e-11
function
makeInput($vol,$counts,$r,$r1,$r2,$input,$output,$t,$rxnmult,$ru
n,$reactors){
$file = fopen($input, 'w') or die("can't open file");
$random = rand();
$tempy = array_keys($counts[$r]);
$timer = $tempy[count($tempy)-1];
$r1 *= $rxnmult;
$vol /= $reactors;
// echo " ",$input," ";
$text = "
seed $random
log $output
app_style chemistry
solve_style linear

_______________________________________Curnan, Gopalratnam, Slominski, Wang
68
add_species A
add_species B
add_species C
add_species D
add_species E
volume $vol
count A ".$counts[$r][$timer]['a']."
count B ".$counts[$r][$timer]['b']."
count C ".$counts[$r][$timer]['c']."
count D ".$counts[$r][$timer]['d']."
count E ".$counts[$r][$timer]['e']."
add_reaction 1 A B $r1 C
add_reaction 2 A $r2 D B B
stats $run
run $run
";
fwrite($file, $text);
fclose($file);
}
// COLLECT THE DATA FROM THE LOG FILES //
function
getData($counts,$r,$t,$output,$mw,$ca0,$vol,$avo,$temperature){
global $counts,$r; //make these accessible outside this function
//
$file2 = fopen("./".$output, 'r') or die("can't open file2");
$data = fread($file2, filesize("./".$output));
fclose($file2);
$data = explode("\n",$data);
$timeSoFar = max($counts[$r]);
if(isset($timeSoFar['time'])){
$timeSoFar = $timeSoFar['time']; // time elapsed is the
largest time in counts[r]
}
else{ // this should only happen for reactor 0 which has been
prefilled with initial counts.
$timeSoFar2 = max(array_keys($counts[$r]))-1;
if(isset($counts[$r][$timeSoFar2]['time'])){
$timeSoFar = $counts[$r][$timeSoFar2]['time'];
}
else{
$timeSoFar = 0; // this should only happen
for reactor 0 time 0
}
}
$temporary = preg_split("/[\s]+/", $data[21]);
$timeSoFar3 = $timeSoFar + $temporary[1];

_______________________________________Curnan, Gopalratnam, Slominski, Wang
69
///////// ADD STUFF FROM REACTOR ///////
$counts[$r][$t] = array('time'=>$timeSoFar3, 'a'=>$temporary[3],
'b'=>$temporary[4], 'c'=>$temporary[5], 'd'=>$temporary[6],
'e'=>$temporary[7], 'temperature' => $temperature) +
$counts[$r][$t];
}
?>