Embed Size (px)
Citation preview
1
Mode I fracture in adhesively-bonded joints: A mesh-size independent modelling approach using cohesive elements
D. Álvarez, B.R.K. Blackman, F.J. Guild, A.J. Kinloch
Imperial College London, Department of Mechanical Engineering, Exhibition Rd., London SW7 2AZ, London, UK
Abstract
In recent years cohesive elements, coupled with a finite-element analysis (FEA) approach, have become increasingly popular for simulating both delamination in composite materials and fracture in adhesively-bonded joints. However, the industrial application of Cohesive Zone Models to model large and complex structures has been hindered by the requirement of extremely fine meshes along the crack propagation path. In the present work two-dimensional linear and quadratic (i.e. second-order) cohesive elements to model crack initiation and growth have been implemented in Abaqus using a user subroutine. These elements, which have a modified topology that allows a user-defined number of integration points, have been employed to model the fracture response of various mode I test specimens consisting of metallic substrates bonded with a structural film-adhesive. The effects of the mesh-density, element order and number of integration points on the numerical solution have been investigated. Whilst the linear models have shown the typical mesh-size dependent behaviour, the results obtained with their quadratic counterparts have been found to be independent of the element size. Furthermore, it is shown that increasing the number of integration points improves the stability, convergence and smoothness of the solutions. The mesh-size independent response obtained with the quadratic models arises from more accurate simulation of the deformed profile of the substrates and a more accurate calculation of the energy dissipated in the process zone due to damage. Overall, it is demonstrated that the quadratic cohesive-element formulation enables the use of much coarser meshes, resulting in shorter simulation times, and will therefore allow an increase in the industrial application of Cohesive Zone Models.
Keywords: Adhesives, Cohesive Zone Modelling, Finite-Element Analysis, Fracture, Mesh-dependency/Mesh-size
Corresponding authors:
D. Álvarez. E-Mail: [email protected] B.R.K. Blackman. E-Mail: [email protected] F.J. Guild. E-Mail: [email protected] A.J. Kinloch. E-Mail: [email protected]

2
NOMENCLATURE
British Alphabet
Crack length
Initial crack length
Specimen width
Coefficients for the analytical solution of the deformation of the substrates in a DCB specimen ahead of the crack tip (re: Ouyang & Li model)
Interface stiffness tensor
Undamaged stiffness tensor
Scalar damage variable ranging between 0 and 1
Total damage at time
Young’s modulus of the substrate
Young’s modulus of the adhesive
Equivalent elastic modulus for orthotropic materials
Correction factor for large displacements
Critical strain-energy release rate

3
Critical strain-energy release rate for mode I, i.e. the mode I adhesive fracture energy
Shear modulus of the adhesive in the “1-2” plane
Thickness of the substrate
Penalty stiffness for opening (mode I) and shear (mode II) modes
Cohesive zone length
Length of the cohesive element
Length of the deformed mid-surface of the cohesive element “i”
Size of the elastic zone ahead of the cohesive zone
TDCB geometry parameter
Correction factor for the presence of loading blocks
Lagrange shape function associated to node “k” in the isoparametric element
Load
Radius of curvature of the substrate at
Distance to crack tip
Damage threshold at time “t”
Time variable

4
Thickness of the adhesive layer and thickness of the cohesive element in the unstrained configuration
Displacement of the node “k” in the direction “i”
Local displacement of the upper substrate ahead of the crack tip
Gauss weighting factor associated with integration point “j”
Greek Alphabet
Parameters for the Ouyang & Li model
Displacement jump in the local reference system at a generic point of the interface
Displacement at damage initiation for mode “i”
Displacement for a fully damaged interface ( ) for mode “i”
Integration time increment
Applied displacement
Kronecker delta
Ultimate tensile strain
Tensile strain at plastic deformation
Rotation tensor (global to local coordinate systems)
5
Rotation of the substrate at the crack tip (re: Ouynag and Li analytical model)
Norm of the displacement jump tensor or equivalent displacement jump norm
Poisson’s ratio
Ultimate tensile stress
Yield stress
Normal stress
Cohesive stresses in the local coordinate system
Maximum cohesive stress for mode “i”
Energy dissipated in

6
1 INTRODUCTION
In recent years there has been an increase in the attention paid to fuel efficiency in transportation. As a result, weight saving has become a major concern and a very significant effort has been made to develop lighter materials and structures. The high values of stiffness-to-weight and strength-to-weight ratios of fibre-reinforced plastics have not gone unnoticed in the aerospace industry, where composites have become the material of choice for many structural components. The development of tougher adhesives has positioned adhesive bonding as an appealing technique to join the composite parts to the rest of the structure. Not only does adhesive bonding offer additional weight savings, but it also has been shown to improve the fatigue performance compared to mechanically-fastened structures.
As for delamination in composite materials, a stress-based approach has been traditionally employed to study the behaviour, estimate the strength and optimize various geometrical aspects of adhesively-bonded joints [1-4]. However, since such joints usually fail by the initiation and propagation of flaws [5], other methodologies have been shown to be better suited to investigate these problems [6-8]. Particularly, fracture mechanics has gradually become more popular since the pioneering work of Ripling et al. [9] and Mostovoy et al. [10]. Indeed, fracture mechanics has proved to be a viable tool for predicting the static properties of adhesively-bonded joints [11, 12], as well as finding extensive use in fatigue and durability studies [13-16].
The design of new adhesive joints, currently based on expensive and time-consuming experimental programs, could greatly benefit from the application of numerical techniques such as finite-element analysis (FEA). Some fracture mechanics methods, including the Virtual Crack Closure Technique (VCCT) and the J-integral, have been implemented in commercial FEA codes. However, some of these methodologies have important drawbacks which limit their application to crack propagation analysis, namely (a) an inability to predict crack nucleation, (b) the need to pre-define the crack growth path, (c) difficulties when modelling multiple flaws, and (e) the computational costs in three-dimensional problems, to name but a few [17, 18].
The Cohesive Zone Model (CZM) approach may circumvent most of the aforementioned limitations and therefore represents an appealing alternative for modelling adhesive joints. However, despite its current popularity, the use of the CZM approach is not without difficulties. In addition to the problems in defining suitable values for the cohesive parameters [17, 19, 20], the material softening behaviour associated with the damage formulation poses significant convergence issues [17, 21]. Nevertheless, it is undoubtedly the requirement of extremely fine meshes along the crack propagation path that most hinders the application of this method to the analysis of large and complex structures [20, 22].

7
This aspect of the mesh-size dependent response associated with the CZM approach is investigated in the present paper. A two-dimensional cohesive-element formulation to model crack initiation and growth in adhesively-bonded joints has been developed and implemented in Abaqus using an user (UEL) subroutine. Based on the work of Camanho and co-workers [23, 24], the constitutive equations have been optimised for a finite-thickness unstrained configuration, while the topology has been modified to allow quadratic (i.e. second-order) kinematics and a user-defined number of integration points. The resulting elements have been employed to simulate the fracture response of various mode I test specimens bonded with a film-adhesive. The size of the process zone and the stress distribution ahead of the crack tip have also been examined. The accuracy of the numerical predictions has been ascertained by direct comparison with the experimental results. In addition, a mesh-sensitivity analysis has been undertaken in order to study the effects of the order of the discretisation, the mesh density and the number of integration points defined in the cohesive elements. Whilst the linear models exhibited the typical mesh-size dependent behaviour, the response of the quadratic models has been found to be independent of the length of the cohesive elements. Further, it has been shown that, if the number of integration points employed is sufficiently high, the numerical solution is smooth and stable. The superior performance of the quadratic models, which arises from combining the superior performance of both the quadratic continuum elements used to mesh the substrates and the quadratic cohesive-element formulation, should enable an increase in the industrial applications of the CZM approach.
A brief review of the fundamental aspects of the CZM approach is presented in the following section. The cohesive formulation employed throughout this work, including a method to estimate the size of the numerical cohesive zone, is then described. A summary of the experimental results obtained with various mode I test specimens is then followed by the details of the finite-element models employed to simulate the fracture response of the various joints studied. The numerical predictions and the results of the mesh sensitivity analysis are then presented. Finally, the reasons for the apparent mesh-size independent behaviour of the quadratic models, and its implications, are discussed in Section 7.
2 THEORETICAL BACKGROUND: THE COHESIVE ZONE MODEL (CZM)
Developed within the framework of damage mechanics, the CZM approach relies on the assumption that the damage mechanisms leading to fracture are localized in a thin layer of material ahead of the crack tip, referred to as the failure process zone (FPZ) [25]. The material behaviour within the FPZ is characterized using a traction-separation law, also known as the ‘cohesive law’, which relates the cohesive stress to the separation in the process zone. It is commonly assumed that, under monotonically increasing loading, the stress first increases to a maximum value, the point at which damage initiation takes place. As the damage grows, the stress then starts decreasing and vanishes when the separation reaches a critical value. In order to combine damage and fracture mechanics concepts, the area under

8
the traction separation law is equated to the critical strain-energy release rate, . Consequently, the CZM employs both stress and energy parameters to characterize the failure process, allowing the approach to be of much more general utility than conventional fracture mechanics [19, 26].
For practical applications, the shape of the cohesive law is usually predefined. Due to its simplicity, the bilinear damage evolution law has become very popular for crack growth analysis. However, many other damage evolution laws have been suggested in the literature (e.g. trapezoidal [27], cubic-polynomial [28], exponential [29] or linear-polynomial [30]). Notwithstanding, several authors have proposed that the form of the traction-separation curve is of secondary importance, compared to the value of the critical strain-energy release rate, when only the mode I propagation response of the structure is required [19, 28, 31, 32]. However, it is noteworthy that some contradictory results have been reported when modelling dynamic phenomena [30, 33] or if mesoscopic-scale ductile processes are present [34]. Whether the insensitivity of the solution to the shape of the evolution law applies to mode II and mixed-mode fracture also remains an open question. Furthermore, it has been suggested that the shape of the traction-separation law must reflect the damage mechanisms occurring within the FPZ if the stress distribution ahead of the crack tip and hence the size of the cohesive zone are to be accurately estimated [18, 35, 36].
Whether embedded into finite or zero-thickness elements (e.g. [37, 38]), as a contact function connecting two surfaces (e.g. [39]), or combined with finite-volume methods (e.g. [40, 41]), the CZM has become one of the most popular approaches to simulate fracture. In particular, cohesive (also called ‘interface’) elements have been applied to a very wide range of problems involving damage initiation and/or propagation. Among those applications, the study of delamination in fibre-reinforced composites has drawn the attention of many researchers (e.g. [42, 43]). Similarly, the macroscopic constitutive behaviour of thin adhesive layers may also be described using cohesive laws [44].
For example, Martiny et al. [25, 38] employed a CZM formulation, embedded into a FEA model, to investigate the static fracture of bonded joints in various elastic-plastic peel test configurations. Blackman et al. [32] derived an analytical correction for the beam root-rotation in the adhesively-bonded tapered double-cantilever beam (TDCB) specimen. These joints all obeyed linear-elastic fracture-mechanics (LEFM), and the authors compared the experimental results obtained for different substrate materials with FEA simulations employing a CZM. They reported excellent agreement between the analytical and FEA/CZM approaches. Starting from experimentally determined mode I and II parameters, Li et al. [26] used a CZM/FEA approach to simulate the mixed-mode fracture of bonded glass-fibre composite joints. Kafkalidis and Thouless [19] modelled a single-lap shear joint, prepared using aluminium-alloy bonded with an epoxy adhesive, via a CZM/FEA approach in order to study the effects of geometry and plasticity on the fracture behaviour of the joint. They also obtained excellent agreement with the experimental data.

9
Nevertheless, despite having attained notable popularity, the application of cohesive elements to model large-scale problems has been restricted by the stringent mesh-density requirements associated with this type of element [20, 22]. The need for very small cohesive elements has been traditionally attributed to the inability of the linear-shape functions to accurately reproduce the steep gradients of the stress and displacement fields in the region immediately ahead of the crack tip [22, 45]. This problem could be partially circumvented by ensuring a minimum number of elements within the cohesive zone. However, even though the precise number of elements required is not yet well established [46-48], the typical size of the physical FPZ results in very fine meshes being needed along the crack propagation path [18].
This issue has been extensively discussed in the literature, and several authors have proposed different techniques to alleviate the mesh-size restrictions. However, these methods have only allowed the use of slightly coarser meshes, and in some cases they require problem-dependent tuning. Alfano and Crisfield [17] identified the key role played by the maximum cohesive stress in the CZM on the element-size requirements needed to attain mesh-independent solutions. They showed that relatively high cohesive stresses are typically essential to obtain good agreement with LEFM theories. However, the higher the value of the maximum cohesive stress, the more refined the mesh needs to be to avoid spurious oscillations in the overall response of the FEA model. Information on several techniques to address the numerical instability can be found elsewhere in the literature [21, 49-52]. Turón et al. [20] proposed a simple strategy to increase artificially the cohesive zone length by reducing the value of the maximum cohesive stress. Although this method allows the use of slightly coarser meshes, it calls for problem-dependent tuning of the cohesive parameters and fails to predict accurately both the stress distribution near the crack tip and the global behaviour of the structure. Furthermore, Harper and Hallett [18] concluded that, whilst reductions in the maximum cohesive stress might be acceptable in mode I cases, they could cause excessive softening ahead of the crack tip in mode II loading. Guiamatsia et al. [22, 45] employed the partition of unity method to modify the cohesive-element formulation, enriching the nodal displacements with analytical solutions derived from elastic beam theory. Even though the new formulation showed encouraging results when applied to mode I and mixed-mode problems, the use of element sizes larger than 2 mm remained problematic. An analogous approach was investigated by Samimi et al. [53]. The adaptive CZM suggested by Hu et al. [54], where a pre-softening zone is inserted ahead of the existing traditional softening zone, yielded similar results (i.e. good agreement with elements sizes up to 2 mm) and at the same time their methodology managed to improve the stability of the solution.
3 COHESIVE-ELEMENT FORMULATION
3.1 The Basic Formulation
The two-dimensional cohesive-element formulation employed throughout this paper is derived from that initially proposed by Camanho et al. [23] and subsequently refined by Turón et al. [24]. However, the original linear element (with 4 nodes, see Figure 1a) has been

10
supplemented with a quadratic version (with six nodes, see Figure 1b), while the topology has been modified to allow a user-defined number of integration points (i.e. between two to thirty Gauss-Legendre points).
With the analysis of the macroscopic response of large structural components in mind, the aim of the present work is to represent the entire thickness of the adhesive layer using one layer of finite-thickness cohesive elements, where the fracture process details are essentially homogenised. Accordingly, the original constitutive equations have been optimized for a finite-thickness unstrained configuration, allowing for dissimilar values of the penalty stiffness in tension and shear. Finally, an algorithm based on the damage state at the individual integration points has been developed to compute the numerical cohesive zone length. A brief description of the resulting formulation, which has been implemented in Abaqus via a user element (UEL) subroutine, is presented below.
The behaviour of the cohesive element is characterized in terms of the relative displacements or displacement jumps across the interface, which are evaluated in its mid-surface. Thus, the
corresponding constitutive law relates the cohesive stresses, , to the displacement jump in
the local coordinates, , through the interface stiffness tensor, :
(1)
Employing a traditional FEA discretisation, is obtained from the displacement of the nodes
at the top and bottom surfaces using the rotation tensor , which contains the directional
cosines of the local coordinate system ( ) to the global one ( ), see Figure 1:
(2)
where is the displacement of the node “k” in the direction “i”, and is the Lagrangian shape function associated to the node “k” in the isoparametric element.
A stiffness degradation approach, using a scalar damage variable varying between 0 (i.e. an undamaged or intact element) and 1 (i.e. complete failure), has been adopted here:

11
(3)
is the undamaged stiffness tensor, is the Kronecker delta and represents the
MacAuley bracket defined as . The term ( ) is introduced to
prevent inter-penetration of the interface surfaces after complete failure. In order to guarantee
a realistic representation of the elastic response and pre-damage behaviour, the value of
must be consistent with the unstrained configuration selected for the cohesive elements. Hence, since a single layer of finite-thickness elements has been employed in the present work to represent the adhesive layer, the values of the penalty stiffness for pure modes I and
II ( and ) have been obtained from the modulus of elasticity of the adhesive in tension,
, and shear, , respectively (divided by the thickness of the unstrained configuration, ):
(4)
A bilinear cohesive law has been adopted, see Figure 2. The corresponding damage evolution law, formulated in the displacement jump space, takes the following expression:
(5)
The loading history is accounted for via a time-dependent damage threshold fulfilling the
relation ( is the initial damage threshold and t indicates the current time):
(6)
12
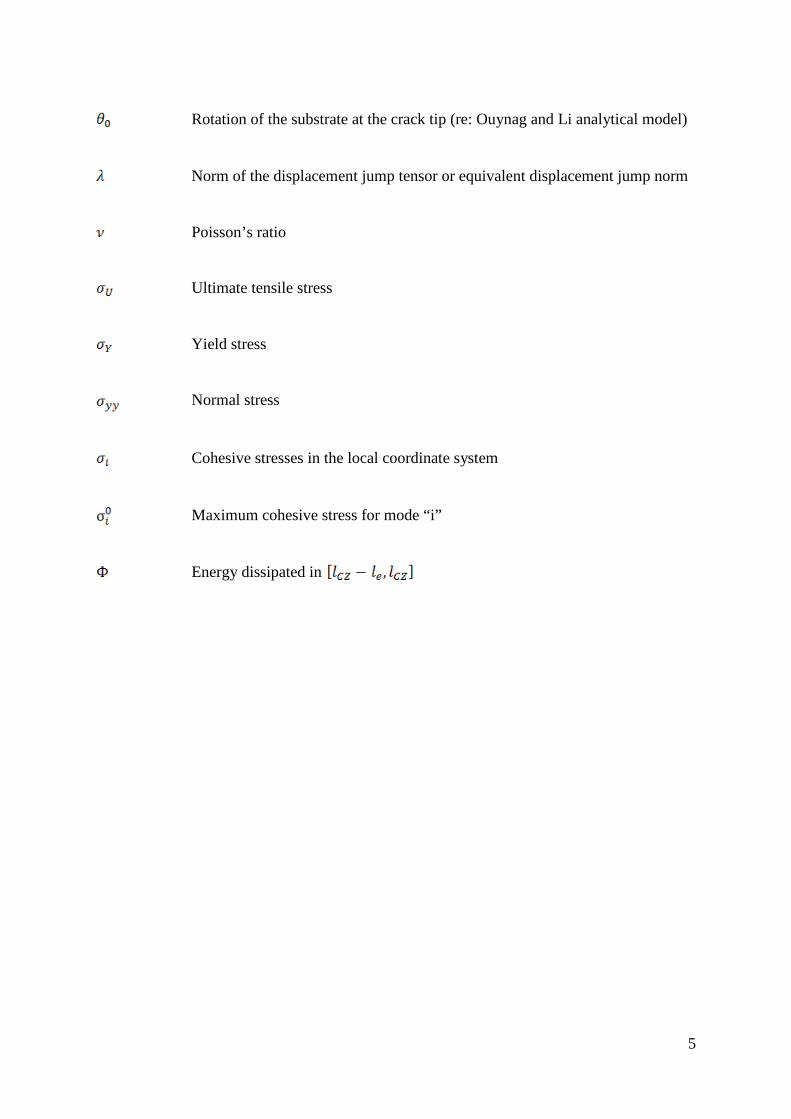
where is a displacement parameter, similar to that introduced by Tvergaard and Hutchinson [55], to evaluate the state of the displacement jump and to differentiate between loading and unloading conditions:
(7)
The onset of damage occurs at , while represents a fully damaged element ( ). The value of these parameters would generally vary with the mode mix. However, for the pure mode fracture problems studied in the present work, they can be assumed constant and equal
to the mode I values (i.e. and respectively).
Establishing an appropriate initiation criterion is difficult, mainly because the concept of damage onset could be associated with different phenomena (e.g. plastic yielding, cavitation in rubber-toughened systems, etc) depending on the type of adhesive material. In the present work the initiation of damage is assumed to be directly linked to plastic yielding in the
adhesive, hence the cohesive stress, , may be set equal to the uniaxial yield stress of the
adhesive, . Hence, for pure mode I loading:
(8)
Finally, the crack propagation criterion, which establishes that crack growth occurs when the
total energy release rate is greater or equal than a critical value , may be expressed in the
displacement jump space in order to determine the value of . In the present work this is achieved by equating the area under the cohesive law for pure mode I to the experimental
value of , resulting in:
(9)

13
It is worth noting that the constraints imposed by the substrates on the adhesive layer are indirectly included in the formulation. It has been previously shown that, for small
thicknesses of the adhesive layer confined between much stiffer substrates, the value of may be a function of the thicknesses of the adhesive layer [38, 56, 57]. However, the use of the experimentally-measured value of the adhesive fracture energy for the thickness of the adhesive layer of interest will take such effects into account. Conversely, the possible influence of the triaxial stress state near the crack tip on the yield stress and elastic moduli has been neglected, with the uniaxial values being used instead. It has been suggested by some authors [58-60] that this latter simplification could compromise the transferability of the results to other test geometries. However, including such level of detail in the present models would clash with the aim of readily simulating large and complex adhesively-bonded components, which motivated our research.
3.2 Length of the Cohesive Zone
As discussed in Section 2, the conventional approach to cope with the mesh-size dependency of cohesive elements relies on the presence of a minimum number of elements within the failure process zone, FPZ, or cohesive zone [18, 20]. Accurate predictions of the size of the cohesive zone are therefore required for mesh-design purposes, in order to estimate the critical element size which ensures convergence to the correct solution. Several authors [61-
64] have proposed theoretical expressions to estimate the cohesive zone length, , in
specimens with a crack existing through their complete width, . Most of these closed-form solutions have been derived from the analytical stress-field obtained for an infinite cracked body assuming linear-elastic behaviour. However, suitable equations for slender, orthotropic bodies loaded in mode I have been obtained using beam theory analysis, see [18, 65], such that:
(10)
where is the maximum cohesive stress, is the laminate half-thickness and details on how
to calculate , which depends on the elastic properties, width and loading conditions, are given in [66]. Nevertheless, the assumptions made to obtain these analytical solutions (e.g. neglecting the effects of the thickness of the adhesive layer and assuming constant traction in the FPZ) make their applicability to adhesive joint problems questionable.

14
In an attempt to overcome these limitations, the element formulation employed in the present paper incorporates an algorithm to compute the numerical cohesive zone length,
, at the end of each time increment. According to Harper and Hallet [18],
corresponds to the distance ahead of the numerical crack tip over which the cohesive elements lie on the softening part of the traction-separation law. From this definition, the integration points which have experienced irreversible damage (i.e. which
satisfy the condition 0 < < 1) belong to the numerical cohesive zone. The equivalent length associated with an integration point may be obtained from the total length of the deformed
mid-surface of the element and the corresponding Gauss weighting factor used in the
numerical integration (divided by two, since a Gauss-Legendre integration occurs in the interval [-1,1]). The total numerical cohesive length is then given by:
(11)
Note that, by evaluating the contribution of each integration point separately, this approach allows the consideration of a section of an element as being part of the cohesive zone.
4 MODE I FRACTURE TESTS: EXPERIMENTAL RESULTS
The mode I fracture behaviour of a structural film adhesive (AF-163-2OST from 3M, UK) has been investigated using both double-cantilever beam (DCB) and tapered double-cantilever beam (TDCB) test specimens, as shown in Figure 3. The DCB adhesively-bonded joints employed titanium alloy (Ti-6Al-4V) substrates, whilst the TDCB adhesively-bonded joints employed aluminium alloy (2014-T4) substrates. (Referred to as Ti-DCB and Al-TDCB joints, respectively, in the Figures.) Prior to bonding the titanium-alloy substrates were anodised and the aluminium-alloy substrates were etched in a chromic acid bath [56]. Two layers of the uncured film adhesive were then stacked together to manufacture the joints, using steel wires of diameter 0.4 mm to maintain a constant thickness of the adhesive layer, and the adhesive was then cured according to the manufacturer’s recommendations. As illustrated in Figure 3, each specimen incorporated an initial crack in the adhesive layer, which was formed by inserting a very thin film of poly(tetrafluoroethylene) [67]. Aluminium-alloy end-blocks were attached to the titanium-alloy substrates to apply the load, whilst the TDCB test specimens had drilled holes for the same purpose. These joints were tested under quasi-static conditions in accordance with the International Standard ISO 25217 [67] to
determine the value of the adhesive fracture energy, . In all cases, failure was via the crack

15
propagating through the adhesive layer in a stable manner. The value of was calculated using the ISO Standard ‘corrected beam theory’ (CBT) approach. The CBT approach is an analytical method which accounts for transverse shear and beam root-rotation effects through a crack-length correction-factor [67]. No significant R-curve effect was observed (i.e. the
value of was independent of the length, a, of the propagating crack) and there was no
significant effect of the type of joint or substrate employed. The average value of
obtained was , and this value has been employed in all the subsequent CZM/FEA studies. The corresponding load-displacement curves obtained in the fracture tests are discussed in Section 6.2.
5 NUMERICAL STUDIES: FINITE ELEMENT MODEL DETAILS
The performance of the cohesive-element formulation presented in Section 3 has been evaluated by modelling the static response of the DCB and TDCB fracture tests described above. Two-dimensional FEA models of these joints have been created in Abaqus v6.11, employing a single layer of finite-thickness, user-defined cohesive elements to represent the thickness of the adhesive layer. The accuracy of the numerical results has been assessed by
direct comparison with the experimental load-displacement ( ) curves and the analytical solutions corresponding to the CBT method (see Appendix A). The length of the numerical cohesive zone and the distribution of normal stresses ahead of the crack tip have also been examined. Finally, a mesh-sensitivity analysis has been performed for each configuration, investigating the potential effects of element size, order (i.e. linear or quadratic) and the
number of integration points in the cohesive elements on the overall response and the stress distribution.
Generalised plane-strain conditions, which allow uniform strain in the out-of-plane direction, were combined with isotropic, bilinear, elastic-plastic material behaviour to model the metallic substrates and end-blocks. The corresponding material property values are given in Table 1. (However, it should be noted that the metallic substrates were observed to only deform elastically during the DCB and TDCB fracture tests. This experimental observation was confirmed by the numerical simulations, which also revealed that only elastic deformation of the metallic substrates occurred during the fracture tests.) The substrates were considered to be initially bonded along the length of the symmetry plane excluding the initial pre-crack. A single layer of finite-thickness cohesive elements was used to model the thickness of the adhesive layer. Since these elements were responsible for simulating both the elastic response of the adhesive prior to the onset of damage and the fracture process, their characteristic cohesive parameters needed to be chosen accordingly. Thus, as discussed in Section 3, the penalty stiffness and the displacement at damage initiation were derived from

16
the macroscopic elastic properties of the adhesive (i.e. equations (4) and (8), respectively) and their values are given in Table 2; and the area under the traction-separation law was
equated to the average value calculated from the experimental tests described above,
namely .
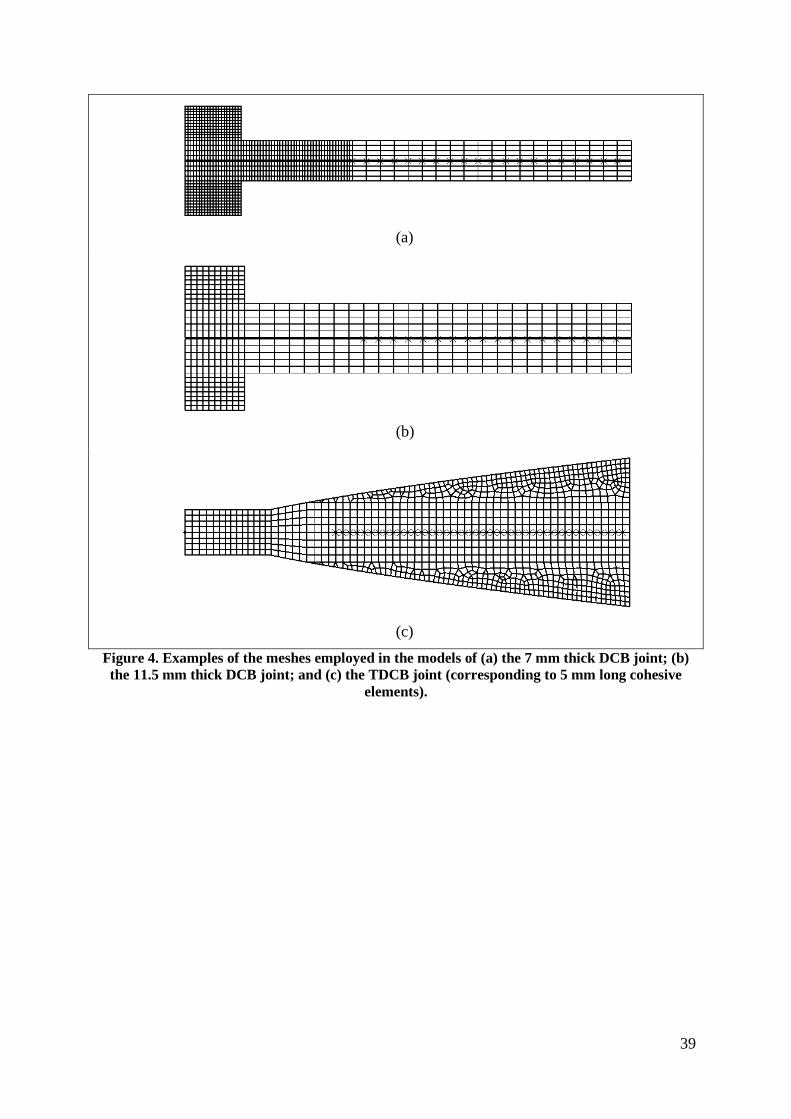
A series of structured meshes were created for each type of specimen by progressively increasing the length of the cohesive elements. The lower bound was 0.5 mm in all cases, but the maximum size depended on the configuration studied (e.g. 20 mm for the DCB with the relatively thin arms, 22.5 mm for the DCB with the thicker arms and 41 mm in the case of the TDCB). Examples of the resulting meshes are illustrated in Figure 4. Linear or quadratic cohesive elements were used for the adhesive layer, with the number of integration points varying between two and thirty in both cases. The mesh density employed in the substrates and end-blocks was adapted in each case to ensure a proper representation of bending (i.e. with a minimum of three elements through thickness) whilst maintaining suitable aspect ratios, if possible. However, since the element length in the substrates matched the element length for the cohesive elements, the mesh density in the substrates was relatively sparse for the longer cohesive elements. Fully integrated, quadrilateral elements were generally used, although a relatively small number of triangular elements were required to mesh the TDCB.
The holes used for loading were not included in the models, as their influence on the overall response of the joints was found to be negligible. The displacement and boundary conditions were prescribed at the nodes located where the centre of the holes would have been. Their horizontal displacements were constrained, with the vertical movement only restricted at the lower point. Finally, a suitable vertical displacement was applied to the centre point of the top arm. Quasi-static analyses were then carried out using Abaqus/Standard. The integration time
increment was maintained constant at , and the “NLGEOM” feature available in Abaqus, which accounts for large deformations, was activated in all the simulations. Non-linear geometry was also taken into account in the cohesive-element formulation via a suitable definition of the Jacobian.
6 NUMERICAL RESULTS
6.1 Introduction
As indicated in Section 2, it has been previously reported that the mesh density along the crack propagation path can have a significant influence on the overall fracture response of finite-element models employing cohesive elements (e.g. [17, 18, 20, 22]). This issue has been studied in depth in a mesh-sensitivity analysis performed using the various test geometries described above. The outcomes of this study, which investigated the potential effects of the size, order and number of integration points of the cohesive elements on the
17
numerical response of the models, are discussed below. The results obtained with the linear finite-element models, including a comparison with the experimental load-displacement curves and estimates of the cohesive zone length, are presented first. Then, the performance of the quadratic models is examined. Finally, the reasons for the differences in behaviour observed for both types of models are discussed in Section 7.
6.2 Linear Models: Effect of the Element Size and the Number of Integration Points on the Load-Displacement Response
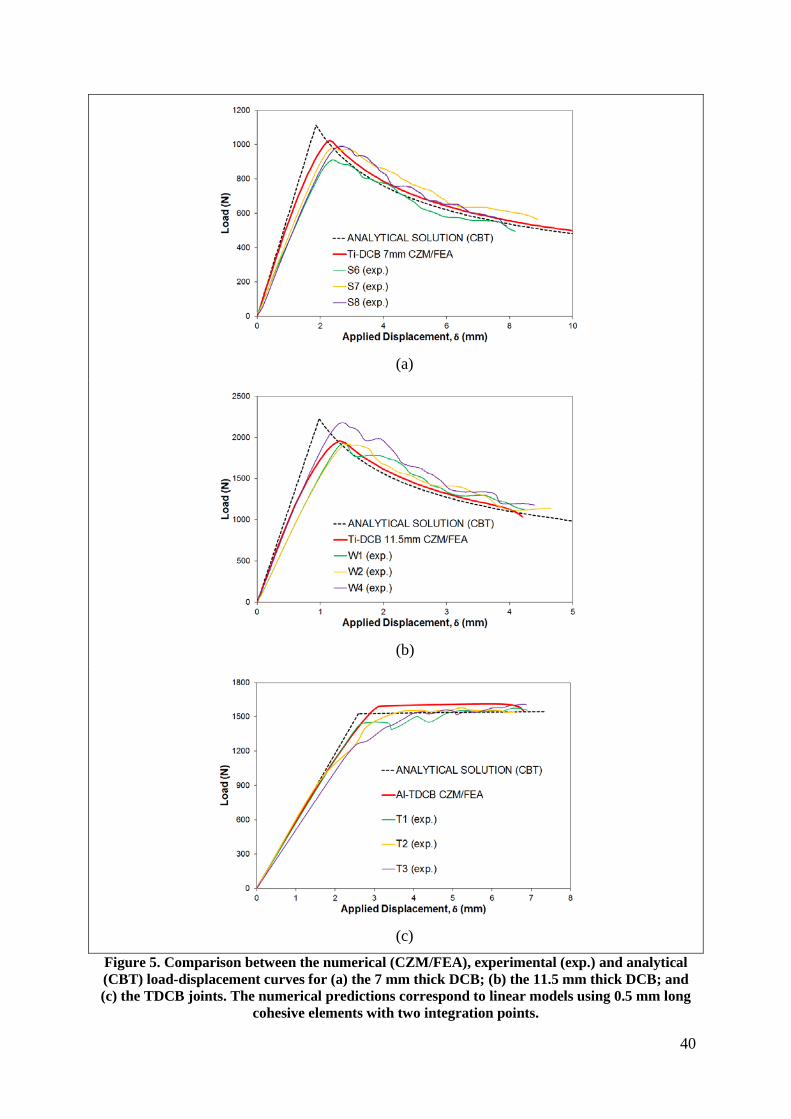
The numerical load-displacement curves (designated as ‘CZM/FEA’) obtained for the DCB and TDCB joints using 0.5 mm long linear, cohesive elements with two integration points are shown in Figure 5. The experimental traces, for which three replicate tests results are given (designated as ‘exp.’), and the analytical solution corresponding to the CBT methodology (see Appendix A) are also plotted for comparison. Several noteworthy points emerge. Firstly, the initial slope predicted by the CZM/FEA simulations is in better agreement with the experimental results than that of the analytical CBT approach. Secondly, however, the CZM/FEA approach does appear, in some cases, to overestimate somewhat the initial stiffness of the joints as measured experimentally. A possible explanation for this imperfect agreement [39] could be due to the inability of the numerical model to simulate accurately the beam root-rotation at the crack tip due an excessive compressive stiffness of the cohesive
elements. Thirdly, the numerical - traces deviated from linearity before reaching the maximum or plateau loads; i.e. in the DCB and TDCB joints, respectively. This phenomenon, which is associated with damage accumulation in the elements located near the crack tip, was in accord with the test results and, therefore, supports the chosen damage initiation criterion which is assumed to be directly linked to plastic yielding in the adhesive, see equation (8). Finally, whilst the numerical models yielded approximately 4% higher loads than the CBT
approach during crack propagation, the agreement with the experimental - curves associated with crack growth was excellent in all cases.
Figure 6 shows the load-displacement traces obtained for (a) the DCB joint with 7 mm thick substrates, (b) the DCB joint with 11.5 mm thick substrates and (c) the TDCB joint simulations, using linear cohesive elements with two integration points but for different mesh densities. Firstly, only the analytical solutions corresponding to the CBT approach have been included for comparison. (The experimental curves have been omitted for clarity but they can be compared to the CBT approach via Figure 5, of course.) As expected, the finer meshes (i.e. 0.5 or 2 mm in the thinner DCB joint, 0.5 to 5 mm in the thicker DCB joint and 0.5 to 10.25 mm in the TDCB joint) provided excellent agreement with the theoretical results. However, the accuracy attained from the numerical CZM/FEA method progressively deviated from the analytical solution as the length of the cohesive elements increased. Secondly, not only did the mesh density influence the initial linear-elastic response, but it also affected the maximum load and the propagation stage. Thirdly, it was found that the

18
relatively long cohesive elements hindered convergence. These observations, previously reported by numerous researchers, clearly demonstrate the mesh-dependency problem associated with linear cohesive elements with only two integration points, which are equivalent to those available within many commercial FEA packages, including Abaqus.
As explained in Section 3, the cohesive elements developed as part of this work allow a user-defined number of integration points. The consequences of varying the number of integration points for a given mesh density are highlighted in Figure 7. It may be clearly seen that increasing the number of integration points has resulted in relatively smooth responses and at the same time improved convergence. However, despite improving the numerical performance, it is not a substitute for mesh refinement since the ultimate solution remained unaffected and the mesh-size-dependency persisted. Indeed, similar conclusions have been reached by Alfano and Crisfield [17] and Feih [68].
Figure 8 shows the load-displacement traces obtained for the various DCB and the TDCB joints using linear cohesive elements, with thirty integration points, but with different mesh densities. It should be noted that major fluctuations sometimes appear in the propagation section of the load-displacement traces for the coarser meshes, as may be seen in Figure 8. These may be primarily attributed to abrupt changes in the system compliance induced by damage accumulation and subsequent failure of the longer cohesive elements. The thickness
of the substrates, , also appears to influence the magnitude of these fluctuations, as they are more severe and become evident earlier (e.g. for finer meshes) in the thinner specimens. In
fact, not only does the value of affect the rate of change in compliance with the crack length [69] but it also dictates the aspect ratio and, therefore, the bending properties of the continuum elements used to mesh the substrates. Consequently, given that the metallic arms were relatively thick and less compliant in the TDCB joint than in the DCB specimens, coarser meshes could be used in the former before these oscillations became apparent.
It is noteworthy that, overall, the mesh-dependency problem appeared to be less severe in the bonded TDCB joint specimen when compared to the DCB joints. That is, larger cohesive elements could be used to mesh the TDCB joint before the simulation converged to an incorrect solution. For example, while 8.33 mm cohesive elements were clearly too long in the 7 mm DCB case, in that the model yielded a completely different solution compared to that obtained with 0.5 mm elements, reasonable agreement was achieved in the TDCB joint with elements as long as 10.25 mm. As explained in more detail in Section 7, this behaviour was partly related to the limited ability of linear continuum elements to reproduce the profile of the deformed substrates. The arms in the TDCB joint, being thicker and less compliant than in the DCB joints, exhibited a lower curvature and therefore could be accurately modelled using coarser meshes. The same rationale explains why slightly coarser meshes could be successfully employed in the thicker DCB specimen, i.e. 5 mm elements were suitable in relatively thick DCB joint, but produced rather poor results when used in the thinner DCB joint.

19
6.3 Quadratic Models: Effect of the Element Size and the Number of Integration Points on the Load-Displacement Response
Equivalent simulations to those described in Section 6.2 were run using quadratic elements. Figure 9, corresponding to thirty integration points, shows that the various mesh densities tested using the quadratic elements always converged to the same solution. Even the load-displacement traces obtained with extremely long cohesive elements (i.e. 10-20 mm in the DCB joints or 20-41 mm in the TDCB joints) were in excellent agreement with the theoretical results. These element sizes are very much larger than those previously reported in the literature. Although the relatively low value of the maximum cohesive stress used in the present work (i.e. 36MPa) might have somewhat alleviated the mesh-dependency [17, 20], the improvement over the linear formulation is truly remarkable.
The effects of the number of integration points used in the quadratic model were analogous to those described for the linear models, namely increasing the number of integration points smoothed the response and improved the numerical efficiency but without changing the nature of the ultimate solution, see Figure 10. In view of this, it must be concluded that the apparent mesh-size independent response exhibited by the quadratic models was not solely a result of an increase in the number of integration points. Nevertheless, despite the clearly
improved performance of the quadratic models, spurious oscillations appear in the - traces when extremely coarse meshes were employed in the CZM/FEA model. These spurious oscillations were induced by the resulting poor mesh quality used in the substrates. This conclusion is reinforced by the observation that these numerical instabilities were more important in the DCB joints, particularly for the joint prepared using the thinner substrates which has a relatively high compliance. It should be noted that the severity of these undulations could be partially mitigated by increasing the number of integration points, with the resulting numerical models still tending to the correct solution.
7 DISCUSSION
7.1 Introduction
The mesh-size dependency exhibited when using cohesive elements has been traditionally attributed to their inability to reproduce the steep gradients of the stress and displacement fields in the region immediately ahead of the crack tip. Many researchers agree that this issue can be readily overcome by ensuring a minimum number of cohesive elements within the process zone. Despite the minimum number of elements necessary not yet being well-established, the general consensus is that between two to five elements should be sufficient to guarantee convergence to the correct solution (e.g. [20, 46]). This section critically re-examines this suggestion in the light of the results obtained with the CZM approach employed in the present work.
20
7.2 The Cohesive Zone Length and the Distribution of Normal Stresses ahead of the Crack-Tip
Figure 11 illustrates the variation of the numerically predicted values of the cohesive zone length, which were computed according to the method described in Section 3.2, as a function of the applied displacement for the DCB and TDCB joints. (This is conceptually equivalent
to the variation of with the crack length, as the applied displacement and crack tip
position are linked via .). The analytical estimates obtained using equation (10) have also been included for comparison. The results shown in Figure 11 correspond to quadratic models using 0.5 mm cohesive elements with thirty integration points but it should be noted that linear models with sufficiently refined meshes do produce equivalent results. (Indeed, as observed for the predicted load-displacement traces, whilst the quadratic models produced a mesh-size independent solution, the numerical estimates of the cohesive zone length obtained with the linear models varied with the mesh density.).
Turning to the results shown in Figure 11, the lengths of the cohesive zone predicted by the numerical CZM/FEA approach initially increased with the applied displacement until the
value of the adhesive fracture energy, , was reached. At this point, the FPZ was fully developed and the crack and damage zone propagated together. In the TDCB specimen, see
Figure 11b, the value of continued to increase with the applied displacement due to the profile of the substrates. On the other hand, for the DCB model a very small reduction in the
value of is predicted as the crack propagated. This result for the DCB joint conflicts with the constant values predicted analytically. However, it is in accordance with the findings of Suo et al. [70]. Working with the J-integral approach, Suo et al. concluded that no self-similar propagation of the damage strip, i.e. no steady-state propagation, is expected in the DCB joint specimen loaded with wedge forces. Notwithstanding, they showed that the
variation of with the crack length would be negligible if the ratio is sufficiently large.
The values of deduced from the CZM/FEA numerical model were notably smaller than those derived from equation (10). Harper and Hallett [18] have also observed the apparent over-predictions obtained with the closed-form analytical solution, and have suggested a correction factor in order to ensure conservative estimates for mesh design purposes.
However, regardless of whether the analytical or FEA method is considered, the thickness of
the substrates, , obviously play a major role in determining the length of the cohesive zone. This arises from the local degree of curvature of the substrates in the near tip region influencing the stresses imposed on the adhesive layer, which then affects the size of the FPZ.

21
The local curvature is a function of . For example, the higher bending stiffness of the relatively thick metallic beams implies a lower degree of curvature and therefore a longer
distance between the points where the local opening displacements are equal to and ,
i.e. the points that define the value of .
Taking into account the previous values of and the results presented in Section 6.3, see Figure 9, it is evident that convergence to the correct solution could be achieved with quadratic cohesive elements longer than the corresponding cohesive zone lengths. For example, as shown in Figure 9a, an accurate load-deflection response was obtained for the
thinner DCB joint using 12.5 mm long elements when was approximately 10 mm in value. Similarly, the numerical model of the TDCB joint employing 41 mm quadratic elements yielded a satisfactory solution despite the cohesive zone length varying between 20 and 28 mm. Overall, it is suggested that these results call into question the traditional view of mesh-size dependency. Namely, the requirement of a minimum number of cohesive elements within the FPZ becomes unnecessary when using the quadratic formulation proposed in the present work.
The superiority of the quadratic models is very evident when it comes to reproducing the normal stresses along the adhesive layer, see Figure 12. During crack propagation, the distribution of normal stresses ahead of the crack tip exhibited a first region where the stress
increased from zero to , followed by an elastic region featuring a sudden drop as predicted by the classical beam solution. As demonstrated in Figure 12a for the thinner DCB joint, relatively small and intermediate linear cohesive elements captured the stress distribution within the numerical cohesive zone reasonably well. However, they had difficulties capturing accurately the abrupt drop and the compressive region of the stress distribution when relatively long elements were employed. In contrast, the quadratic elements always captured these stress gradients accurately and, despite predicting rather high compression for the very coarse meshes, they rapidly converged to the same solution far away from the crack tip.

22
7.3 Reasons for the Superiority of the Quadratic FEA Model
7.3.1 Response of the continuum elements: Simulation of the deformed shape of the substrates
There are two main reasons for the mesh-size independent behaviour exhibited by the quadratic CZM/FEA models for the fracture of the adhesively-bonded joints. The first reason is that the quadratic, continuum elements used to mesh the substrates can simulate their deformed shape far more accurately than their linear counterparts. This is important since the deformed profile of the metallic substrates defines the separation of the two beams and therefore the opening displacements. Thus, the deformed profile of the metallic substrates plays a major role in defining the damage state of the cohesive elements and in the value of the energy that they dissipate. Now, as illustrated in Figure 13 which corresponds to the thinner DCB joint specimen, the deformed profile of the metallic arms predicted by the quadratic models (Figure 13b) is completely independent of the mesh density along the crack path. In contrast, the solution obtained using the linear models (Figure 13a) varies with the element size, deviating from the curve obtained in the quadratic case as the mesh becomes coarser. It should be noted that, since the bending stiffness and therefore the radius of
curvature, , of the substrates increase with their thickness, , the difference between the linear and quadratic models for a given mesh density becomes less significant as the value of
is increased, i.e. as the arms of the DCB joint are made thicker.
7.3.2 Response of the cohesive elements: The energy dissipated in the FPZ due to damage
The second reason for the mesh-size independent behaviour of the quadratic models is directly linked to the response of the cohesive elements and arises specifically from the superior ability of the quadratic formulation to compute the energy dissipated due to damage accumulation. Essentially, due to the presence of the central nodes in both the top and bottom surfaces, the quadratic cohesive elements can conform to the deformed shape of the substrates and so define the opening displacement far more accurately than the linear elements. This translates into a more accurate calculation of the local damage state, and thus
of the dissipated energy, . This issue has been explored further using the analytical model proposed by Ouyang and Li [71]. Following a natural boundary condition method, Ouyang and Li [71] derived a solution for the deformation of the substrates in a DCB specimen
assuming a bilinear cohesive law. According to their work, the local displacement, , of the upper substrate ahead of the crack tip during propagation is given by:

23
(12)
where , and is the distance to the
crack tip. The coefficients and the critical lengths and depend on the crack length, ,
the thickness, , and the modulus, , of the substrates and the cohesive law parameters
( , and ). The coefficients, , may be expressed as functions of the remote load, , which is then determined by imposing an intrinsic geometric constraint, see Appendix B.
This solution has been used to compute the energy per unit width, , dissipated in a
section of the FPZ, corresponding to , developed in an adhesively-bonded DCB joint:
(13)
The analytical result has been compared with the estimates obtained with a single cohesive
element, linear or quadratic, spanning over the same length, . The approximation of the
deformed profile of the upper DCB substrate in the region of interest (i.e. ) using the linear cohesive element is schematically illustrated in Figure 14. Symmetry conditions are assumed for pure mode I fracture, omitting the top surface of the quadratic element for clarity.
As shown in Figure 15a, which corresponds to a crack length of 100 mm, the linear cohesive-
element formulation overestimates the dissipated energy for small values of . Indeed, the disagreement with the analytical solution is particularly pronounced for the longer elements. However, since the accuracy of the first-order approximation of the opening displacement improves as the curvature of the deformed metallic beams decreases, the error becomes less significant for the thicker substrates. In contrast, the quadratic cohesive element approach

24
yields excellent results regardless of the values of or . Indeed, as may be seen in
Figure 15b, accurate estimates of are obtained even when the entire FPZ is considered
(i.e. ).
7.4 Effects on the Simulation Time and Industrial Implications
The superior response of the quadratic models highlighted in the present paper could lead to a dramatic increase in the industrial application of the CZM approach. In the simulation of large adhesively-bonded structures, time constraints and limited resources often impose a restriction to the smallest element size acceptable from a computational standpoint. This lower limit is typically incompatible with the critical size of the cohesive elements if a traditional linear formulation is employed. In contrast, many of these problems might be readily overcome using a quadratic model, due to their apparent mesh-size independent behaviour. Furthermore, as discussed below, the quadratic models also offer an additional advantage with regards to the simulation time, making them particularly attractive for the analysis of large components.
Certainly, shifting from first- to second-order discretisation schemes increases the total number of degrees of freedom (i.e. ‘dof’). However, the possibility of predicting the correct solution employing far longer quadratic elements enables the use of significantly coarser meshes, reducing the overall size of the models and hence resulting in faster simulations. This is highlighted in Figure 16 which shows the variation of the CPU time with the length of the cohesive elements for both the linear and quadratic models of the DCB joint, prepared using the relatively thin substrate arms. (Only the results corresponding to two integration points have been included for the linear cases, as these correspond to the only cohesive formulation currently available in most commercial FEA codes.). All the simulations were run using a single CPU (i.e. an Intel® Xeon® E5-1660).
As expected, the linear models run faster than their quadratic counterparts. However, for element lengths greater than 2 mm they yielded incorrect solutions, see Figure 6a. On the
other hand, the CPU times for the coarser quadratic meshes (i.e. ≥ 5 mm), which successfully predict the overall response of the joint, were below the times corresponding to the linear model employing 2 mm long cohesive elements (i.e. the dashed line). With regards to the effects of the integration points, whilst increasing their number results in longer simulation times, particularly for the finer meshes, this option remains a more efficient technique to obtain smooth responses compared to mesh refinement techniques. (It should be noted that the total number of operations required to build the system matrix escalates with the number of elements multiplied by number of integration points.) Nevertheless, the optimum number should be selected on a case-by-case basis taking into account the obvious trade-off between the smoothness of the numerical solution and the computational burden.

25
In the light of these reported results it is somewhat surprising that, despite their considerable advantages, very few commercial FEA codes currently offer quadratic cohesive elements. As discussed above, the possibility of using coarser meshes would reduce the simulation time and facilitate the industrial application of the CZM approach for the analysis of large bonded structures. However, the required mesh-size independent response is only achieved if a fully quadratic discretisation is employed. Indeed, ‘hybrid’ models, i.e. blends of linear and quadratic elements in the same mesh, do not produce the same benefits. For example, consider a DCB joint in which the substrates are meshed with quadratic continuum elements and the adhesive layer is modelled using a linear cohesive-element formulation, i.e. a ‘hybrid’ model is employed. Then, leaving aside the obvious incompatibility along the interfaces which must be addressed by imposing additional constraints, the energy dissipated in the FPZ is overestimated even though the deformed shape of the substrates is accurately reproduced, see Figure 17. Worse still, the mesh-size effects reported for the linear models persist if linear continuum and quadratic cohesive elements are combined, given that the additional information provided by the mid-nodes of the cohesive elements becomes redundant when their top and bottom surfaces are forced to describe a straight line.
8 CONCLUSIONS
The present paper investigates the origins of the stringent mesh-size requirements traditionally associated with the use of the Cohesive Zone Model (CZM) to simulate fracture. A two-dimensional cohesive-element formulation to model crack initiation and growth in adhesively-bonded joints has been proposed. Derived from the work of Camanho and co-workers, the constitutive equations have been optimised for a finite-thickness unstrained configuration, while the topology has been modified to allow quadratic (i.e. second-order) kinematics and a user-defined number of integration points. The resulting formulation has been implemented in Abaqus as a user-element subroutine (UEL).
The mode I fracture behaviour of a structural epoxy-film adhesive has been investigated using both double-cantilever beam (DCB) and tapered double-cantilever beam (TDCB) test specimens. The DCB adhesively-bonded joints employed titanium-alloy substrates of various thicknesses, whilst the TDCB adhesively-bonded joints employed aluminium-alloy substrates. The joints were tested quasi-statically, failing in all cases by the crack propagating cohesively through the adhesive layer. The values of the mode I adhesive fracture energy,
, were ascertained in accordance with the International Standard ISO 25217. Finite-element models of these joints have been created, employing a CZM approach to simulate their fracture response. A single layer of user-defined cohesive elements has been used to model the thickness of the adhesive layer. In the CZM studies the penalty stiffness and the displacement at damage initiation have been derived from the macroscopic elastic properties of the bulk adhesive, whilst the area under the traction-separation law has been equated to the
experimentally-determined value of .
26
A mesh-sensitivity analysis has been undertaken for the various test geometries investigated using a series of meshes created by progressively increasing the length of the cohesive elements. The effects of the order of the discretisation (i.e. linear or quadratic), the mesh density and the number of integration points defined in the cohesive elements have been evaluated. This study has shown that, for sufficiently fine meshes (i.e. between three and five cohesive elements within the numerical failure process zone, FPZ), the load-displacement curves obtained with the linear models are in excellent agreement with the experimental results and the analytical solution corresponding to the corrected beam theory (CBT). However, the numerical predictions yielded by the linear models gradually deviate from the correct solution as the length of the cohesive elements increases. In contrast, the results obtained with the quadratic models have been found to be completely independent of the length of the cohesive elements. The apparent mesh-size independent response exhibited by the quadratic model is a consequence of the superior performance of both the quadratic cohesive-element formulation and the quadratic continuum elements used to mesh the substrates. Whilst the latter are better than their linear counterparts when it comes to reproducing the deformed profile of the substrates, the important aspect is that the quadratic cohesive elements offer a far more accurate estimate of the energy dissipated in the FPZ due to damage. It is noteworthy that the advantages of the quadratic model compared with the equivalent linear models are particularly significant for relatively thin substrates, because of the higher degree of curvature of the deformed substrates at the crack tip when employing thin substrates.
Finally, the quadratic cohesive-element formulation presented in the present paper enables the use of far coarser meshes, resulting in significantly shorter simulation times, which in turn should permit an increase in the industrial applications of the CZM approach.
9 ACKNOWLEDGEMENTS
The authors would like to thank Rolls Royce plc for their financial support.
27
10 REFERENCES
1. DA SILVA, L.F.M. and R.D. ADAMS, Techniques to reduce the peel stresses in adhesive joints with composites. International Journal of Adhesion & Adhesives, 2007. 27: p. 227-235.
2. BIGWOOD, D.A. and A.D. CROCOMBE, Non-linear adhesive bonded joint design analyses. International Journal of Adhesion & Adhesives, 1990. 10: p. 31-41.
3. CROCOMBE, A.D. and D.A. BIGWOOD, Development of a full elasto-plastic adhesive joint design. Journal of Strain Analysis for Engineering Design, 1992. 27: p. 211-218.
4. RISPLER, A.R., L. TONG, G.P. STEVEN, and M.R. WISNOM, Shape optimisation of adhesive fillets. International Journal of Adhesion & Adhesives, 2000. 20: p. 221-231.
5. CHOUPANI, N., Mixed-mode cohesive fracture of adhesive joints: Experimental and numerical studies. Engineering Fracture Mechanics, 2008. 75: p. 4363-4382.
6. MOSTOVOY, S. and E.J. RIPLING, Fracture Toughness of an Epoxy System. Journal of Applied Polymer Science, 1966. 10: p. 1351-1371.
7. ANDERSON, G.P., S.H. BRINTON, K.J. NINOW, and K.L. DE VIRES. A fracture mechanics approach to predicting bond strength in Advances in adhesively bonded joints; Proceedings of the Symposium, ASME Winter Annual Meeting. 1988. Chicago, Illinois.
8. FERNLUND, G., M. PAPINI, D. McCAMMOND, and J.K. SPELT, Fracture load predictions for adhesive joints. Composites Science and Technology, 1994. 51: p. 587-600.
9. RIPLING, E.J., S. MOSTOVOY, and R.L. PATRICK, Measuring fracture toughness of adhesive joints. Materials Research and Standards (ASTM Bulletin), 1964. 4: p. 129-134.
10. MOSTOVOY, S., P.B. CROSLEY, and E.J. RIPLING, Use of crack-line loaded specimens for measuring plane-strain fracture toughness. Journal of Materials, 1967. 2(3): p. 661-681.
11. CHAI, H. and M.Y.M. CHIANG, A crack propagation criterion based on local shear in adhesive bonds subjected to shear. Journal of Mechanics and Physics of Solids, 1996. 44: p. 1669-1689.
12. PAPINI, M., G. FERNLUND, and J.K. SPELT, The effect of geometry on the fracture of adhesive joints. International Journal of Adhesion & Adhesives, 1994. 14: p. 5-13.

28
13. KINLOCH, A.J., Adhesives in engineering. Proceedings of the Institution of Mechanical Engineers Part G - Journal of Aerospace Engineering, 1997. 211: p. 307 - 335.
14. JETHWA, J.K. and A.J. KINLOCH, The Fatigue and Durability Behaviour of Automotive Adhesives. Part I: Fracture Mechanics Tests The Journal of Adhesion, 1997. 61(1-4): p. 71-95.
15. CURLEY, A.J., J.K. JETHWA, A.J. KINLOCH, and A.C. TAYLOR, The Fatigue and Durability Behaviour of Automotive Adhesives. Part III: Predicting the Service Life The Journal of Adhesion, 1998. 66(1-4): p. 39-59.
16. ABEL, M.L., A.N.N. ADAMS, A.J. KINLOCH, S.J. SHAW, and J.F. WATTS, The effects of surface pretreatment on the cyclic-fatigue characteristics of bonded aluminium-alloy joints. International Journal of Adhesion & Adhesives, 2006. 26: p. 50–61.
17. ALFANO, G. and M.A. CRISFIELD, Finite element interface models for the delamination analysis of laminated composites: mechanical and computational issues. International Journal for Numerical Methods in Engineering, 2001. 50: p. 1701-1736.
18. HARPER, P.W. and S.R. HALLETT, Cohesive zone length in numerical simulations of composite delamination. Engineering Fracture Mechanics, 2008. 75: p. 4774–4792.
19. KAFKALIDIS, M.S. and M.D. THOULESS, The effects of geometry and material properties on the fracture of single lap-shear joints. International Journal of Solids and Structures, 2002. 39: p. 4367-4383.
20. TURON, A., C.G. DAVILA, P.P. CAMANHO, and J. COSTA, An engineering solution for mesh size effects in the simulation of delamination using cohesive zone models. Engineering Fracture Mechanics, 2007. 74: p. 1665–1682.
21. GAO, Y.F. and A.F. BOWER, A simple technique for avoiding convergence problems in finite element simulations of crack nucleation and growth on cohesive interfaces. Modelling and Simulation in Materials Science and Engineering, 2004. 12: p. 453–463.
22. GUIAMATSIA, I., J.K. ANKERSEN, G.A.O. DAVIES, and L. IANNUCCI, Decohesion finite element with enriched basis functions for delamination. Composites Science and Technology, 2009. 69: p. 2616–2624.
23. CAMANHO, P.P., C.G. DAVILA, and M.F.S.F. MOURA, Numerical Simulation of Mixed-mode Progressive Delamination in Composite Materials. Journal of Composite Materials, 2003. 37(16).
24. TURON, A., P.P. CAMANHO, J. COSTA, and C.G. DAVILA, A damage model for the simulation of delamination in advanced composites under variable-mode loading. Mechanics of Materials, 2006. 38: p. 1072-1089.

29
25. MARTINY, P.H., F. LANI, A.J. KINLOCH, and T. PARDOEN, Numerical analysis of the energy contributions in peel tests: A steady-state multilevel finite element approach. International Journal of Adhesion & Adhesives, 2008. 28: p. 222–236.
26. LI, S., M.D. THOULESS, A.M. WAAS, J.A. SCHROEDER, and P.D. ZAVATTIERI, Mixed-mode cohesive-zone models for fracture of an adhesively bonded polymer–matrix composite. Engineering Fracture Mechanics, 2006. 73: p. 64–78.
27. MOURA, M.F.S.F., R.D.S.G. CAMPILHO, and J.P.M. GONCALVES, Mixed-Mode Cohesive Damage Model Applied to the Simulation of the Mechanical Behaviour of Laminated Composite Adhesive Joints. Journal of Adhesion Science and Technology, 2009. 23: p. 1477-1491.
28. BLACKMAN, B.R.K., H. HADAVINIA, A.J. KINLOCH, and J.G. WILLIAMS, The use of a cohesive zone model to study the fracture of fibre composites and adhesively-bonded joints. International Journal of Fracture, 2003. 119: p. 25-46.
29. BOSCH, M.J., P.J.G. SCHREURS, and M.G.D. GEERS, An improved description of the exponential Xu and Needleman cohesive zone law for mixed-mode decohesion. Engineering Fracture Mechanics, 2006. 73: p. 1220-1234.
30. PINHO, S.T., L. IANNUCCI, and P. ROBINSON, Formulation and implementation of decohesion elements in an explicit finite element code. Composites Part A: Applied Science and Manufacturing, 2006. 37(5): p. 778-789.
31. WILLIAMS, J.G. and H. HADAVINIA, Analytical solutions of cohesive zone models. Journal of Mechanics and Physics of Solids, 2002. 50: p. 809-825.
32. BLACKMAN, B.R.K., H. HADAVINIA, A.J. KINLOCH, M. PARASCHI, and J.G. WILLIAMS, The calculation of adhesive fracture energies in mode I: revisiting the tapered double cantilever beam (TDCB) test. Engineering Fracture Mechanics, 2003. 70: p. 233–248.
33. MURPHY, N. and A. IVANKOVIC, The prediction of dynamic fracture evolution in PMMA using a cohesive zone model. Engineering Fracture Mechanics, 2005. 72: p. 861-875.
34. SCHEIDER, I., Micromechanical based derivation of traction-separation laws for cohesive model simulations. Procedia Engineering, 2009. 1: p. 17-21.
35. SMITH, E., The effect of the stress-relative displacement law on failure predictions using the cohesive zone model. International Journal of Fracture, 1999. 99(1-2): p. 41-51.
36. SHET, C. and N. CHANDRA, Effect of the Shape of T-δ Cohesive Zone Curves on the Fracture Response. Mechanics of Advanced Materials and Structures, 2004. 11: p. 249-275.
37. KAFKALIDIS, M.S., M.D. THOULESS, Q.D. YANG, and S.M. WARD, Deformation and fracture of adhesive layers constrained by plastically-deforming
30
adherends. Journal of Adhesion Science and Technology, 2000. 14(13): p. 1593-1607.
38. MARTINY, P.H., F. LANI, A.J. KINLOCH, and T. PARDOEN, A multiscale parametric study of mode I fracture in metal-to-metal low-toughness adhesive joints. International Journal of Fracture, 2012. 173: p. 105-133.
39. BRETT, M., Prediction of the Performance of Adhesively-Bonded Composite Joints, in Mechanical Engineering Department2011, Imperial College London: London.
40. KARAC, A., B.R.K. BLACKMAN, V. COOPER, A.J. KINLOCH, F.S. RODRIGUEZ-SANCHEZ, W.S. TEO, and A. IVANKOVIC, Modelling the fracture behaviour of adhesively-bonded joints as a function of test rate. Engineering Fracture Mechanics, 2011. 78(6): p. 973-989.
41. TABAKOVIC, A., A. KARAC, A. IVANKOVIC, A. GIBNEY, C. MCNALLY, and M.D. GILCHRIST, Modelling the quasi-static behaviour of bituminous material using a cohesive zone model. Engineering Fracture Mechanics, 2010. 77(13): p. 2403-2418.
42. WIMMER, G., C. SCHUECKER, and H.E. PETTERMANN, Numerical simulation of delamination in laminated composite components – A combination of a strength criterion and fracture mechanics. Composites: Part B, 2009. 40: p. 158-165.
43. MOURA, M.F.S.F., M.V.C. FERNANDEZ, A.B.d. MORAIS, and R.D.S.G. CAMPILHO, Numerical analysis of the Edge Crack Torsion test for mode III interlaminar fracture of composite laminates. Engineering Fracture Mechanics, 2008.
44. HÖGBERG, J.L., Mixed mode cohesive law International Journal of Fracture, 2006. 141: p. 549-559.
45. GUIAMATSIA, I., G.A.O. DAVIES, J.K. ANKERSEN, and L. IANNUCCI, A framework for cohesive element enrichment. Composite Structures, 2010. 92: p. 454–459.
46. FALK, F.L., A. NEEDLEMAN, and J.R. RICE, A critical evaluation of cohesive zone models of dynamic fracture. Journal de Physique IV, 2001: p. 543-550.
47. MOES, N. and T. BELYTSCHKO, Extended finite element method for cohesive crack growth. Engineering Fracture Mechanics, 2002. 69(7): p. 813-833
48. CARPINTERI, A., P. CORNETTI, F. BARPI, and F. VALENTE, Cohesive crack model description of ductile to brittle size-scale transition: dimensional analysis vs. renormalization group theory. Engineering Fracture Mechanics, 2003. 70: p. 1809–1839.
49. MI, Y., M.A. CRISFIELD, and G.A.O. DAVIES, Progressive delamination using interface elements. Journal of Composite Materials, 1998. 32: p. 1246-1272.
50. GONCALVES, J.P.M., M.F.S.F. MOURA, P.M.S.T. CASTRO, and A.T. MARQUES, Interface element including point-to-surface constraints for three-
31
dimensional problems with damage propagation. Engineering Computations, 2000. 17: p. 28-47.
51. ELMARAKBI, A.M. and H. FUKUNAGA, Finite element simulation of delamination growth in composite materials using LS-DYNA. Composite Science and Technology, 2009. 69(14): p. 2383-2391.
52. HU, N., Y. ZEMBA, H. FUKUNAGA, H.H. Wang, and A.M. ELMARAKBI, Stable numerical simulations of propagations of complex damages in composite structures under transverse loads. Composite Science and Technology, 2007. 67: p. 752-765.
53. SAMIMI, M., J.A.W. van DOMMELEN, and M.G.D. GEERS, An enriched cohesive zone model for delamination in brittle interfaces. International Journal for Numerical Methods in Engineering, 2009. 80: p. 609-630.
54. HU, N., Y. ZEMBA, T. OKABE, C. YAN, H. FUKUNAGA, and A.M. ELMARAKBI, A new cohesive model for simulating delamination propagation in composite laminates under transverse loads. Mechanics of Materials, 2008. 40: p. 920-935.
55. TVERGAARD, V. and J.W. HUTCHINSON, The relation between crack growth and resistance and fracture process parameters in elastic-plastic solids. Journal of Mechanics and Physics of Solids, 1992. 40: p. 1377-1397.
56. KINLOCH, A.J., Adhesion and Adhesives 1987, London: Chapman & Hall. 441.
57. KINLOCH, A.J. and S.J. SHAW, The Fracture-Resistance of a toughened epoxy adhesive. The Journal of Adhesion, 1981. 12: p. 59-77.
58. ANVARI, M., I. SCHEIDER, and C. THAULOW, Simulation of dynamic ductile crack growth using strain-rate and triaxiality-dependent cohesive elements. Engineering fracture Mechanics, 2006. 73: p. 2210-2228.
59. SCHEIDER, I., Derivation of separation laws for cohesive models in the course of ductile fracture. Engineering Fracture Mechanics, 2009. 76: p. 1450-1459.
60. ROY, Y.A. and R.H. DODDS, Simulation of ductile crack growth in thin aluminium panels using 3-D surface cohesive elements. International Journal of Fracture, 2001. 110: p. 21-45.
61. IRWIN, G.R. Plastic zone near a crack and fracture toughness. in Proceedings of the Seventh Sagamore Ordnance Materials Conference. 1960. New York: Syracuse University.
62. DUGDALE, D.S., Yielding of Steel sheets containing slits. Journal of Applied Mechanics, 1960. 8: p. 100-104.
63. RICE, J.R. The mechanics of earthquake rupture. in Physics of the earth's interior. Proceedings of the international school of physics "Enrico Fermi", Course 78. 1980. Amsterdam: Italian Physical Society/North-Holland.

32
64. HILLERBORG, A., M. MODEER, and P.E. PETERSON, Analysis of crack formation and growth in concrete by means of fracture mechanics and finite elements. Cement and Concrete Research, 1976. 6: p. 773-782.
65. COX, B. and Q.D. YANG, Cohesive models for damage evolution in laminated composites. International Journal of Fracture, 2005. 133: p. 107-37.
66. YANG, Q.D., B. COX, R.K. NALLA, and R.O. RITCHIE, Fracture Length scales in human cortical bone: the necessity of nonlinear fracture models. Biomaterials, 2006. 27: p. 2095-113.
67. ISO, Determination of the mode I adhesive fracture energy of structural adhesive joints using double cantilever beam and tapered double cantilever beam specimens. 2009. 25217.
68. FEIH, S., Development of a user element in ABAQUS for modelling of cohesive laws in composite structures, 2005, Risø National Laboratory: Roskilde (Denmark). p. 52.
69. HASHEMI, S., A.J. KINLOCH, and J.G. WILLIAMS, The Analysis of interlaminar fracture in uniaxial fibre-polymer composites. Proceedings of the Royal Society of London. Series A, Mathematical and Physical Sciences, 1990. 427: p. 173-199.
70. SUO, Z., G. BAO, and B. FAN, Delamination R-Curve phenomena due to damage. Journal of Mechanics and Physics of Solids, 1992. 40: p. 1-16.
71. OUYANG, Z. and G. LI, Local damage evolution of double cantilever beam specimens during crack initiaion process: A natural boundary condition based method. Journal of Applied Mechanics, 2009. 76(5).
72. BASCOM, W.D., R.L. COTTINGTON, R.L. JONES, and P. PEYSER, The fracture of epoxy- and elastomer-modified epoxy polymers in bulk and as adhesives. Journal of Applied Polymer Science, 1975. 19(9): p. 2545-2562.
73. BRUNNER, A.J., B.R.K. BLACKMAN, and J.G. WILLIAMS, Calculating a damage parameter and bridging stress from Gic delamination tests on fibre composites. Composites Science and Technology, 2006. 66: p. 785-795.
74. 3M™ Scotch-Weld™ Structural Adhesive Film AF163-2. 2009 November 2009]; Available from: http://multimedia.3m.com.

33
APPENDIX A
For a DCB test specimen with an initial crack length, , the analytical solution for the load-displacement relationship corresponding to the corrected beam theory (CBT) method is given by [67]:
(A.1)
(A.2)
where and are correction factors for large displacements and the presence of loading
end-blocks respectively (see [67]). For isotropic materials the parameter can be expressed by:
(A.3)
Similarly, for a TDCB test specimen [67] with an initial crack length :
(A.4)

34
(A.5)
where is the length of the initial straight section of the TDCB specimen and is the geometric parameter that defines its profile thereafter:
(A.6)
APPENDIX B
Following the work of Ouyang and Li [71], the coefficients used in equation (12) can be
expressed as functions of the crack length, , the thickness, width and modulus of the
substrates ( ), the cohesive parameters ( , , ) and the remote load, :
(B.1)
(B.2)
(B.3)
(B.4)
where and the coefficients are given by:

35
(B.5)
(B.6)
(B.7)
(B.8)
The remote load is determined by solving the following constraint equation:
(B.9)
Once the load is known, the critical lengths and are calculated as follows:
(B.10)
(B.11)

36
Table 1. Mechanical properties of the Ti-6Al-4V [72] and aluminium-alloy 2014-T4 substrates [73].
Ti-6Al-4V 114 1100 1170 0.0903 0.1 0.33
Al 2014-T4 72.4 290 427 0.0040 0.2 0.33
Table 2. Elastic properties and corresponding cohesive parameters for mode I for the epoxy film-adhesive (AF-163-2OST). (Values of E, ,Yσ υ obtained from [74].)
(mm)
AF-163-2OST 1.10 36 0.34 0.4 1.309E-5 1.581E-4 2.75E12 2846

37
(a)
(b)
Figure 1. Representation of (a) the linear and (b) the quadratic cohesive elements with finite thickness in the unstrained state. A zero-thickness element is adopted for the isoparametric
element used in the reference configuration in either case.
Figure 2. Schematic representation of the mode I, bilinear traction-separation law.

38
(a)
(b)
(c)
Figure 3. Nominal dimensions (in mm) of the mode I test specimens: (a) the DCB joint with 7 mm thick titanium-alloy substrates; (b) the DCB joint with 11.5 mm thick titanium-alloy
substrates; and (c) the TDCB joint with tapered aluminium-alloy substrates.
39
(a)
(b)
(c)
Figure 4. Examples of the meshes employed in the models of (a) the 7 mm thick DCB joint; (b) the 11.5 mm thick DCB joint; and (c) the TDCB joint (corresponding to 5 mm long cohesive
elements).
40
(a)
(b)
(c)
Figure 5. Comparison between the numerical (CZM/FEA), experimental (exp.) and analytical (CBT) load-displacement curves for (a) the 7 mm thick DCB; (b) the 11.5 mm thick DCB; and (c) the TDCB joints. The numerical predictions correspond to linear models using 0.5 mm long
cohesive elements with two integration points.

41
(a)
(b)
(c)
Figure 6. Load-displacement traces obtained for (a) the 7 mm DCB; (b) the 11.5 mm DCB; and (c) the TDCB joints using linear cohesive elements with two integration points and different
mesh densities.

42
Figure 7. Load-displacement traces obtained for the 7 mm DCB joint using 8.33 mm long linear
cohesive elements and different numbers of integration points.

43
(a)
(b)
(c)
Figure 8. Load-displacement traces obtained for (a) the 7 mm DCB; (b) the 11.5 mm DCB; and (c) the TDCB joints using linear cohesive elements with thirty integration points and different
mesh densities.

44
(a)
(b)
(c)
Figure 9. Load-displacement traces obtained for (a) the 7 mm DCB; (b) the 11.5 mm DCB; and (c) the TDCB joints using quadratic cohesive elements with thirty integration points and
different mesh densities.

45
Figure 10. Load-displacement traces obtained for the 7 mm DCB joint using 12.5 mm long
quadratic cohesive elements and different numbers of integration points.

46
(a)
(b)
Figure 11. Numerical cohesive zone length as a function of the applied displacement estimated from linear models of (a) the DCB and (b) the TDCB joints using 0.5 mm cohesive elements with
thirty integration points. The analytical solutions corresponding to equation (10) have been included for comparison.

47
(a)
(b)
Figure 12. Distribution of normal stresses along the adhesive layer in the 7 mm DCB joint obtained using (a) linear and (b) quadratic cohesive elements with thirty integration points for
various mesh densities (applied displacement, δ=3 mm).
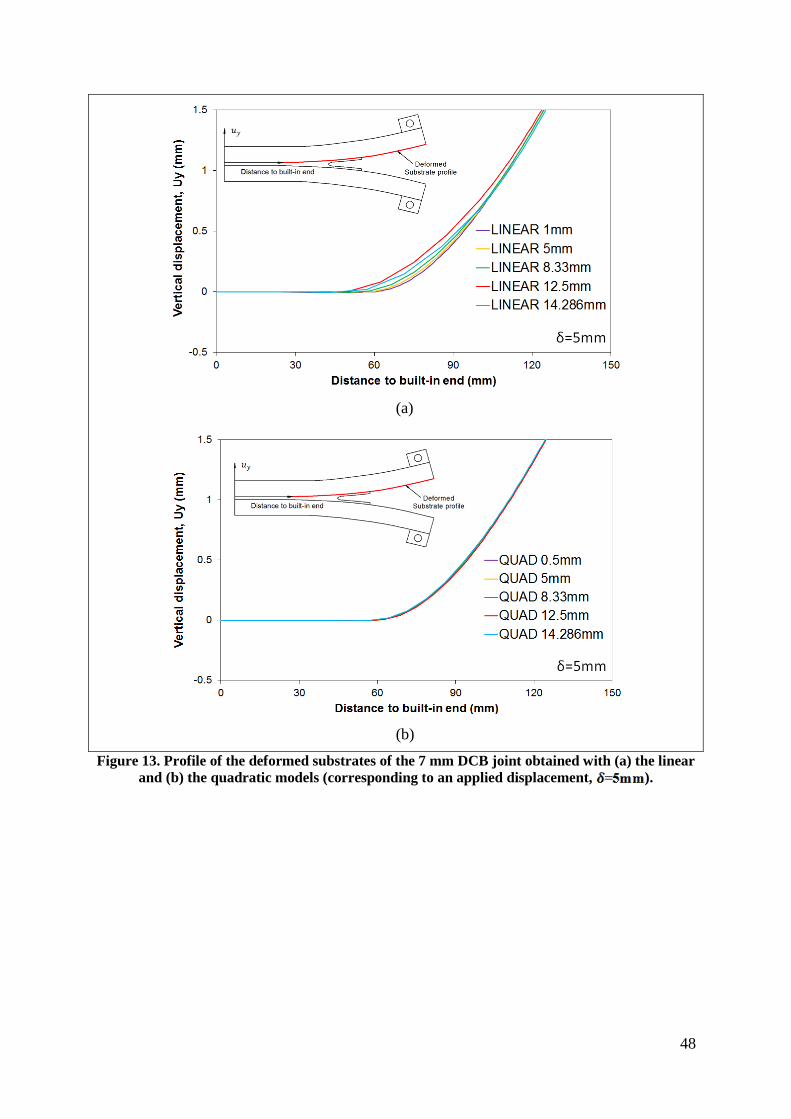
48
(a)
(b)
Figure 13. Profile of the deformed substrates of the 7 mm DCB joint obtained with (a) the linear and (b) the quadratic models (corresponding to an applied displacement, ).
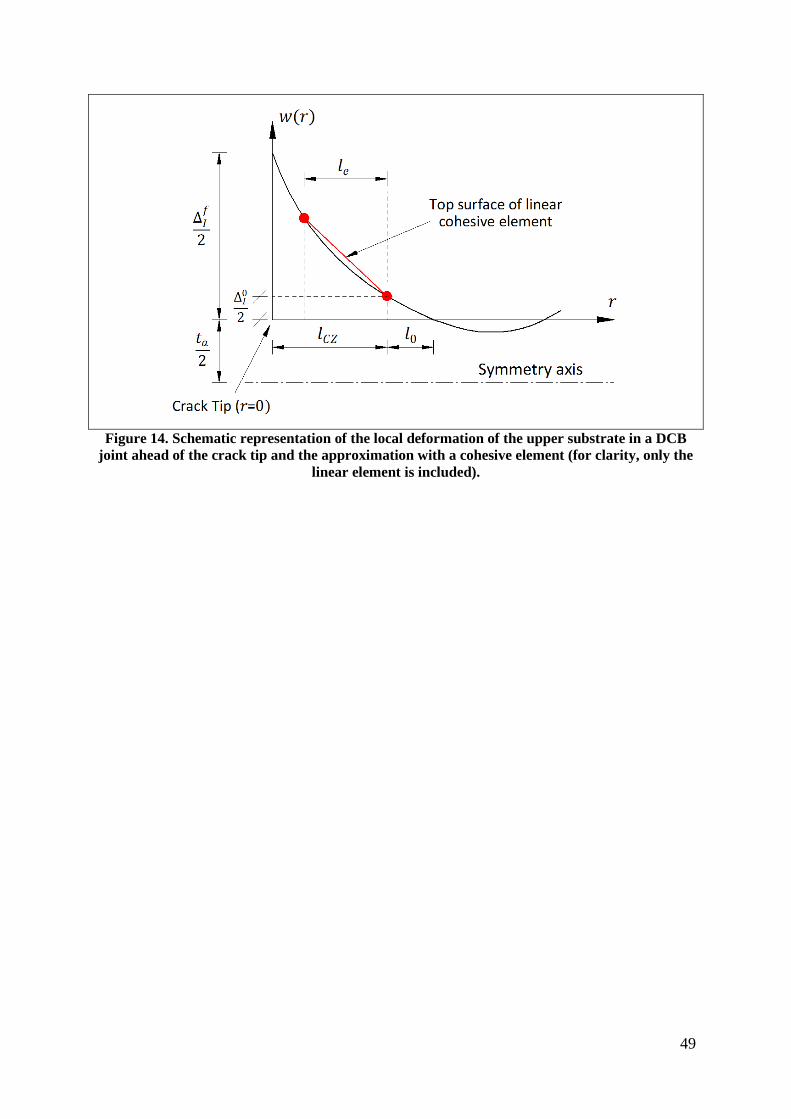
49
Figure 14. Schematic representation of the local deformation of the upper substrate in a DCB
joint ahead of the crack tip and the approximation with a cohesive element (for clarity, only the linear element is included).
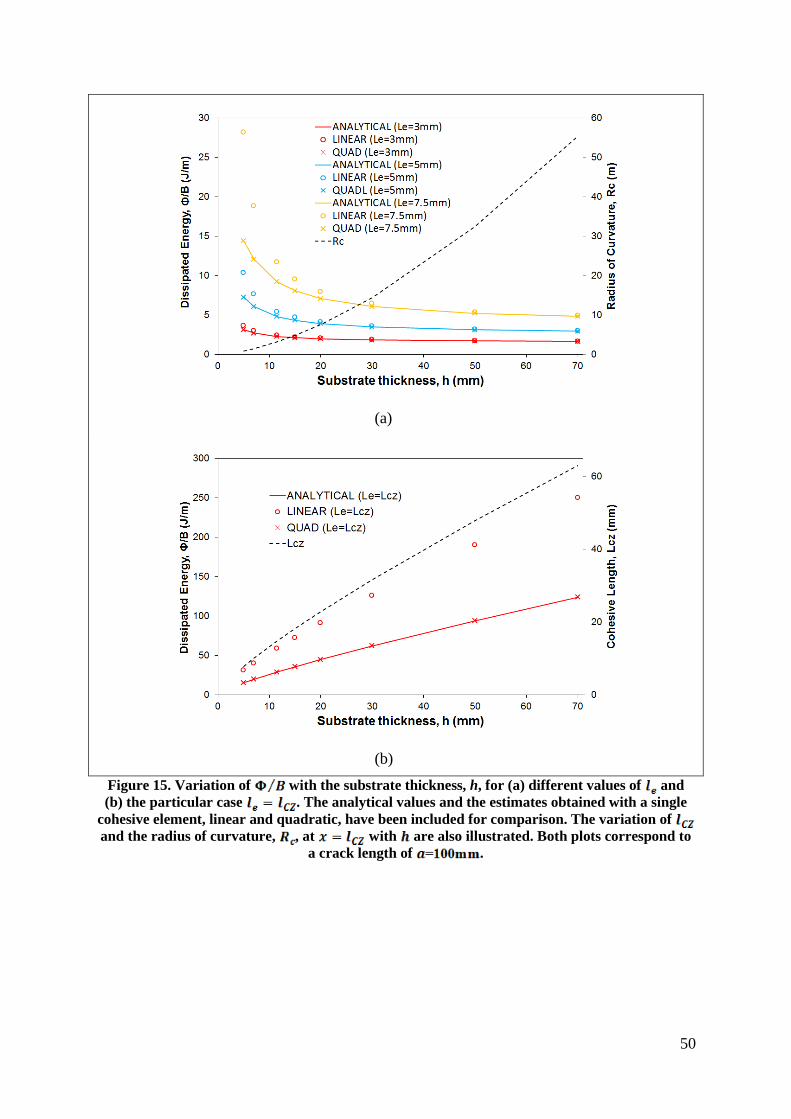
50
(a)
(b)
Figure 15. Variation of with the substrate thickness, h, for (a) different values of and (b) the particular case . The analytical values and the estimates obtained with a single
cohesive element, linear and quadratic, have been included for comparison. The variation of and the radius of curvature, , at with are also illustrated. Both plots correspond to
a crack length of .

51
Figure 16. Variation of the CPU time with the length of the cohesive elements for both the linear
and quadratic models of the DCB joint with 7 mm thick titanium-alloy substrates.
Figure 17. Load-displacement traces obtained for a DCB joint using a linear discretisation, a fully quadratic mesh and a combination of quadratic continuum and linear cohesive elements
(12.5 mm long cohesive elements with thirty integration points are employed in all cases).