Embed Size (px)
Citation preview

MODAL ANALYSIS FOR ENGINE CRANKSHAFT
MOHAMAD SAUFI BIN MOHAMAD ZAINURY
A thesis submitted in fulfillment of the
requirements for the award of the degree of
Bachelor of Mechanical Engineering with Automotive Engineering
Faculty of Mechanical Engineering
University Malaysia Pahang
NOVEMBER 2008

ii
STUDENT’S DECLARATION
I hereby declare that the work in this thesis is my own except for quotations and
summaries which have been duly acknowledged. The thesis has not been accepted
for any degree and is not concurrently submitted for award of other degree.
Signature:
Name: MOHAMAD SAUFI BIN MOHAMAD ZAINURY
ID Number: MH05011
Date:

iii
Dedicated to my beloved
parents and friends
for their support and motivation that they gave
while working on this thesis

iv
ACKNOWLEDGEMENT
First I would like to express my grateful to ALLAH S.W.T. as for the
blessing given that I can complete my final year project.
In preparing this paper, I have engaged with many people in helping me
completing this project. First, I wish to express my sincere appreciation to my main
thesis supervisor Mr Mohd Shahrir Bin Mohd Sani, for encouragement, guidance,
advices and motivation. Without his continued support and interest, this thesis would
not have been the same as presented here
The next category people who help me to grow further and influence in my
project are my colleagues who always help me in order to finish this project. I really
appreciate the idea and information given.
Last but not least, I acknowledge without endless love and relentless support
from my family, especially my aunt and my grandparents. To my parents and friends,
you all have given me the inspirations and encouragement until these days.
Thank you.

v
ABSTRACT
Crankshaft is a fundamental and a very crucial part in internal combustion
engine. Its role as the main translational-rotational converter have been used and
perfected as early as 1226 by Al-Jazari in his water pump machines. This paper
consists of finding the mode shape and natural frequency of a 3 cylinder 4 stroke
engine crankshaft. The test is done in both simulation and also experimental using a
simple test rig. The crankshaft is modeled using Solidworks computer aided design
(CAD) software and simulation analysis is done in ALGOR computational aided
engineering (CAE) software. Experimental is done by using impact hammer to excite
the crankshaft and data recorded using data acquisition system (DAS) connected to
sensor located on the crankshaft. The post processing software used after
experimental is done is Me’ScopeVES software. The results for both simulation and
experimental is compared. The mode shapes is simulated using ALGOR. The
differences in the results between simulation and experimental is discussed. The final
selected natural frequency for simulation is based on mesh aspect ratio of 80%.
Simulation natural frequency in 1st mode is 688.494 Hz (bending), 2
nd mode is
707.661 Hz (bending), 3rd
mode is 1098.9 Hz (bending), 4th
mode is 1273.63 Hz
(torsion) and 5th
mode is 1664.23 Hz (bending). Meanwhile, the experimental natural
frequency (x-axis) in 1st mode is 668 Hz, 2
nd mode is 722 Hz, 3
rd mode is 1300 Hz,
4th
mode is 1480 Hz and 5th
mode is 1580 Hz. Experimental natural frequency (y-
axis) in 1st mode is 724 Hz, 2
nd mode is 742 Hz, 3
rd mode is 850 Hz, 4
th mode is 1130
Hz and 5th
mode is 1300 Hz. Experimental natural frequency (z-axis) in 1st mode is
475 Hz, 2nd
mode is 724 Hz, 3rd
mode is 775 Hz, 4th
mode is 1120 Hz and 5th
mode is
1320 Hz. The discrepancy errors recorded between simulation and experimental is
ranging from 2 – 23.11%.

vi
ABSTRAK
Aci engkol adalah salah satu alat terpenting didalam enjin pembakaran
dalaman. Ia bertindak sebagai alat pengubah gerakan searah kepada putaran yang
telah disempurnakan oleh Al-Jazari pada seawal 1226 dan telah digunakan didalam
mesin pam airnya. Kertas ini terdiri dalam mencari bentuk mod dan frekuensi
semulajadi aci engkol sebuah enjin 3 silinder 4 lejang. Ujian ini dijalankan dalam
dua keadaan iaitu eksperimen dan simulasi komputer. Aci engkol akan dimodelkan
menggunakan perisian CAD SOLIDWORKS dan analisis simulasi akan dilakukan
didalam perisian CAE ALGOR. Eksperimen pula akan dilakukan menggunakan
tukul impak untuk menggetarkan aci engkol tersebut. Data akan direkod
menggunakan alat pengumpulan data dimana ia disambungkan pada sensor yang
terletak pada permukaan aci engkol tersebut. Kemudian, data eksperimen akan
diproses menggunakan perisian Me’ScopeVES. Keputusan yang diperolehi dari
kedua-dua eksperimen dan simulasi akan dibandingkan. Bentuk mod pula akan
dihasilkan oleh simulasi melalui perisian ALGOR. Perbezaan kepada kedua-dua data
telah dibincangkan. Nilai frekuensi semulajadi yang muktamad dipilih dari nisbah
mesh 80%. Cadangan untuk mempertingkatkan lagi kualiti eksperimen dan simulasi
di masa hadapan juga telah disenaraikan. Frekuensi semulajadi secara simulasi pada
mod 1 ialah 688.494 Hz, mod 2 ialah 707.661 Hz, mod 3 ialah 1098.9 Hz, mod 4
ialah 1273.63 Hz dan mod 5 ialah 1664.23 Hz. Frekuensi semulajadi secara
eksperimen (paksi-x) pada mod 1 ialah 668 Hz, mod 2 ialah 722 Hz, mod 3 ialah
1300 Hz, mod 4 ialah 1480 Hz dan mod 5 ialah 1580 Hz. Frekuensi semulajadi
secara eksperimen (paksi-y) pada mod 1 ialah 724 Hz, mod 2 ialah 742 Hz, mod 3
ialah 850 Hz, mod 4 ialah 1130 Hz dan mod 5 ialah 1300 Hz. Frekuensi semulajadi
secara eksperimen (paksi-z) pada mod 1 ialah 475 Hz, mod 2 ialah 724 Hz, mod 3
ialah 775 Hz, mod 4 ialah 1120 Hz dan mod 5 ialah 1320 Hz. Peratus ralat yang telah
direkodkan berada dalam lingkungan 2 – 23.11%.

vii
TABLE OF CONTENTS
TITLE PAGE
TITLE PAGE
STUDENT DECLARATION
ACKNOWLEGDEMENT
ABSTRACT
ABSTRAK
TABLE OF CONTENTS
LIST OF TABLES
LIST OF FIGURES
LIST OF ABBREVIATIONS
LIST OF APPENDIXES
i
ii
iv
v
vi
vii
x
xii
xiv
xv
CHAPTER 1 INTRODUCTION
1.1. Introduction
1.1.1. Project Background
1.2. Problem Statement
1.3. Project Objectives
1.4. Project Scopes
1.5. Chapter Outline
1.6. Gantt Chart
1
2
4
5
5
6
6
viii
CHAPTER 2 LITERATURE REVIEW
2.1. Introduction
2.2. Experimental Modal Analysis (EMA)
2.2.1. Related Technical Paper/Journal on EMA
2.2.1.1. Modal Analysis of Tire In-Plane Vibration
2.2.1.2. Experimental Modal Analysis
2.2.1.3. New Solutions in Experimental Modal Analysis
of Mechanical Structures
2.2.1.4. Modified ERA Method for Operational Modal
Analysis In The Presence Of Harmonic
Excitations
2.2.1.5. Experimental and Numerical Power Unit
Vibration Analysis
2.2.1.6. Experimental Modal Analysis of Three Small-
Scale Vibration Isolator Models
2.2.1.7. Dynamics Modal Testing of Fun Kart Chassis
2.3. Finite Element Analysis (FEA)
2.3.1. Related Technical Paper/Journal on FEA
2.3.1.1. Finite Element Modeling, Correlation and Model
Updating of Stiffened Plate
2.3.1.2. Finite Element Modeling of Silo Based On
Experimental Modal Analysis
2.4. Paper of Interests
2.4.1. Modal Analyses and Experiments for Engine Crankshaft
7
8
8
8
9
11
11
12
12
13
15
15
15
16
17
17
CHAPTER 3 METHODOLOGY
3.1. Introduction
3.2. Project Flow Chart
3.3. Project Methodology
3.4. List of Apparatus
20
21
22
29

ix
CHAPTER 4 RESULT AND DISCUSSION
4.1. Introduction
4.2. Result Comparison
4.2.1. Experimental Result
4.2.2. Simulation Result
4.2.2.1. 1st Simulation
4.2.2.2. 2nd
Simulation
4.2.2.3. 3rd
Simulation
4.2.2.4. 4th
Simulation
4.3. Summary
4.4. Discussion
30
30
30
33
33
36
36
37
37
42
CHAPTER 5 CONCLUSION AND RECOMMENDATION
5.1. Introduction
5.2. Summary
5.3. Conclusions
5.4. Recommendations
44
44
45
45
REFERENCES 46
APPENDIXES 48

x
LIST OF TABLES
Table No Title Page
3.1 List of apparatus 29
4.1 Experimental natural frequency 32
4.2
Natural frequency and deflection types for 1st
simulation
33
4.3 Natural frequency for 2nd
simulation 36
4.4 Natural frequency for 3rd
simulation 37
4.5 Natural frequency for 4th
simulation 37
4.6 Summary of simulated natural frequency 38
4.7a
Comparison on experimental and simulation data, X-
axis with 100% aspect mesh ratio
38
4.7b
4.7c
4.7d
4.8a
4.8b
4.8c
4.8d
4.9a
Comparison on experimental and simulation data, X-
axis with 80% aspect mesh ratio
Comparison on experimental and simulation data, X-
axis with 60% aspect mesh ratio
Comparison on experimental and simulation data, X-
axis with 40% aspect mesh ratio
Comparison on experimental and simulation data, Y-
axis with 100% aspect mesh ratio
Comparison on experimental and simulation data, Y-
axis with 80% aspect mesh ratio
Comparison on experimental and simulation data, Y-
axis with 60% aspect mesh ratio
Comparison on experimental and simulation data, Y-
axis with 40% aspect mesh ratio
Comparison on experimental and simulation data, Z-
axis with 100% aspect mesh ratio
38
39
39
39
40
40
40
41
xi
4.9b
4.9c
4.9d
4.10
4.11
4.12
Comparison on experimental and simulation data, Z-
axis with 80% aspect mesh ratio
Comparison on experimental and simulation data, Z-
axis with 60% aspect mesh ratio
Comparison on experimental and simulation data, Z-
axis with 40% aspect mesh ratio
Average errors between simulation and experimental
natural frequency based on X-axis
Average errors between simulation and experimental
natural frequency based on Y-axis
Average errors between simulation and experimental
natural frequency based on Z-axis
41
41
42
43
43
43

xii
LIST OF FIGURES
Figure No Title Page
1.1 Engine Crankshaft 3
2.1 Figure of a tire 9
2.2 Flexible body modes 9
2.3 Impact testing 10
2.4 Shaker test setup 10
2.5 Experimental set-up for a beam 11
2.6 Engine on the test rig 12
2.7 Vibration isolators configurations 13
2.8 Experimental set-up for a shaker 14
2.9 Excitations using impact hammer 14
2.10 Sample of aluminum plate used 16
2.11 Silo tower 17
2.12 Mode shapes and frequency of a four cylinder
crankshaft
18
2.13 Mode shapes and frequency of a six cylinder
crankshaft
19
3.1 Project flow chart 21
3.2 Rendered modeled of a crankshaft 22
3.3 Algor Fempro 23

xiii
3.4
3.5
3.6
3.7
3.8
3.9
3.10
3.11
4.1a
4.1b
4.1c
4.2
4.3
4.4
4.5
4.6
Solidworks
Algor mesh solid setups
Me’scopeVes software
Experimental test rig
Crankshaft mounted on the test rig
Tri-axial accelerometer mounted on the crankshaft
Impact hammer used in experimental
The data acquisition system
Frequency measured on X-axis
Frequency measured on Y-axis
Frequency measured on Z-axis
1st Mode, Bending
2nd
Mode. Bending
3rd
Mode, Bending
4th
Mode, Torsion
5th
Mode, Bending
24
25
26
26
27
27
28
28
31
31
32
33
34
34
35
35

xiv
LIST OF ABBREVIATIONS
CAD Computer Aided Design
CAE Computer Aided Education
DAS Data Acquisition System
DOF Degree Of Freedom
EMA Experimental Modal Analysis
ERA Eigensystem Realisation Algorithm
FEA Finite Element Analysis
FRF Frequency Response Feedback
FYP Final Year Project
ICE Internal Combustion Engine
MIMO Multiple Input Multiple Output
SIMO Single Input Multiple Output

xv
LIST OF APPENDIXES
Appendix Title
A FYP01 Gantt Chart
B FYP02 Gantt Chart
C X-Axis Frequency Response Data
D
E
F
Y-Axis Frequency Response Data
Z-Axis Frequency Response Data
Graphical Comparison on Simulation
Analysis

CHAPTER 1
INTRODUCTION
1.1 INTRODUCTION
Since 1335, the theory of automobile had been recorded, from the first to be
driven by wind to the latest state of the art electric vehicle. In 1876, Nicolaus August
Otto invented the first internal combustion engine known as The Otto Cycle Engine.
Then in 1886, Gottlieb Daimler improved the idea of internal combustion engine that is
practical to be used as an automotive engine. Since then, the idea of internal combustion
engine had improved exponentially but, the very basic concept of Otto cycle still
remains.
In Otto cycle engine or Internal Combustion Engine (ICE), a piston, or series of
it will reciprocate in a linear manner, for example, ups and downs. Such linear motion
need to be translated into rotational motion in order for the power generated from the
movement of the piston into any mechanism that can move the car. The mechanical part
that translates all the piston’s linear motions is called crankshaft.
In modern ICE, the crankshaft can rotates up to 20000 rpm. At 20000 rpm, with
forces exceeds 3000 N push down on the crankshaft, careful consideration of material
and calculations is needed to create a crankshaft that can take not only directional forces,
but also rotational motion. As the crankshaft rotates, vibration will occurs. The
crankshaft working cycles will be shortened dramatically if the vibration is not

2
contained. Frequency of vibration will often occur when a system is vibrating, in this
case, the crankshaft.
In ICE, every part has its own natural frequency. Natural frequency is the
frequency at which a system naturally vibrates once it has been set into motion. In other
words, natural frequency is the number of times a system will oscillate (move back and
forth) between its original position and its displaced position, if there is no outside
interference. If the crankshaft vibrating frequency is near or same as its natural
frequency, resonance will happened and the effect on the crankshaft or even the ICE
itself is catastrophic.
1.1.1 Project Background
Crankshaft is a fundamental and a very crucial part in ICE. Its role as the main
translational-rotational converter have been used and perfected as early as 1226 by Al-
Jazari in his water pump machines. Typically in an ICE, the crankshaft would be fitted
with flywheel in order to reduce the pulsating of sudden force exerted during
combustion. Without the flywheel, the crankshaft will experience even higher pulsating
and thus, increase the crankshaft wear and tear in the crankshaft structure.

3
Figure 1.1: Engine crankshaft
Source: Solidworks 2008
Another major problem when dealing with crankshaft is its out-of-balance
characteristics. From the figure above, we can see that the crank pins is off from the
center, will surely will act as an out-of-balance mass. With the crankshaft is out of
balance, it will vibrate when the crankshaft rotate. Frequency will be generated when the
crankshaft rotates and if the crankshaft rotating frequency is equal to its natural
frequency, resonance will happened and the crankshaft will break in the long term.
Crankshaft in modern ICE normally had been fitted with a counter-balance mass
just opposite to compensate with the mass of crank pins. Even though this works
amazingly well, it is really impossible to contain all the vibration on the crankshaft, and
thus resonance can still happens.
4
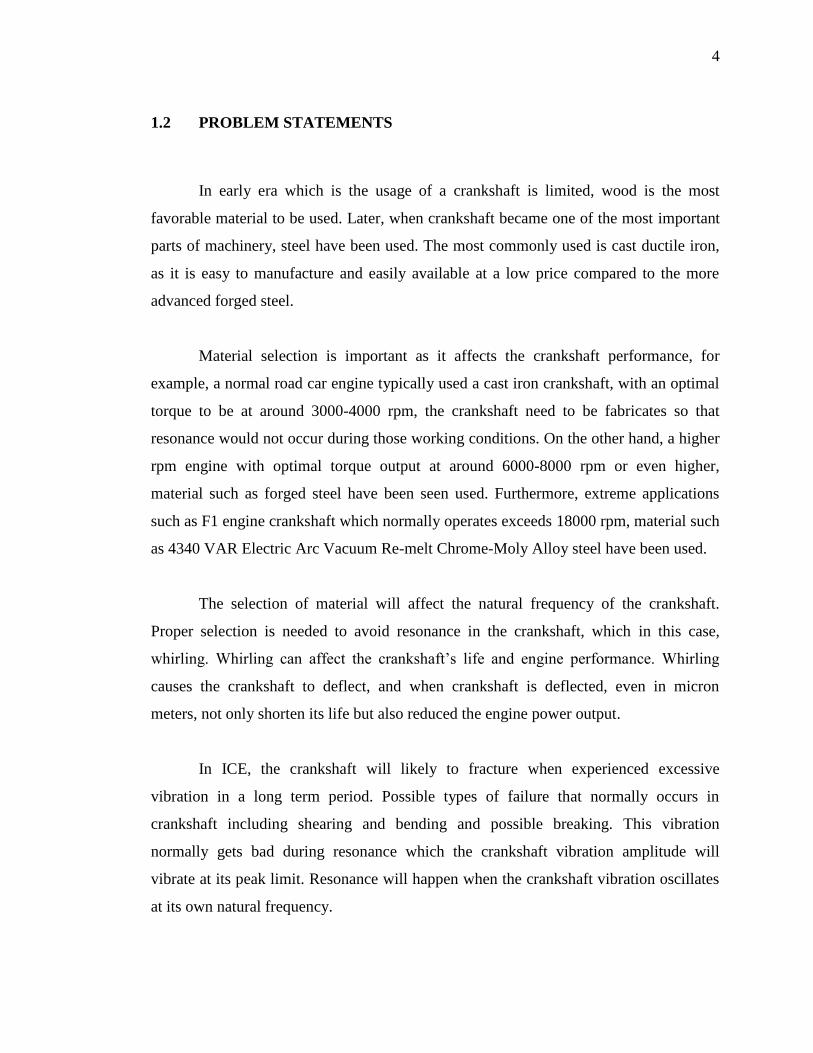
1.2 PROBLEM STATEMENTS
In early era which is the usage of a crankshaft is limited, wood is the most
favorable material to be used. Later, when crankshaft became one of the most important
parts of machinery, steel have been used. The most commonly used is cast ductile iron,
as it is easy to manufacture and easily available at a low price compared to the more
advanced forged steel.
Material selection is important as it affects the crankshaft performance, for
example, a normal road car engine typically used a cast iron crankshaft, with an optimal
torque to be at around 3000-4000 rpm, the crankshaft need to be fabricates so that
resonance would not occur during those working conditions. On the other hand, a higher
rpm engine with optimal torque output at around 6000-8000 rpm or even higher,
material such as forged steel have been seen used. Furthermore, extreme applications
such as F1 engine crankshaft which normally operates exceeds 18000 rpm, material such
as 4340 VAR Electric Arc Vacuum Re-melt Chrome-Moly Alloy steel have been used.
The selection of material will affect the natural frequency of the crankshaft.
Proper selection is needed to avoid resonance in the crankshaft, which in this case,
whirling. Whirling can affect the crankshaft’s life and engine performance. Whirling
causes the crankshaft to deflect, and when crankshaft is deflected, even in micron
meters, not only shorten its life but also reduced the engine power output.
In ICE, the crankshaft will likely to fracture when experienced excessive
vibration in a long term period. Possible types of failure that normally occurs in
crankshaft including shearing and bending and possible breaking. This vibration
normally gets bad during resonance which the crankshaft vibration amplitude will
vibrate at its peak limit. Resonance will happen when the crankshaft vibration oscillates
at its own natural frequency.

5
1.3 PROJECT OBJECTIVES
These are the main objective for this project:
a) To find the crankshaft natural frequency, ωn and the mode shapes
b) To compare the above results with Finite Element Analysis &
Experimental Modal Analysis
1.4 PROJECT SCOPES
To achieve the aforementioned objectives, a crankshaft from a Daihatsu Mira
EJDE, 3 cylinders 4 stroke engine will be used. This project consists both experimental
and simulation, which are:
Experimental
a) Building the test rigs
b) Mounting the crankshaft and sensors to the test rigs
c) Analyzing using PulseLab and ME Scope
Simulation
a) Modeling using Solidworks CAD Software
b) Importing into ALGOR for modal analysis testing
6
1.5 CHAPTER OUTLINE
Chapter 1 described the purpose of finding the natural frequency and the mode
shapes on the engine crankshaft using finite element analysis and experimental modal
analysis. This chapter also defines the problem associated with crankshaft during
operating and how to overcome these problems.
Chapter 2, the literature reviews give an insight on how to perform such analysis,
whether experimentally or simulation, using various method on various things such as
car chassis, fun kart chassis and also on tires. The study on basic and fundamental of
experimental modal analysis and also finite element modeling by previous researchers is
important and it is the key to successfully complete this research.
Chapter 3, the methodology, will explains all the procedures and methods used
before, during and after test have been done for both experimental and simulation. All
the apparatus and method used in experimental and simulation, respectively, are shown.
Chapter 4 provides all the result from experimental and simulation. Comparison
of results between experimental and simulation are shown. All the differences are
discussed thoroughly in this chapter.
Lastly, in chapter 5, the results on both experimental and simulation are
summarized. Recommendations on future research for engine crankshaft are included.
1.6 GANTT CHART
The purpose of a gantt chart is to display the duration together with work
implementation. Gantt chart for final year project 1 and 2 can be referred in Appendix A
and B.

CHAPTER 2
LITERATURE REVIEW
2.1 INTRODUCTION
In real life application and testing, experimental modal analysis is a crucial and
accurate method to find the natural frequency and mode shape, but it is a very time
consuming method especially on a large object such as a bridge or a steel tower like The
Eiffel Tower in France. Finding these objects mode shapes and natural frequency can
take weeks or even months to complete. This is where Finite Element Analysis comes in
handy.
Finite Element Analysis or better known as FEA has been developed in 1943 by
Richard Courant, who used the Ritz method of numerical analysis and minimization of
variational calculus to obtain approximate solutions to vibration systems. From the
engineering side, the finite element analysis originated as the displacement method of
the matrix structural analysis, which emerged over the course of several decades mainly
in British aerospace research as a variant suitable for computers. By late 1950s, the key
concepts of stiffness matrix and element assembly existed essentially in the form used
today and NASA issued request for proposals for the development of the finite element
software NASTRAN in 1965.

8
2.2 EXPERIMENTAL MODAL ANALYSIS (EMA)
Modal Analysis, or more accurately Experimental Modal Analysis, is the field of
measuring and analysing the dynamic response of structures and or fluids when excited
by an input. Examples would include measuring the vibration of a car's body when it is
attached to an electromagnetic shaker, or the noise pattern in a room when excited by a
loudspeaker. Classically this was done with a SIMO approach, Single Input, Multiple
Output, that is, one excitation point, and then the response is measured at many other
points. However in recent years MIMO has become more practical.
Typical excitation signals can be classed as impulse, broadband, swept sine,
chirp, and possibly others. Each has their own advantages and disadvantages. The
analysis of the signals typically relies on Fourier analysis. The resulting transfer function
will show one or more resonances, whose characteristic mass, frequency and damping
can be estimated from the measurements.
2.2.1 Related Technical Paper/Journal on EMA
2.2.1.1 Modal Analysis of Tire In-Plane Vibration
This paper [1] presents experimental modal analysis on experimental and
theoretical analysis of non-rotating tire for two boundary conditions. The tire is excited
using impact hammer and the responses are measure in tangential and radial direction
with accelerometers.

9
Figure 2.1: Model of a tire used
Source: Peter W.A. Zegelaar 1997
2.2.1.2 Experimental Modal Analysis
This paper [2] presents the fundamental of experimental modal analysis. The
investigation are been done using impact hammer and stroke hammer. The objective is
to investigate the relation of modes in modal analysis.
Figure 2.2: Flexible body modes
Source: Brian J. Schwarz & Mark H. Richardson 1999