Embed Size (px)
Citation preview
MOBILISING SUSTAINABLE SUPPLY CHAINS – BIOGAS CASES BIOGAS PRODUCTION FROM MUNICIPAL SOLID WASTE, OIL PALM RESIDUES AND CO-DIGESTION
IEA Bioenergy: Task 43: PR2016:04

IEA Bioenergy, also known as the Implementing Agreement for a Programme of Research, Development and Demonstration on Bioenergy, functions within a Framework created by the International Energy Agency (IEA). Views, findings and publications of IEA Bioenergy do not necessarily represent the views or policies of the IEA Secretariat or of its individual Member countries.
MOBILISING SUSTAINABLE SUPPLY CHAINS – BIOGAS CASES
BIOGAS PRODUCTION FROM MUNICIPAL SOLID WASTE, OIL PALM RESIDUES AND CO-DIGESTION
J.W.A. Langeveld (Biomass Research), R. Guisson (VITO), and H. Stichnothe (Thünen Institute)
Copyright © 2016 IEA Bioenergy. All rights Reserved
ISBN, if applicable, here
Published by IEA Bioenergy

1
1. TABLE OF CONTENTS
1 TABLE OF CONTENTS .................................................................................................................. 1
2 EXECUTIVE SUMMARY ................................................................................................................ 4
3 ABBREVIATIONS ........................................................................................................................... 8
4 INTRODUCTION ......................................................................................................................... 10
5 BACKGROUND ............................................................................................................................ 12
5.1 Process description .......................................................................................................................... 12
5.2 Drivers ................................................................................................................................................... 14
5.3 Potential ................................................................................................................................................ 16
5.4 Production chains ............................................................................................................................. 20
5.5 Barriers for biogas development ............................................................................................... 21
5.6 Biogas chain types ............................................................................................................................ 22
5.6.1 MSW digestion .......................................................................................................................... 23
5.6.2 Oil palm residue digestion ......................................................................................... 23
5.6.3 Co-digestion .......................................................................................................................... 24
6 MSW DIGESTION ....................................................................................................................... 25
6.1 Background ......................................................................................................................................... 25
6.1.1 EU policies ............................................................................................................................... 26
6.2 Potential ................................................................................................................................................ 28
6.2.1 Europe ........................................................................................................................................ 28
6.2.2 USA ............................................................................................................................................... 34
6.2.3 Global level ............................................................................................................................ 35
6.3 Chain description .............................................................................................................................. 38
6.3.1 Prevention ............................................................................................................................... 39
6.3.2 Collection ................................................................................................................................. 39
6.3.3 Treatment ............................................................................................................................... 39
6.4 Drivers and barriers ........................................................................................................................ 42
6.5 Options for improvement .............................................................................................................. 44
7 OIL PALM RESIDUE DIGESTION .......................................................................................... 47
7.1 Introduction ........................................................................................................................................ 47
7.2 Palm oil industry in Indonesia .................................................................................................... 48
7.3 Palm oil production .......................................................................................................................... 50
7.4 Drivers and barriers ........................................................................................................................ 53

2
7.4.1 Drivers ....................................................................................................................................... 53
7.4.2 Barriers ...................................................................................................................................... 55
7.4.3 Opportunities ........................................................................................................................ 57
7.5 Outlook to 2050 ................................................................................................................................. 65
7.6 Conclusion ............................................................................................................................................ 65
8 CO-‐DIGESTION .......................................................................................................................... 67
8.1 Introduction ........................................................................................................................................ 67
8.2 Legal/policy frameworks .............................................................................................................. 68
8.2.1 Europe ........................................................................................................................................ 68
8.2.2 USA ............................................................................................................................................... 69
8.2.3 Brazil ........................................................................................................................................... 71
8.3 Potential ................................................................................................................................................ 72
8.3.1 Europe ........................................................................................................................................ 72
8.3.2 USA ............................................................................................................................................... 72
8.3.3 Brazil ........................................................................................................................................... 73
8.4 Chain description .............................................................................................................................. 73
8.4.1 Europe ........................................................................................................................................ 73
8.4.2 USA ............................................................................................................................................... 73
8.4.3 Brazil ........................................................................................................................................... 74
8.5 Drivers and Barriers ........................................................................................................................ 74
8.6 Options for improvement .............................................................................................................. 76
9 DISCUSSION ............................................................................................................................... 77
10 CONCLUSION AND RECOMMENDATIONS ......................................................................... 82
11 REFERENCES .............................................................................................................................. 84

3

4
2. EXECUTIVE SUMMARY
Agricultural and industrial biomass residues are promising feedstocks, but their availability for energy production, the available conversion methods and the organisation of production chains are all subject to debate. Anaerobic Digestion (AD) is a process of degradation of organic material by microorganisms under anaerobic conditions. Feedstocks include biodegradable residues including food wastes, sewage, and animal residues, while biomass from dedicated crops can be used to enhance biogas yields. A co-digestion or co-fermentation plant is typically an agricultural anaerobic digester that accepts two or more input materials for simultaneous digestion.
Advantages of AD include its flexibility in processing both dry and liquid feedstocks, including manure and municipal sludge, as well as the fact that it is already fully developed at household, farm and industrial scales, and provides an effective upgrade of residues. It is also a clean and safe alternative to fossil fuels. AD has a very favourable energy output to input ratio, and high potential to diminish Greenhouse Gas (GHG) emissions. Methane can be stored, while the by-product (digestate) is a valuable source of nutrients and organic matter. Potential disadvantages of AD include the risk of explosion, gas toxicity (caused by hydrogen sulphide), and unpleasant odours, while the risk of methane leakages reduces the potential GHG benefits.
IEA Bioenergy aims to stimulate a substantial bioenergy contribution to future energy demand. Accelerating production and use of environmentally sound, socially acceptable and cost-competitive bioenergy will help to provide increased security of supply, while reducing emissions from energy use. This report is part of a broader IEA Bioenergy InterTask Project ‘Mobilising sustainable bioenergy supply chains’. It discusses: biogas production from organic residues, biogas production from the organic fraction of Municipal Solid Waste (MSW), use of oil palm residues, and co-digestion of agricultural residues (manure and substrates).
Municipal Solid Waste
Consistent data on management of the biowaste fraction in MSW in the EU is lacking. A variety of complex policy strategies (at EU, national and regional levels) can shift biowaste away from landfill, leading in general to variable recycling rates, and to the selection of particular biogas production strategies. An estimated 3-4% of EU351 biowaste is currently digested, leaving a huge potential untapped. Worldwide, 6 billion tonnes of urban waste will be produced each year by 2025. As some 1 billion tonnes of this will be biodegradable, the biogas production potential amounts to 86 million normal cubic metres (Nm³) of biogas with an equivalent energy content of 1.8 Exajoule (EJ).
MSW management covers biomass generation, collection and treatment. EU legislation does not prescribe specific treatment options. Member States often do not select composting or biogas options. The selection of seemingly easy and cheap options such as incineration or landfill disregards environmental benefits and costs. Logistical barriers for biogas chains are related to
1 EU28 plus Iceland, Norway, Switzerland, Montenegro, FYROM (former Yugoslav Republic of Macedonia), Serbia, Turkey, Bosnia-Herzegovina, and Kosovo

5
MSW collection and transportation. The efficiency of waste collection and digestion should be improved at higher collection rates and over a shorter time span between biowaste production and digestion, to avoid loss of biogas production potential.
The establishment of a carbon price, through a carbon tax or a cap-and-trade programme, would lower the cost of biogas relative to higher-carbon fossil alternatives. A carbon price would also create an incentive for biogas production, and the resulting gas could be sold to the market at a price equal to the prevailing price of natural gas, plus the carbon price associated with its consumption.
The environmental balance of MSW biogas chains depends on collection, waste composition and quality, climatic conditions, and the potential for the use of products (electricity, heat, methane-rich gas, digestate, compost).
Oil Palm Residues
Oil palm, the main source of the world’s vegetable oils, covers a surface area of five million ha in Indonesia. It is one of the most important sources of crop residues and wastewater in the region. Cultivation and processing are potentially large sources of GHG emissions; improving these impacts can help to reduce existing emissions.
Availability of oil palm residues depends on the harvest season. Processing one tonne of fresh fruit bunches (FFB) generates 0.23 tonnes of Empty Fruit Bunches (EFB) and 0.65 tonnes of Palm Oil Mill Effluent (POME) production. The annual potential of residues from Palm Oil Mills in Indonesia totals 32 million tonnes of EFB and 91 million m³ of POME. POME digestion and co-composting of empty fruit bunches (EFB) and POME are proven technologies. Biogas production from EFB is, however, still in its infancy.
The potential for biogas production from oil palm residues is substantial, but it is important to focus on integrated biorefineries, because several technologies are needed to maximise residue utilisation. Development requires huge investments, and the linking of oil mill operators with power production practices. The security of planning also depends on a consistent and reliable regulation framework.
Biogas production from oil palm residues is associated with a very favourable GHG budget. Closed tank digestion prevents spontaneous methane emissions occuring from POME treatment in traditional open ponds. One cubic metre of POME can cause up to 12 m³ of methane emissions, equal to approximately 200 kg CO2eq. Consequently, using residues from palm oil mills for biogas production is economic, environmentally beneficial, and saves fossil fuel resources.
Co-digestion of agricultural residues
Co–digestion consists of simultaneous anaerobic digestion of a principal basic substrate such as manure or sewage sludge, mixed with smaller amounts of one or more additional substrates. AD was mostly a single substrate/single purpose technology in the past, but co-digestion is nowadays a standard technology, as it leads to enhanced biogas yields and GHG-emission reduction, increased process stability, reduced odour, enhanced nutrient recycling, increased flexibility of substrate selection, linkage to existing infrastructure (e.g. wastewater treatment or manure digestion facilities), steady biogas production, and a higher potential income thanks to gate fees for alternative ways of waste treatment.
The possible use of waste as a co-substrate is determined by guidelines related to issues such as

6
landfill, soil protection, groundwater protection, waste collection, health, and waste recovery. In the EU, composting and anaerobic digestion are favoured over other bio-waste treatment methods. The use of food leftovers and animal by-products not intended for human consumption is limited by sterilization requirements, while EU regulations limit the use of co-products to 50% (weight percentage) for digestate applications on agricultural land.
The situation in the USA is similar to that in the EU, with Federal regulations setting nationwide limits and operational permits determined by state or local agencies. Regulations determining the fate of solid waste show large variations over different states. In Brazil, biogas development is based on climate change policy. Auctions were introduced for the procurement of renewable energy including bioenergy from municipal solid waste, landfills and sewage sludge treatment, as well as AD systems treating animal waste. Legislation on the development of a biomethane market is under way.
The global forecast for manure availability is some 28 billion tonnes by 2050, of which an estimated 50% can be recovered. Together with a crop residue availability of 2.4 billion tonnes, the availability of co-digestion feedstock is significant. The current bioenergy potential of manure is rising to 10 EJ globally. The low energy content of manure, and its dispersed distribution, as well as the policy dependency of co-digestion success stories, are, however, barriers to its deployment. It is crucial to mobilise crop residues to serve in parallel as a co-digestion feedstock.
Co-digestion is stimulated by waste water plants applying co-substrates to enhance gas yield and electricity production. Co-substrates are used to increase both gas yields, and income from manure digestion. Co-digestion is encouraged by the need for sanitation, demand for local energy sources and high costs of fossil energy. Major barriers to development include a lack of awareness, high upfront costs, lack of access to finance, and lack of local capacity for project design and implementation. Existing legal frameworks often complicate AD production and commercialisation.
Bioenergy potential
Crop residues represent a bioenergy potential of 49 EJ in 2020, while estimates for 2030 suggest that 62 EJ could be sourced from agricultural residues including food wastes. Biogas is one of the cheapest bioenergy sources, with production costs generally remaining below $4/GJ. Predicted global cost supply curves of biogas feedstocks for 2050 suggest an availability of 35 EJ of biogas resources at less than US $2/GJ. Future availability in 2050 can exceed 90 EJ at less than US $3/GJ.
Poor economic performance of digesters can be an important barrier to the mobilisation of biogas potential, especially as collection, storage and preparation of fresh biomass or manure is often costly. The markets required to support large-scale economic and efficient AD development may be poorly developed. The high prices, poor quality and low availability of co-substrates may put additional pressure on AD profitability. Stable and effective political and public support may help to obtain access to credit, feedstocks, and product markets and also help to ascertain investment or other subsidies.
Policies
Policies to enhance biogas development include the amendment of inconsistent policies and intrinsic barriers, e.g. caused by interactions at local, regional and national policy levels. Special attention should be given to reducing structures supporting fossil fuels, which make it more difficult for new technologies to become competitive. Improvement of the image of biogas

7
production may help to lift negative perceptions, thus effectively stimulating development of the production chain, and its support by stakeholders in feedstock, gas and energy markets, and by the general public.

8
3. ABBREVIATIONS
AD Anaerobic digestion
BOD Biological oxygen demand
CAFO Concentrated Animal Feeding Operations
CDM Clean Development Mechanism
CER Certified Emission Reduction
CFR Code of Federal Regulations
CHP Combined heat and power
COD Chemical oxygen demand
COM Communication
CPO Crude palm oil
CSTR Continuously Stirred Tank Reactors
CTF Clean Technology Fund
DGEEU Directorate General of Electricity and Energy Utilization (Indonesia)
EC European Commission
EEA European Environment Agency
EFB Empty fruit bunch
EU European Union
FFB Fresh fruit bunch
GDP Gross domestic product
GHG Greenhouse Gas
IDR Indonesian Rupiah
IOPRI Indonesian Palm Oil Research Institute
IPP Independent private producers
JRC Joint Research Center
MoEMR Indonesia’s Ministry of Energy and Mineral Resources
9
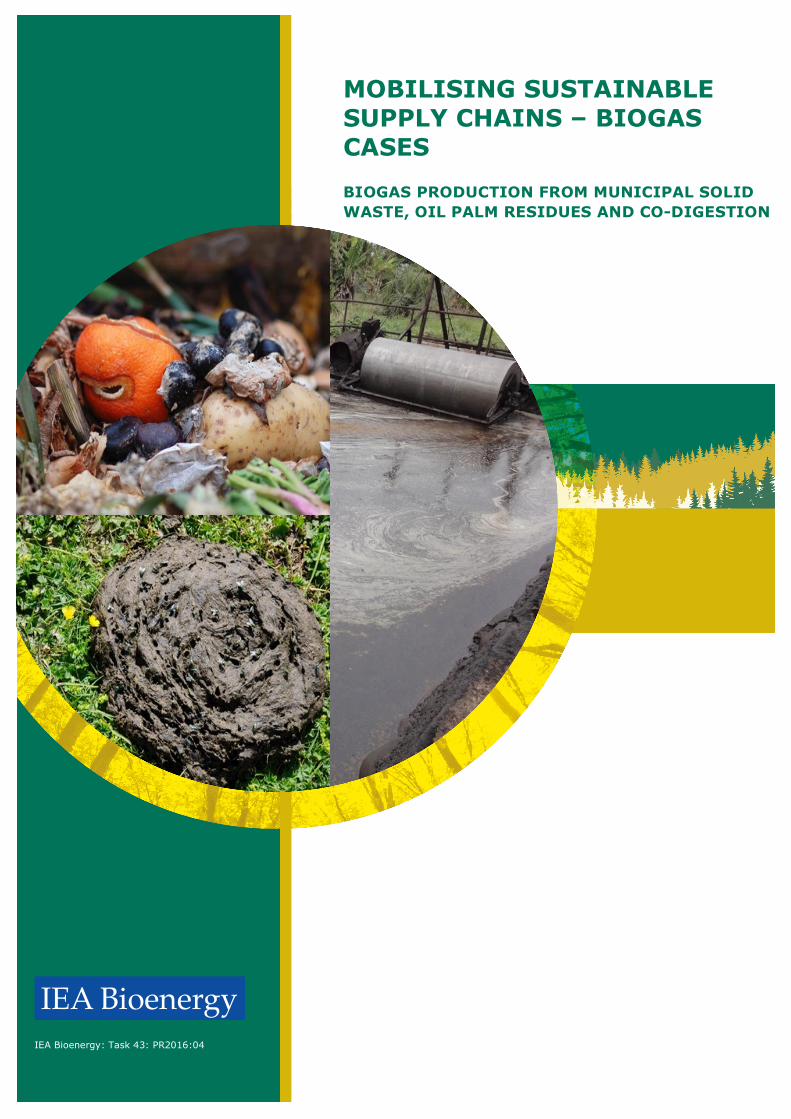
MP3EI Indonesian Master Plan of Economic Development Extension and Acceleration
MSW Municipal Solid Waste
NPDES National Pollutant Discharge Elimination System
PFAD Palm Fatty Acid Distillate
PKO Palm Kernel Oil
PLN Indonesia’s national electricity supplier
POME Palm Oil Mill Effluent
POM Palm Oil Mill
RCRA Resource Conservation and Recovery Act
TS Total solids
UAF Upflow Anaerobic Filter
UASB Upflow Anaerobic Sludge Blanket
USDA U.S. Department of Agriculture
WAB Waste Agricultural Biomass

10
4. INTRODUCTION
The development of bioenergy offers major possibilities for the reduction of Greenhouse Gas (GHG) emissions and fossil fuel dependency, but it may cause unintended impacts — e.g. it can affect existing land use patterns, food production or biodiversity. This is offering a dilemma for policy makers, which need to determine how to promote sustainable ways of bioenergy development to replace fossil fuel use without causing conflicts in other policy objectives.
Many studies have identified agricultural and industrial biomass residues as promising feedstocks that bring fewer risks with respect to competition for food or affecting natural resources. The amount of residues available for energy production, the way in which they should be converted and the organisation of emerging bioenergy chains remains a subject of debate.
Global final renewable energy use for heat, excluding traditional biomass, reached 14.5 exajoules (EJ), accounting for 8 per cent of world energy use for heat. World final energy use for heat accounts for more than half of final energy consumption. Global renewable electricity generation is expected to reach 26 EJ in 2020, representing an annual growth rate of more than 5.4 per cent (IEA 2014).
Bioenergy applications, including traditional methods of space heating and cooking (e.g. burning firewood), presently account for 35 EJ, or two-thirds of total biomass use (Nakada et al. 2014). Projections of bioenergy production for 2030 are presented by IRENA (2015). Deploying all existing technology options, global biomass use could reach 108 exajoules (EJ). This is double the current level, and would account for 20% of total primary energy supply and 60% of final renewable energy use (Nakada et al. 2014).
It is expected that traditional methods of space heating and cooking, such as burning firewood, will gradually give way to modern biomass consumption, including substantially larger shares for power and transport applications. Power and district heating would reach 36 EJ and transport 31 EJ, while heat for industry and buildings would reach up to 41 EJ (Nakada et al. 2014).
Biomass residues include organic materials that do not directly go into food or other products but are necessarily generated during crop production or processing. Mostly, this biomass is in the form of residual stalks from crops, leaves, roots, seeds and seed shells etc. It is estimated that globally, approximately 5 billion metric tons of agricultural residues are generated every year – thermal equivalent to approximately 1.2 billion tons of oil – about 25% of the current global production (UNEP 2012).
Not all of this, however, is available for bioenergy production. It is important to distinguish between biomass potential and surplus biomass. A part of the biomass that in theory could be used to generate bioenergy in practice is used in other applications. This may be the case in Asia, Africa and Latin America, but also holds for industrial regions including the EU and the USA. Not all studies are clearly making this distinction.
Converting biomass residues into energy has environmental as well as economic benefits. Waste Agricultural Biomass (WAB) is a clean source of energy, as the carbon cycle loop is closed (the carbon dioxide released by combustion is again sequestered in the next crop) and usually there are no harmful emissions. Given the potential and favourable perspectives for the conversion of biomass residues and other organic material into bioenergy, it comes as no surprise that the

11
production of biogas is growing. Already, the number of biogas installations in use is estimated at more than 35 million, most of which are household installations located in China and India (Table 1). Large farm digesters, mostly found in Europe and North America, and industrial installations obviously have a much larger average capacity.
Table 1. Number of biogas installations
Region Number of installations (year)
Reference
Europe
Austria
Denmark Germany
Italy
The Netherlands Sweden
Switzerland
UK Europe (all)
337 (2013)
154 (2012) 7,850 (2013)
1,264 (2013)
252 (2013) 264 (2013)
606 (2013)
634 (2013) 14,563 (2013)
Persson and Baxter (2015)
Persson and Baxter (2015) FNR (2015a)
European Biogas Association (2015)
Persson and Baxter (2015) Persson and Baxter (2015)
European Biogas Association (2015)
Persson and Baxter (2015) European Biogas Association (2015)
Asia China
India
Nepal Pakistan
South Korea
Viet-Nam
30 million (2010)
4.2 million (2011)
1.3 million (2012) 5,360 (2008)
82 (2013)
23,300 (2012)
Households; Gregory (2010) Cheng et al. (2014) Cheng et al. (2014) Wikipedia (2015) Persson and Baxter (2015) Rajendran et al. (2012)
America
United States Brazil
2,116 (2014) 25 (2014)
Of which 239 farm digesters. USDA (2014) Connected to the grid; Persson and Baxter (2015)
Africa
Burkina Faso
Ethiopia Kenya
Tanzania
3,500 (2015)
10,109 (2015) 14,112 (2015)
10,000 (2015)
AfricaBiogas (2015)
AfricaBiogas (2015) AfricaBiogas (2015)
AfricaBiogas (2015)

12
5. BACKGROUND
Anaerobic digestion is a process in which microorganisms break down biodegradable material under anaerobic conditions. The process is used to manage organic residues and/or to produce fuels or materials for industrial or domestic purposes. Feedstocks can include a range of materials including biodegradable residues, such as grass clippings, food residues, sewage, and animal residues. Woody residues are largely unaffected, as most microorganisms are unable to degrade lignin. Pretreatment of lignocellulosic feedstocks can, however, significantly increase their biogas yield potential.
Anaerobic digesters can also be fed with biomass of dedicated crops, such as silage maize, to enhance biogas yield. A codigestion or cofermentation plant is typically an agricultural anaerobic digester that accepts two or more input materials for simultaneous digestion.
1.1. Process description
Biogas is the final product of a process of anaerobic fermentation, in which organic material is converted by microorganisms into methane (CH4) and carbon dioxide (CO2) under oxygen-free conditions. The overall anaerobic digestion process can be depicted as:
Organic matter -> CH4 + CO2 + water + minerals + microbial biomass + organic residue
Methane and carbon dioxide together form the biogas. The digestate that is produced contains major minerals like ammonium, phosphate salts and potassium. The mineral solution (including the organic residue) is referred to as digestate and is an effective organic fertiliser.
The process of anaerobic digestion (AD) of organic material is described below and depicted in Figure 1. Four major steps that can be distinguished (Wilkie 2008; Arshadi and Sellstedt 2008; Pabón 2009; FNR 2010; Yu et al. 2010; Zupančič and Grilc 2012):
• hydrolysis, conversion of polymers into monomers (sugars, fatty acids and amino acids);
• acidogenesis, conversion of monomers into volatile fatty acids (VFA’s), alcohols, hydrogen gas, ammonia and carbon dioxide;
• acetogenesis, conversion of VFA’s and alcohols into acetate, hydrogen and carbon dioxide;
• methanogenesis, conversion of acetate, hydrogen and carbon dioxide into methane.
Each step is conducted by a specific group of anaerobic bacteria. These groups operate synergistically, reinforcing each other’s efficiency. The final performance of the process thus depends on the accumulated performance of different groups of bacteria, each with their own speed, requirements and sensitivities. Consequently, management of the digestion process is complex and requires constant monitoring of process conditions, including temperature, acidity, retention time and biomass composition (e.g. C:N ratio).
Temperature is the factor with probably the greatest impact on biogas yield. Biogas can be produced in three temperature regimes: relatively cool (<300C, psychrophilic), moderate (30-400C, mesophiilic) or relatively hot (40-500C, thermophiilic). Anaerobic bacteria are active in

13
mesophilic and thermophilic temperature ranges which therefore provide higher biogas yields. For an effective process, it is further important to maintain a favourable C: N ratio (20-30:1; Arshadi and Sellstedt 2008).
Figure 1. Anaerobic pathway of digestion of organic material
Source: Zupančič and Grilc (2012)
Microorganisms involved in the last two steps of the process (acetogenesis and methanogenesis) are the most susceptible to environmental conditions and feedstock composition. Process limiting factors include ammonia toxicity which may occur during digestion of manure or slaughterhouse streams, or excessive proprionate concentration which may inhibit methanogenesis. Other factors that reduce methanogens include halogenated compounds, heavy metals and acid conditions (pH-values below 6.5; Yu et al. 2010).
Iron, nickel, cobalt, molybdenum and selenium are essential trace elements that play an important role in electron transfer (Ünal et al. 2012; Zupančič and Grilc 2012; Banks and Heaven 2013). Limitations in their availability will reduce biogas yields. The efficiency of biogas production can reach up to a level of 80 to 95% (Angenent and Wrenn 2008; Murphy et al. 2011) but in practice, lower efficiency rates have been reported (Pöschl et al. 2010).
Anaerobic digestion is a sensitive process and process failures might occur when a group of micro-organisms is inhibited or, alternatively, overloaded. Performance varies according to the type of input material to be digested and to the technological configuration and operation of the AD unit. There are challenges in AD management that remain to be solved (see e.g. Pabón 2009; Banks and Heaven 2013; Murphy and Thamsiriroj 2013).
Biogas composition is usually 50-55% of methane, plus carbon dioxide, water plus small amounts of ammonia (NH3) and hydrogen sulphide (H2S). Typical biogas yields are presented in Table 2. Highest yields are derived from energy crops, especially silage (maize, grass, rye). Manure biogas production is low, especially liquid cattle and pig manure.

14
Table 2. Biogas yield of major biomass and manure types
Feedstock Biogas yield
m3/tonne fresh matter
Composition
% of
methane
Methane yield
m3/tonne fresh matter
Energy crops Maize silage
Grass silage
Rye silage Feeding beet
Sweet sorghum
Common beet
Beet leaves Grain stillage
Cereal straw
Bio-waste Food residues
Grease (50% d.m.)
Fruit residues
Vegetable residues Poultry manure
Pig manure
Cattle manure Liquid pig manure
Liquid cattle manure
202
151-172
163 111
108
88
70 40
100 220
500
80
60
45 28-30
25-30
52%
54%
52% 55%
51%
63%
64% 60%
61%
60%
60%
60% 60%
60%
30-150 105
81-93
85 61
55
55
45 24
139-145
61
160-710
150-390 48
36
27 17
15
Source: FNR (2009), Amon et al. (2004, 2007, 2007a), Prochnow et al. (2008), Baxter (2005), Pietsch (2007), Wilkie (2008), Pabón (2009)
1.2. Drivers
AD offers the following significant advantages over other technological options in the realisation of the bio-energy potential that is contained in organic residues (Pabón 2009; Yu et al. 2010; Gregory 2010; Murphy et al. 2011; Deublein and Steinhauser 2011; Rajendran et al. 2012; Hamlin 2012; Da Costa Gomez 2013; Quist-Wessel and Langeveld 2014).
• AD is a flexible, non-sterile technology that can process dry or wet feedstocks including manure and waste streams like municipal sludge.
• AD is a fully developed technology, generally accepted for applications at household, farm and industrial scales which operates well on feedstock mixtures and does not require pure feedstocks or defined cultures.

15
• Household and farm installations can be constructed with local materials that are widely available. Applications facilitate a hygienic, efficient and cost-effective upgrade of excreta and other waste streams for poor households.
• Digesters are safe, compact systems that are relatively easy to operate.
• As a hydrocarbon fuel, methane has almost identical characteristics to natural gas, which allows it to be used for different purposes. It is a clean and safe alternative at industrial as well as household level, where it can save time and reduce lung damage as compared to (collection and burning of) firewood and charcoal.
• Methane can be stored, making it an attractive counterpart to other alternative energy technologies including wind and solar.
• AD requires little energy, and has a very favourable energy output:input ratio; consequently, it offers a high potential to diminish GHG emissions.
• AD installations can be implemented independently or be integrated into complex waste management, food processing, biofuel production or other industrial processes involving organic materials. If linked to larger systems, it can significantly improve energy efficiency, upgrade waste flows and reduce GHG impacts.
• Its residual by-product (digestate) is a stable product rich in nutrients and organic matter. Applying this in agriculture offers an opportunity to close nutrient cycles and improve soil quality.
There are limitations in the relatively poor economic performance of some AD production chains. Potential non-economic disadvantages of AD refer to the risk of explosion, toxicity of the hydrogen sulphide fraction, smell, leaking and potential negative attitude towards management of excrements. Cheap and light PVC digesters generally have a short life span while natural materials are more likely to break or emit gases (Rajendran et al. 2012). Some feel the risk of methane leakages seriously reduce the potential GHG benefits. Biogas can be explosive when mixed with air (Arnott, 1985). Lethal accidents have been reported of people entering a digester without the use of an oxygen mask.
Development of biogas production from organic waste materials serves a range of objectives and many countries have installed policies supportive of AD production (for an overview, see e.g. Persson and Baxter 2014; 2015).
Traditionally, AD installations have been propagated as a way to decentrally generate cost effective energy from waste materials and residues. This is most typical in China, where AD development has played a major role in rural development policies for decades (Gregory 2010; Cheng et al. 2014). More recently, construction of new household (and small farm) digesters has been included in development programmes (SNV 2009), e.g. in Africa (AfricaBiogas 2015) but also in parts of Asia and Latin America.
Decentralised, renewable (non-fossil) energy production is considered as a driving force for economic development, especially in land-locked developing nations or isolated inland regions which face problems with electrification and high transport costs for diesel and other fossil energy carriers. Economic performance depends largely on biogas yield, installation costs (including capital costs) and feedstock fees (Gebrezgabher et al. 2010; Cheng et al. 2014).
While low technical performance has been reported to reduce profitability for household and small

16
farm systems (e.g. in China, Gregory 2010), high capital and feedstock costs which may be expected at large farm and industrial installations, may drive down economic outcomes (Gebrezgabher et al. 2010; Persson and Baxter 2015).
Over the last two decades, biogas production has come to play a role in programmes to reduce GHG-emissions and the combat of climate change, mostly in Europe and other OECD member states (for an overview of recent biofuel policies, see Persson and Baxter 2014). Although many authors report huge unutilised potential for biogas production (e.g. Yu et al. 2010), its role as a renewable energy source in most countries is expected to remain limited (some 2% in the EU in 2020; Beurskens and Hekkenberg 2010).
Next to abating climate change, AD has been reported to play a potential role in the realisation of other environmental objectives including the reduction of small particles (Particulate Matter or PM), soot and nitrogenous gases (Arshadi and Sellstedt 2008; Quist-Wessel and Langeveld 2014); and improvement of wastewater quality (Gregory 2010; Cheng et al. 2014; Persson and Baxter 2014).
Further, utilisation of the digestate can be an excellent route to enhance nutrient recycling and to close the carbon loop (Yu et al. 2010; Gregory 2010; Murphy et al. 2011; Deublein and Steinhauser 2011; Rajendran et al. 2012; Hamlin 2012; Da Costa Gomez 2013; Quist-Wessel and Langeveld 2014), where AD improves nutrient release from organic material (Pabón 2009; Banks and Heaven 2013).
Finally, treating excreta, manure and other residues in a digester has been reported to be an excellent way to reduce the contagious character of these feedstocks and risk of microbial contamination (e.g. Rajendran et al. 2012) although not all risks are fully eliminated. This sanitation effect is especially relevant for rural household applications in Asia (Cheng et al. 2014), Africa (AfricaBiogas 2015) and Latin America.
While all drivers undoubtedly have been influential in steering biogas production chain development, their impact on a given digester type will vary from place to place. In the following chapters, perspectives for individual chain types in a given number of regions will be discussed in more detail. First, however, we will present some assessments of the biogas potential.
1.3. Potential
Most organic materials (including crops, crops residues, manure and industrial residues) are suited for anaerobic digestion. Productive feedstock generally contains 15 to 20 per cent dry matter, is high in volatile solids (VS), contains fat, is relatively high in protein, and low in lignin (Zwart and Langeveld 2010). The C:N ratio should fall between 10 and 30 (Zupančič and Grilc 2012); at higher ratios carbon can’t optimally be converted into methane.
The exact potential for the production of biogas from organic materials in 2050 is difficult to assess. Large uncertainties exist with respect to availability of suitable biomass feedstocks. Also, it remains unclear what future land use will look like as this depends to a range of factors including quantity and quality of land resources, yield potential, population and economic growth, diets, cropland productivity and climate change.
Estimations on future cropland availability for bioenergy feedstocks show extremely high

17
variations. An assessment of land resources in 2050 based on FAO data and crop modelling is presented by Haberl et al. (2011). Presently, 1.5 billion ha of arable land is identified, most of which is found in Asia. Some 12% of land area (13 billion ha) consists of arable land. Grazing land (4.7 billion ha) is mostly found in Asia, Africa and, to a lesser extent, in the Americas.
Arable land is the dominant land cover type in Europe; grazing land is dominant in North and Latin America, large parts of Asia, Sub-Saharan Africa and Australia/Oceania. Cropping intensity is highest in Asia as well as parts of North America, Latin America and Europe. Average fertilizer use (expressed as kg of pure nitrogen applied) varies between 30 kg N/ha in Africa to 126 kg N/ha in Europe.
According to the authors there is considerable perspective for expansion. Apart from the existing arable and grazing land, there is an estimated 1.6 million ha of unutilised but potentially productive land. Most potential land is found in North America and Asia (517 and 505 million ha, respectively), followed by Australia/Oceania and Latin America. Europe has the lowest unutilised land stock.
Haberl et al. (2011) developed two scenarios for potential bioenergy production. In the Business As Usual scenario, arable land (for food, feed and energy crops) is projected to expand with some 140 million ha. Most expansion will be realised in Africa, Latin America and (South) Asia. Area of cropland in Europe would shrink. In a more aggressive scenario, expansion would amount to 290 million ha. In comparison to the BAU scenario, the increase of arable land in Latin America and in Australia/Oceania would be doubled.
Scenario outcomes can be used to assess potential bioenergy production in 2050. Under the Business As Usual scenario, a total of 105 EJ could be generated. Less than half of this will be generated on arable land (46 EJ); the remainder can be harvested from energy crops grown on former grazing land (59 EJ). Crop residues from arable land generate 28 EJ, representing a quarter of the total potential. Regional distribution is dominated by Asia, Africa and Latin America.
These results can be compared to data presented elsewhere. The number of studies providing global bioenergy estimations from specific types of biomass feedstock (e.g. crop residues and energy crops) however is limited. According to IEA Bioenergy (2011), residues together with sustainably grown energy crops should be able to provide the majority of the biomass feedstock requirements needed to realise biofuel as well as heat and power targets in 2050, but projections are not provided. E4Tech (2014) estimated current arable crop residue and MSW availability at 3.0 billion tonnes.
Additionally, 16 billion tonnes of animal manure could be sourced for biogas production. Residue availability in 2020 is estimated at 3.9 billion tonnes, plus 19 billion tonnes of animal manure. Most important residue flows include MSW, straw, industrial bioresidues and bagasse (Figure 2). Algae biomass available for bioenergy currently is very limited, but may increase to 2.2 million tonnes in 2020.
Biofuel potential of the crop residues has been estimated at 40 EJ, to increase to 49 EJ in 2020 with negligible contribution of algae (E4Tech 2014). Not all residues are suited for anaerobic digestion. A conservative estimate allocating a share of the available biomass to biogas varying from 0% (bagasse, straw) to 50% (MSW, POME, industrial residues) provides an estimate of 5.3 EJ from biogas in 2020. Assuming that residues make up only a quarter of the total bioenergy potential (as suggested by Haberl et al.), the total estimate amounts to some 200 EJ which is considerably higher than global estimations presented by Haberl.

18
Global biomass supply potential in 2030 is estimated by IRENA (2015) to range from 97 EJ to 147 EJ per year. Approximately 40% of this total would originate from agricultural residues (37-66 EJ). The remaining supply potential is shared between energy crops (33-39 EJ) and forest products, including forest residues (24-43 EJ). In geographic terms, the largest supply potential — estimated at 43-77 EJ per year — exists in Asia and Europe. North and South America together account for another 45-55 EJ per year.
Figure 2. Global biogenous residue availability
(Source: E4Tech 2014)
Estimations by the World Bioenergy Association (WBA) suggest 150 EJ of bioenergy could be generated in 2030. Some 62 EJ of this would be sourced from agricultural residues including food residues. Cultivation of energy crops could provide another 18 EJ, cultivated on 200 million ha.
Dornburg et al. (2010) estimate bioenergy potential from residues at 85 EJ of energy in 2050. This is more than predicted by Haberl et al. (2012) or Nakada et al. (2014), but includes both agricultural and forest residues.
The use of organic residues (by-products from agriculture, organic fraction of industrial and municipal waste) for biogas production is becoming increasingly important. Global biogas potential has been assessed by IEA. Assuming a mean biogas net energy yield of 150 GJ/ha, 10% of the arable land could provide 21 EJ. Cultivating energy crops on 30% of the existing arable land then could cover some 16% (worldwide) or 18% (Europe) of the overall primary energy demand (Braun et al. 2010).
In terms of annual potential for different biomass types in 2030, Africa is most notable for energy crops (5-7 EJ); Asia for residues and wastes (15-32 EJ); North America for energy crops (~7 EJ) and fuel wood (~3 EJ); South America for energy crops (~16 EJ/yr); and Europe for fuel wood (0.3-13 EJ) and energy crops (~7 EJ) (Nakada et al. 2014).

19
NREL (2013) defined the biogas potential in the USA at 7.8 million tonnes of CH4 or around 13 million tonnes of biogas which is around 0.3 PJ. Of this, some 2.5 million tonnes CH4 originate from landfills, 19 million tonnes from animal manure and 1.2 from organic residues.
EU biogas potentials for 2020 assessed by AEBIOM (2009) assume that 25 million ha of agricultural land can be used for energy without harming food production or the environment. A quarter of this could be devoted to biogas crops, providing a potential biogas production of 27 billion m3 of methane. To this can be added 32 billion m3 from agricultural residues.
Biogas production in the EU from agriculture in 2020 is estimated at 46 billion cubic metres of methane, or 40 Mtoe (up from 6 Mtoe in 2007;1.7 EJ; Table 3). This does not include potential use of catch crops. This is higher than data provided by Stolpp (2010), who assessed EU biogas potential in 2020 at 25 Mtoe.
Table 3. Potential biogas production in the EU25 in 2020
Potential production
(Billion m3 of
methane)
Realised in 2020
(%)
Actual production
in 2020 (Billion m3
of methane)
Actual production
in 2020 (Mtoe)
(EJ)
Energy crops
Agricultural by-products
Straw Manure
Landscape management
Total agriculture
Municipal solid waste Industrial residues
Sewage sludge
Total residues All
27.2
31.7
10.0 20.5
1.2
58.9
10.0 3.0
6.0
19.0 77.9
100%
28%
5% 35%
40%
62%
40% 50%
66%
50% 59%
27.2
9.2
0.5 7.2
0.5
36.4
4.0 1.5
4.0
9.5 45.9
23.4
7.9
0.4 6.0
0.4
31.3
3.4 1.3
3.4
8.2 39.5
1.0
0.3
0.0 0.3
0.0
1.3
0.1 0.1
0.1
0.3 1.7
Source: AEBIOM (2009)
Higher estimates are provided by Fischer et al. (2007), who estimate biogas potential from residues and energy crops for Europe in 2030 at 4 to 8 EJ. This is not including MSW or forest residues. This is confirmed by FNR (Rettenmaier et al 2008), which projects 1-2 with incidentally estimations of 4 EJ produced from residues in Europe.
The potential in Brazil is high, but quantified estimates could not be obtained. It is expected to be at least similar to the EU level but consisting of a different feedstock mix (more agricultural residues, less manure and municipal waste). The potential for energy crops is expected to be higher than in the EU.

20
1.4. Production chains
Biogas production chains are built around Anaerobic Digestion units, and can include pre- and post-treatment units. Biogas can be used for heating, as feedstock for combined heat and power (CHP) units, or as transport fuel. It can be consumed locally, while upgrading allows injected into the gas grid, or liquefaction. Upgrading involves cleaning, increasing of the methane contents to 95%, plus compression. Most of the generated biogas is used for the production of electricity and heat. Sweden and the Netherlands represent two special cases, upgrading biogas for injection into the natural gas network or as motor fuel.
So far only Sweden has established a market for biomethane-driven cars. Sweden traditionally has used biogas for heat production, less focussing on biogas for electricity. About one quarter of the biogas is upgraded and applied as a vehicle fuel. Upgraded biogas is also injected into the natural gas grid, currently replacing 2% of the fossil gas in this country (AEBIOM 2009). Initiatives for the development of biogas as a car fuel have also been reported elsewhere, e.g. in Brazil and Switzerland (Persson and Baxter 2015).
Biogas production chains can have a specific character depending on prevailing local conditions. The dominance of small-scale installations in emerging and developing countries has already been highlighted. Emerging and industrial countries list larger installations, of which two thirds are associated with agricultural feedstocks. Some 57% of the electricity production that has been reported is from agricultural installations (calculated from Persson and Baxter 2014). Primary biogas production from landfills, sewage sludge and other sources (including agriculture) in OECD member states has been assessed by IEA (Persson and Baxter 2015). Main results are presented in Figure 3. Of the countries included in the survey, Germany clearly has the largest number of installations (ten times more than any other country). Germany and Austria are two countries with the highest share of farm-based digesters.
Figure 3. Number and role of biogas installations in emerging and industrial countries Source: IEA Bioenergy (Persson and Baxter 2015).
Data for Germany from FNR (2015a)

21
For animal farms, biogas production provides a way to generate extra income from animal manure, a by-product. The main role of biogas production in agriculture may however be to provide stable additional incomes (electricity prices showing fluctuations which are not as high as do primary agricultural commodities). Medium to large on-farm biogas installations also can serve as a source of rural employment, a source often utilised by farm members or workers already employed on the farm.
1.5. Barriers for biogas development
Barriers for AD development have been listed for different regions and sectors. According to C2ES (2015), obstacles for AD development in US agriculture relate to questions about digester reliability, uncertainty about economic returns, and restrictions on buying excess electricity put up by utility providers. High feedstock (like silage maize) prices are reportedly undermining economic operation of existing biogas installations, e.g. in Austria (Persson and Baxter 2014) and the Netherlands (Gebrezgabher et al. 2009).
Reasons for low AD development in Ireland, as listed by Persson and Baxter (2014), include the relatively low level of renewable energy feed-in tariff (REFIT) – especially when compared to the tariff in neighbouring Northern Ireland. Biogas development is more profitable north of the border provoking uneven development as well as a biomass trade from South to North.
According to Chen et al. (2014), AD development in developing countries is hampered by the reliance on manual installation manufacturing which may lead to poor quality and disappointed users. More reliable composite materials mostly are not locally available. When they need to be imported, materials such as fiberglass, carbon fibre, and polyester generally become unaffordable. A lack of quality standards further adds to poor performance. China, hosting by far the highest number of digesters, has only one standard which is difficult to implement.
Other factors restricting AD development in developing countries include limited public awareness, and disappointment about their performance (e.g. fluctuations in gas production during mornings and evenings), and lack of skilled trainers that can help owners to operate digesters effectively (Chen et al. 2014).
In China, the number of household digesters has shown a temporary decline starting around 1978. The decline was mostly associated with technical problems, including hurried construction and poor materials, inappropriate feedstocks, lack of maintenance and technical support services. New promotion policies, training programs for technicians, improved material availability, extended bank loans, increased biogas research, and improved technical literature in combination with investment subsidies amounting to 1,000 Yuan (about US$150) have led to a steady increase in digester development (Gregory 2010).
Langeveld et al. (2010) defined conditions for successful development of new bioenergy production chains in the Netherlands:
• availability of a proven, mature technology;
• access to sufficient knowledge and information;
• access to feedstock, credit and product markets;

22
• availability of good quality locations; and
• effective political support.
Economic performance of biodigesters is sensitive to unit size and feedstock price. Small-scale plants are often uneconomic, but centralised digestion may be limited because of the distances over which manure has to be transported as this increases feedstock price. Farm-based biogas digestion may, further, have considerable difficulties in selling surplus process heat due to lack of economic demand plus and high cost of grid connection in scarcely populated or developed rural areas (Bauen 2009).
An analysis of technical and economic performance of agricultural biogas installations in the EU (Eder 2009) showed that production costs of electricity varied between €0.10 and €0.39 per kWh. Half of the costs related to capital costs, purchasing feedstock required 30%; the remainder is associated with labour and other operational costs. The results suggest that economic operation of AD installations is frequently not profitable.
Summarizing, barriers for biogas chain development include:
• legal restrictions;
• high costs;
• logistical issues;
• poor technical performance;
• limited access to investments;
• lack of policy support; and
• societal distress.
1.6. Biogas chain types
Biogas production has been developed at household, farm and industrial level, with large differences with respect to the feedstocks used, technology level, scale and market integration. By far the largest share of digesters is found in small households located in Asia. Household types are also common in Africa and, to a lesser extent, Latin America. Large farm digesters are more common in Europe and the USA while industrial AD installations can be found all around industrial as well as emerging economies.
Household and small farm digesters are fed with human excreta, household waste as well as manure and crop residues. Digesters in Europe are mostly agricultural plants, but alternatively these may be fed with sewage sludge, bio-waste, industrial residues and waste from landfills. The main substrate used for biogas production in the agriculture sector is a mixture of energy crops, e.g. maize silage, and animal manure (Persson and Baxter 2015).
This study will focus on three AD production chain types, which are presented below – MSW, oil palm production systems, and co-digestion of waste streams.

23
1.1.1. MSW digestion According to the European Environmental Agency (EEA 2013b), the biodegradable fraction of MSW in the European Union yearly amounts to around 100 million tonnes of which only a fraction is digested. The chart below depicts the current municipal waste management strategies in the EU27.
Municipal Solid Waste is an important source of bioenergy feedstock. Municipalities, agriculture and industry in the EU produce 56 million tons of organic waste yearly. Out of this, some 14 million tons – 24% – are collected and utilized in bio-waste flows (Braun, 2004). American citizens generated 250 million tons of municipal waste (MSW) in 2010, recycling and composting over 85 million tons of this material – a 34% recycling rate. Organic materials are the largest component of MSW, paper and paperboard accounting for 29 per cent, and garden/yard trimmings and food scraps for another 27 per cent. About 136 million tons of MSW (54 per cent) were discarded in landfills (EPA 2010b).
Different options exist for treatment of MSW. Landfilling, although according to the waste hierarchy the worst option, is still the most used MSW disposal method in the EU.
Incineration is the most common bio-waste treatment. Depending on its energy efficiency, in the EU this can be regarded as energy recovery or as a disposal. As the efficiency of incineration is lowered by the moist bio-waste, it can be beneficial to remove bio-waste from municipal waste. On the other hand, incinerated bio-waste is regarded as carbon-neutral “renewable” fuel in the meaning of the EU RES Directive.
Biological treatment (including composting and anaerobic digestion) may be classified as recycling when compost (or digestate) is used on land or for the production of growing media. If this is not the case, it should be classified as pre-treatment before landfilling or incineration. Anaerobic digestion should be seen as energy recovery.
Composting, the most common biological treatment (95% of biological treatment operations) (ORBIT/ECN 2008) is most suited for green waste and woody material. Different options exist, with "closed methods" being more expensive, requiring less space, being faster, and causing less emissions (odors, bio-aerosols).
Mechanical-Biological Treatment (MBT) combines biological treatment with mechanical treatment (sorting). This paper covers only mixed waste pretreatment oriented to the production of either a more stable input to landfills or a product with improved combustion properties. As MBT uses anaerobic digestion which generates biogas it could however also be considered a process for energy recovery. Combustible waste sorted out in MBT processes may be further incinerated because of its energy recovery potential.
MSW biogas production has a global relevancy, particularly in urban areas (high amount of MSW and growing demand for energy), but heterogeneous feedstock availability varies strongly by country or even city but still provides a relative homogenous supply.
1.1.2. Oil palm residue digestion Oil palm is the main source of plant oils in the world. Covering an area of over ten million ha in the far-east, of which five in Indonesia, it is also one of the most important sources of crop residues in the region while processing generates large amounts of wastewater. Cultivation and processing of this crop are considered as potentially large sources of GHG emissions. Improving GHG impacts of the production chain can help to reduce existing emissions while generating additional energy and farm income at the lowest level.

24
Palm oil residue biogas production is relevant in the equator region (South East Asia, Africa South America). Oil palm frequently is working as a driving force for rural area development. Feedstock supply is fluctuating as it depends on the harvest season, which is dictated by rainfall.
1.1.3. Co-‐digestion Biogas production from co-fermentation of animal manure plus crop (dedicated crops, residues) material has been developed mainly in Europe, where commercial methane production has shown a major development over the last decade. Co-digestion biogas production has a global relevancy, mainly in rural areas with high livestock density, homogenous (livestock) and heterogeneous feedstock supply (residues).
Effective and cost-efficient management of co-digestion installations involving manure and co-substrates requires specialised knowledge of feedstock digestion and digester management. Aspects to be considered include Biochemical Methane Potential (BMP), Organic Loading Rate (OLR), Hydraulic Retention Time (HRT), operational temperature, as well as availability of macro- and micronutrients (Banks and Heaven 2013).
In this report, the focus is on development and performance of common co-digestion practices occurring in Brazil, the USA and Europe.

25
6. MSW DIGESTION
This chapter discusses background, perspectives, barriers and options for further development of biogas production from Municipal Solid Waste.
1.7. Background
The following definitions apply to MSW in the European context.
1. Waste: any substance or object which the holder discards or intends or is required to discard (Waste Frame Directive; Council of the European Union; 2008).
2. Municipal Waste: means household waste and similar waste (European Commission Decision 2011/753).
a. ‘Household waste’ means waste generated by households.
b. ‘Similar waste’ means waste in nature and composition comparable to household waste, excluding production waste and waste from agriculture and forestry.
3. Biodegradable waste: any waste that can undergo anaerobic or aerobic decomposition, such as food and garden waste, paper and paperboard, and waste from food processing plants (Landfill Directive Council of the European Union; 1999; Waste Frame Directive) 2.
4. Biomass: the biodegradable fraction of products, waste and residues from biological origin from agriculture (including vegetal and animal substances), forestry and related industries including fisheries and aquaculture, as well as the biodegradable fraction of industrial and municipal waste (Council of the European Union; 2009).
The list of definitions is a strong indicator of the complexity of factors involved in using the biodegradable fraction of MSW as a resource for biogas production. It is clear that the term ‘biodegradable fraction of MSW’ requires the combination of two of the aforementioned definitions. From the viewpoint of biogas production, it could be defined as ‘solid household waste and similar waste that is capable of undergoing anaerobic decomposition’ and is practically the equivalent of the definition ‘bio-waste’.
Figure 4, providing an overview of the sources of biodegradable waste, shows the resource that is
2 “Bio-waste” does not include forestry or agricultural residues and should not be confused with “biodegradable waste” as defined in the Landfill Directive (1999/31/EC). The latter includes wood, paper, cardboard, sewage sludge, textile, etc. Differences in moisture content may impact treatment options. Note: woody materials from garden and park waste are not suitable for AD.

26
targeted. The term ‘biodegradable waste’ covers several sectors (agriculture, forestry, industry, commerce, etc.). The focus area of this study is on solid waste streams from municipalities (indicated in orange in the figure) hence disregarding more fluid waste streams such as sludges. On the other hand, waste streams from commerce and industry such as waste from food processing and retail are taken into account as they are considered as ‘similar waste’. Finally, the biodegradable fraction of mixed MSW is included as well in this study.
Figure 4. Potential sources of biodegradable waste and bio-waste
Source: Joint Research Centre (2011)
Note that in Figure 4 ‘bio-waste’ is only considered if it is a separate waste stream. However, mixed municipal waste constitutes to a significant amount of biodegradable waste. It is crucial to be aware that the biodegradable fraction of MSW in most countries is rarely available as a separated resource but mainly as a component in a mixed waste stream. Therefor the biodegradable fraction of mixed MSW is taken into account as well.
1.1.4. EU policies This section briefly describes the EU policies relevant to the biodegradable fraction of MSW as a waste fraction as well as a renewable energy resource.

27
The Waste Framework Directive (WFD)3 obliges Member States to optimize the treatment of bio-waste according to their specific conditions and encourages them to collect separately and recycle bio-waste. Furthermore, the WFD enables the setting of EU minimum requirements for bio-waste management and quality criteria for bio-waste compost and digestate, including requirements on the origin of the waste and treatment processes.
The following hierarchy is applied as a priority order in waste prevention and management legislation and policy: (a) prevention; (b) preparing for re-use; (c) recycling; (d) other recovery, e.g. energy recovery; and (e) disposal (Figure 5).
Figure 5. Hiearchy in waste management policy
Source: Joint Research Centre (2011)
The Landfill Directive (LD) requires Member States to progressively reduce landfilling of municipal biodegradable waste to a maximum of 35% of the total municipal waste by 2016 (compared to 1995). Member States which previously relied heavily on landfilling are given a 4-year extension period (i.e., until 2020).
The Directive on Renewable Energy Sources (RES) sets mandatory national targets for the overall share of energy from renewable sources The Directive supports the use of all types of biomass, including bio-waste for energy purposes.
The Animal By-Products regulation (ABP) sets out the rules for recycling, disposal and destruction of animal by-products which are declared not suitable for human consumption. The Regulation stipulates which categories of animal by-products (and in which conditions) are allowed to be treated in biogas plants.
3 DIRECTIVE 2008/98/EC on waste

28
1.8. Potential
1.1.5. Europe As an introduction, general characteristics and trends of EU municipal waste treatment options are discussed followed by the biogas production potential of the biodegradable fraction. In 2012, approximately 290 million tonne of municipal waste was produced in the EU354 with an average of 478 kg/capita. Of this, 279 million tonnes - 460 kg/capita - (96%) were treated.
Large differences exist with respect to the amount of MSW produced per capita, the country with the lowest production (279 kg/capita) generating only 40% of the country with the highest production (694 kg/capita). Trend analysis shows that landfilling declined from 52% (2003) to 34% (2012), while incineration with energy recovery roughly doubled (from 11% in 2003 to 20% in 2012). Material recycling has been steadily growing by 0.8% per year from 20% (2003) to 27% (2012).
Figure 6. MSW treatment options in EU35
Source: Eurostat
At the country level, there is a wide variety in treatment options throughout the EU. In 13 countries more than 75% of the MSW still is landfilled (Figure 6). The different treatment options
4 EU28 plus Iceland, Norway, Switzerland, Montenegro, FYROM (former Yugoslav Republic of Macedonia), Serbia, Turkey, Bosnia-Herzegovina, and Kosovo

29
for MSW in the EU35 (2012) are: landfilling (40%), material recycling (25%), incineration with energy recuperation (19%), composting/digestion (13%) and incineration without energy recuperation (3%). Most digesting and/or composting is done in North-West Europe. Ten countries have a digestion/composting rate exceeding 15% (Austria, Netherlands, Belgium, Luxembourg, Germany, United Kingdom, France, Sweden, Switzerland, and Portugal).
The fraction of municipal waste that is composted or digested has steadily risen over the last decade from 11% (2003) to 15% (2012; Figure 7). However, with an increment of 0.4% per year the rate of increase is modest5.
Figure 7. Trends in MSW composting/digestion in the EU27 Source: Eurostat
Aforementioned statistics for bio-waste treatment were expressed against total MSW production. They give no information on the amount of bio-waste that is produced. EEA provides an overview of the percentages of bio-waste in the total of municipal waste in the EU (EEA 2013b). For the EU35-countries for which the EEA report provides no data on bio-waste percentage (Bosnia-Herzegovina, Croatia, Iceland, Norway, Switzerland, Turkey) the weighted average (33%) was adopted.
Table 4. Bio-waste share in municipal waste in 28 European countries in 2008–2010
Share Country
Less than 20% Lithuania, Norway, Slovenia
Between 20 and 30% Bulgaria, Denmark, Ireland, Hungary, Latvia, Switzerland
5 EU27 used due to higher data availability

30
Share Country
Between 30 and 40% Germany, France, Italy, Sweden, United Kingdom; European average
Between 40 and 50% Austria, Belgium, Czech Republic, Estonia, Finland, Luxembourg, the Netherlands, Poland, Romania, Spain
Between 50 and 60% Greece, Portugal, Slovakia
Between 60 and 80% Malta
Source: ETC/SCP (2011), and data provided by countries to the ETC/SCP in 2012; ETC/SCP (2012a)
Note: Bio-waste includes food and garden waste, but not wood, paper, cardboard or textile waste. Member state data on composition of municipal waste referred to 2008, 2009 or 2010. The European average is calculated on data from 28 countries in the table.
Combining these data with the Eurostat data (Eurostat Municipal waste) provides an estimation of the amount of bio-waste being produced in the EU356, 104 million tonnes or 35% of all MSW generated (and 91 million tonnes in the EU27). The amount of bio-waste at country level is depicted below.
A validating reference is given by the ‘Communication on future steps in bio-waste management in the European Union’: ‘In the EU between 118 and 138 million tonnes of bio-waste are produced every year, of which about 88 million tonnes is municipal waste.’7 Distribution from different countries is depicted in Figure 9.
6 Median value selected for intervals, e.g. value for ‘between 20% and 30%’ interval is 25%. For ‘less than 20%’, 15% was selected. 7 Communication from the commission to the council and the European parliament on future steps in bio-waste management in the European Union COM(2010)235

31
Figure 9. Biowaste production in the EU35
Source: Guisson R. (derived from Eurostat & EEA)
Plotting the amount of bio-waste produced against the amount being composted/digested gives an indication of the untapped potential of bio-waste biogas production. It is stressed that input data used in the calculations are indicative and/or deducted.
Approximately 36% of the bio-waste in the EU35 is currently being composted/digested, leaving a huge potential of bio-waste for biogas production untapped. As mentioned before the EU statistics (Eurostat) do not differentiate between composting and digestion8. In practice, composting is far more popular than digestion; a 9:1 ratio of composting over digestion is assumed. This means only 3-4% of the bio-waste in the EU35 currently is digested, leaving a huge potential being untapped. Data for individual countries are presented in Figure 10.
8 The Eurostat glossary defines composting as ‘a biological process that submits biodegradable waste to anaerobic or aerobic decomposition and that results in a product used on land or for the production of growing media or substrates’

32
Figure 10. Ratio of composting and digestion of biowaste (EU35)
Source: Guisson R. (derived from Eurostat and EEA 2015)
A biogas production potential of 85 m³/tonne bio-waste was adopted at methane content (CH4) of 55%, with methane having an energy content of 37.7 MJ/Nm³. With a total volume of bio-waste in the EU35 of 104 million tonnes, the theoretical biogas production potential amounts to 8.840 million Nm³ of biogas with an equivalent energy content of 182 PJ of which an estimated 3-4% or 5-7 PJ is being currently digested. Distribution of this potential over different states is depicted in Figures 11 and 12.
Note that this theoretical maximum requires all bio-waste, separated and non-separated, would be utilised for biogas production.

33
Figure 11. Potential biogas production in the EU35
Source: Guisson R. (derived from Eurostat & EEA)
Figure 12. Municipal waste treatment and biogas production in EU35 countries
Source: Guisson R. (derived from Eurostat & EEA)
MS Capita (*1000)
Total municipal
waste (kton)
Total municipal waste treated
(kton)
Total Municipal Waste Treated (kg/cap)
Landfill(%)
Incinerated w energy recovery
(%)
Incinerated w/o energy recovery
(%)Material
recycling (%)
Composted/digested
(%)Biowaste
(%)
Total biowaste (kton)
Biogas production potential (mio Nm³)
Energy content (TJ)
Austria 8424 4650 4 450 528 3% 35% 0% 28% 34% 45% 2 003 170 3 529 Belgium 11116 5069 5 095 458 1% 40% 2% 36% 21% 45% 2 293 195 4 041
Bosnia and Herzegovina 3838 1328 1 091 284 100% 0% 0% 0% 0% 33% 360 31 635 Bulgaria 7313 3364 3 164 433 73% 0% 0% 24% 3% 25% 791 67 1 394 Croatia 4271 1670 1 627 381 85% 0% 0% 14% 2% 33% 537 46 946 Cyprus 863 572 572 663 79% 0% 0% 12% 9% 30% 172 15 302
Czech Republic 10497 3233 3 233 308 57% 20% 0% 21% 3% 45% 1 455 124 2 564 Denmark 5591 3735 3 734 668 3% 52% 0% 32% 13% 25% 934 79 1 645 Estonia 1330 371 293 220 44% 16% 0% 34% 6% 45% 132 11 232 Finland 5411 2738 2 738 506 33% 34% 0% 22% 12% 45% 1 232 105 2 172 France 65427 34938 34 939 534 28% 32% 1% 23% 16% 35% 12 229 1039 21 553 FYROM 2063 786 786 381 100% 0% 0% 0% 0% 33% 259 22 457 Germany 80448 49154 49 041 610 0% 18% 17% 47% 18% 35% 17 164 1459 30 252 Greece 11103 5585 5 464 493 82% 0% 0% 16% 2% 55% 3 005 255 5 297 Hungary 9920 3988 3 988 402 65% 9% 0% 21% 5% 25% 997 85 1 757 Iceland 320 108 108 338 50% 6% 2% 36% 6% 33% 36 3 63 Ireland 4588 2615 2 615 570 39% 16% 0% 37% 8% 25% 654 56 1 152 Italy 59558 31506 31 145 523 41% 20% 0% 24% 14% 35% 10 901 927 19 212 Latvia 2037 613 613 301 84% 0% 0% 14% 2% 25% 153 13 270
Lithuania 2985 1400 1 368 458 79% 0% 0% 19% 2% 15% 205 17 362 Luxembourg 530 351 351 662 18% 36% 0% 28% 19% 45% 158 13 278
Malta 419 247 234 559 87% 0% 0% 9% 4% 65% 152 13 268 Netherlands 16742 9225 9 224 551 2% 48% 1% 24% 26% 45% 4 151 353 7 316 Norway 5015 2392 2 343 467 2% 57% 0% 26% 14% 33% 773 66 1 363 Poland 38484 12084 9 581 249 75% 0% 1% 13% 12% 45% 4 311 366 7 599 Portugal 10521 4766 4 766 453 54% 20% 0% 12% 15% 55% 2 621 223 4 620 Romania 20051 7800 6 274 313 99% 0% 0% 1% 0% 45% 2 823 240 4 976 Serbia 7198 2620 1 830 254 100% 0% 0% 0% 0% 33% 604 51 1 064 Slovakia 5404 1751 1 692 313 77% 10% 0% 6% 7% 55% 931 79 1 640 Slovenia 2055 744 619 301 51% 1% 0% 42% 5% 10% 62 5 109 Spain 46720 21678 21 678 464 63% 10% 0% 17% 10% 45% 9 755 829 17 193 Sweden 9522 4399 4 399 462 1% 52% 0% 32% 15% 35% 1 540 131 2 714
Switzerland 8035 5576 5 576 694 0% 50% 0% 35% 15% 33% 1 840 156 3 243 Turkey 75128 29300 24 730 329 99% 0% 0% 0% 1% 33% 8 161 694 14 383
United Kingdom 63678 30056 29 624 465 37% 17% 0% 28% 18% 35% 10 368 881 18 274 EU35 606 605 290 412 278 985 460 111 008 53 250 9 026 68 687 37 078 103 761 8 820 182 876

34
1.1.6. USA A joint study by BioCycle and the Columbia University evaluated the MSW status in the United States of America (Biocycle 2010). It is estimated that some 353 million tonnes or 1.16 tonne percapita9 are generated (2008). MSW management strategies include: composting plus mulch production (6%), material recycling (paper, metal, glass, plastic) (18%), waste-to-energy (7%) and landfilling (69%). The fraction of MSW composted amounts to 22.2 million tonnes or 73 kg/capita composted. No differentiation of data for bio-waste being digested was found.
A regional breakdown indicates the West (11%) and the Midwest (10%) are the leading regions in composting followed by the Mid-Atlantic (7%) and New England (7%). The Great Lakes (3%) and the South region (2%) have the lowest MSW composting rates (Figure 13).
Figure 13. Landfilling, recycling and composting in the USA
Source: 17th nationwide survey of MSW management in the US – A joint study from Biocycle & Earth Engineering Centre of Columbia University
According to an EPA report American citizens generated 251 million tonnes of MSW of which 33
9 US population (Biocycle-2012): 304,059,724.

35
million tonnes food waste (and other) (14.5%) and 31 million tonnes yard trimmings (13.5%) – adding up to approximately 64 million tonnes of bio-waste (28%) or 0.2 tonnes of bio-waste per capita10 (Figure 14; EPA 2012). Of the total MSW volume, 78.5 million tonnes were recovered – a 35% recovery rate. Of the bio-waste fraction about 19.3 million tonnes were composted11 - a 30% composting rate. Hence 44.5 million tonnes of bio-waste (70%) were discarded; of which 31.5 million tonnes of food waste (95%) and 13 million tonnes of yard trimmings (42%); leaving a huge untapped potential for recovery and biogas production.
Assuming the bio-waste fraction of 64 million tonnes is digestible taking into account a biogas production potential of 85 m³/tonne12, the energy production potential for the United States of America amounts to 113 PJ.
Figure 14. MSW composition
Source: EPA (2012)
1.1.7. Global level The worldwide trend of solid waste production is one that is rapidly rising. According to the 2012 Revision of the official United Nations population estimates and projections, the world population of 7.2 billion in mid-2013 is projected to increase by almost one billion people within the next twelve years, reaching 8.1 billion in 2025, and to further increase to 9.6 billion in 2050 and 10.9 billion by 2100 (United Nations 2013).
Much of the demographic change up to 2050 will take place in the less developed regions which will collectively grow 58 per cent over 50 years, as opposed to 2 per cent for more developed regions. Less developed regions will account for 99 per cent of the expected increment to world population in this period13.
10 US population (EPA – 2012):313,914,000. 11 excluding backyard composting 12 Biogas at a methane content (CH4) of 55%, with methane having an energy content of 37.7 MJ/Nm³ 13 World population to 2300, United Nations 2013
36
An increasing number of people is found in cities. Globally, more people live in cities than in rural areas, with 54 per cent of the world’s population residing in urban areas in 2014. In 1950, this was 30 per cent; by 2050, 66 per cent of the population is projected to be urban (United Nations 2014). This process will affect solid waste production. As urbanization increases, global solid waste generation is accelerating. Rural communities have fewer packaged products, less food waste and less manufacturing. A city resident generates twice as much waste as his rural counterpart of the same affluence. As urban citizens are usually richer, they generate four times as much waste.
In 1900, the world had 220 million urban residents (13% of the population). They produced fewer than 300,000 tonnes of solid waste. By 2000, the 2.9 billion people living in cities (49% of the world's population) were creating more than 3 million tonnes of solid waste per day (ca. 1.3 billion tonnes/y). By 2025 it will be twice that amount (Hoornweg et al 2013) and by 2050 it will be around 8 million tonnes per day (3 billion tonnes/year; Figure 15).
Globally, waste volumes are increasing quickly – even faster than the rate of urbanization. Similar to urbanization and increases in GDP, MSW rates grow fastest in China, other parts of East Asia, and (parts of) Eastern Europe and the Middle East. Current global MSW production, approximately 1.3 billion tonnes per year, is expected to increase to 2.2 billion tonnes per year by 2025. This represents a significant increase in per capita waste generation from 1.2 to 1.42 kg per person per day in the next fifteen years (World Bank 2012).
Figure 15. Solid waste projections to 2100.
Source: Hoornweg et al 2013
Currently an estimated 46% of urban waste produced globally is of organic origin and hence is by far the largest fraction (Figure 16).

37
Figure 16. Global solid waste composition
Source: The World Bank – What a Waste (2012)
Available trends in urban waste composition allow estimation of the amount of organic waste by region, currently and by 2025. From these amounts the theoretical biogas and methane production potential can be derived. Current urban waste production is about 1.3 billion tonnes per year. Circa 560 million tonnes of this is of organic origin. Assuming a production of 85 m³/tonne of bio-waste at methane content of 55% and an energy content of 37.7 MJ/Nm³, the biogas potential is 48 million Nm³ with an equivalent energy content of ca. 1.0 EJ or 23.5 Mtoe.
By 2025 6 billion tonnes of urban waste will be produced annually. As some 1 billion tonnes of this will be of organic origin, the biogas production potential is ca. 86 million Nm³ with an equivalent energy content of ca. 1.8 EJ or 43.0 Mtoe. The share of the OECD countries is expected to decrease the most in the coming decade (-11%) while the potential of the East Asia & Pacific region, including China, is expected to grow the most (+9%).
Table 5. Current and projected (2025) urban waste generation by region
Region Current available data Projections for 2025
Total
urban
population
(millions)
Urban Waste Generation Projected population Projected Urban Waste
Per
capita
(kg/c/
day)
Total
(tonnes/day)
Total
population
(millions)
Urban
population
(million)
Per capita
(kg/c/day)
Total
(tonnes/day)
AFR 260 0.65 169,119 1,152 518 0.85 441,840
EAP 777 0.95 738,958 2,124 1,229 1.5 1,865,379
ECA 227 1.1 254,389 339 239 1.5 354,810
LCR 399 1.1 437,545 681 466 1.6 728,392
MENA 162 1.1 173,545 379 257 1.43 369,32

38
OECD 729 2.2 1,566,286 1,031 842 2.1 1,742,417
SAR 426 0.45 192,41 1,938 734 0.77 567,545
Total 2,98 1.2 3,532,252 7,644 4,285 1.4 6,069,703
1 AFR= Africa, EAP= East Asia and the Pacific, ECA= Europe and Central Asia, LCR= Latin America and the Caribbean, MENA= Middle East and North Africa, OECD= members of OECD, SAR= South Asian region.
Source: The World Bank – What a Waste (2012)
Figure 17. Urban waste based biogas production (current & 2025)
Source: Guisson R.
1.9. Chain description
In practice, the management of bio-waste starts can be analysed following the waste hierarchy.

39
This means, that prevention is usually the first option under consideration, followed by (options for) collection and treatment.
1.1.8. Prevention Figure 18 evaluates alternative strategic tools to minimize flow to waste streams. The most efficient strategies for bio-waste prevention include product requirements, financial instruments and green marketing. Certification and prevention targets are not effective.
Figure 18. Preventive tools for waste streams
Source: Zoï Environment Network and GRID-Arendal (2012)
1.1.9. Collection Separate collection schemes function successfully in many countries especially for green waste. Kitchen waste is generally collected and treated as part of the mixed Municipal Solid Waste (MSW). Benefits of separate collection can include diverting easily biodegradable waste from landfills, enhancing the calorific value of remaining MSW, and generating feedstocks for high quality compost and/or biogas chains. Separate collection may also support future technologies (e.g. production of chemicals in bio-refineries).
1.1.10. Treatment The flow chart below illustrates the usual municipal waste treatment operations. Municipal waste treatment data are broken down into these categories:
· incineration (separately for with and without energy recovery);
· landfilling;
· recycling (excluding composting or fermentation);

40
· composting.
Mechanical Biological Treatment (MBT) is regarded to be a pre-treatment operation of which the outputs should be allocated to any of the four aforementioned treatment operations.
Figure 19. Municipal waste treatment options
Source: (Eurostat 2012)
The main treatment options for biodegradable waste are described in the table below. Anaerobic digestion for source separated bio-waste and MBT for mixed bio-waste are discussed in more detail as they are the key options related to biogas production from biodegradable waste.
Anaerobic digestion is especially suitable for treating wet bio-waste, including fat (e.g. kitchen waste) in controlled reactors. The residue from the process, the digestate, usually can be composted and use for similar purpose as compost, thus improving overall resource recovery from waste. If not stated otherwise, the term "compost" in this document refers both to compost directly produced from bio-waste as well as composted digestate. In some cases, poor quality of the digestate prevents its use in fertilization or composing.
Digestate (from AD) that can be either directly be used as fertiliser on field; or composted to obtain compost (there is on-going discussion whether composting of digestate produces compost similar in composition and quantity to compost from direct composting).
Compost-like output (CLO) has an extremely high risk of being contaminated. In Germany, the treated organic fraction from MBT (i.e., CLO) must be landfilled to avoid negative effects on the environment and human health. There is no environmental benefit. CLO can also be used as temporary soil coverings (e.g., for landfills), for green areas along motorways and railways. In this case, the environmental benefit is likely to be very small.
MBT describes techniques which combine biological treatment with mechanical treatment (sorting). In this paper the term refers only to the pretreatment of mixed waste with the objective to produce either a more stable input to landfills or a product with improved combustion
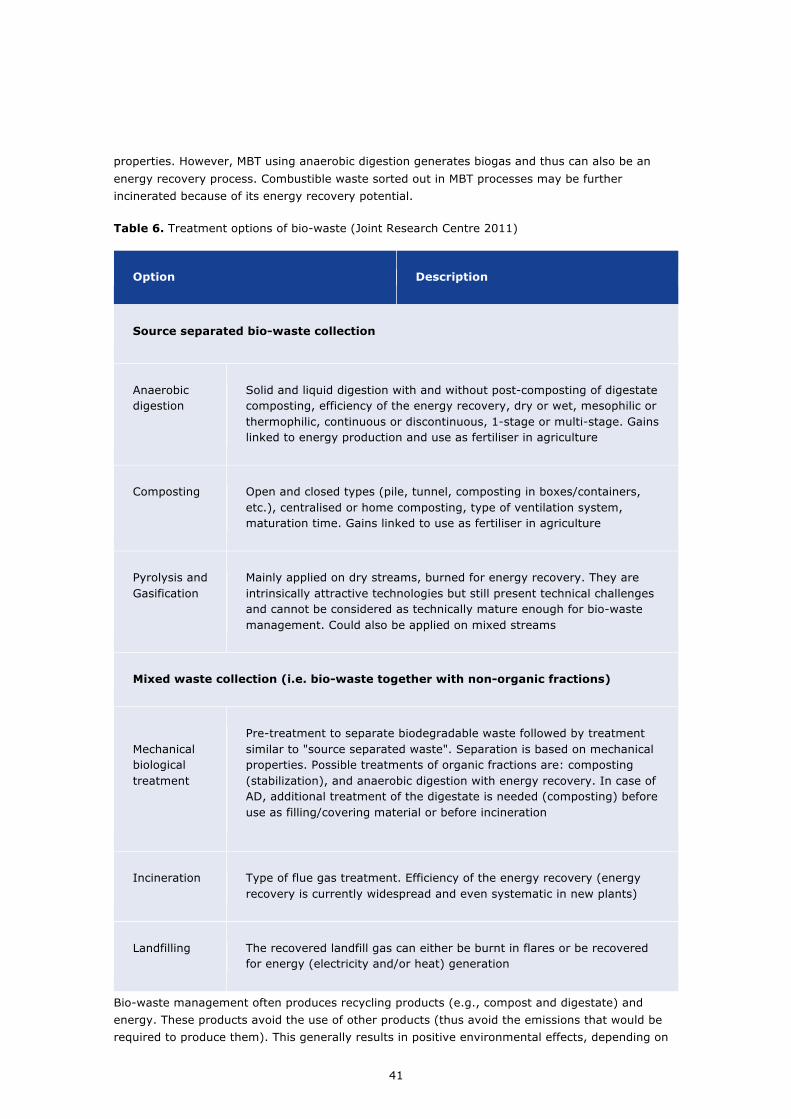
41
properties. However, MBT using anaerobic digestion generates biogas and thus can also be an energy recovery process. Combustible waste sorted out in MBT processes may be further incinerated because of its energy recovery potential.
Table 6. Treatment options of bio-waste (Joint Research Centre 2011)
Option Description
Source separated bio-waste collection
Anaerobic digestion
Solid and liquid digestion with and without post-composting of digestate composting, efficiency of the energy recovery, dry or wet, mesophilic or thermophilic, continuous or discontinuous, 1-stage or multi-stage. Gains linked to energy production and use as fertiliser in agriculture
Composting
Open and closed types (pile, tunnel, composting in boxes/containers, etc.), centralised or home composting, type of ventilation system, maturation time. Gains linked to use as fertiliser in agriculture
Pyrolysis and Gasification
Mainly applied on dry streams, burned for energy recovery. They are intrinsically attractive technologies but still present technical challenges and cannot be considered as technically mature enough for bio-waste management. Could also be applied on mixed streams
Mixed waste collection (i.e. bio-waste together with non-organic fractions)
Mechanical biological treatment
Pre-treatment to separate biodegradable waste followed by treatment similar to "source separated waste". Separation is based on mechanical properties. Possible treatments of organic fractions are: composting (stabilization), and anaerobic digestion with energy recovery. In case of AD, additional treatment of the digestate is needed (composting) before use as filling/covering material or before incineration
Incineration
Type of flue gas treatment. Efficiency of the energy recovery (energy recovery is currently widespread and even systematic in new plants)
Landfilling The recovered landfill gas can either be burnt in flares or be recovered for energy (electricity and/or heat) generation
Bio-waste management often produces recycling products (e.g., compost and digestate) and energy. These products avoid the use of other products (thus avoid the emissions that would be required to produce them). This generally results in positive environmental effects, depending on

42
the recovery processes. Table 7 lists the recovered products, energy recovery and related avoided products from bio-waste management. The different types of residues are also listed.
1.10. Drivers and barriers
The subject of MSW is a complex one whether being looked at from point of generation, collection or treatment. Municipal waste management in Europe has become more and more complex in the last decade. This complexity is due to some extent to the introduction of additional facilities for pre-treatment of waste, mainly sorting for recovery and mechanical biological treatment (Eurostat 2012). In EU context the Waste Framework Directive (2008) is a key legislative framework with a specific target for MSW ‘by 2020, the preparing for re-use and the recycling of waste materials such as at least paper, metal, plastic and glass from households shall be increased to a minimum of overall 50% by weight’.
Table 7. Recovered products, avoided products and waste of different treatment options (Joint Research Centre 2011)
Treatment Recovered products
Avoided products Remaining waste
Source separated bio-waste collection
Composting Digestate Composting digestate growing media (e.g. peat)
Residues, impurities
Anaerobic digestion
Biogas. Digestate (may be composted)
Electricity, heat, fertilizer, transport fuel
Residues, impurities
Mixed waste collection (i.e., bio-waste together with non-organic fractions)
Mechanical biological treatment
Biogas. RDF (Refuse Derived Fuel). CLO (Compost-like output)
Electricity, heat, soil cover, recyclable materials
Stabilized waste or digestate (to be composted), residues, impurities, recyclable metals, plastics, etc.
Incineration Energy Electricity, heat (also bottom ash used), recyclable materials

43
Treatment Recovered products
Avoided products Remaining waste
Landfill Biogas Electricity and/or heat (if methane is recovered), legal, illegal dumping
Leachate
For bio-waste specific measures are defined ‘Member States shall take measures, as appropriate, to encourage: (a) the separate collection of bio-waste with a view to the composting and digestion of bio-waste; (b) the treatment of bio-waste in a way that fulfils a high level of environmental protection; (c) the use of environmentally safe materials produced from bio-waste.’
As a result, EU Member States and many other countries following the requirements set out in EU legislation adopted strategies to shift their waste management up the waste hierarchy. EEA (2013a) showed that the EU MSW management landscape has changed significantly in the past decade. The analysis leads to the conclusion that significant progress has been made in some countries while other countries are lagging behind and are not expected to catch up in the short term.
The EU does not prescribe specific treatment options for biodegradable waste. In practice Member States are often inclined not to opt for composting or biogas production, and instead choose the seemingly easiest and cheapest option such as incineration or landfilling disregarding the actual environmental benefits and costs.
The following key findings presented by EEA (2013a) read as a mix of positive (realisations) and negative (opportunities) messages.
• (+) There are clear indications of a shift away from landfilling towards preferred waste management approaches. The number of countries that landfill more than 75% of municipal waste output decreased sharply, while the numbers recycling more than a quarter of their municipal waste recorded the opposite trend.
• (-) Nevertheless, the majority of countries still landfilled more than half of their municipal waste in 2010.
• (+) In general, there have been substantial increases in the proportion of municipal waste recycled. Twelve countries increased the percentage recycled by more than 10 percentage points between 2001 and 2010 and another ten achieved increases of 5–10 percentage points (calculated as a share of municipal waste generated).
• (-) In the remaining nine countries, however, the average increase was negligible and in five cases it was actually negative.
• (+) Progress in enhancing recycling rates is primarily due to trends in recycling of materials.
• (-) With bio waste recycling performing less well. There was little change in national bio-waste recycling rates. This suggests that, despite significant achievements in increasing material recycling in some countries, there is a need for greater focus on bio-waste recycling in line with the Waste Framework Directive's waste hierarchy.
• (+/-) Interestingly, in most of the countries where regional recycling data were available, there was substantial variation between different regions, indicating that regional and

44
local policies have a significant influence on municipal waste recycling rates. While EU targets and national targets are the overall drivers of better municipal waste management, regional and local implementation is crucial for achieving positive results. It also suggests that regions with high recycling rates could serve as good practice examples and become knowledge sharing platforms for other regions nationally and across Europe.
• (+) There is evidence of a clear correlation between the cost of landfilling and the share of municipal waste recycled in Member States, suggesting that landfill taxes can play an important role in incentivising a shift up the waste hierarchy. It is equally clear, however, that gate fees and regulatory restrictions also play an important role in shaping waste management decisions.
• Reflecting on past performance provides valuable insights into the chances of achieving the Waste Framework Directive's 50% municipal waste recycling target in 2020. Here, the outlook is certainly mixed.
• (+) Five countries have already achieved the target and another six will achieve it if they continue to improve their recycling rate at the same pace as in the period 2001–2010.
• (-) The majority of countries will need to make an extraordinary effort in order to achieve the target of 50% recycling by 2020. Nine countries need to increase their recycling rate yearly by 2–4 percentage points until 2020, a rate that only three European countries achieved between 2001 and 2010. A further seven countries need to achieve an unprecedented increase of more than 4 percentage points annually up to 2020.
• The benefits of shifting municipal waste management up the waste hierarchy are not limited to more efficient resource use and a reduced waste burden on the natural environment. Better waste management also offers a way to cut GHG emissions. Methane emissions from landfilling municipal waste have declined considerably in the past decade while the benefits from increased recycling have grown even more. These benefits in GHG emissions result from the fact that recycled materials replace virgin materials and thus reduce GHG emissions from primary production.
• (-) Analysis of municipal waste management is undermined by uncertainties about the comparability of national data. Countries use varying definitions of 'municipal solid waste'. To facilitate future analysis, steps are needed to harmonise national reporting methodologies, especially on the waste fractions to be included when reporting on municipal waste.
• (+) Finally, while EU legislation of the last two decades has certainly provided the driving force for better waste management in EEA member countries, a comparison of the landfilling and recycling rates across Europe underlines the importance of national and regional instruments. These include measures such as landfill bans on biodegradable waste or non pre-treated municipal waste, mandatory separate collection of municipal waste fractions, economic instruments such as landfill and incineration taxes, and waste collection fees giving incentives to recycling. In general, countries using a broad range of instruments have a higher municipal waste recycling rate than countries using very few or no instruments.
1.11. Options for improvement
Unquestionably, landfilling is the least preferable option for management of bio-waste. The most significant benefits of proper bio-waste management, aside from avoided GHG emissions, include generation of good quality compost and biogas that contribute to soil quality and resource

45
efficiency, as well as a higher level of energy self-sufficiency.
Several options exist for the sustainable management of biodegradable waste diverted from landfills. While the waste management hierarchy also applies to the management of bio-waste, in specific cases it may be justified to depart from it as the environmental balance of various options depends on local factors, inter alia collection systems, waste composition and quality, climatic conditions, and the potential of use of waste-derived products (electricity, heat, methane-rich gas, compost). Therefore, national waste management should be determined transparently using a structured and comprehensive approach such as Life Cycle Thinking (LCT). In order to assist decision-makers in making the best use of biodegradable waste in line with the waste hierarchy, the European Commission has prepared a set of guidelines on how to apply Life Cycle Assessment and Life Cycle Thinking to planning the management of bio-waste.
JRC-IES (2012) provided guidance to European, National and regional/local waste policy makers, waste managers, and businesses with the background to implement the WFD for bio-waste policy in a more sustainable way using Life Cycle Thinking (LCT) and Life Cycle Assessment (LCA) in support of sound decisions for bio-waste management. A number of different options for bio-waste management are considered (e.g., composting, anaerobic digestion, incineration) and guidance is given on how to assess and compare their environmental performance using a life cycle approach (EC JRC 2011).
Bio-waste is a source of material and energy. As the combined anaerobic digestion followed by composting of the digestate allows combining both benefits, it is likely to be the preferable environmental option in many instances (for non-contaminated bio-waste). Additionally, in comparing anaerobic digestion to direct composting, if the composition and the amount generated are similar, then the combined anaerobic digestion followed by composting of digestate is likely to be environmentally preferable to direct composting.
Options for the improvement of AD installation design, loading, and management have been discussed by Banks and Heaven (2013). An extensive knowledge of the digestion process, digestor management, and (nutrient) loading appears to be essential in order to realize the full potential of available biomass and manure feedstocks.
Logistical barriers for biogas chains are mostly related to issues of MSW collection and transportation. MSW collection and treatment in Europe has become more and more complex due to the introduction of pre-treatment facilities. EU member states and many other countries following the requirements set out in EU legislation adopted strategies to shift their waste management up the waste hierarchy. In practice, countries are often inclined to choose options such as incineration or land-filling.
Efficiency of waste collection and digestion can be improved at higher collection rates while a larger number of treatment facilities will help to reduce transportation costs. This will also apply to chains in other parts of the world.
In practice, the establishment of a carbon price, through a carbon tax or a cap-and-trade program, would lower the cost of using biogas relative to higher-carbon fossil alternatives. In doing so, a carbon price would also create an incentive for biogas production, and the resulting gas could be sold to the market at a price equal to the prevailing price of natural gas plus the carbon price associated with its consumption.
The UNEP Governing Council of February 2013, in its decision GC 27/12 on Chemicals and Waste Management, requested UNEP “to develop a global outlook of challenges, trends and policies in

46
relation to waste prevention, minimization and management, taking into account the materials life cycle, subject to the availability of extra-budgetary resources and in consultation with Governments and stakeholders, building on available data, best practices and success stories, taking into account the Global Chemicals Outlook and any other relevant initiatives and taking care not to duplicate existing information, to provide guidance for national policy planning.” The final document will be concluded within the first quarter of 2015 and the ground would be laid for subsequent update editions every three years (UNEP 2013).
The objectives of the Outlook are as follows.
• Position the global challenge of waste management as an area where action is needed and respond to the question why policy and decision makers should take such action.
• Demonstrate the relation of waste management to other global challenges such as sustainable development, sustainable production and consumption, prevention, minimisation and resource efficiency and recovery, climate change, food security, etc. and establish the links to wider health and environmental policy challenges.
• Identify effective and efficient policies and financing instruments for waste management, addressing the different stages of the waste hierarchy. In doing so, the levels of development in countries and the practices in use would be taken into account. Potential ways to move forward to the results that can be achieved would be identified, recognizing the needs of both developed and developing countries.
• Recognize the importance of, and the need for, sustainable financing for improved waste management and provide economic arguments for making the business case. By addressing the cost of inaction and win-win situations, the wider benefits of improved waste management would be demonstrated, such as poverty reduction, GDP growth and job creation, improvement of health conditions and environmental quality, and progress with climate change mitigation and resource efficiency.
• Complement and add value to previous publications on waste management by establishing a set of standardized policy indicators and benchmarks, in order to allow a better analysis of the state of waste management around the world, which would help to identify and address policy and resource gaps.

47
7. OIL PALM RESIDUE DIGESTION
This chapter discusses background, perspectives, barriers and options for further development of biogas production from oil palm residues.
1.12. Introduction
In the past four decades, the composition of the Indonesian economy has changed significantly. As with most economies in the region, it has shifted from a primarily agrarian economy towards the industry and services sectors. Nowadays, Indonesian production is largely dominated by industrial output, contributing nearly half to total economic activity. This is including the oil and gas sector, which contribute to over 10% of the GDP. The services sector and agriculture sector contribute 38% and 14%, respectively. The industrial sector relies on fossil fuels and, along with the household sector, dominates final energy consumption. The power sector currently is depending on coal in order to increase capacity and satisfy rapidly expanding electricity demand. Coal accounts for close to 70% of Indonesia’s power generation mix (IRG 2009).
Indonesia is particularly vulnerable to the impacts of climate change as its population and economic activity are concentrated close to its long coastlines, and as natural resources, agriculture and forestry are important sources of employment and economic growth (ADB 2009). Therefore, Indonesia has adopted emission reduction targets under the Copenhagen Accord, despite being classified as non-Annex I country in the United Nations Framework Convention on Climate Change.
Clean development mechanism (CDM) is an arrangement under the Kyoto Protocol allowing industrialised countries with a GHG reduction commitment to invest in emission reduction projects in developing countries. Both Malaysia and Indonesia, the main palm oil producing countries, fall in that category. Utilization of the methane gas recovered from anaerobic digestion of palm oil mill effluent (POME) for power generation allowed palm oil millers to earn extra revenue by participating in the program under the Kyoto protocol up to 2012. Energy production from biogas from POME, combustion of biomass residues (e.g. palm kernel shells or PKS), co-composting of empty fruit bunches (EFB) and POME, all reducing GHG emissions, were eligible as CDM projects.
For small CDM projects, e.g. biogas production from POME and subsequent co-composting of the digestate with EFB, the existing applications of AMS-III.I/Version 07 (“Avoidance of methane production in waste water treatment through replacement by aerobic systems”) was appropriate. Palm oil millers could trade the certified emission reductions (CERs) or carbon credits obtained from the renewable energy project. The implementation of CDM in Malaysia encouraged the development of POME anaerobic treatment. As of September 2012, 36 biogas recovery projects from the oil palm industry in Malaysia were registered with the CDM program (Chin et al. 2013). Unfortunately, the CDM program under Kyoto Protocol expired at the end of 2012.

48
1.13. Palm oil industry in Indonesia
In 2012, approximately 50 million tonnes of palm oil were produced globally. Growing demand for palm oil is driven by increasing human population, income growth as well as biodiesel stimulation programmes, and the demand is likely to further increase in coming years. The oil palm is credited with its high oil yield per unit area, the average oil yield per hectare is 3.7 tonne of palm oil compared to 0.6 tonne rapeseed oil and 0.36 tonne soya oil (Basiron 2007). Malaysia and Indonesia produce approximately 87% of the global palm oil (Carter et al. 2007).
In contrast to other biomass products, which are mainly consumed locally in the countries of production, palm oil is mainly exported (Yee et al. 2009). The production of palm oil in different countries is shown in Figure 20.
Figure 20. Global palm oil production from 2008 to 2012
Source: USDA Database
According to the FAO (FAO 2013), palm oil export from Indonesia and Malaysia is likely to increase further in the coming years. Figures for vegetable oil exports by country and type are shown in Figure 21 and Figure 22.
It is obvious from these figures that palm oil from Malaysia and Indonesia represents over 60% of the world’s vegetable oil export. Indonesia is the main palm oil producer and exporter. It exports approximately 70% of its palm oil and 87% of the domestic consumption is used as food (Santosa 2008). In certain regions, palm oil is the dominant estate crop and major contributor to economic development. In the past decade, the palm oil plantation areas of Kalimantan and Sulawesi have experienced strong development, averaging 13% and 8% annual growth rates, respectively.

49
Figure 21. Global export of vegetable oils from 2009/10 to 2013/14
Source: USDA Database 2014
The plantation and harvesting of oil palm is labour intensive, and the industry contributes a significant portion of employment in many rural areas. Despite this economic benefit there is also a social component. Manik conducted research in Jambi Province involving value chain actors, employees, local community members, and non-governmental organisation representatives. The consultation revealed that working conditions and cultural heritage are important social issues. Action at various policy levels is needed to improve social equitability among the stakeholders (Manik et al. 2013).
Figure 22. Global export of vegetable oils from 2009/10 to 2013/14 (March)
The competition for palm oil between food, feedstock for chemicals and biodiesel applications has put it in the limelight resulting in a controversial world-wide debate (Reijnders and Huijbregts

50
2008; de Vries 2008; Verwer 2008; Verwer et al. 2008; Basiron and Kheong 2009). By replacing tropical forests, new palm plantations provoke the killing of endangered species, uprooting of local communities, and release of huge amounts of GHG. Due to land use change, Indonesia emits more greenhouse gases than any other country, besides China and the United States.
Indonesia's plantation sector has come under further scrutiny in 2013 in the wake of forest-burning in Sumatra that caused one of Southeast Asia's worst air-pollution crises, with record levels of smog blanketing neighbouring Singapore and Malaysia. Apart from ensuring sustainable land use change, the use of residues is the most important criterion in ensuring sustainable palm oil (Hansen et al. 2012). Residue management is also one of the key factors for GHG emission reduction of the palm oil industry.
1.14. Palm oil production
The production of one tonne of crude palm oil requires five tonne of fresh fruit bunches (FFB). Further, some 3.8 tonnes of stems and 14 tonnes of fronds are generated per tonne of FFB; most remain on the plantation in order to recycle nutrients, improve soil quality and avoid soil erosion (Schmidt 2007).
On average, processing of 1 tonne of FFB in palm oil mills generates 0.23 tonnes of Empty Fruit Bunches (EFB) and 0.65 tonnes of Palm Oil Mill Effluent (POME). The latter is well suited for biogas production (Yoshizaki et al. 2013; Wulfert et al. 2002; Lam and Lee 2011). Additionally, 0.14 tonnes of fibres and 0.05 tonnes of nut shells are also generated. These are mainly used on-site to cover the heat and electricity demand of the oil mills (Stichnothe and Schuchardt 2011). More than 650 oil mills are operating in Indonesia with an installed processing capacity of approximately 35 tonne of FFB per hour. The annual potential of residues from Palm Oil Mills (POM’s) in Indonesia is shown in Figure 23.
Figure 23. Annual potential of residues from palm oil production in Indonesia based on production figures from 2012. Abbreviations are explained in the text.

51
Most POMs are located in North Sumatra and Riau, and a significant number are also located in South Sumatra, Aceh, Jambi, and in East and South Kalimantan. Most treat POME in a series of open ponds. The first pond is always anaerobic and the second either anaerobic or aerobic. The ponds have no bottom liner thus resulting in leakage to groundwater and methane emissions to the atmosphere. Yacob reports methane emissions of 1,043 kg per day for each pond (Yacob et al. 2006a) and if not captured, this amount is released to the atmosphere. Less than 5% of the mills in Indonesia apply methane capture. The biogas of captured ponds is frequently flared but rarely used.
POME degrading microorganisms can be isolated from POME and used in anaerobic digesters. The biogas yield depends mainly on COD concentration and residence time in the reactor. Numerous authors investigated biogas yield from POME in different countries, at different locations and harvest periods (Basri et al. 2010; Schuchardt et al. 2002; Poh et al. 2010; Poh and Chong 2009; Ismail et al. 2010; Ugoji 1997; Yacob et al. 2006b; Shirai et al. 2005; Wang et al. 2015). In North Sumatra just 3 POMs apply methane capture, only one of which is utilising POME for biogas production. The treated POME has frequently still a COD value between 1,000 and 8,000 mg per litre, well above the allowed values. Therefore, treated POME is also applied on the land, although irrigating palm oil plantation is usually not required.
In most cases, EFBs are returned to the palm oil plantation where they are used for mulching. Sometimes, however, they are dumped. Long degradation time, harbouring of snakes, high costs associated in their transportation and distribution are some of the problems faced with EFB mulching (Sunitha and Varghese 1999, 2009). There are no official dumping sites; if EFB are disposed then it is in 5-10 km distance from the oil mill. Transportation costs are estimated at €0.1/(tonne*km). Treatment costs for effluent (POME) are difficult to assess as they depend on a number of factors. POME often is considered as a profitable but mostly un-tapped feedstock for biogas production. Data from Chin et al. (2013) suggest a 60 tonne FFB/hour palm oil mill in Malaysia produces 234,000 m3 of POME per year, containing 2,400 tonnes of methane. This could generate 13 million kWh of electricity which would --assuming a feed-in tariff of US$0.08/kWh -- representing over US$1 million of electricity sales per year. Net profit would be US$4/m3 of POME.
EFB is not commonly used as boiler fuel due to its high moisture content and moderate calorific value (4 -5 MJ/kg) (Hansen et al. 2012; Budiharjo 2010). Before its use, EFB should be shredded, pressed and dried for 2-3 days. This may result in significantly higher processing costs but transport costs are reduced. Likewise, EFB has the potential to be used in biogas plants but it is not the most wanted feedstock due to its high lignin content and the associated problems.
Generally, cost benefit analysis for POME treatment systems utilising biogas for electricity production suggests investments in AD installations can be recovered within a period of five years (Schuchardt et al. 2008; Chin et al. 2013; Jala et al. 2014).
In downstream processes such as refining of CPO and biodiesel production, oil-rich bleaching earth and palm fatty acid distillate is generated (Ng et al. 2011; Hansen et al. 2012). Of these, spent bleaching earth can be applied in biogas plants to increase methane yield. The produced biogas can be converted to electricity or (after purification) injected into the national gas grid. An established market exists already for palm fatty acid distillate, which is used as feedstock in oleo-chemical industry and animal feed industry (Santosa 2008).
Palm oil residues are produced throughout the year and thus can be considered as major crop residues for power production, particularly in rural areas. Oil palm plantations provide jobs for 3.8 million workers, including 2 million for small holders. Palm oil mills employ approximately 150,000 workers; the downstream processing industry (cooking oil factories, oleo-chemistry, biodiesel

52
production, etc.) employing another 50,000. Given the importance of palm oil for the national economy, the Indonesian policy on renewable energy is closely linked to its development particularly as a way to improve living standards and welfare in rural areas. In the long-term, renewable energy development, such as biogas from residues of the palm oil industry, may significantly contribute to a sustainable national energy supply. However, currently still over 70 million Indonesians (about one-third of the population) lack access to electricity.
The promotion of renewable energy sources as a contribution to the national power supply falls primarily within the responsibility of Indonesia’s Ministry of Energy and Mineral Resources (MoEMR). Within MoEMR, the Directorate General of Electricity and Energy Utilization (DGEEU) is responsible for the design of promotion programs in the renewable energies sector and the advancement of rural electrification. The organisation of the electricity sector in Indonesia is shown in Figure 24.
Figure 24. Organisation of the Indonesian electricity sector
The potential of bioenergy in Indonesia is estimated at some 50,000 MW, of which just 3.5% was installed in 2010. The installed capacity from palm oil residues in 2012 was just 61 MW. However, electricity from palm oil residues is scheduled increase strongly.
Biogas production from oil palm residues is associated with a very favourable GHG budget. Closed tank digestion prevents spontaneous methane emissions from empty fruit bunch decomposition as well as commonly applied open POME ponds. One cubic metre of POME can cause up to 12 m³ methane emissions, equal to approximately 200 kg CO2-eq. As worst case EFB is dumped which cause GHG-emissions equivalent to 1,000 kg CO2-eq per tonne. Consequently, using residues of palm oil mills for biogas production is economically and environmentally beneficial while it saves fossil resources.

53
1.15. Drivers and barriers
1.1.11. Drivers The basis for renewable energy development is Presidential Regulation No. 5/2006 on National Energy Policy which guides the Energy Blueprint issued by the MoEMR. The details of the energy programs and targets of the National Energy Policy are elaborated in the Blue Print - National Energy Management 2005 to 2025, which gives special emphasis on enhancing the share of biofuels. A special Biofuel Decree (MoEMR Regulation No. 32/2008) settles a mandatory utilization framework in the transportation, industrial, commercial and power generation sectors for biodiesel, bioethanol and bio-oil up to 2025. In February 2009, the Indonesian government announced that it would establish a biofuels subsidy to encourage investment in, and use of, biofuels made from palm oil and other feedstock. The subsidy would only be paid if biofuel prices are higher than crude oil-based fuels.
The multilateral Clean Technology Fund (CTF) aims to accelerate the country’s initiatives to promote energy efficiency and renewable energy, and to help achieve the objective of increasing the electrification rate from 65% to 90% in 2020 as well as the long-term goal of reducing GHG emissions with 26% by 2020.
Electricity Law No. 30/2009 was introduced to secure sustainable energy supply, promote conservation and the use of renewable energy resources. The regulation, issued by MoEMR, is referred to as "Purchasing Price by PT PLN of Generated Electricity from Small and Medium Scale Renewable Energy Power Plant or Excess Power”. Its aim is to enhance electricity generation by small and medium scale of renewable energy power plants, excess power to be purchased by state owned companies, regional owned companies, and cooperatives.
The 2006 Presidential Regulation was updated in 2009, when Ordinance No. 31/2009, set national targets for an optimal energy mix. Renewable energy is to increase to 25% of the national energy mix in 2025. To achieve this, primary and supporting policies have been defined. The former pertain to energy supply, energy utilization, determination of energy costs, and environmental conservation.
Indonesia introduced a progressive palm export tax system aiming to boost downstream industries, secure domestic supplies and reduce volatility in cooking oil prices. Recently, a target was set for clean cooking facilities, and a plan to increase the share of households using cooking gas to 85% by 2015 up from only 45% today (IEA 2013).
According to regulation 31/2009, the national electricity supplier (PLN) has to purchase electricity up to 10MW from independent private producers (IPP). The feed-in tariffs that are to be offered vary among different regions in Indonesia. Table 8 provides feed-in tariffs for electricity from biomass and biogas in three regions.

54
Table 8. Feed-in tariffs for electricity from biomass and biogas according to regulation 31/2009
Region Feed-in tariff (IDR/kWh)
Java, Bali, Sumatra
Kalimantan, Sulawesi, Nusa Tenggara
Maliku, Papua
975
1,170
1,268
Indonesian oil demand is 1.75 million barrels per day, about half of which is produced domestically. Imported oil and fuels are used to fill the production gap. In order to increase domestic security of fuel supply, the Indonesian government has launched an ambitious program to replace fuel imports by biodiesel and pure palm oil. In 2013, regulation No. 32/2008 was replaced with regulation No. 25/2013, setting even more ambitious targets for biodiesel and pure vegetable oil use. Targets are shown in Tables 9 and 10.
Table 9. Stages of mandate for the use of biodiesel (B100) as mixture with fossil fuels
Sector Sept 2013
Jan 2014
Jan 2015
Jan 2016
Jan 2020
Jan 2025
Household
Transport (public)
Transport (non-public) Industries
Electricity generation
-
10%
3% 5%
7.5%
-
10%
10% 10%
20%
-
10%
10% 10%
25%
-
20%
20% 20%
30%
-
20%
20% 20%
30%
-
25%
25% 25%
30%
Biodiesel consumption in Indonesia increased from 0.13 million litres in 2009 to 0.5 million in 2013 and is expected to reach 4 million litres in 2014, due to regulation No. 25/2013. The demand for biodiesel is projected to increase to more than 9 million litres in 2016. There is a huge gap between national biodiesel supply and demand up to 2025, which requires large investments while providing investment opportunities in biofuel projects.

55
Table 10. Stages of mandate for pure vegetable oil used in mixtures with fossil fuels
Sector Sept 2013
Jan 2014
Jan 2015
Jan 2016
Jan 2020
Jan 2025
Household
Transport (public)
Transport (non-public) Industries
Electricity generation
-
1%
- -
1%
-
5%
5% -
6%
-
10%
10% -
15%
-
20%
20% 2%
20%
-
20%
20% 3%
20%
-
20%
25% 5%
20%
The Indonesian Master plan of Economic Development Extension and Acceleration (MP3EI) is a strategic initiative to foster the development of industrial palm oil clusters and improve collaboration between stakeholders within and associated with the industry.
1.1.12. Barriers Despite the incentives and supporting activities, bioenergy development in Indonesia is facing a number of challenges, such as regulatory inconsistency, getting bank loans, corruption, etc. Several of these are interdependent and therefore tackling the core of the issues is important if the speed of biomass utilization in Indonesia is to accelerate. Regulations are not always straightforward, e.g. foreign investors in Indonesia need a prior recommendation from MoEMR before they can apply for investment registration with the Investment Coordination Board while regional Sub-regencies need to confirm the registered office. Several other permits from various authorities are required before a permanent business license is granted.
Attainment of biomass mobilisation and biogas development is hampered by institutional, technical, social and financial barriers. The most relevant barriers are as follows.
1) Political and regulatory systems
i) The political and regulatory systems in Indonesia contain many loopholes while lacking integration or coherency. Policies, financials, and programs to encourage biomass utilization lack uniformity between the national government and regional and local administrations.
2) Policy
i) The political and regulatory systems in Indonesia contain many loopholes while lacking integration or coherency. Policies, financials, and programs to encourage biomass utilization lack uniformity between the national central government and regional and local administrations.
ii) Despite the establishment of a broad regulatory framework clear mechanisms on renewable energy technology development are still missing.
iii) Both central government and sub-national governments lack the capacity to formulate and effectively implement policies and regulations.

56
iv) Theoretically, tax exemptions and reduced import tariffs for biomass technology equipment are available, but in practice investors face various challenges due to continuous changes in the respective regulations.
v) Fossil-based electricity subsidies hamper development of bioenergy while consuming urgently needed financial resources. They were introduced to help the poor but cause a serious market distortion as they encourage wasteful energy use, burden government budgets, and deter investment in energy infrastructure and efficient technologies. Subsidy policy is politically sensitive; pace and ambition of its reform is dictated by political realities and electoral cycles.
vi) Regulation No. 25/2013 is setup to reduce fuel imports. However, no penalty is stated for sectors that do not meet mandatory targets. Hence, the achievement of the targets will depend on the ratio of market prices for fuels and palm oil.
3) Technology
i) Plantations are frequently located in remote areas and far away from the public grid. It is not possible to sell electricity without connection to the PLN-net.
ii) Palm oil mill owners are still reluctant to venture into higher efficiency technologies such as covered anaerobic ponds due to cheaper operating costs and ease of operation of the existing systems.
iii) Lack of domestic capacity for operating and maintaining biogas and CHP-plants hamper the implementation of biogas fed bioenergy systems.
iv) Lack of successful demonstration models. There are just a few precedents beyond existing inefficient biomass CHP systems operating in the palm oil industry.
v) Ensuring stability within the national electricity grid is a challenge if various private electricity producers feed in their surplus electricity.
4) Perception and awareness
i) There is the misconception that the technology (biogas and CHP) is unproven.
ii) There is belief that the industry lacks the requisite technical ability.
iii) There are no restrictions on the release of biogas/methane into the atmosphere but there are for the COD-content in waste water. Consequently, POME is still considered as a waste rather than a resource.
iv) Biomass is perceived as regressive in a modernizing industrial economy.
5) Finance
i) Demand for electricity in Indonesia triples between 2011 and 2035, assuming

57
an annual growth of 4.8%. There is a large shift towards coal-fired generation, driven by its relative low cost and abundance: coal’s share rising from 44% to 66%. Contrary to feed-in tariffs for electricity, there is no incentive in place to support up-grading biogas and connecting biogas sites with the national grid.
ii) Bioenergy projects are perceived as high risk investments due to the lack of successful models to demonstrate viability.
iii) Banks in Indonesia are not familiar with “green energy projects”, hence it is difficult to get loans, particularly for small and medium enterprises.
iv) The infrastructure for biomass logistics as well as grid connection is frequently insufficient so that high investment in not-core business areas is required.
v) Low planning security for investors hampers private investment.
vi) The CDM program of the Kyoto Protocol expired in 2012; projects approved after 2012 are barred from exporting CERs to Europe's emissions Trading Scheme. This reduces income for the development of new biogas plants. CDM projects accepted in or before 2012 will be prolonged to mid-2015.
1.1.13. Opportunities Demand for electricity in Indonesia is expected to triple between 2011 and 2035. While there is merit in using untreated biogas to produce electricity and heat, a lot of energy is wasted during heat production. By upgrading biogas to biomethane quality (comparable to natural gas), it can be injected into the national gas grid or compressed and used as transport fuel. Biogas gas can also play a role in covering the electricity demand if the distribution infrastructure improves. Power plants that were initially designed to run on gas but currently run on oil could be fed with purified biogas respectively.
The Indonesian Palm Oil Research Institute (IOPRI) has conducted a survey in North Sumatra, where 107 POMs are located. Some 62% of them process between 100,000 and 200,000 tonnes of FFB annually, thereby generating 0.4 – 0.9 m³ POME per tonne of FFB with a COD value between 40,000 and 75,000 mg per litre (IOPRI 2012). The characteristics of POME depend on a number of factors such as harvest region and time but also the technique applied at the POM. POME requires effective treatment before its discharge into watercourses due to its highly polluting properties. Discharge limit values for POME in Indonesia are shown in Table 11.
Table 11. Discharge limit values for POME
Parameter Value Unit
Biological oxygen demand (BOD)
Chemical Oxygen Demand (CODsus) Total suspended Solids (TSS)
Total Nitrogen (Ntot)
100
350 250
50
mg l-1
mg l-1 mg l-1
mg l-1

58
Parameter Value Unit
Oil/grease
pH
25
6 - 9
mg l-1
mg l-1
The amount of POME generated depends on the techniques applied. Most POMs apply conventional batch sterilisation and a combination of vertical clarifier and separators, which need additional water for oil recovery. Modern technologies do not require additional water. The amount of POME generated by different techniques is shown in Table 12.
Table 12. POME and sludge from conventional and "new" palm oil mills 1
Parameter POM Conventional "New POM"
Batch sterilisation
Batch
Sterili-sation + zero dilution
Continuous
sterilisation + zero dilution
Sterilizer condensate
Clarification sludge
Sum POME+slurry Dilution water
POME+slurry
m³/tonne FFB
m³/tonne FFB
m³/tonne FFB m³/tonne FFB
% DM
0.20
0.45
0.65 0.20
4-5
0.20
0.25
0.45 0
10
0
0.25
0.25 0
17
1 Cooling water is not taken into account because it is reused in the mill; cleaning water is not taken into account because the amount is negligible
The amount of POME to be treated determines the size of the post-treatment units (e.g. ponds, biogas plant, co-composting plant), thus, treatment costs. The total amount of POME can be reduced by different technologies but the organic load and thus the biogas production potential remains almost the same. The amount of methane produced can be estimated from the COD or BOD concentration by using IPCC or CDM default factors. Table 13 presents methane yield per tonne of FFB from different literature sources.
Methane concentration in POME biogas exceeds 60%. Methane yield ranges between 4.5 and 9 kg per tonne of FFB, with an average value of 6.9 kg methane per tonne. When using the annual production figure for 2012, 966,000 tonnes of methane is generated, but a substantial proportion is released to the environment. The total amount of methane from POME equals 48 PJ based on production statistics for 2012. It might be even more interesting to look at the energy potential of

59
typical POMs rather than the national figure because POMs are located at different islands sometimes a large distance from the national grid. Consequently, the technologically and economically feasible potential is smaller than the total.
Typical capacities of POMs in Indonesia are 30, 45, 60, and 90 tonnes FFB per hour (IOPRI 2012). Operating on average some 20 h per day for 250 – 300 day per year POMs have an annual capacity of approximately 150,000 tonnes of FFB, generating a substantial amount of residues. The amount of residues and their energy content is calculated using the figures provided above. Results are shown in Table 14.
Table 13. Methane emissions from POME in open ponds, literature data and IPCC default values (IPCC 2006) for industrial and domestic waste water respectively
Reference m³ CH4
m-³ POME
m³ CH4
t-1 FFB kg CH4 t-1 FFB
Remarks
Damen and Faaij, (2007)*
18.2 12.7 9.1 0.7 m³ POME/ tonne of FFB; 28 m³ biogas with 65% CH4
ERIA (2007) 18.2 12.7 9.1 0.7 m³ POME/ tonne of FFB; 28 m³ biogas with 65% CH4
Ng et al. (2011) 18.2 11.8 8.4 28 m³ biogas with 65% CH4; 0.65 m³ POME/ tonne of FFB is assumed
Vijaya et al. (2008)
18.2 11.8 8.4 0.65 m³ POME/ tonne of FFB is assumed
Yacob et al. (2006b)
17.3 8.5 6.1 open ponds; 0.493 m³ POME/ tonne of FFB; COD 55,990 mg/L
Chuchuoy et al. (2009)
14.0 9.1 6.5 20 m³ Biogas/m³ POME with 70% CH4; 0.65 m³ POME/ tonne of FFB is assumed
Schuchardt et al. (2010)
12.5 8.1 5.8 0.65 m³ POME/ tonne of FFB with 65% CH4

60
Reference m³ CH4
m-³ POME
m³ CH4
t-1 FFB kg CH4 t-1 FFB
Remarks
Chavalparit et al. (2006)
9.4 6.1 4.4 0.65 m³ POME/ tonne of FFB with 65% CH4 is assumed
Wulfert et al. (2002)
8.7/ 12.5
5.7/8.1 4.1/5.8 Fixed bed-reactor/ponds
IPCC default values (IPCC 2006)
- 9.1 6.5 Bo =0.25 kg CH4/kg COD; MCFj 0.8; CODtot= 32.5 kg/ tonne of FFB
IPCC default values (IPCC 2006)
- 11.4 8.1 Bo =0.25 kg CH4/kg COD; MCFj =1.0; CODtot= 32.5 kg/ tonne of FFB
AMS III.H./Version 16
- 8.1 5.8 B0= 0.25 kg CH4/kg COD
AMS III.H./Version 16
- 9.7 6.9 B0=0.60 kg CH4/kg BOD
*Cited in Brinkmann (2009)
The estimated energy demand for an average POM is 165 TJ heat and 11.9 TJ electricity per year (Schuchardt et al. 2008). The energy demand of the POM can be covered by fibres generated during oil production alone, provided the conversion efficiency is around 75%. However, POMs in North Sumatra utilise 100% of fibres and 50-95% shells produced.
Hence, current technology is deliberately designed to be inefficient as it serves a dual function: energy production and reduction of solid waste (Golders Associates 2006). The design originates from a typical steam power plant where the main driver is steam generation. Modern combined heat and power (CHP) plants operate with efficiency up to 90%.

61
Table 14. Quantity and energy content of residues in a POM having a capacity of 30 tonnes of FFB per hour
Mass content (tonne/year)
Moisture (%)
LCV (GJ/tonne)
Energy (TJ)
Fibres
Shells
EFB POME
21,000
8,200
35,000 97,500
40
25
65 >95
11
13
4-5
231
110
154 32
Biogas production from EFB has been investigated under thermophiilic (Hansen et al. 2012) and Mesophiilic (Paepatung 2009) conditions. The methane potential from EFB is around 80 kg per tonne EFB in both cases, although the retention time was considerably different. Co-digestion of EFB with POME considerably reduces the retention time to values below 21 or 90 days as suggested by Henson and Paepatung. A precautious assumption is that 50 - 80% of the biogas potential from EFB could be realised. In 2012 approx. 32 million tonnes EFB were produced, which equals between 1.2 – 2 million tonnes methane or 60 – 100 PJ. However, using EFB as feedstock in biogas plants is still in its infancy.
Co-composting of EFB and POME substantially reduces methane emissions and foul smell from anaerobic waste ponds of the oil palm mills, while recovering a significant amount of nutrients (Norhasmillah et al. 2013). Digesting POME allows the digestate to be composted with EFB at the mill, so that these are stabilised under controlled conditions (Yahya et al. 2010). Afterwards the produced compost can be applied to the plantation field or sold (Singh et al. 2010; Schuchardt et al., 2005). According to Yoshizaki, who investigated the economic viability of biogas production from POME and subsequent composting of the digestate with EFB (Yoshizaki et al. 2013), this integrated approach is the most economically effective.
The combination of biogas production and subsequent composting still is economically viable without CDM. Using compost can reduce environmental impacts (Stichnothe and Schuchardt 2010) and enhance economic benefit in the palm oil industry (Chiew and Shimada 2013; Yahya et al. 2010; Schuchardt et al. 2008). The co-composting process acts as biological drying process for POME or digestate. However, a certain amount of biodegradable material is required for composting to generate sufficient heat for evaporating water (drying POME/digestate).
EFB provides sufficient biodegradable biomass; but if EFB is completely used for energy production either POME or digestate from biogas plants remains. Remaining POME and digestate must be treated before it can be released into the environment and that causes GHG emissions and most likely cause other environmental burdens. It is important to notice that there are trade-offs between maximising energy production, other environmental impacts and sustaining soil fertility.
Despite the potential of POME and EFB as an energy source, a lacking demand for heat and the barriers described hamper their utilisation in Indonesia. At present the most promising approach to utilise abundant biomass residues of palm oil mills is to add CPO refining and biodiesel production to POMs because in 2006 the Indonesian Government has set the aim to become the world’s largest biodiesel producer. Biodiesel production is energy-, particularly heat-intensive.

62
The following analysis is conducted to estimate the product/by-product mix and electricity output, when refining palm oil and producing biodiesel is applied for a POM having an annual capacity of 150,000 tonnes of FFB. It is assumed that biogas is produced from POME and converted in a CHP plant with a total efficiency of 84% (43% heat and 41% electricity). The remaining digestate from the biogas plant is composted with EFB and compost is returned to the plantation. Moreover all shells are used in the existing boiler and all produced heat is used on-site for CPO refining and biodiesel production; surplus electricity is exported. The heat and electricity demand for the refining and esterification process is taken from Annex V of the Renewable Energy Directive (Council of the European Union (2009)). The system design and relevant product and energy flows are shown in Figure 25 for a typical POM.
Figure 25. Heat optimised system for producing palm oil biodiesel
The combined palm oil and biodiesel production would produce refined palm oil, biodiesel and surplus electricity at which spent bleaching earth, Palm Fatty Acid Distillate (PFAD) and glycerol occur as by-products. The spent bleaching earth can be added to the biogas fermenter in order to increase biogas yield. PFAD is a light brown solid at room temperature which currently is used for soap and animal feed but also could serve as feedstock for the oleochemical industry. PFAD contains a significant amount of vitamin E that can be extracted (Santosa 2008).
The produced biodiesel has significantly lower GHG emissions than biodiesel from European feedstock as long as good management practice is applied at all stages of the value chain (Stichnothe et al. 2014). GHG savings from palm oil biodiesel can approach 60-80% depending on whether credits for surplus electricity are taken into account. However, particularly small capacity biodiesel plants (<10,000 tonnes per year) require additional revenues apart from biodiesel-derived profits, as they cannot economically survive due to high cost of raw materials.
Purified glycerol from biodiesel production is already a marketable product. However, huge biodiesel production leads to huge glycerol quantities that the market might not be able to adsorb or the price for glycerol declines. If biodiesel targets are fulfilled in Indonesia, then the amount of glycerol will increase from 10,000 tonnes in 2009 to 750,000 tonnes in 2016. Vlysidis has

63
conducted a techno-economic analysis of biodiesel refineries (Vlysidis et al. 2011), their results indicate the importance of glycerol when it is utilised as a key building block for the production of commodity chemicals. Glycerol can also be used as feedstock for various fermentation processes. Some chemicals that can be produced from glycerol are shown in Figure 26.
Figure 26. Most promising chemicals from glycerol
Several authors used an integrated biorefinery approach to boost downstream processing of palm oil by utilising organic residues (Berrios et al. 2010; Gutiérrez et al. 2009; Yamada et al. 2010; Lim and Lee 2011; Kosugi et al. 2010; Hassan et al.,2013; Rincón et al. 2014). Ofori-Boateng investigated the feasibility to use fronds as feedstock for second generation bioethanol and phenolic compounds (vanillic acid, gallic acid, etc.) at laboratory scale (Ofori-Boateng et al. 2014). Results suggest, however, that the thermo-environmental performance of integrated palm biorefineries producing biodiesel, bioethanol and phenolic compounds simultaneously is not impressive (Ofori-Boateng and Lee 2013, 2014).
Oil palm stems are potentially available as an energy source, a replacement of low quality wood or as feedstock for second generation ethanol production. They could serve as feedstock for syngas using gasification technology, subsequently being converted into methanol, which may replace fossil-based methanol in biodiesel production. However, under current market conditions the conversion of fronds and stems to bioethanol seems economically not feasible. The conversion of fronds into an ingredient of animal feed is currently under investigation in order to provide additional fodder for domestic cattle production. Indonesia’s meat imports are growing due to increasing population and changing diets.
Table 15 presents residues at different life cycle stages of palm oil and palm biodiesel plus their current as well as prospective utilisation pathways. It is important to notice that there are trade-offs between maximising energy production, reducing environmental impacts others than GHG and sustaining soil fertility. The collection of fronds is labour and transport intensive, suggesting that the main part of fronds should remain on the plantation in order to maintain soil fertility, recover nutrients and reduce soil erosion.
Surplus fronds, stems and shells are potentially available for utilisation in an industrial ecology approach with biodiesel production as core component. POME should be used for biogas production in order to generate energy and to reduce potential GHG emissions from palm oil and palm biodiesel production. The remaining digestate can cause environmental problems if it is released into the environment. Biological drying by co-composting of the digestate and EFB currently seems to be the best option. However, not the total amount of EFB produced is necessarily required for that purpose. Depending on the sterilisation and separation techniques applied in a POM, a considerable amount of EFB might become available for biogas production or
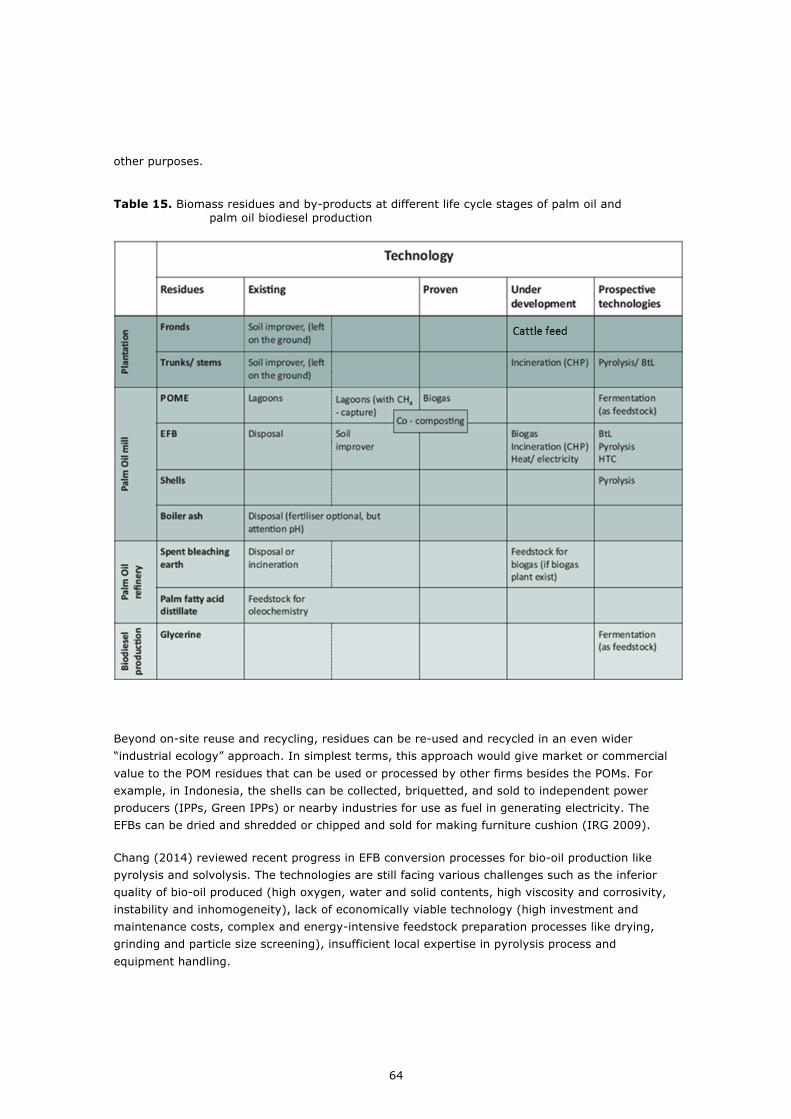
64
other purposes.
Table 15. Biomass residues and by-products at different life cycle stages of palm oil and
palm oil biodiesel production
Beyond on-site reuse and recycling, residues can be re-used and recycled in an even wider “industrial ecology” approach. In simplest terms, this approach would give market or commercial value to the POM residues that can be used or processed by other firms besides the POMs. For example, in Indonesia, the shells can be collected, briquetted, and sold to independent power producers (IPPs, Green IPPs) or nearby industries for use as fuel in generating electricity. The EFBs can be dried and shredded or chipped and sold for making furniture cushion (IRG 2009).
Chang (2014) reviewed recent progress in EFB conversion processes for bio-oil production like pyrolysis and solvolysis. The technologies are still facing various challenges such as the inferior quality of bio-oil produced (high oxygen, water and solid contents, high viscosity and corrosivity, instability and inhomogeneity), lack of economically viable technology (high investment and maintenance costs, complex and energy-intensive feedstock preparation processes like drying, grinding and particle size screening), insufficient local expertise in pyrolysis process and equipment handling.

65
1.16. Outlook to 2050
The world population is currently estimated at 7 billion. This is predicted to increase to 8 billion in 2025 and 9.6 billion by 2050. Total annual vegetable oil demand is predicted to double between 2010 and 2050, from 120 to 240 million tonnes. As for palm oil, total demand is projected to increase from the current level of 51 million tonnes to 75 million tonnes by 2050 (Henriksson 2012). Matching the predicted demand can be achieved by area expansion and/or yield increase. Ensuring national food security will probably be the main driving force for increased palm oil production in Africa and South America, although Malaysia and Indonesia will remain the main exporters of palm oil.
In Malaysia only 0.6 million ha are available for additional oil palm plantations, while the Indonesian government's own land capability survey indicated that up to 24.5 million hectares are suitable for oil palm cultivation. However, area expansion for oil palm plantation is perceived as closely linked to illegal logging, deforestation and diminishing biodiversity (Henriksson 2012). Therefore, the Indonesian government has restricted area expansion for oil palm plantations and encouraged the use of idle, degraded, and other marginal land. In 2013, the total area devoted to oil palm plantations is estimated at 10.8 million ha, with mature “harvested” area at 8.1 million ha. Mature area is forecast to increase roughly 6% compared to 2013; or 430,000 ha.
CPO yield is currently 3.5 tonne CPO per ha, while the yield potential is between 6 and 7 tonne CPO per ha. If yield increases to more than 6 tonne CPO per ha, the existing plantation area in Indonesia and Malaysia would be sufficient to cover the forecasted demand for palm oil until 2050. However, the total biogas potential from residues of palm oil production systems will not increase proportionally under these circumstances. Yield improvement and targets for palm oil as feedstock for domestic energy production will govern the amount of organic residues and POME in the coming decades.
Depleting oil resources in Indonesia and increasing crude oil prices may lead to dedicated oil palm plantations to ensure long-term national energy security. It has been estimated that the Indonesian palm oil industry collectively possess approximately 6 to 7 million ha of undeveloped land in its existing land bank. This land could be used for energy-dedicated plantations in the future, which would also increase the amount of residues by approximately 50%.
1.17. Conclusion
Palm oil is the dominant estate crop and major contributor to economic development in some regions of Indonesia. The cultivation and harvesting of oil palm is labour intensive, and provides a significant fraction of jobs in many rural areas, employing approximately 4 million Indonesia workers. Given the importance of palm oil to the national economy, the Indonesian policy on renewable energy is closely linked with its development, particularly as a way to improve living standards and welfare in rural areas.
In 2013, the total area devoted to oil palm plantations was estimated at 10.8 million ha. Palm oil residues are produced throughout the year and thus can be considered as major crop residues for power production, particularly in rural areas. The most suitable feedstock for biogas production is POME. Based on 2012 palm oil production data, approx. 30 PJ could be produced from POME. Likewise, EFB has the potential to be used in biogas plants, but its utilisation for biogas production is still in its infancy due to its high lignin content and associated issues.

66
In 2012, approximately 32 million tonnes EFB were produced, which equals between 1.2 – 2 million tonnes methane or 60 – 100 PJ. Other biomass residues, such as trunks, fronds, mesocarb fibres and by-products from downstream processing of CPO are potentially available for bioenergy production. However, it is important to note that there are trade-offs (e.g. between maximising bioenergy production, reducing environmental impacts other than GHG, and sustaining soil fertility).
Demand for electricity is expected to triple between 2011 and 2035. National regulation No. 25/2013 establishes a mandatory utilization framework in the transportation, industrial, commercial and power generation sectors for biodiesel, bioethanol and bio-oil from 2009 to 2025. Due to this regulation, Indonesian biodiesel consumption increased from 0.13 million litres in 2009 to 0.5 million in 2013 and is projected to reach more than 9 million litres in 2016. There is a huge gap between national supply and demand for biodiesel through 2025, and that requires large investments.
In the past, the low demand for heat has hampered the utilisation of POME and EFB as an energy source. Integrating CPO refining and biodiesel production into POM operations is the most promising approach for utilising organic residues. Glycerol, as by-product of biodiesel production, can be used within an integrated bio-refinery approach to produce value-added chemicals.
Despite broad-based institutional support, the development of biomass in Indonesia faces a number of challenges such as corruption, regulatory inconsistency, poor accessibility of bank loans, perception of residues as waste rather than resource, etc. Several of these are interdependent and therefore it is important to tackle the core of the issues if biomass utilization is to accelerate in Indonesia.
In the long-term, depleting oil resources in Indonesia may lead to dedicated oil palm plantations to ensure national energy security. This would also boost the amount of residues, and consequently the bioenergy potential from residues.

67
8. CO-DIGESTION
This chapter discusses background, perspectives, barriers and options for further development of biogas production from co-digestion chains.
1.18. Introduction
Co–digestion is the simultaneous digestion of a mixture of two or more substrates. The most common situation is when a major amount of a main basic substrate (e.g. manure or sewage sludge) is mixed and digested together with minor amounts of a single, or a variety of, additional substrate(s). In the past, Anaerobic Digestion was a mostly a single substrate/single purpose technology. Nowadays, the limits and the possibilities of AD are better known and co-digestion has become a standard technology in agricultural biogas production (Pöschl et al. 2010; Murphy et al. 2011).
While biogas has found its place in the matrix of (renewable) energy sources around the world, be it for heating (IEA 2012), transport (IEA 2011), or biorefineries (van Ree and van Zeeland 2014), this doesn’t mean that AD technology has reached its final form. There still is a lot to gain in the design and operational management of AD processes, and the impact of optimising feedstock loads, digester design and management still is considerable (see Banks and Heaven (2013) and Murphy and Thamsiriroj (2013) for details).
Four types of anaerobic digesters can be used to treat livestock waste (Mathias 2014):
• Continuously Stirred Tank Reactors (CSTR);
• Upflow Anaerobic Sludge Blanket (UASB) reactors;
• Upflow Anaerobic Filter (UAF) digesters; and
• Baffled digesters.
Choice of the reactor type is determined by characteristics of the feedstock, especially particulate soil contents of Total Solids (TS). High TS feedstocks and slurry waste are mainly treated in CSTRs (Banks and Heaven 2013; Mathias 2014), while soluble organic wastes are treated using anaerobic filters, fluidized bed reactors and upflow anaerobic sludge blanket (UASB) reactors (Mathias 2014).
Typically, serial reactor designs are applied in co-digestion chains. The second digester is often combined with a membrane type gas holder. Alternative systems include a dry batch type with recirculation of liquor over the feedstock or dry continuous systems with the feedstock circulated numerous times through the digester (Murphy et al. 2011).
Co-digestion generally is applied in wet single-step processes such as CSTR. The substrate is normally diluted with dry solid contents of around 8 to 15%. Wet systems are particularly useful when the digestate can be directly applied on fields and green lands without solid separation

68
(Braun and Wellinger 2003; FNR 2010).
Anaerobic digestion of crops requires, in most cases, prolonged hydraulic residence times from several weeks to months. Both mesophiilic or thermophiilic temperatures can be applied in crop co-digestion. Complete degradation of the biomass, leading to high gas output and minimal loss of the gas potential is essential for a healthy economic performance and minimised GHG emissions. Volatile solid degradation efficiency should be 80 to 90% (Murphy et al. 2011).
A number of advantages of co-digestion have been listed (FNR 2010; Yu et al. 2010; Murphy et al. 2011; Wellinger et al. 2013):
• enhanced biogas yields and GHG reduction;
• homogenisation of particulate, floating, or settling wastes through mixing with animal manures or sewage sludge;
• increased process stability;
• reduction of odour;
• enhanced options for nutrient recycling (mainly nitrogen, phosphorus);
• flexibility of substrate selection (e.g. throughout the season);
• possible linkage to existing infrastructure (e.g. wastewater treatment or manure digestion facilities);
• increased, steady biogas production throughout the seasons;
• higher potential income thanks to gate fees for waste treatment;
• improved nutrient balance for an optimal digestion and a good fertilizer both nutrients and organic matter; and
• no ‘indirect’ effects on land use.
1.19. Legal/policy frameworks
1.1.14. Europe Policies for collection, use and treatment of biodegradable MSW fractions have been discussed in the chapter on MWS (p. 26-27). The Waste Framework Directive and the Landfill Directive aim at prevention, re-use and recycling of residues. Use in anaerobic digestion chains is only stimulated after other options have been pursued first. The possible use in co-digestion is further influenced by EU legislation and/or national legislation and technical guidelines related to issues such as (FNR 2010):
• soil protection;
• groundwater protection;
• human and animal health.

69
Some countries have published so-called positive lists of waste streams suitable for co-digestion. By defining specific sterilization requirements, EU regulation 1069/2009 (European Commission 2009) prescribes that a maximum of 50% (weight percentage) of co-products (products other than manure) is allowed to be digested when the digestate will be used as fertilizer on agricultural land (Gebrezgabher et al. 2009).
1.1.15. USA Agricultural facilities in the USA are subject to numerous government regulations. Primary laws affecting the development of an AD facility are the federal Clean Water Act of 1972 (CWA) and Clean Air Act of 1970 (CAA), plus state environmental, agricultural, and public utility regulations, and local building and zoning requirements (Bramley et al. 2011).
The dairy industry’s voluntary 2008 goal is to reduce its GHG emissions by 25% by 2020. This goal was a driver behind a partnership forged between the Innovation Center for US Dairy and USDA in December 2009 and renewed in May 2013. In this light, the dairy industry requested USDA to create a voluntary biogas roadmap to support this goal. The Innovation Center has set a goal of helping to put over 1,000 digesters on U.S. dairy farms in the next 10 years (Goldstein 2013).
While Federal regulations are setting nationwide limits, operational permits are often issued by state or local agencies and set limits for individual facilities to operate. State laws may be more stringent than federal ones, but not weaker. Federal laws do not require solid waste permits for manure. However, the acceptance of other organics may designate the AD system as a waste processing facility in some states.
Waste processing facilities are required to meet federal regulations under the Resource Conservation and Recovery Act (RCRA) Subtitle D (which covers non-hazardous solid wastes) and 40 CFR (Code of Federal Regulations) Part 258 (which covers landfills). These regulations include specifications for the management of these wastes. Facilities that run on farm manure and apply its digestate on the farm will be considered agricultural. If waste transfers are accepted from other facilities, however, it may be considered a waste treatment facility and no longer an agricultural use (Bramley et al. 2011).
The Clean Water Act regulates Concentrated Animal Feeding Operations (CAFOs) that want to discharge to US waters to obtain a National Pollutant Discharge Elimination System (NPDES) permit (PDF). Discharges include the result of inappropriate land application of manure.
Large animal feeding facilities must develop and maintain Nutrient Management Plans (NMPs) to ensure appropriate land application of manure. Smaller farms may also be required to comply with this rule if they discharge through a manmade device or through direct animal contact with surface waters. Certain states may also include smaller farms in their animal feeding operations programs.
Many states in the USA require permits for air, solid waste and water for on-farm AD systems that digest organic wastes in addition to manure. Construction permits may also be required for these systems. Table 16 compares state-specific air, solid waste and water permitting requirements as of May 2014 for on-farm AD systems (AgSTAR 2014). Sometimes co-digesting multiple feedstocks may require an AD system to obtain additional air, water, or solid waste permits. Also, if the effluent is land applied, the farm may have to update its nutrient management plan (EPA, GOV factsheet co-digestion (2012).
Licensed dairies in Washington state require nutrient management plans (NMPs) to ensure

70
effective nutrient management and to preserve water quality. At a national level, 75% of dairies with more than 300 animal units were spreading manure at rates in excess of crop nitrogen needs in 2000. Some 96% were applying more phosphorus than required (Ribaudo et al. 2003). Recent data suggest nutrient use still is an issue, particularly for large operations (MacDonald and McBride 2009).
The Regional Greenhouse Gas Initiative (RGGI) is a market-based regional regulatory program that aims to reduce GHG emissions. It is based on CO2 auctions, tracking, and offsets. States participating in RGGI include Connecticut, Maine, Maryland, Massachusetts, New Jersey and New York. Each state operates a CO2 Budget Trading Program limiting emissions of CO2 from electric power plants, issuing CO2 allowances and establishing participation in regional CO2 auctions.
Table 16. Overview of State Permitting Requirements Specific to AD Systems in the USA
State Air Solid waste Water
Sta
te s
peci
fic
thre
sho
lds
RC
RA
Co
-dig
est
ion
Man
ure
on
ly
exem
pti
on
Off
site
wast
e
acc
ep
tan
ce
req
uir
em
en
ts
NP
DE
S
Sta
te C
AFO
re
qu
irem
en
ts
Co
-dig
est
ion
re
qu
iere
men
ts
California ✔ ✔ ✔
Idao ✔ ✔
Illinois ✔ ✔
Iowa ✔ ✔ ✔
Maine ✔ ✔
Massachusetts ✔
Michigan ✔ ✔ ✔ ✔ ✔
Minnesota ✔ ✔ ✔ ✔
Nebraska ✔
New York ✔ ✔
Ohio ✔ ✔ ✔
Oregon ✔ ✔
Pennsylvania ✔ ✔
Texas ✔
Vermont ✔ ✔ ✔
Washington ✔ ✔ ✔
Wisconsin ✔ ✔
Note: abbreviations refer to US bioenergy policy; see text. ✔= specific state requirements Source: USDA (2014)

71
RGGI can be applied to AD facilities through its offsets program. CO2 offsets are project-based GHG emissions reductions. RGGI participating states allow regulated power plants to use a chosen group of offsets to meet up to 3.3% of their compliance obligations. Offsets may be purchased from any project within the participating states (Bramley et al. 2011).
Biogas is eligible to contribute to a Low-Carbon Fuel Standard (LCFS) and it can help to meet compliance obligations which offer a direct production incentive (Murray et al. 2014).
1.1.16. Brazil After the petroleum crisis of the 1970s, the Brazilian government reoriented its energy policy to alternative energy resources. Biofuel production and consumption are fully integrated in the national economy. This success is based on a combination of factors, including several decades of a support program, extensive land availability, effective agricultural knowledge, and strong industrial development.
The development of agricultural biogas technology has been strongly emphasized by government policy, referring to advantages of biogas, i.e. being affordable, self-sustaining, and environmentally friendly. Biogas development could be succesfully developed as Brazil was already investing in bioethanol programmes (Bramley et al. 2011).
The National Policy on Climate Change, established through Law N.12.187, of December 29, 2009, introduced a commitment to reduce GHG emissions. With this law, submitted at the international level at the Copenhagen Accord in 2009, Brazil introduced a list of national mitigation actions or NAMAs2. The schemes are implemented in accordance with the principles and provisions established by the Convention on Climate Change, through the adoption of Sectorial Action Plans.
To facilitate implementation of the Sectoral Action Plan in the agricultural sector, the Low-Carbon Agriculture (ABC Plan) has been established. The plan was derived from commitments to reduce emissions of GHG set out in the National Policy on Climate Change (NPCC), Law no. 12.187/09, offering technical assistance to promote improvement of rural infrastructure. Credit is offered to producers using funds from BNDES, Rural Savings Booklet (MCR 6-4) and Constitutional Funds, which are obtained by taxes (Persson and Baxter 2014).
The GTZ Energy Programme (‘Programa Energia’), implemented by the German Federal Ministry of Economic Cooperation and Development, supports the use of renewable energy and energy efficiency in Brazil. It aims to improve conditions for the sustainable use of biogas, the analysis of experience and know-how transfer between German and Brazilian partners. The programme entered into a partnership with the public energy utility Eletrosul, subsidiary of Eletrobras, the national electricity provider, in 2009. Focus is on biogas know-how transfer (Dimpl 2010).
Several institutions have been implemented to provide permanent support to biogas production in Brazil. These include the International Center on Renewable Energy – Biogas (CIBiogás), and the Brazilian Association of Biogas and Biomethane. The latter (founded December 2013) aims to be a channel for dialogue with civil society, the federal and state governments, municipalities and agencies responsible for planning Brazilian energy (Persson and Baxter 2015).
The International Center on Renewable Energy – Biogas aims to be a reference to the biogas industry by 2023. It is to provide demonstration units, technology development and to disseminate expertise in renewable energy. The National Program on Biogas and Biomethane aims to support institutional development and use of biogas and biomethane and stimulate their application in the energy matrix (Persson and Baxter 2015).

72
On September 30, 2014, the Electric Energy National Agency (ANEEL) approved the auction for the procurement of energy from solar photovoltaic, wind and biomass. The bioenergy may be generated from municipal solid waste, biogas from landfills and sewage sludge treatment plants, as well as biogas plants treating animal waste. Although this auction had been designed to increase the competitiveness of alternative sources in the wider energy market, it did not stimulate planning and building of new biogas plants (Persson and Baxter 2015).
Another initiative under development is the creation of legislation allowing the development of a biomethane market. Development of draft legislation is being carried out by the government’s National Agency of Petroleum, Natural Gas and Biofuels. The standard will include obligations regarding quality control to be met by the various economic agents who trade biomethane throughout Brazil (Persson and Baxter 2015).
1.20. Potential
1.1.17. Europe Northwest Europe, with its densely populated areas and large industrial infrastructure, market implementation of biogas (e.g. local use, methane upgrading and grid injection, need for certification, use as transport fuel for cars etc.) apparently is very suitable. There is a large potential for organic residues (e.g. cereal straw, wood residues, but also other food and feed production chains), but their implementation in biogas production chains so far has mainly been limited to manure plus energy crop (silage maize) digestion with some additional residual streams.
It is difficult to provide reliable assessments of co-digestion potential. According to E4Tech (2014), the EU potential from biomass waste amounts to 4.0 EJ. The potential for 2020 is 5.0 EJ. Of this, animal manure, straw and MSW make up 0.9, 0.9 and 0.5 EJ, respectively. Total potential from crop residues in 2050 has been estimated at 4.5 EJ (Haberl et al. 2011). This includes straw and other lignocellulosic materials which normally are not applied in AD systems.
1.1.18. USA Biogas has been a proven source of energy in the United States for decades. While recent data demonstrate an increase in the number of farm-based digesters (Table 17), still less than 2 per cent of the nation's dairy and swine operations have operational AD systems (USDA et al. 2014).
Table 17. Existing Operational and Potential Biogas Systems in the United States
Livestock Manure
Landfill Gas
Water Resource Recovery Facilities
Total
Operational systems 239 636 1,241 2,116
Potential number of digesters
8,241 1,086 3,681 13,008
Source: USDA (2014)
The potential of crop residues in North America was estimated at 6.0 EJ in 2050 (Haberl et al. 2011). This includes lignocellulosic materials which normally are not applied in AD systems.

73
1.1.19. Brazil The biogas potential for Brazil is large (Persson and Baxter 2014), but specific data for co-digestion are scarce. An inventory of cattle and pig manure potential suggests that the country’s total natural gas import (amounting to 26.8 million m3/day in 2006 or 0.2 EJ/year) could be replaced by domestic biogas (Mathias 2014).
1.21. Chain description
1.1.20. Europe Early farm digestion installations in Europe mainly were fed with pure animal manure. More recently, additional materials are added like energy crops, agricultural or industrial by-products and/or grass (co-digestion). Main substrate used for biogas production in the agriculture sector is a mixture of energy crops, e.g. maize silage, and animal manure (Persson and Baxter 2014). Large-scale fermenters are mostly stirred, solid materials making up no more than 15 per cent of the feedstock. Some large reactors, however, run on dry solid substrates (Dry Anaerobic Composting). Most agricultural installations in Germany are fed mixtures of manure and maize (Pöschl et al. 2010).
Modern reactors often consist of three closed reactor tanks. The first reactor converts easily degradable materials (cellulose, sugars, amino acids, fats and glycerol) into biogas, a process accompanied by the build-up of Volatile Fatty Acids (VFAs) and lactate. Resistant lignocellulosic components are digested in the second reactor, the third reactor serving mostly as a digestate storage tank. During this stage, production of biogas continues, albeit at a low rate. Older installations lost biogas during storage; but newer fermenters need to capture biogas emissions so as to enhance the environmental performance (Zwart and Langeveld 2010).
In Europe, agriculture co-digestion has become a standard technology. Many small and medium sized farm scale digesters use considerably high amounts of single or mixed co-substrates together with manure. In 2013 about 8,000 agricultural plants were in operation in Germany, most of them using co-substrates. Considerably less were in function in Austria (293), Switzerland (96), France (105), the Netherlands (105), Denmark (67), and the UK (63) (Persson and Baxter 2015).
It is common practice for crops to be co-digested with manure or other liquid substrates to promote homogenous or stable conditions within the digesters. This allows a process similar to wet digestion, whereby the dry solids content within the digester is below 10% which enables effective reactor mixing. In most cases mechanical stirrers are used to mix the digester contents (Murphy et al. 2011).
Energy crops like maize, sunflower, grass, beets, etc., are added to agricultural digesters, either as co-substrates or as the main or in some cases as a single substrate (Al Seadi et al. 2013; Persson and Baxter 2015). A survey by Nova Institute (Carus 2012) shows that some 15 million tonnes of agricultural biomass in EU27 was used for bioenergy in 2007. Major crops involved are maize (6.0 million tonnes), sugar beet (5.2), oil palm (0.9) and wheat (0.9 million tonnes).
1.1.21. USA The United States currently has more than 2,000 sites producing biogas (Table 1). While older biogas systems typically were designed to process one feedstock, new systems usually can accept a variety of organic materials (USDA et al. 2014). Many AD projects start with manure, with co-

74
substrates being added later. Enquiries are being made to see what feedstocks can be accepted by farm digesters. Organic material may be added to municipal solid waste to increase productivity (Goldstein 2013).
There is an increased interest in marketing co-products, especially nutrients, as electricity prices have fallen and farms are not generating as much revenue from the energy component of the digester operations. Solid effluents continue to be used as bedding, especially in regions where the price of wood shavings has increased, as well as for production of potting soil, soil amendments and biodegradable pots (Goldstein 2013).
A growing number of existing and planned projects combine multiple feedstocks within a given installation. As the biogas industry deploys more digester facilities across the country, the potential for blending feedstocks from various sources will increase due primarily to decreased hauling distances (USDA 2014).
1.1.22. Brazil Animal husbandry is an important cornerstone for Brazil’s economy, which has supported its agribusiness development for decades. In the 1970s and 1980s, there was a strong interest of biogas development because of its abundant agricultural resources, but development was unsuccessful due to the unsatisfactory market scope and lack of technical knowledge (Bramley et al. 2011).
Brazil developed agricultural biogas production by capitalizing on the opportunities created by the Kyoto protocol and building on existing agricultural bioethanol programmes (Bramley et al. 2011), but development of production capacity so far seems to have been very limited. In 2013, only 80 MW of biomass-fed electricity was from biogas power plants. The National Agency of Electric Energy Agency (ANEEL) keeps track of biogas plants connected to the grid but only of a small number of installations are covered in the program (Persson and Baxter 2014).
The most common digester model in the south of the country is the so-called Canadian digester, which has a volume of some 150 m3 and a gas holder capacity of 136 m3. The hydraulic retention time is 30 days. It can treat manure of a 50 sow pig farm. The generated biogas is used to heat poultry farms, domestic applications or grain driers (Mathias 2014).
According to ANEEL, production of electricity from biomass corresponded to 8.75% of the Brazilian electricity production in 2014. This includes three new biogas plants in 2014 and in total 25 biogas plants connected to the electricity grid. The majority of the biogas plants are located on agricultural properties to process residues and on landfills (Persson and Baxter 2015).
1.22. Drivers and Barriers
Several drivers can be identified that stimulate co-digestion development. These include (FNR 2010; Al Seadi et al. 2013) the following.
• Digesters in waste water treatment plants are usually oversized. Addition of co-substrates helps to produce more gas and consequently more electricity at only marginal additional cost. Extra electricity produced allows to cover the energy needs of waste water treatment at a reasonable cost.
• Agricultural biogas production from manure alone (which has a relatively low gas yield) is

75
economically not viable. Addition of co-substrates with a high methane potential not only increases gas yields but above all increases the income through tipping fees.
Other major driving forces include policies, need for sanitation, demand for local energy sources and high costs for fossil energy.
Co-digestion production in Europe has mainly been driven by policy. This is especially the case for Germany, Europe’s largest biogas producer. In the USA, policy also seems to be the largest individual stimulating force. Brazil, in contrast, has been able to make effective use of the CDM mechanism developed under the Kyoto Protocol to promote agricultural biogas production in its rural areas. The CDM allows developed countries to meet part of their GHG emission reduction commitment by investing in GHG emission reduction projects in developing countries (Bramley et al. 2011).
Potential assessment studies focussed on a very limited number of potential barriers for (co-) digestion chain development. Most common limitations were competition for land and water, as well as impact on food availability (e.g. Fischer et al. 2007; Dornburg et al. 2010). Other studies have listed a range of barriers that often are encountered by individuals or companies aiming to develop biogas (co-digestion) chains. They include a range of issues that have been reported in different countries, covering technical, economic and environmental performance as well as policy, market and general economic conditions and position of the sector in the public debate.
The main obstacle for biofuel chain development, at least in the EU, is a combination of a young and relatively underdeveloped market where different end-users compete for biomass feedstocks under conditions of uncertain prices, and uncertain and inconsistent policies (FNR 2015b). A dominant additional barrier for co-digestion development is the often uneconomic performance due to high investment and feedstock costs. An overview of structural barriers by Langeveld et al. (2010) suggests lack of knowledge or technical support in the Netherlands is less of a problem as compared to input (waste feedstocks) availability, access to credit, finding a good location and obtaining a permit to build and operate AD installations as well as poor political and public support.
Similar results were reported for wastewater co-digestion efforts in Iowa (USA), e.g. restrictive (state) regulations, lack of funding and access to credit, fluctuations in feedstock availability, cultural and social conditions (Hanson 2014). Specific problems that may occur for small-scale farm co-digesters are related to their limited options to make use of economies of scale, reasonability of manure collection, access to the grid, lack of financing opportunities, and relatively high fixed costs (Shelford and Gooch 2012).
According to Dimple (2010), barriers to market penetration and development of biogas chains in developing countries include:
• lack of awareness of biogas opportunities; • high upfront costs for potential assessments and feasibility studies; • lack of access to finance; • lack of local capacity for project design, construction, operation and maintenance; • legal conditions that complicate alternative energy production and commercialisation
(the right to sell electricity at local level).
In addition to this, the development of a legislative basis for co-digestion installations sometimes has been extremely slow. In the Netherlands, for example, it has taken years before the legal distinction between farm- and industrial scale digesters was determined. This has made it
76
extremely difficult for farmers to obtain approval to develop large AD installations on their farms (Langeveld et al. 2010).
In countries with stringent nutrient management legislation, farms operating co-digestion installations may be confronted with limitations in their management as imports of additional biomass need to be integrated in existing Nutrient Management Plans (NMPs) in order to ensure they do not affect water quality. This is the case in parts of the USA and the EU and mainly affects dairy and intensive pig farms (e.g. Shelford and Gooch 2012).
Large animal feeding facilities must develop and maintain Nutrient Management Plans to ensure that manure is applied to the land appropriately. Smaller farms may also be required to comply if they discharge through a man-made device or involve animal contact with surface waters. Certain states may also include smaller farms in their animal feeding operation programs.
In industrial countries, potential competition of biogas production with food crops has been a major issue in public debate. This also refers to co-digestion if energy crops are used as co-substrate.
1.23. Options for improvement
Not all barriers listed above are equally important in all regions or for all AD types, but there is a tendency for digester management to be hampered by a number of practical limitations. Feedstock availability appears to be sufficient in most of the cases, be it that in certain areas high costs of biomass with high methane production potential may provide problems in relation to cost-effective AD operation.
Problems related to limited awareness of biogas perspectives seem to be more relevant in countries like Brazil (in contrast to China, India, European countries and – be it to a lesser degree – the USA). It is expected that countries and regions where currently awareness remains underdeveloped, knowledge and market infrastructures will remain at sub-optimal levels as well, as will be the willingness of financial institutions including banks to provide sufficient resources for investments.
Options for the improvement of AD installation design, loading and management have been discussed extensively by Banks and Heaven (2013). An extensive knowledge of the digestion process, of digester management and (nutrient) loading appears to be essential in order to realise the full potential of available biomass and manure feedstocks.

77
9. DISCUSSION
This report discusses barriers and opportunities for biogas production chain development. Anaerobic Digestion is a proven technology that converts dry as well as wet feedstocks from a range of sources. Its main product, biogas, can be stored before it is used to provide heat, converted into electricity, (upgraded to biomethane and) inserted to a natural gas grid or used as feedstock in the chemical industry. As such it is a valuable resource of the bioenergy sector, as a stand-alone energy source or integrated into food-, animal feed- or biofuel production chains.
One of the most distinctive characteristics of AD is its ability to generate energy from low value, high volume, and low energy-density feedstocks including Municipal Solid Waste (MSW), food/feed industrial effluents and animal manure, in simple, safe and relatively cheap production units. It generates a co-product which is suitable for recycling of plant nutrients and organic matter to the soil. As it requires few inputs and generally is self-sufficient in energy, AD is a powerful source of bioenergy. It can convert large amounts of residues in a sustainable way, and has an almost unsurpassed GHG efficiency.
There is huge potential for biogas production. Effective AD installations have been developed at household, farm or industrial scales. Implementation, however, still remains below its potential. The amounts of feedstocks, especially MSW, crop and industrial residues, animal manure and effluent that in theory could be converted are immense.
Currently, this potential is not fully realised. There are several factors that explain this situation. Main barriers for biogas technology implementation are found in the fact that AD technology has not been proven for all feedstocks, a factor that explains the low implementation rate in conversion of oil palm residues. In cases where the technology has been insufficiently demonstrated, the attitude towards anaerobic digestion can offer a considerable barrier for its implementation. A positive and constructive attitude towards AD implementation is crucial for successful development.
Biogas is one of the cheapest bioenergy sources, with production costs generally remaining below US$4/GJ, but poor economic performance of digesters can be an important barrier for the mobilisation of biogas potential. Gate fees may apply for composting sites (the main alternative disposal route). In Ireland, gate fees are around €80/tonne; in the UK they vary between €41 to €71/tonne of MSW, with a median of €48/tonne. Gate fees are however dropping due to overcapacity and a reduction of the amount of food waste.
The impact of gate fees for Ireland has been quantified by Clancy et al. (2012). It is expected that fees at €70/tonne will attract 50% of the available MSW. A further 25% may be sourced at €40/tonne; the remaining 25% to become available at €0/tonne fees. In Belgium, a gate fee of €40/tonne was used for separately collected garden-fruit-vegetable waste (Devriendt et al. 2013). Negative gate fees for bio-waste can be expected elsewhere in north-western Europe, but specific levels will vary.
Feedstock availability or costs are not a barrier for biogas development in palm oil production systems. Here, biogas production seems to offer efficient options for waste (POME, EFB) treatment. Realisation of the potential is however hampered by high investment requirements and lack of (inter-sectoral) communication. AD technologies need to be introduced to the sector while

78
demonstration and pilot projects will play a crucial role in the development of an enabling environment. The role of policy here will be essential. Establishment of a clear, consistent and reliable regulation framework will be needed to enable chain partners to pick up their role in the development of effective and commercially successful production chains. This framework should be well integrated into existing policies, enforcing rather than contradicting them.
For co-digestion, a distinction must be made between manure on the one hand and a range of potential co-substrates on the other hand. Manure is expected to be available at low costs in considerable quantities, especially in areas with large number of livestock (west Europe, USA, parts of Latin America). In these regions, transportation costs may be the most significant part of manure feedstock costs. Due to high transportation costs, manure is not likely to be transported over large (>20 km) distances purely for biogas production objectives.
Biomass cost supply curves may be rather steep, showing a strong increase of feedstock prices if larger volumes are to be sourced. This is, however, not always the case. Figure 27 suggests that biogas feedstocks in Ireland are either negatively priced or available at very low prices with slow increases in feedstock costs. Some feedstocks in this case only are available at prices easily exceeding 200 Euro per toe (US $ 6.0/GJ). These prices are very unlikely to be covered by biogas production chains.
Figure 27. Cost supply curve of biomass in Ireland in 2012
Source: Clancy et al. (2012)
Global cost supply curves of biogas feedstocks have been presented by IIASA in 2012. Availability of biogas resources is projected to amount to 35 EJ at less than US$2/GJ production costs. Future availability can exceed 90 EJ at less than US 3$/GJ (Figure 28). The figure suggests that feedstock

79
prices will be slightly higher in 2050 as compared to the current situation.
Figure 28. Cost supply curve of MSW, animal waste and crop residues
Source: Rogner et al. (2012)
Feedstock purchases are responsible for only a part of the total costs involved in biogas production. In co-digestion chains, feedstocks represent a quarter of the costs. Most (half) is related to capital investments and depreciation. Operational costs make up the difference. Cost shares will, however, vary between regions and feedstock types. Highest feedstock costs are expected for co-digestion of energy crops which are cultivated specifically for this purpose. Lowest costs may be found in MSW and specific other waste streams which can have negative prices as indicated above.
Even when feedstock costs are low, collection, storage and preparation of the biomass may be very costly. This is especially the case for wet materials that have to be transported over long distances (manure being the most unfavourable example).
Generally, markets needed to support large-scale economic and efficient AD development tend to be immature or may be lacking altogether. This is often the case for residue and effluent conversion in the food and animal feed industry (apart from palm oil, also referring to most of the fruit, beverages and animal feed sectors). When feedstock logistics are not effectively organised, owners of AD installations – often farmers – are confronted with major problems in planning and managing the digesters. Price, composition and quality of substrates may be less than anticipated and tend to show huge variation, seriously hampering their technical, economic and environmental performance.
At a local scale, construction of household digesters has been hampered by the use of poor construction material following the desire to cut investment costs as well as a lack of sufficiently skilled workers. Improved training and raising awareness of good quality materials as well as proper installation management has proven to be effective in some cases.
Following on these experiences, doubts have risen about the economic perspectives of AD installations. Especially when co-substrate price, quality and availability are less favorable than expected, profitability of AD operations may be below what is feasible or has been anticipated.

80
This adds to problems that households, farmers or even industries are facing in obtaining sufficient credit for the development of new AD capacity.
Added to this is the fact that the perspectives for the sale and delivery of biogas, upgraded biomethane and/or generated electricity, which are not part of well organised mature markets, are generally bleak. In many cases, (potential) AD operators and investors are confronted with huge challenges in obtaining the right to deliver their products to the grid. This is even more the case for potential use of excess heat, which cannot be transported economically over distances longer than a few hundred metres and for which often no local market exists.
Under these conditions, availability of stable and effective political and public support can be crucial. It may help to obtain access to credit, feedstocks, and product markets as well as help to ascertain investment or other subsidies. The provision of a general supportive environment generally in practice therefore proves to be a prerequisite for long-term production chain development. In many cases, AD investors and operators have to compete for limited resources (feedstocks, credit, subsidies) with other types of (renewable) energy including the solar, wind, geothermal or fossil options like fracking.
According to C2ES (2015), the way to overcome obstacles for AD development in US agriculture includes:
• carbon pricing (to raise cost of fossil alternatives);
• renewable portfolio standard (requiring a certain amount of power to be generated from renewable sources);
• economic incentives (tax credit or subsidies, to help lower cost of renewable energy production costs); and
• feed-in tariffs (requiring that utilities purchase energy from certain generation facilities at a favourable rate).
These measures seem applicable in other regions as well.
The case for carbon pricing frequently has been made by the World Bank. It helps shift the burden for the damage back to those who are responsible for it, and who can reduce it. A carbon price gives an economic signal and polluters decide for themselves whether to discontinue their polluting activity, reduce emissions, or continue polluting and pay for it. In this way, the overall environmental goal is achieved in the most flexible and least-cost way to society. A carbon price also stimulates development of biogas technology and market innovation (World Bank 2015).
In practice, the establishment of a carbon price, through a carbon tax or a cap-and-trade program, would lower the cost of using biogas relative to higher-carbon fossil alternatives. In doing so, a carbon price would also create an incentive for biogas production; the resulting gas could be sold to the market at a price equal to the prevailing price of natural gas plus the carbon price associated with its consumption (Murray et al. 2014).
Barriers identified for MSW in the EU (Chapter 3) are mostly policy-oriented. For example, Europe’s Waste Framework Directive demands materials to be re-used and recycled before it can be digested which is making sense from an energy efficiency perspective but in practice limits the perspectives for AD. In practice, further, most countries still apply landfilling. There is need for a greater focus on bio-waste recycling in line with the Waste Framework Directive's waste hierarchy.

81
The majority of countries in the EU will need to make an extraordinary effort in order to achieve the target of 50% recycling by 2020. A comparison of the landfilling and recycling rates across Europe underlines the importance of national and regional instruments. There is, however, need for instruments to be streamlined, as there is substantial variation between different local and regional policies. Both have a significant influence on municipal waste recycling rates.
Barriers for oil palm residue valorisation in Indonesia (Chapter on oil palm residues, p. 56) are mainly related to corruption and policy inconsistencies, while the low demand for heat has limited the desire to source residues like mill effluent (POME) and empty fruit bunches (EFB) as an energy source. The enthusiasm is further restricted by lack of demonstration projects in the oil palm sector and very limited financial support. Biogas production from residues is further hampered by a negative (backwards) image of bioenergy, while the isolated location of oil palm plantations does require large investments in terms of grid access
Co-digestion barriers (p. 55-56) are mainly related to uneconomic performance due to high investment and feedstock costs. Other barriers to the development of the biogas sector are mostly similar to those reported for oil palm residue digestion:
• lack of awareness of biogas opportunities;
• high upfront costs for potential assessments and feasibility studies;
• lack of access to finance;
• lack of local capacity for project design, construction, operation and maintenance; and
• legal framework conditions that complicate alternative energy production and com-mercialisation (the right to sell electricity at local level).

82
10. CONCLUSION AND RECOMMENDATIONS
Agricultural and industrial biomass residues and waste streams can play an important role in the realisation of the potential of bio-energy. Anaerobic Digestion is a flexible process that can convert a range of feedstocks, thus providing a hygienic, efficient and cost-effective upgrade of wastes such as manure or municipal solid waste. AD has some extraordinary features, including a favourable energy output to input ratio, and a high potential to diminish greenhouse gas emissions. Methane can be stored or entered into a natural gas grid, while the by-product (digestate) is a relevant source of nutrients and organic matter. Potential disadvantages include the risk of explosion, toxicity, and unpleasant odours, while methane leakages may limit potential GHG benefits.
Development of biogas production is stimulated by the need for safe, clean and cost-effective management of residues. Realisation of the potential is currently limited by the combination of an incomplete or inconsistent policy environment, lack of awareness and of demonstration initiatives (in oil palm) and restrictive and complex waste legislation, while lack of investment and insecure long-term economic perspectives limit the willingness and ability of practitioners to develop successful biogas production chains.
Development of an enabling policy environment, alongside initiatives to help improve investment opportunities, will be crucial for successful long term development. Improvement of installation design, loading and management should be based on enhanced knowledge of the digestion process, of digester management and nutrient loading. All will be crucial for the realisation of the full potential of available biomass and manure feedstocks.
Biogas production also remains dependent on reliable public and political support – at least until markets for inputs and for its products have matured.
of the following policy options can be identified which would enhance biogas development.
• Inefficiencies, inconsistencies for biogas production, and intrinsic barriers in existing policies need to be lifted. Special attention for this is needed in the interactions of local, regional and national policy frameworks.
• Consistent policy support is needed, often also requiring sufficient economic incentives, e.g. for investments in AD installations, or infrastructure for marketing and utilization of biogas, upgraded gas and/or locally generated electricity. Not surprisingly, countries which have successfully developed AD production capacity also have a long-term, consistently supportive bioenergy policy.
• Special attention should be given to reducing existing support structures which are in place for fossil fuels, as they make it more difficult for new technologies to become competitive, while at the same time competing for scarce public funds.
• Improvement of the image of biogas production, and helping to lift negative perceptions (whenever these are occurring) can be a very effective way to improve development of the production chain and its support by stakeholders in feedstock, gas and energy markets and by the general public.

83
• In some cases, the potential for economic digester performance needs to be improved. Relatively low energy content per unit of biomass/feedstock, high initial investment and often, considerable logistical efforts need to be considered in the development of cost-effective AD systems. Feedstock prices are unlikely to decline or remain low in the long run. Steps can, however, be taken in the development of efficient logistics systems, and infrastructure investments, as well as research and development of equipment and management systems.
The use of residue flows should be given priority in AD development for various reasons. Residues often provide inexpensive feedstocks (sometimes even negatively priced) that may sometimes contain considerable amounts of energy. Development of production chains that can go alongside existing logistical processes (e.g. collection of municipal waste) can help in improving the economic potential of biogas production, while also contributing to public and political support.

84
11. REFERENCES
AEBIOM (2009): A biogas road map for Europe. AEBIOM, Brussels. http://www.aebiom.org/?cat=58
ADB (2009) Key Indicators for Asia and Pacific 2008. Asian Development Bank
AfricaBiogas (2015) AfricaBiogas.org. Accessed 6 April 2015
Al Seadi T, Rutz D, Janssen R, Drosg B (2013) Optimisation of biogas yields from anaerobic digestion by feedstock type. In: Wellinger et al. (eds.), The biogas handbook, pp. 19-51. Cambridge (UK), Woodhead
Angenent LT and Wrenn BA (2008) ‘Optimizing mixed-culture bioprocessing to convert wastes into bioenergy’. In: Wall, J.D. et al. (eds.), Bioenergy, 179-194. Washington: ASM Press
Arnott M (1985) The biogas/biofertilizer business handbook. Peace Corps. http://www.build-a-biogas-plant.com/PDF/PeaceCorpsBiogas.pdf. Accessed 12 February 2015
Arshadi M and Sellstedt A (2008) Production of energy from biomass. In: J. Clark and F. Deswarte (Eds) Introduction to chemicals from biomass, pp. 143-78
Auld G, Gulbrandsen L and McDermott C (2008) “Certification Schemes and the Impacts on For-ests and Forestry.” Annual Rev. of Environm. Resources, 33, pp.187-211
Banks CJ and Heaven S (2013) Optimisation of biogas yields from anaerobic digestion by feedstock type. In: Wellinger et al. (eds.), The biogas handbook, pp. 131-165. Cambridge (UK), Woodhead
Basri MF, Yacob S, Hassan MA, Shirai Y, Wakisaka M, Zakaria MR, Phang LY (2010) Improved biogas production from palm oil mill effluent by a scaled-down anaerobic treatment process. World Journal of Microbiology & Biotechnology 26 (3):505-514
Basiron Y (2007) Palm oil production through sustainable plantations. European Journal of Lipid Science and Technology 109 (4):289-295
Basiron Y and Kheong Y (2009) Potential of palm oil for developing countries and role in the food and fuel debate. Global Oils and Fats 6 (2):8
Berrios M, Gutiérrez MC, Martín MA, Martín A (2010) Obtaining biodiesel from spanish used frying oil: Issues in meeting the EN 14214 biodiesel standard. Biomass and Bioenergy 34 (3):312-318. doi:http://dx.doi.org/10.1016/j.biombioe.2009.11.002
Beurskens LWM and Hekkenberg M (2010) Renewable energy projections as published in the National Renewable Energy Action Plans of the European Member States. Petten, Energy Research Centre of the Netherlands
Biocycle (2010) The state of garbage in Amerca, 17th nationwide survey of MSW management in the USA
85
Bramley J, Cheng-Hao Shih J, Fobi L, Teferra A, Peterson C, Yuan Wang R and Rainville L (2011) Agricultural biogas in the United States. A market assessment. Tufts University, Department of Urban & Environmental Policy & Planning
Braun R and Wellinger A (2003) Potential of co-digestion. IEA Bioenergy.
Braun R, Weiland P and Wellinger A (2010) Biogas from energy crop digestion. Paris, IEA Bioenergy Task 37
Brinkmann A (2009) GHG emissions from palm oil production. Hoevelaken, the Netherlands
Budiharjo D (2010) Palm Oil Mill Waste Utilisation. Paper presented at the Technology Cooperation and Economic Benefit of Reduction of GHG Emissions in Indonesia, Hamburg
C2ES (2015) Anaerobic digesters. Arlington, Center for Climate and Energy Solutions. http://www.c2es.org/technology/factsheet/anaerobic-digesters#_edn3 Accessed 2 April 2015
Carter C, Finley W, Fry J, Jackson D, Willis L (2007) Palm oil markets and future supply. European Journal of Lipid Science and Technology 109 (4):307-314
Chang SH (2014) An overview of empty fruit bunch from oil palm as feedstock for bio-oil production. Biomass and Bioenergy 62 (0):174-181 doi:http://dx.doi.org/10.1016/j.biombioe.2014.01.002
Chavalparit O, Rulkens WH, Mol APJ, Khaodhair S (2006) Options for Environmental Sustainability of the Crude Palm Oil Industry in Thailand through Enhancement of Industrial Ecosystems. Environment, Development and Sustainability 8 (2):271-287
Cheng S, Li Z, Mang HP, Huba EM, Gao R and Wang X (2014) Development and application of prefabricated biogas digesters in developing countries. Renewable and Sustainable Energy Reviews, Vol 34, pp. 387–400
Chiew YL, Shimada S (2013) Current state and environmental impact assessment for utilizing oil palm empty fruit bunches for fuel, fiber and fertilizer – A case study of Malaysia. Biomass and Bioenergy 51 (0):109-124 doi:http://dx.doi.org/10.1016/j.biombioe.2013.01.012
Chin MJ, Poh PE, Tey BT, Chan ES, Chin KL (2013) Biogas from palm oil mill effluent (POME): Opportunities and challenges from Malaysia's perspective. Renewable and Sustainable Energy Reviews 26 (0):717-726 doi:http://dx.doi.org/10.1016/j.rser.2013.06.008
Chuchuoy K, Paengjuntuek W, Usubharatana P, Phungrassami H (2009) Preliminary Study of Thailand Carbon Reduction Label: A Case Study of Crude Palm Oil Production. European Journal of Scientific Research 34 (2):252-259
Clancy M, Bates J, Barker N, Edberg O et al. (2012) Bioenergy supply curves for Ireland. 2010-2030. Dublin, Sustainable Energy Authority of Ireland (SEAI)
Da Costa Gomez C (2013) Biogas as an energy option: an overview. In: Wellinger A, Murphy J and Baxter D (eds). The biogas handbook. Science, production and applications, p. 1-15. Cambridge (UK), Woodhead
de Vries SC (2008) The bio-fuel debate and fossil energy use in palm oil production: a critique of Reijnders and Huijbregts 2007. Journal of Cleaner Production 16 (17):1926-1927

86
Deublein D and Steinhauser A (2011) Biogas from waste and renewable resources. An introduction. Weinheim, Wiley
Devriendt N, van Dael M, van Passel S (2013) Economisch rapport ECP-case Beerse-Merksplas. Research Institute: Centre for Environmental Sciences Environmental Economics
Dimpl E (2010) Small-scale Electricity Generation from biomass Experience with Small-scale Technologies for Basic Energy Supply. Part II: Biogas. GTZ Hera
Council of the European Union (1999) Directive 1999/31/EC on the landfill of waste (Landfill Directive)
Council of the European Union (2008) DIRECTIVE 2008/98/EC on waste (Waste Framework Directive)
Council of the European Union (2009) DIRECTIVE 2009/28/EC on the promotion of the use of energy from renewable sources (Renewable Energy Directive)
Damen and Faaij (2007) Greenhouse gas balances of biomass import chains for green electricity production in the Netherlands. IEA Bio-energy Task 38
Dornburg V, van Vuuren D, van de Ven G, Langeveld H, Meeusen M, Banse M, van Oorschot M, Ros J, van den Born GJ, Aiking H, Londo M, Mozaffarian H, Verweij P, Lysen E, and Faaij A (2010) Bioenergy revisited: Key factors in global potentials of bioenergy. Energy and Environmental Science, Vol. 3, pp258–267
E3 (2007) CPUC Greenhouse gas modeling Renewable Supply Curves. San Fransico, E3 Energy and Environmental Economics. https://ethree.com/GHG/26%20Renewable%20Supply%20Curves_v2.doc
E4Tech (2014) Advanced biofuel feedstocks, an assessment of sustainability. Framework for transport-related technical and engineering advice and research. London, E4Tech
Eder M (2009) Economic assessment of best practice biogas technologies in Europe. Paper presented at the EU-agrobiogas symposium in Wels, Austria, November 26, 2009
EEA (2013a) EU bioenergy potential from a resource-efficiency perspective. EEA Report 6/2013. Copenhagen, Denmark, European Environment Agency
EEA (2013b) “Managing municipal solid waste — a review of achievements in 32 European countries”. EEA Report No 2/2013
EPA (2010a) U.S. Farm anaerobic digestion systems: A 2010 snapshot. The Agstar program. Washington, Environmental Protection Agency. http://www.epa.gov/agstar/documents/2010_digester_update.pdf Accessed 6 April, 2015
EPA (2010b) Municipal Solid Waste Generation, Recycling, and Disposal in the United States: Facts and Figures for 2010. http://www.epa.gov/wastes/nonhaz/municipal/pubs/msw_2010_rev_factsheet.pdf. Accessed 23 July, 2013
EPA (2012) Municipal Solid Waste Generation, Recycling, and Disposal in the United States: Facts and Figures for 2012 http://www.epa.gov/waste/nonhaz/municipal/pubs/2012_msw_fs.pdf

87
ERIA (2007) Investigation on sustainable biomass utilization vison in East Asia: life cycle assessmenmt for biomass derived fuel in Malaysia
European Biogas Association (2015) http://european-biogas.eu/2013/12/20/eba-presents-latest-biogas-production-statistics-europe-growth-continuous/ Accessed 12 June, 2015
European Commission (2009) The European Animal By-Products Regulation (ABP) - 1069/2009
Eurostat – Unit E3 – Environment and forestry -November 2012 - Guidance on municipal waste data collection
Eurostat and EEA (2015) http://ec.europa.eu/eurostat/en/web/products-datasets/-/ENV_WASMUN
Financial Innovations Lab Report (2013) Unleashing the power of the Bio-Economy. Milken Institute
Fischer G, Hizsnyik E, Prieler S, van Velthuizen H. Assessment of biomass potentials for biofuel feedstock production in Europe: Methodology and results. Refuel report. Work Package 2 - Biomass potentials for bio-fuels: sources, magnitudes, land use impacts. Deliverable D6: Methodology and assessment of biomass potentials in EU27+ under alternative future scenarios
FNR (2009) Biogas, an introduction. Gülzow (Germany), Fachagentur Nachwachsende Rohstoffe
FNR (2010) Guide to Biogas From production to use. Gülzow (Germany), Fachagentur Nachwachsende Rohstoffe
FNR (2015a) Online statistics. http://fnr.de/basisdaten/bioenergie/biogas.html Accessed 10 April, 2015
FNR (2015b) Barriers to biofuels development in Europe. Report to the European Biofuels Technology Platform. Gülzow (Germany), Fachagentur Nachwachsende Rohstoffe
Gebrezgabher SA, Meuwissen MPM and Oude Lansink AGJM (2010) Costs of producing biogas at dairy farms in The Netherlands. Int. J. Food System Dynamics, Vol 1, pp 26‐35
Golders_Associates (2006) Technical assistance for the gas generation from waste. Asian development Bank, Manila
Gray DMD, Suto P and Peck C (2008) Anaerobic digestion of food waste. East Bay Municipal Utility District, Environmental Protection Agency. http://www.epa.gov/region9/organics/ad/EBMUDFinalReport.pdf Accessed 8 February, 2015
Gregory R (2010) China - biogas. http://ecotippingpoints.org/our-stories/indepth/china-biogas.html. Accessed 6 April, 2015
Gutiérrez LF, Sánchez ÓJ, Cardona CA (2009) Process integration possibilities for biodiesel production from palm oil using ethanol obtained from lignocellulosic residues of oil palm industry. Bioresource Technology 100 (3):1227-1237
Hamlin A (2012) Assessment of Social and Economic Impacts of Biogas Digesters in Rural Kenya" (2012). Paper 1246. Rochester, Independent Study Project (ISP)
Hansen SB, Olsen SI, Ujang Z (2012) Greenhouse gas reductions through enhanced use of

88
residues in the life cycle of Malaysian palm oil derived biodiesel. Bioresource Technology 104 (0):358-366. doi:http://dx.doi.org/10.1016/j.biortech.2011.10.069
Hanson C (2014) Co-digestion case studies of the East Bay municipal utility district and Des Moines wastewater Reclamation Authority's co-digestion efforts. University of Oregon
Hassan MA, Yee L-N, Yee PL, Ariffin H, Raha AR, Shirai Y, Sudesh K (2013) Sustainable production of polyhydroxyalkanoates from renewable oil-palm biomass. Biomass and Bioenergy 50 (0):1-9. doi:http://dx.doi.org/10.1016/j.biombioe.2012.10.014
Henriksson J (2012) The Malaysian Palm Oil Sector- Overview (trans: MALAYSIA TaESEUDT).
Hobbs PJ, Rao Ravella S, Ward AJ, Schattauer A, Retter A, Williams J, Eder M and Amon T (2010) Benchmarking commercial biogas plants to improve performance. http://www.ramiran.net/ramiran2010/docs/Ramiran2010_0122_final.pdf Accessed 15 October 2014
Hoornweg D, Bhada-Tata P, Kennedy C (2013) Environment: Waste production must peak this century, Nature Volume: 502, Pages: 615–617, doi:10.1038/502615a
IEA (2011) Technology roadmap. Biofuels for transport. Paris, International Energy Agency
IEA (2012) Technology roadmap. Bioenergy for heat and power. Paris, International Energy Agency
IEA (2013) Southeast Asia Energy outlook. World Energy Outlook Special Report. Paris, International Energy Agency
IEA (2014) Renewable energy medium-term market report 2014. Market analysis and forecasts to 2020. Executive summary. Paris, International Energy Agency. http://www.iea.org/Textbase/npsum/MTrenew2014SUM.pdf
IOPRI (2012) Mapping of palm oil mills in North Sumatra region. Indonesian Oil Palm Reserach Institute, Jakarta
IPCC (2006) IPCC Guidelines for National Greenhouse Gas Inventories (Waste).
IRENA (2015) Renewable energ power generation costs in 2014. Abu Dhabi, International Renewable Energy Agency
IRG (2009) Scoping Study: Clean Technology Opportunities and Barriers in Indonesian Palm Oil Mill and Rice Mill Industries. International Finance Corporation (World Bank Group), Jakarta
Ismail I, Hassan MA, Abdul Rahman NA, Soon CS (2010) Thermophilic biohydrogen production from palm oil mill effluent (POME) using suspended mixed culture. Biomass and Bioenergy 34 (1):42-47. doi:http://dx.doi.org/10.1016/j.biombioe.2009.09.009
Jekayinfaa SO and Scholz V (2007) Assessment of Availability and Cost of Energetically Usable Crop Residues in Nigeria. University of Kassel-Witzenhausen and University of Göttingen, October 9-11, 2007
Jiang D, Zhuang D, Fu J, Huang Y and Wen K (2012) Bioenergy potential from crop residues in China: Availability and distribution. Renewable and Sustainable Energy Reviews 16 (2012) 1377–

89
1382.
Joint Research Centre - Institute for Environment and Sustainability (2011), Supporting Environmentally Sound Decisions for Bio-Waste Management - A practical guide to Life Cycle Thinking (LCT) and Life Cycle Assessment (LCA)
JRC-IES (2012), Supporting Environmentally Sound Decisions for Bio-Waste Management A practical guide to Life Cycle Thinking (LCT) and Life Cycle Assessment (LCA)
Kosugi A, Tanaka R, Magara K, Murata Y, Arai T, Sulaiman O, Hashim R, Hamid ZAA, Yahya MKA, Yusof MNM, Ibrahim WA, Mori Y (2010) Ethanol and lactic acid production using sap squeezed from old oil palm trunks felled for replanting. Journal of Bioscience and Bioengineering 110 (3):322-325
Langeveld JWA, Kalf R, and Elbersen H W (2010) Bioenergy production chain development in the Netherlands: Key factors for success. Biofuels, Bioproducts and Biorefining, Vol 4, pp484–493
Langeveld JWA, and Quist-Wessel PMF (2014) Variation In Oil Palm Wastewater Composition And Its Impact On Potential Biogas Production. Report 1402. Wageningen, Biomass Research, pp. 43
Lam MK, Lee KT (2011) Renewable and sustainable bioenergies production from palm oil mill effluent (POME): Win–win strategies toward better environmental protection. Biotechnology Advances 29 (1):124-141. doi:http://dx.doi.org/10.1016/j.biotechadv.2010.10.001
Lim S, Lee KT (2011) Parallel production of biodiesel and bioethanol in palm-oil-based biorefineries: life cycle assessment on the energy and greenhouse gases emissions. Biofuels, Bioproducts and Biorefining 5 (2):132-150. doi:10.1002/bbb.271
Manik Y, Leahy J, Halog A (2013) Social life cycle assessment of palm oil biodiesel: a case study in Jambi Province of Indonesia. The International Journal of Life Cycle Assessment 18 (7):1386-1392. doi:10.1007/s11367-013-0581-5
Mathias, JFC (2014) Manure as a resource: livestock waste management from anaerobic digestion, opportunities and challenges in Brazil. International Food and Agribusiness Management Review, 17, pp. 87-110
Milbrandt A, and Overend RP (2008) Survey of biomass resource assessments and assessment capabilities in APEC economies. Energy Working Group. Asia-Pacific Economic Cooperation
Murphy J, Weiland P, Braun R and Wellinger A (2011) Biogas from crop digestion. IEA Bioenergy Task 37
Murphy JD and Thamsiriroj Th (2013) Fundamental science and engineering of the anaerobic digestion process for biogas production. In: Wellinger et al. (eds.), The biogas handbook, pp. 104-130. Cambridge (UK), Woodhead
Nakada S, Saygin D, Gielen D (2014) Global Bioenergy Supply and Demand Projections: A working paper for REmap 2030. International Renewable Energy Agency, Abu Dhabi, United Arab Emirates
Ng FY, Yew FK, Basiron Y, Sundram K (2011) A renewable future driven with Malaysian palm oil-based green technology. Jourrnal of Oil Palm & The Environment 2:1-7
Norhasmillah A, Puah C, Ibrahim N, Baharuddin A, Choo Y (2013) Life cycle inventory of the

90
commercial production of compost from oil palm biomass: a case study. Environment, Development and Sustainability 15 (6):1663-1670. doi:10.1007/s10668-013-9457-x
NREL (2013) Biogas potential in the United States. Golden (Colorado), National Renewable Energy Laboratory
Ofori-Boateng C, Lee KT (2013) Comparative thermodynamic sustainability assessment of lignocellulosic pretreatment methods for bioethanol production via exergy analysis. Chemical Engineering Journal 228 (0):162-171. doi:http://dx.doi.org/10.1016/j.cej.2013.04.082
Ofori-Boateng C, Lee KT (2014) An oil palm-based biorefinery concept for cellulosic ethanol and phytochemicals production: Sustainability evaluation using exergetic life cycle assessment. Applied Thermal Engineering 62 (1):90-104. doi:http://dx.doi.org/10.1016/j.applthermaleng.2013.09.022
Ofori-Boateng C, Lee KT, Saad B (2014) A biorefinery concept for simultaneous recovery of cellulosic ethanol and phenolic compounds from oil palm fronds: Process optimization. Energy Conversion and Management 81 (0):192-200. doi:http://dx.doi.org/10.1016/j.enconman.2014.02.030
Pabón CP (2009) Anaerobic digestion in sustainable biomass chains. PhD-thesis. Wageningen, Wageningen University
Paepatung N, Nopharatna A and Songkasiri W (2009) Bio-Methane Potential of Biological Solid Materials and Agricultural Wastes. Asian Journal on Energy and Environment 10 (1):19-27
Pedroli B and Langeveld H (Eds) (2011) Impacts of renewable energy on European farmers. Creating benefits for farmers and society. Final report for the European Commission Directorate-General Agriculture and Rural Development. Wageningen, Alterra. http://ec.europa.eu/agriculture/external-studies/2012/renewable-energy-impacts/full_text_en.pdf
Persson T and Baxter D (Eds) (2014) Task 37 Biogas country overview. Paris, IEA Bioenergy
Persson T and Baxter D (Eds) (2015) IEA Bioenergy Task 37 - Country Reports Summary 2014. Paris, IEA Bioenergy
Poh PE, Chong MF (2009) Development of anaerobic digestion methods for palm oil mill effluent (POME) treatment. Bioresource Technology 100 (1):1-9. doi:http://dx.doi.org/10.1016/j.biortech.2008.06.022
Poh PE, Yong W-J, Chong MF (2010) Palm Oil Mill Effluent (POME) Characteristic in High Crop Season and the Applicability of High-Rate Anaerobic Bioreactors for the Treatment of POME. Industrial & Engineering Chemistry Research:null-null. doi:10.1021/ie101486w
Pöschl M, Warda S and Owende Ph (2010) Evaluation of energy efficiency of various biogas production and utilization pathways. Applied Energy, Vol 87, 11, pp. 3305–3321
Pugatch (2014) The bioeconomy. http://www.pugatch-consilium.com/reports/Building_The_Bioeconomy_PugatchConsiliumApril%202014DD.pdf . Accessed 12 June 2014
Quist-Wessel PMF and Langeveld JWA (2014) Bioenergy production from waste agricultural biomass. In: Langeveld et al. (eds.) ‘Biofuels Cropping Systems. Carbon, land and food’, pp. 226-238

91
Rajendran K, Aslanzadeh S and Taherzadeh MJ (2012) Household Biogas Digesters—A Review. Energies 2012, Vol 5, pp. 2911-2942. doi:10.3390/en5082911
Reijnders L, Huijbregts MAJ (2008) Palm oil and the emission of carbon-based greenhouse gases. Journal of Cleaner Production 16 (4):477-482
Rettenmaier N, Reinhardt G, Schorb A, Köppen S, et al (2008) Status of biomass resource assessments. Version 1. Heidelberg, Germany, Institut für Energie- und Umweltforschung
Rincón LE, Moncada J, Cardona CA (2014) Analysis of potential technological schemes for the development of oil palm industry in Colombia: A biorefinery point of view. Industrial Crops and Products 52 (0):457-465. doi:http://dx.doi.org/10.1016/j.indcrop.2013.11.004
Rogner H-H, Aguilera RF, Archer C, Bertani R, Bhattacharya SC, Dusseault MB, Gagnon L, Haberl H, Hoogwijk M, Johnson A, Rogner ML, Wagner H and Yakushev V (2012) Chapter 7 - Energy Resources and Potentials. In Global Energy Assessment - Toward a Sustainable Future, Cambridge University Press, Cambridge, UK and New York, NY, USA and the International Institute for Applied Systems Analysis, Laxenburg, Austria, pp. 423-512
Santosa SJ (2008) Palm Oil Boom in Indonesia. Clean 36 (5-6):453-465
Schmidt JH (2007) Life cycle asessment of rapeseed and palm oil (Summary report). University Aalborg
Schuchardt F, Stichnothe H, Herawan T (2010) Life cycle assessment of EFB and POME treatment and utilisation. In: International Palm Oil Conference IOPC 2010, 1-3 June 2010, Yokyakarta, Indonesia
Schuchardt F, Wulfert K, Damoko D (2005) New process for combined treatment of waste (EFB) and waste water (POME) from palm oil mills - Technical, economical and ecological aspects. Landbauforschung Volkenrode 55 (1):47-60
Schuchardt F, Wulfert K, Darnoko DA (2002) New, integrated concept for combined waste (EFB) and waste water (POME) treatment in palm oil mills - Technical, economical and ecological aspects. In: Enhancing oil palm industry development through environmentally friendly technology pp 330-343
Schuchardt F, Wulfert K, Herawan T (2008) Protect the environment and make profit from the waste in palm oil industry. In: World Palm Oil Summit & Exhibition, POSE 2008, May 21-23, 2008, Jakarta, Indonesia
Shelford T, and Gooch C (2012) Small Farm Anaerobic Digestion Systems and Barriers to Increasing their Implementation in New York State. Ithaca, Cornell University
Shirai Y, Wakisaka M, Yacob S, Hassan MA (2005) Sustainable palm biomass industry by POME Utilization. In: PIPOC 2005, pp 357-365
Singh RP, Ibrahim MH, Esa N, Iliyana MS (2010) Composting of waste from palm oil mill: a sustainable waste management practice. Reviews in Environmental Science and Biotechnology
SNV (2009) Tanzania domestic biogas programme. The Hague, Netherlands Development Organisation SNV

92
Stichnothe H and Schuchardt F (2010) Comparison of different treatment options for palm oil production waste on a life cycle basis. The International Journal of Life Cycle Assessment 15 (9):907-915. doi:10.1007/s11367-010-0223-0
Stichnothe H and Schuchardt F (2011) Life cycle assessment of two palm oil production systems. Biomass and Bioenergy 35 (9):3976-3984. doi:http://dx.doi.org/10.1016/j.biombioe.2011.06.001
Stichnothe H, Schuchardt F, Rahutomo S (2014) European renewable energy directive: Critical analysis of important default values and methods for calculating greenhouse gas (GHG) emissions of palm oil biodiesel. The International Journal of Life Cycle Assessment:1-11. doi:10.1007/s11367-014-0738-x
Stolpp (2010) Biogas perspective in Europe. Biogas Regions seminar, 30th June 2010, Brussels. http://www.fedarene.org/documents/projects/Biogas/2010-6_Workshop/2_Biogas_Regions_Stolpp.pdf. Accessed 13 May 2012
Sunitha S, Varghese PT (1999) Composting of oil palm wastes for efficient recycling of nutreints in palm plantations. The Planter 75 (885):677-681
Sunitha S, Varghese PT (2009) Biomass Production and Potential Nutrient Contribution from Oil Palm Plantation Annually and at Feelling. Journal of Oil Palm Research 6 (1)
Ugoji EO (1997) Anaerobic digestion of palm oil mill effluent and its utilization as fertilizer for environmental protection. Renewable Energy Vol 10, p. 291-294
Ünal B, Perry VR, Sheth M, Gomez-Alvarez V, Chin KJ and Nüsslein K (2012) Trace elements affect methanogenic activity and diversity in enrichments from subsurface coal bed produced water. Frontiers in Microbiology, Vol 3, p. 1-14
UNEP (2012) Background paper on converting waste agriculture biomass intoenergy. Paper presented at the Biennium Conference of the Global Partnership on Waste Management, Osaka, Japan, 5-6 November 2012. Global Partnership on Waste Management, Osaka
UNEP, International Environmental Technology Centre (2013) Initial Consultation on the Global Waste Management Outlook (GWMO)
United Nations, Department of Economic and Social Affairs, Population Division (2013) World Population Prospects: The 2012 Revision, Volume I: Comprehensive Tables ST/ESA/SER.A/336
United Nations, Department of Economic and Social Affairs, Population Division (2014) World Urbanization Prospects: The 2014 Revision, Highlights (ST/ESA/SER.A/352)
Verwer C, van der Meer P, Nabuurs, GJ (2008) Review of carbon fluxe estimates and other GHG emissions from oil palm cultivation on Tropical peatlands. Alterra Wageningen, Wageningen
Vijaya S, Ma AN, Choo YM, Nik MNS (2008) Environmental performance of the milling process of Malaysian palm oil using the life cycle asessment approach. American Journal of Environmental Sciences, Vol 4, p. 310-315
Vlysidis A, Binns M, Webb C, Theodoropoulos C (2011) A techno-economic analysis of biodiesel biorefineries: Assessment of integrated designs for the co-production of fuels and chemicals. Energy 36 (8):4671-4683. doi:http://dx.doi.org/10.1016/j.energy.2011.04.046

93
Wang J, Mahood Q, Q J-P, Li Y-S, Chang Y-S, Li X-D (2015) Anaerobic treatment of Palm Oil Mille Effluent in pilot-scale anaerobic EGSB reactor. BioMed Research International; 7 pp. http://dx.doi.org/10.1155/2015/398028
Wellinger A, Murphy J and Baxter D (2013) The biogas handbook. Science, production and applications. Cambridge (UK), Woodhead
Wikipedia (2015) http://en.wikipedia.org/wiki/Biogas. Accessed 6 April, 2015
Wilkie AC (2008) Biomethane from biomass, biowaste and biofuels. In: J. Wall et al. (eds.). Bioenergy. Washington, ASM Press
World Bank (2012) Urban development series knowledge papers – What a waste - A Global Review of Solid Waste Management - March 2012, No. 15
World Bank (2015) Pricing carbon. http://www.worldbank.org/en/programs/pricing-carbon Accessed 14 April 2015
Wulfert K, Darnoko D, Tobing PL, Yulisari R, Guritno P (2002) Treatment of POME in anaerobic fixed bed digesters. In: International Oil Palm Conference (IOPC), pp 265-275
Yacob S, Hassan MA, Shirai Y, Wakisaka M, Subash S (2006a) Baseline study of methane emission from anaerobic ponds of palm oil mill effluent treatment. Science of The Total Environment 366 (1):187-196
Yacob S, Shirai Y, Hassan MA, Wakisaka M, Subash S (2006b) Start-up operation of semi-commercial closed anaerobic digester for palm oil mill effluent treatment. Process Biochemistry 41 (4):962-964
Yahya A, Sye CP, Ishola TA, Suryanto H (2010) Effect of adding palm oil mill decanter cake slurry with regular turning operation on the composting process and quality of compost from oil palm empty fruit bunches. Bioresource Technology 101 (22):8736-8741. doi:http://dx.doi.org/10.1016/j.biortech.2010.05.073
Yamada H, Tanaka R, Sulaiman O, Hashim R, Hamid ZAA, Yahya MKA, Kosugi A, Arai T, Murata Y, Nirasawa S, Yamamoto K, Ohara S, Mohd Yusof MN, Ibrahim WA, Mori Y (2010) Old oil palm trunk: A promising source of sugars for bioethanol production. Biomass and Bioenergy 34 (11):1608-1613
Yeh S, Jordaan SM, Brandt AR, Turetsky MR, Spatari S and Keith DW (2010) Land Use Greenhouse Gas Emissions from Conventional Oil Production and Oil Sands. Environ Sci Technol., Vol. 44, pp.8766-72. doi: 10.1021/es1013278
Yee KF, Tan KT, Abdullah AZ, Lee KT (2009) Life cycle assessment of palm biodiesel: Revealing facts and benefits for sustainability. Applied Energy 86:S189-S196
Yoshizaki T, Shirai Y, Hassan MA, Baharuddin AS, Raja Abdullah NM, Sulaiman A, Busu Z (2013) Improved economic viability of integrated biogas energy and compost production for sustainable palm oil mill management. Journal of Cleaner Production 44 (0):1-7. doi:http://dx.doi.org/10.1016/j.jclepro.2012.12.007

94
Yu Z, Morrison M and Schanbacher FL (2010) Production and utilization of methane biogas as renewable fuel. In A. Vertès, N. Qureshi, H. Blaschek and H. Yukawa (eds.), Biomass to biofuels: strategies for global industries, pp. 404-433. Chichester, UK, Wiley
Zoï Environment Network and GRID-Arendal (2012) Vital waste graphics 3. Basel (Ch) Secretariat of the Basel Convention
Zupančič GD and Grilc V (2012) ‘Anaerobic Treatment and Biogas Production from Organic Waste, Management of Organic Waste’, Dr. Sunil Kumar (Ed.), ISBN: 978-953-307-925-7, InTech, Available from: http://www.intechopen.com/books/management-of-organic-waste/anaerobic-treatment-and-biogas-productionfrom-organic-wastes
Zwart KB and Langeveld JWA (2010) ‘Biogas’. In: Langeveld, J.W.A. et al., (eds.) ‘The biobased economy: biofuels, materials and chemicals in the post-oil era’ London: Earthscan, pp180-198

95

Further Information
IEA Bioenergy Website www.ieabioenergy.com
Contact us: www.ieabioenergy.com/contact-us/