Embed Size (px)
Citation preview

MOBILE THROUGHPUT OF 802.11b FROM MOVING VEHICLE TO ROADSIDE ACCESS POINT James Marca Institute of Transportation Studies University of California Irvine
ATMS Testbed Technical Report TTR3-16
This work was performed as part of the ATMS Testbed Research and Development Program of the University of California, Irvine. The contents of this report reflect the views of the authors who are responsible for the facts and the accuracy of the data presented herein. The contents do not necessarily reflect the official views of polices of the State of California. This report does not constitute a standard, specification, or regulation.
June 2005

1
MOBILE THROUGHPUT OF 802.11b FROM MOVING VEHICLE TO ROADSIDE ACCESS POINT
James E. Marca
SUMMARY This report documents work to date on testing 802.11b wireless communication technology for vehicular use. Data has been collected and some preliminary analysis has been performed for vehicle to roadside communication. The work is on-going, with further analyses of the data planned, and vehicle to vehicle tests still to be performed.
1 TEST EQUIPMENT The test setup is as follows. Two Cisco AP 350 series wireless access points were mounted on buildings fronting Peltason Road. The access points were connected to building mounted 13.9dBd antennas. The antenna specifications are as follows:
• 3dB Beamwidth, Degrees E-Plane 30
• 3dB Beamwidth, Degrees H-Plane 34
• Enclosure Material UV Stable Polycarbonate
• Frequency, MHz 2400-2500
• Front to Back Ratio, dB 18
• Gain dBd 13.9
• Impedance (ohms) 50
• Mast Dia in(cm) 2-1/8(5.4)
• Mount Style Mast w/U-Bolts
• No. Elements 15
• RF Connector(f) N
• Ultralink Cable in.(cm) 12(30.5)
• Weight, lb(kg) 1 (.455)
One antenna was mounted on the Multipurpose Science and Technology (MST) building, and the other was mounted on the Engineering Gateway (EG) building. As one can see from the specifications, the antennas are directional antennas. Both are pointed in a westerly direction along Peltason Road.

2
Inside of the vehicle, wireless connectivity was achieved using a Lucent Orinoco Silver PCMCIA card, with a 5db gain omni directional external antenna plugged into the card and mounted on the vehicle roof using a magnetic mounting. The laptop powering the card was also connected to UCI-ITS’s extensible data collection unit (EDCU), in order to obtain geographic information on the wireless signal. The system was also tested running on the EDCU directly, using the second generation EDCU’s built-in 802.11b board, but the results have so far been unsatisfactory due to defects in the unit’s design.
In order to test the wireless link capacity, the utility program Netperf was used [Jones, 2005]. Netperf is designed to test various aspects of a network connection. In this test, it was configured to repeatedly conduct throughput tests with a one-second duration. Other modes allow for variation in the sent signal socket size, the received signal socket size, the size of the sent signal blocks, and so on. Future tests will explore these variations in order to more fully characterize the wireless link.
The actual command line used for the netperf program is as follows (all on one line):
netperf -l 1 -H jtorous.its.uci.edu -t TCP_STREAM -P 0 -- -m 1024 -s 8092 -S 8092
In practice, since the polling rate of the GPS antenna is also 1 second, a netperf reading was obtained for every other GPS reading, or once every two seconds.
2 DATA COLLECTION Several trips were made on multiple days on Peltason, along Bison, and in and around the nearby streets and parking lots in the vicinity of the two building mounted antennas. The test procedure was controlled by a script, as follows:
1. power up and begin driving
2. associate with an access point
3. establish a DHCPCD connection with an access point
4. test loop
a. poll the GPS antenna for time and position
b. run the netperf test for the time and position
Once the DHCPCD connection was established for a particular test run, it was not necessary to reestablish the 802.11b antenna’s assigned IP address, even if the vehicle moved from one access point (AP) to the other, or moved out of range entirely, since both APs are on the same subnet. When the vehicle moved out of range of the access points, the netperf call would stall for an extended time period while it waited for a response. During that time, GPS readings would continue to be recorded, so that the points where no contact was possible are also recorded.

3
3 COLLECTED DATA Data were collected over several days. To date, 3,263 GPS observations have been recorded within the test area using the above procedure. Of those, there are 417 observations of non-zero 802.11b throughput values. The maximum throughput observed was 4.62 Mbps, which compares favorably with what would be expected using 802.11b in the more typical indoor environment. More interesting is the fact that this maximum throughput value was measured while the vehicle was traveling at 30.7 mph. The measurement was taken at an approximate distance of 159 meters from the MST building access point.
3.1 Speed effects Within the collected data, there is no immediate relationship between increasing speed and decreasing throughput. This is because distance and line of sight are more important variables, and must be controlled for first. Comparing Figure 1 against Figure 2 shows no immediately obvious differences in the distribution speeds for all points and those with 1 Mbps or greater throughput. Comparing the histograms for Figure 2 and Figure 3 (greater than 4 Mbps throughput) shows a slight shift in the peak to the left, indicating that higher throughputs tend to occur at lower speeds. However, the high throughputs also occur at 35 to 40 miles per hour, which is the speed limit within most of the test area.
Figure 1. Histogram of speeds for observations points within 1500 meters of MST
antenna

4
Figure 2. Histogram of speeds for observations points within 1500 meters of MST
antenna, with 802.11b throughput greater than 1 Mbps.
Figure 3. Histogram of speeds for observations points within 1500 meters of MST antenna, with 802.11b throughput greater than 4 Mbps.
3.2 Distance effects The effect of distance was surprising. The distance histograms are shown in the following figures. Comparing the histogram for all points in Figure 4 with that for all positive throughput points in Figure 5 shows that positive throughput is more likely to occur at points closer to the antenna, as expected. However, examining Figure 6 shows that high throughput values are even more likely to occur at distances between 800 and 1000 meters than between 200 and 400 meters. If one drives the road and observed the

5
topology, the reason for this is clear. The antenna on the MST building is pointing directly at the intersection of Bison and California. Then, in addition to the directionality of the antenna, there is a line-of-sight blockage that occurs due to the hill located between the MST building and the intersection of Bison and Peltason. Thus as a vehicle drives towards the MST building from the 73 freeway, it will enter a region of high capacity at Bison and California, lose the connection entirely as it turns onto Peltason, and then suddenly pick up a strong, high-throughput signal again as it crests the hill and rounds the curve towards the MST building.
Figure 4. Histogram of distance for observations points within 1500 meters of
MST antenna
Figure 5 Histogram of distance for observations points within 1500 meters of
MST antenna, with 802.11b throughput greater than 0 Mbps.

6
Figure 6 Histogram of distance for observations points within 1500 meters of
MST antenna, with 802.11b throughput greater than 4 Mbps. An additional, more thorough test of network throughput, performed outside of a vehicle within the area of the intersection of Bison and California (approximately 1000 meters away from the MST building antenna) showed that the connection could sustain throughput of 3.56 Mbps ±2.5% at 99% confidence level, based on a series of 10 second duration netperf tests. This site is conveniently located immediately outside of a Starbucks coffee outlet.
Figure 7 depicts a map showing the test area and the points of non-zero throughput. In a color version of this document, the red circles indicate points where greater than 4 Mbps throughput was measured. This includes the intersection of California and Bison, as well as the area of road immediately adjacent to the two antenna sites. The MST building antenna is located at the corner of Circle View and Peltason (the left triangle) and the EG building antenna is located just to the right of the intersection of Los Trancos and Peltason (the right triangle).

7
Figure 7. Map of 802.11b throughput test area. The circles indicate areas of
positive throughput measurement. In a color map, the red circles indicate points where greater than 4 Mbps throughput was measured.
3.3 Line of sight As can be seen from the map of Figure 7, the connectivity is highly directional. This is for two reasons. First, the antennas are directional, and are pointing in a westerly direction along Peltason. Second, 802.11b requires a clear line of sight. As one approaches the Engineering Gateway building from the east, the EG antenna is blocked by the eastern half of that building, which stairsteps out towards the road. As one approaches the MST building from the west, the line of sight is blocked by the curve and by a hill, so that as a vehicle crests the hill and rounds the curve, it suddenly jumps from no connection, to being in an optimal position to establish a wireless connection with the MST building antenna.
Line of sight can be approximated by computing the angle between the vehicle and the antenna. This is shown in Figure 8. The angle between the MST building antenna and the intersection of Bison and California is 192 degrees. Figure 9 focuses on just the 34 degree band centered on 192 degrees.

8
Figure 8. Angle versus distance for recorded points. Circles are points with
positive throughput. Angle has been rotated such that zero is approximately east, and 180 is approximately west (inverted when compared to the map in Figure 7).
9
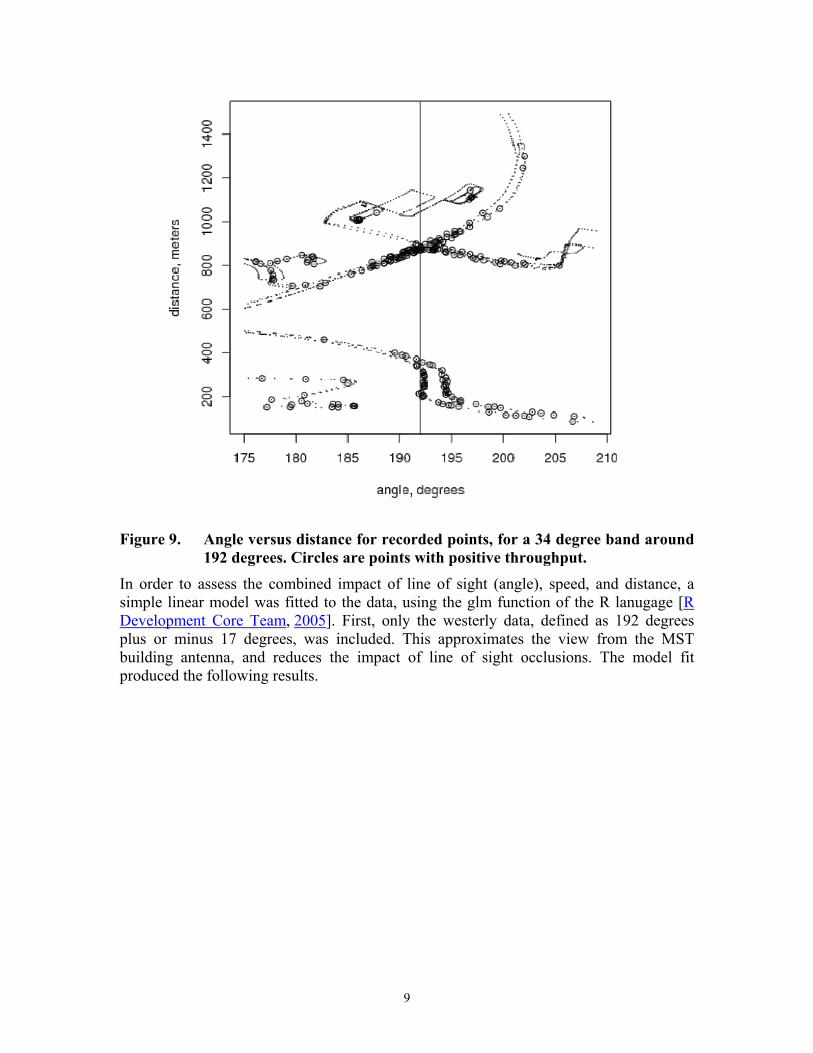
Figure 9. Angle versus distance for recorded points, for a 34 degree band around
192 degrees. Circles are points with positive throughput. In order to assess the combined impact of line of sight (angle), speed, and distance, a simple linear model was fitted to the data, using the glm function of the R lanugage [R Development Core Team, 2005]. First, only the westerly data, defined as 192 degrees plus or minus 17 degrees, was included. This approximates the view from the MST building antenna, and reduces the impact of line of sight occlusions. The model fit produced the following results.

10
Call: glm(formula = thpt[posthpt & west] ~ approxdist[posthpt & west] + spd[posthpt & west] + angle.off.192[posthpt & west]) Deviance Residuals: Min 1Q Median 3Q Max -3.35155 -1.04839 -0.02285 1.14324 2.92448 Coefficients: Estimate Std. Error t value Pr(>|t|) (Intercept) 4.9144968 0.3644517 13.485 < 2e-16 approxdist[posthpt & west] -0.0019711 0.0003172 -6.214 2.65e-09 spd[posthpt & west] -0.0248675 0.0088371 -2.814 0.00535 angle.off.192[posthpt & west] -0.1790187 0.0216300 -8.276 1.33e-14 ---
All values are in the expected direction (negative), with distance and angle away from 192 degrees being more significant that speed. If angle is removed from the model, the speed coefficient is even less significant. Similar results are obtained if the acceptable angle is tightened further, to 192 degrees plus or minus 5 degrees, as follows.
Call: glm(formula = thpt[posthpt & west.5d] ~ approxdist[posthpt & west.5d] + spd[posthpt & west.5d] + angle.off.192[posthpt & west.5d]) Deviance Residuals: Min 1Q Median 3Q Max -3.2825 -1.2331 0.2676 1.1392 2.3799 Coefficients: Estimate Std. Error t value Pr(>|t|) (Intercept) 5.3367090 0.5936785 8.989 1.96e-15 approxdist[posthpt & west.5d] -0.0020871 0.0005797 -3.600 0.000445 spd[posthpt & west.5d] -0.0392422 0.0142851 -2.747 0.006834 angle.off.192[posthpt & west.5d] -0.2129229 0.0918814 -2.317 0.021988 ---
As expected, the impact of angle of deflection away from 192 degrees is insignificant, as there isn’t much deviation. Again, both distance and speed are significant, with their impact slightly higher (more negative) on throughput than for the wider, 34 degree data window.
The results are somewhat unsatisfactory in that the throughput values were not significantly reduced by either distance or speed. Instead, the largest effect was losing the line of sight. At distances greater than 1000 meters (moving away from California on
11
Bison, towards the 73 freeway), the road drops down a slight hill, thus blocking the signal from the MST building antenna, limiting the value of distance measurements. Further, the intersection of Bison and California is controlled by a stop sign. Without breaking the law, it is impossible to test the effect of higher vehicle speeds upon throughput at large distances.
4 CONCLUSIONS AND FURTHER WORK This report documents some preliminary results that were obtained for data throughput values from a moving vehicle communicating with a fixed, roadside access point over 802.11b. It has been shown that a signal is possible at distances of over 1000 meters, with a throughput of greater than 4 Mbps at those distances. By way of comparison, at this throughput one could download the pdf map file of UC Irvine available on the campus website within one second.
There are several tests which still need to be performed. First, the various parameters relating to the network performance test, such as the test message block size and the send and receive socket sizes need to be varied to ascertain their impact upon the throughput. Second, it is desirable to measure instances where the throughput decreases to zero based on distance alone, and speed alone, in order to properly characterize the effects of these parameters. To date vehicle to access point communications has been limited only by line of sight considerations (buildings and hills). Another important class of tests are vehicle to vehicle communications. These tests will follow more complete characterization of vehicle to roadside communications.
REFERENCES Rick Jones. Public Netperf homepage, 2005. URL http://www.netperf.org/netperf/
NetperfPage.html.
R Development Core Team. R: A Language and Environment for Statistical Computing. R Foundation for Statistical Computing, Vienna, Austria, 2005. URL http://www.R-project.org. ISBN 3-900051-07-0.