Embed Size (px)
Citation preview

ADVANCED DRAFT
November 2012
Mobile Phone Usage at the Kenyan Base of the Pyramid Final Report iHub Research Angela Crandall, Albert Otieno, Leonida Mutuku, Jessica Colaço Research Solutions Africa Jasper Grosskurth, Peter Otieno

2
Acknowledgements This case study of Mobile usage at the Base of the Pyramid in Kenya has been commissioned by infoDev, a global partnership program within the World Bank, and conducted by iHub Research and Research Solutions Africa. It is part of a broader research project looking at how the poorest of the world's citizen use mobile phones to enhance their lifestyles and livelihoods. A comparator study for South Africa has been commissioned and other studies are planned as part of infoDev's Mobile Innovation program. The authors of the report are Angela Crandall, Albert Otieno, Leonida Mutuku and Jessica Colaço (iHub Research) and Jasper Grosskurth and Peter Otieno (Research Solutions Africa). The Task Team Leader on behalf of InfoDev is Tim Kelly and the Task Manager is Maja Andjelkovic. The authors would to thank the peer reviewers for the project, Kevin Donovan (University of Cape Town), Toni Eliasz and Nicolas Friederici (infoDev), Monica Kerretts (Communications Commission of Kenya) and Rohan Samarajiva (LIRNEasia), for their editorial review and the Research ICT Africa team, notably Christophe Stork and Alison Gillwald, for providing additional household data and for their insights. The research program has benefitted from funding from UKaid and the Ministry for Foreign Affairs of the Government of Finland. For further information contact:
iHub Research 2nd Floor Bishop Magua Center, off Ngong Road Nairobi, Kenya http://research.ihub.co.ke
infoDev / World Bank 1818 H Street NW Washington DC 20433 USA http://www.infodev.org

3
Table of Contents
Introduction ..................................................................................................................... 8 1.1 Background .................................................................................................................. 8 1.2 Methodology ................................................................................................................. 9 1.2.1 Base of the Pyramid .................................................................................................10 1.2.2 Sample Size .............................................................................................................11 1.2.3 Face-to-Face Interviews with BoP Individuals ...........................................................13 1.2.3.1 Diaries with BoP individuals ...................................................................................16 1.2.4 Focus Group Discussions (FGDs) with BoP communities .........................................16 1.2.5 Face-To-Face Interviews With Existing Mobile Application Developers ....................16 1.2.6 Key Informant Interviews ..........................................................................................17 1.2.7 Analysis and Reporting .............................................................................................17
Key Findings ................................................................................................................. 18 2.1 General Usage of Mobile Phones ................................................................................18 2.1.1 Acquiring of Phone ...................................................................................................18 2.1.2 Mobile Service Providers ..........................................................................................22 2.1.3 Phone Functionalities ...............................................................................................24 2.1.4 Phone Functionality Usage .......................................................................................27 2.2 Mobile Money Making Potential ...................................................................................34 2.3 Phone Expenses .........................................................................................................36 2.3.1 Sacrificing .................................................................................................................36 2.3.2 Mobile Services Spending Habits .............................................................................37 2.3.3 Charging mobile phone battery .................................................................................39 2.3.4 Our survey respondents stated that on average, 22 ksh were spent a week on charging their phone battery. .............................................................................................39 2.4 Mobile Phone Services, Products, and Applications ....................................................40 2.4.1 Awareness of Applications and Services Amongst BoP ............................................43 2.4.2 Use of Mobile Applications and Services by the BoP ................................................44 2.4.3 Mobile Applications Uptake ......................................................................................45 2.4.4 Mobile Services Desired ...........................................................................................47 2.5 Impact of Mobile Phones on Kenyan BoP ....................................................................50 2.5.1 Decrease In Travel Costs And Time .........................................................................51 2.5.2 Social and Work-related Communication and Relationships .....................................51 2.5.3 Lost Money Due To Lack of Technical Know-How ....................................................52 2.5.4 Security Concerns And Conning ...............................................................................52 2.5.5 Sacrificing (especially of food stuffs) .........................................................................53
Opportunities and Challenges in the Kenyan Mobile Eco-system ................................. 54 3.1 Developers ..................................................................................................................54 3.1.1 User Needs ..............................................................................................................54 3.2.2 Ponder your platform choice and partnerships ..........................................................54 3.2 Government ................................................................................................................55 3.2.1 Promote cooperation between the various stakeholders ...........................................55 3.2.2 Become a key customer ...........................................................................................56

4
3.3 Donors and Investors ..................................................................................................56 3.4 MNOs and Phone Manufacturers ................................................................................56
Conclusions ................................................................................................................... 58
LIST OF TABLES TABLE 1. SUMMARY OF ACHIEVED SURVEY OUTPUTS BY DATA COLLECTION APPROACH AND SAMPLE AREA ........... 12 TABLE 2. HIGHEST LEVEL OF EDUCATION ACHIEVED BY SURVEY RESPONDENTS ..................................................... 15 TABLE 3. CURRENT EMPLOYMENT STATUS OF SURVEY RESPONDENTS .................................................................... 15 TABLE 4. INTERVIEWS CONDUCTED WITH START-UP MOBILE APPLICATION DEVELOPERS ....................................... 16 TABLE 5. KEY INFORMANT INTERVIEWS CONDUCTED IN SEPTEMBER 2012. ............................................................. 17 TABLE 6. METHOD OF ACQUISITION OF CURRENT PHONE. SOURCE: IHUB RESEARCH/RSA, 2012. ........................ 20 TABLE 7. REASONS FOR MULTIPLE PHONE OWNERSHIP. SOURCE: IHUB RESEARCH/RSA ...................................... 20 TABLE 8. PHONE SHARING AMONGST SURVEY RESPONDENTS. SOURCE: IHUB RESEARCH/RSA ............................ 21 TABLE 9. NETWORK USAGE BY SURVEY PARTICIPANTS. SOURCE: IHUB RESEARCH/RSA ....................................... 22 TABLE 10. NUMBER OF NETWORK PROVIDERS USED. SOURCE: IHUB RESEARCH/RSA........................................... 23 TABLE 11. CROSS TABULATION BETWEEN NETWORK CHOSEN AND REASON FOR CHOOSING NETWORK. SOURCE:
IHUB RESEARCH/RSA ....................................................................................................................................... 23 TABLE 12. REASONS GIVEN FOR CHOOSING A PARTICULAR MOBILE NETWORK OPERATOR SERVICE. SOURCE: IHUB
RESEARCH/RSA ................................................................................................................................................ 24 TABLE 13. MOBILE DEVICES AND THEIR CAPABILITIES. ADAPTED FROM BOX 1.1 IN INFODEV'S ICT4D 2012
REPORT.............................................................................................................................................................. 24 TABLE 14. COUNT OF PHONE FUNCTIONALITIES BASED ON SURVEY RESPONDENTS. SOURCE: IHUB
RESEARCH/RSA ................................................................................................................................................ 26 TABLE 15. USAGE OF PHONE FUNCTIONALITIES AND SERVICES BY SURVEY RESPONDENTS COMPARED TO
NATIONALLY REPRESENTATIVE DATA. SOURCE: IHUB RESEARCH/RSA; RIA 2012 ........................................ 27 TABLE 16. DAILY AVERAGE MOBILE USAGE BASED ON DIARY RESPONDENTS. SOURCE: IHUB RESEARCH/RSA ..... 29 TABLE 17. TOTAL COUNT OF CALLS RECORDED OVER THE FOUR-DAY PERIOD OF THE DIARY STUDY. SOURCE:
IHUB RESEARCH/RSA ....................................................................................................................................... 31 TABLE 18. AVERAGE DURATION OF CALLS BY TIME OF DAY BASED ON DIARY RESPONDENTS. SOURCE: IHUB
RESEARCH/RSA ................................................................................................................................................ 31 TABLE 19. COUNT OF RESPONDENT SENDING SMS PER PERIOD. SOURCE: IHUB RESEARCH/RSA...................... 32 TABLE 20. MONEY MADE THROUGH THE USE OF MOBILE PHONES BASED ON SURVEY RESPONDENTS. SOURCE:
IHUB RESEARCH/RSA ....................................................................................................................................... 34 TABLE 21. ACTIVITIES WHICH MADE MONEY THROUGH THE MOBILE PHONE. SOURCE: IHUB RESEARCH/RSA ....... 34 TABLE 22. CROSS-TABULATION BETWEEN THE ACTIVITY CONDUCTED AND MONEY AMOUNT RECEIVED BASED ON
SURVEY RESPONDENTS. SOURCE: IHUB RESEARCH/RSA ............................................................................... 35 TABLE 23. SOURCE OF MONEY FOR RELOADING AIRTIME ON MOBILE PHONE. SOURCE: IHUB RESEARCH/RSA ..... 36 TABLE 24. FOREGOING OF EXPENSES IN ORDER TO USE MOBILE PHONE. SOURCE: IHUB RESEARCH/RSA ........... 36 TABLE 25. EXPENDITURES FORWENT AND APPROXIMATE FREQUENCY. SOURCE: IHUB RESEARCH/RSA .............. 37 TABLE 26. DAILY SPENDING ON MOBILE SERVICES. SOURCE: IHUB RESEARCH/RSA .............................................. 38 TABLE 27. MOBILE PHONE ACTIVITY AND AVERAGE ASSOCIATED COST BASED ON DIARY RESPONDENTS. SOURCE:
IHUB RESEARCH/RSA ....................................................................................................................................... 38 TABLE 28. MOBILE PHONE CHARGING LOCATION BASED ON SURVEY RESPONDENTS. SOURCE: IHUB
RESEARCH/RSA ................................................................................................................................................ 39 TABLE 29. AMOUNT SPENT ON CHARGING OF PHONE BATTERY PER WEEK. SOURCE: IHUB RESEARCH/RSA......... 39 TABLE 30. CROWD-SOURCED LIST OF MOBILE PHONE APPLICATIONS IN KENYA. MOST OF THESE APPLICATIONS
HAVE BEEN DEVELOPED BY START-UP TECH COMPANIES. SOURCE: IHUB RESEARCH .................................... 40 TABLE 31. DEFINITIONS AROUND MOBILE APPLICATIONS AND SERVICES. SOURCE: IHUB RESEARCH ..................... 42

5
TABLE 32. AWARENESS OF MOBILE PHONE SERVICES AND APPLICATIONS BASED ON SURVEY RESPONDENTS.
SOURCE: IHUB RESEARCH/RSA ....................................................................................................................... 43 TABLE 33. USE OF MOBILE PHONE APPLICATIONS AND SERVICES. SOURCE: IHUB RESEARCH/RSA .................... 44 TABLE 34. ADDITIONAL MOBILE SERVICES DESIRED BY SURVEY RESPONDENTS. SOURCE: IHUB RESEARCH/RSA
........................................................................................................................................................................... 48 TABLE 35. DISAGGREGATION OF KENYANS’ MOBILE MONEY TRANSFER PURPOSE (GENERAL POPULATION).
SOURCE: RIA, 2012 DATA. ............................................................................................................................... 51
LIST OF FIGURES FIGURE 1. OVERVIEW OF METHODS USED .................................................................................................................. 11 FIGURE 2. SURVEY LOCATIONS ACROSS KENYA ........................................................................................................ 12 FIGURE 2. RESPONDENTS' AGE DISTRIBUTION .......................................................................................................... 14 FIGURE 3. KENYA NATIONAL AGE DISTRIBUTION IN 2010. SOURCE: US CENSUS BUREAU, INTERNATIONAL DATABASE. ...................... 14 FIGURE 5. YEAR OF FIRST PHONE ACQUISITION BY KENYAN BOP. SOURCE: RIA, 2012 DATA (2012). NB: MOBILE
PENETRATION AT THE BOP NOW STANDS AT 60% OF THE BOP POPULATION (RIA, 2012). ........................... 19 FIGURE 6. PERCENTAGE SUBSCRIPTION MARKET SHARE PER OPERATOR. SOURCE: CCK Q4 2012 REPORT. .... 22 FIGURE 7. PHONE TYPE CATEGORIZED BASED ON PHONE MODEL PROVIDED BY RESPONDENTS. N = 592. SOURCE:
IHUB RESEARCH/RSA ....................................................................................................................................... 26 FIGURE 8. ESTIMATED NUMBER OF INTERNET USERS AND INTERNET PENETRATION. SOURCE: CCK Q4
2011/2012 REPORT .......................................................................................................................................... 28 FIGURE 9. AN ESSAR YU ADVERTISMENT FOR FREE FACEBOOK BROWSING ............................................................ 29 FIGURE 10. NUMBER OF CALLS MADE BY TIME OF DAY AS DOCUMENTED IN A 4-DAY DIARY (N=176). SOURCE: IHUB
RESEARCH/RSA ................................................................................................................................................ 30 FIGURE 11. NUMBER OF SMS SENT BY TIME OF DAY AS DOCUMENTED IN THE 4-DAY DIARIES (N=176). SOURCE:
IHUB RESEARCH/RSA ....................................................................................................................................... 31 FIGURE 12. USAGE OF PHONE ACTIVITIES THROUGHOUT THE DAY (N = 157) (OTHER THAN CALLING AND SMS).
SOURCE: IHUB RESEARCH/RSA ....................................................................................................................... 33 FIGURE 13. M-KESHO IS A PRODUCT CREATED COLLABORATIVELY BETWEEN EQUITY BANK AND SAFARICOM ...... 45 FIGURE 14. FACEBOOK'S MANY AVENUES OF REACH. SOURCE: HTTP://WWW.ICTWORKS.ORG/ .............................. 55 FIGURE 15. SCREENSHOT OF NOKIA LIFE TOOLS'S SIMPLE USER INTERFACE. SOURCE: TOPNEWS.IN ................... 55

6
Executive Summary
With the cost of mobile phones decreasing steadily, what was once considered a luxury good is
now more commonly considered a necessity by many Kenyans, including those at the economic
base of the pyramid (BoP). iHub Research and Research Solutions Africa conducted a 6-month
study in order to increase the understanding of actual usage of mobile services, products, and
applications at the BoP and to understand their potential for economic and social empowerment.
The study covered urban and rural areas of 6 districts in Kenya. Its findings are not nationally
representative, but comparisons with representative surveys show no significant differences for
key indicators, such as phone possession. The added value of the study at hand lies in the
qualitative insights on choices, lifestyles, habits and mobile phone usage patterns used among
phone owners at the BoP, as well as its focus on add-on services ranging from phone
applications to various Internet tools.
The following were key findings from the study:
Over 60% of the respondents among the Kenyan BoP own a mobile phone, but
very few use applications other than M-PESA
Most people in the BOP survey have access to mobile phones, but they do not exploit
the phone’s full potential by using applications (except for M-PESA). This is due to
lacking awareness/marketing campaigns, confusion about the difference between
applications, phone functionalities, and Internet, and challenges in the use of
USSD/SMS applications.
1 in 4 Kenyan BoP mobile phone owners use Internet on their mobile phone
One in 4 respondents stated that they browse the Internet on their mobile handset,
though very few knew what data bundles were. Therefore it seems that the BoP are
either using pay-as-you-go Internet plans or, more likely, taking advantage of offers to
use highly limited Internet access for free. For example, Essar Yu offers Free Facebook
browsing1 and Orange Kenya has recently started offering Free Wikipedia access2.
1 in 5 forgo an expenditure to buy credit
One in 5 respondents interviewed had foregone some usual expenditure in order to
reload their phone with credit. Among those respondents who forgo a usual expense, it
was established that on average, they forgo Ksh 72 weekly in order to reload and use
1 Essar Yu launched free browsing on Facebook 24/7 in December 2011 in an attempt to expand its
subscriber base. 2 On August 20, 2012, Orange Kenya announced that subscribers of Orange with an Internet-enabled
mobile phone will be able to access Wikipedia as many times as they want at no cost through their Internet browser (http://allafrica.com/stories/201208210174.html).

7
their mobile phone, with the maximum amount being Ksh 999 and minimum being Ksh
10.
Money making potential of the phone comes from being more accessible
A quarter of our study respondents stated that they had earned money through the use
of their mobile phone. Of those who had earned money through their mobile phone, the
majority did so by directly getting more work because they were more “reachable.”
No difference in mobile phone activities between men and women other than
mobile Internet usage, which is dominated by educated male youth
Similar to LIRNEasia findings (2006 data) in the Philippines and Thailand and findings
from Ghana, Uganda, and Botswana (Scott & McKemey, 2002), no significant gender
difference was noted in mobile phone activities. The one exception was in the usage of
mobile Internet where 18-29 year old males were found to browse the Internet and
conduct online activities on their phones (Skype, download mobile applications, check
email) the most.
Higher likelihood of technology usage by those educated past primary level
More educated respondents have a higher likelihood of technology usage. Most
respondents without any formal education did not send SMS messages, browse the
Internet on their mobile phone, nor use M-PESA as much as their educated counter-
parts.
Health and education Information most desired
Of the information most desired by the BoP respondents, health information tops the list
followed closely by educational information. This suggests that despite the increase in
the development of ICT applications tackling issues in the health, education, and
agricultural sectors, none of these applications have yet been able to reach scale the
way that mobile phone-based financial products have been able to in Kenya.
Based on these key facts and other insights gained from the research, we advise mobile application developers focused on BoP to develop for their users’ specific needs, and carefully ponder their technological platform choice. We believe that due to the difficulties faced by mobile application start-ups for scaling, collaboration amongst the stakeholders in the mobile telephony industry is critical for relevant mobile applications to reach the BoP. The fact that no applications beyond M-PESA have found a wide user base shows that efforts by individual organizations are unlikely to reach the required critical mass for impact. If Government, MNOs, Donors and Investors, and Local Content Developers can form meaningful partnerships, the applications being developed locally may be able to scale further and faster, thereby hopefully helping to alleviate some of the poverty at the base of the pyramid in Kenya.

8
Chapter 1
Introduction
1.1 Background In the past few years, the Information and Technology Sector has emerged as a steadily growing contributor to the Kenyan economy. Since 2000, the sector has outperformed all other in the Kenyan economy, growing on average by approximately 20% annually (World Bank Economic Update, 2010). This has been largely due to the major advancements in infrastructure, favourable government policy, as well as an active and innovative private sector. Many Kenyans are now interacting actively with technology in terms of creation and development of the technology, as well as actual application and dissemination of technology products and services. In this manner, as technologies advance, they are becoming integral components of daily lifestyle. According to Kenya’s communications regulator in their Quarterly Sector Statistics Report (June 2012), Kenya has a mobile penetration of 75.4% (October, 2012). This figure is significantly higher than the African average of 65% (Praekelt, 2012). Nevertheless, these figures could offer a slightly misleading picture of access to mobile phones, since there is an important difference between mobile connections and unique individual mobile subscribers.3 The high mobile usage holds true even for those at the lower end of the economic spectrum. Of those Kenyans living on less than $2.5 USD/day, 60.5% owned a mobile phone (RIA, 2012). With the cost of mobile phones decreasing steadily, what was once considered a luxury good is now more commonly considered a necessity by many Kenyans. Much of the literature on Information Communication Technologies (ICTs) suggests that with the availability of telecommunications, incomes increase and local economies become more efficient (Jensen, 2007; Aker, 2008). Survey data from Morocco reveals that mobile phones make a financial difference in the lives of microentrepreneurs and act to both intensify and extend local and nonlocal forms of communication (Ilahiane & Sherry, 2012). We anticipate the same to hold true in the Kenyan context, although a definitive quantitative study has yet to be released. Research on mobile usage at the base of the pyramid from Asia has shown that voice calls and SMS are the most common activities (LIRNEasia, 2009). The same research shows that there is a small but growing segment of the BoP that uses “more-than-voice” services including mobile Internet. The African market shares similar characteristics of usage at the BoP, with calling and SMS the most popular services (Okello et al., 2009; Crandall, 2011). “Beeping” or the use of intentional missed calls is also a common practice in both Asia and Africa (Donner, 2005; LIRNEasia, 2009) demonstrating the price sensitivity of this market. There has not been any
3 According to a recent report by GSMA on the topic, of the 68% mobile penetration rate in
Africa, only 33% are unique users owing to over counting of SIM cards (2012). This finding should be strengthened with more research in this area.
9
data available on mobile Internet usage at the BoP in Kenya, one of the important contributions of this study. A growing body of literature on the base of the pyramid focuses on how to develop innovative business models for this population (see Anderson & Markides, 2006; Akula, 2008; Frandano et al., 2009; Ismail & Masinge, 2011; Hystra, 2011; GSMA, 2012). Roughly, these business models focus on keeping products simple, useful, and affordable; taking into account the variable income of the BoP; and building for the environment, culture, and norms already in existence. In anthropological and philosophical literature, there is also a debate centered around the notion of “BoP” and whether an emphasis on market-based solutions depoliticizes the notion of human development and overlooks the influence of history and context (see Bendell, 2005; Kuriyan et al, 2008; Elyachar, 2012; Ilahiane & Sherry, 2012). Karnani (2007) argues that rather than targeting the BoP as a niche consumer market, private sector can play a greater role in poverty alleviation by viewing the poor as producers and buying from them rather than just attempting to sell to them. Not surprisingly, a sizable segment of the literature on ICT in Kenya looks at M-PESA, arguably the world’s most successful mobile money transfer platform, and analyzes possible reasons for its wide-spread success and uptake (see Hughes & Lonie, 2007; Mas & Ng’weno, 2009; Mbogo, 2010; Morawczynski, 2011; Jack & Suri, 2011; Stuart & Cohen, 2011; Dermish et al., 2012). The general consensus is that M-PESA was largely successful in Kenya because of Safaricom’s significant market dominance, strong branding, and the openness of the Kenyan regulator to encouraging innovation, thus allowed M-PESA to emerge and flourish. The literature continues to expand as new case studies and statistics emerge with the increasing penetration of mobile phones and innovation around the same changing the lives and livelihoods of citizens. The following outlines findings from fieldwork conducted in Kenya to better understand mobile usage specifically by those at the base of the pyramid. The work was funded by infoDev, a global development financing program housed by the World Bank. This study aims to contribute to the growing body of literature around the subject by offering updated data on the actual usage of mobile devices in Kenya and key perceptions about the value and challenges of mobile phones from the point of view of base of the pyramid users. Our work seeks to advise African technology developers about the BoP end user that should be kept in mind, and looks to update Mobile Network Operators (MNOs), Investors, and Government on the dynamic Kenyan BoP user’s mobile telephony needs.
1.2 Methodology The overall objective of the study was to provide a thorough and fact-based understanding of the current and potential future demand and usage patterns of the mobile devices by the BoP in Kenya. To meet the objective, this study relies on a number of sources:
796 face-to-face interviews in 6 districts across Kenya, covering the urban and rural
populations of each district.
In addition to the questionnaire, 178 participants completed a diary to record in great
detail four days of their phone use. These diaries were supported by the actual phone
logs.

10
12 Focus Group Discussions among phone users in our target group to better
understand the choices made.
10 Key Informant interviews with stakeholders in the Kenyan telecom Industry from
leading managers at providers to representatives of regulatory bodies.
A range of interviews with entrepreneurs, especially with those who aim to serve the
mobile BoP market with add-on services and applications.
Extensive desk research and literature review.
The study also relies on data collected by Research ICT Africa (RIA), who conducted a
South African counterpart to this study and have previously collected mobile phone
usage data among the whole population in Kenya.
The regions and respondents were selected to maximize the diversity of the insights, rather than to proportionally reflect Kenya's population. The multitude of approaches allowed us to develop a nuanced and detailed picture of the BoP mobile phone sector. We felt that especially the rich qualitative insights would provide more valuable information for those with an ambition to serve the BoP through their phones, than 'naked' statistical averages of the market. The fact that RIA had collected nationwide data increases the added value of the qualitative and regionally specific insights collected in our own primary research.
1.2.1 Base of the Pyramid There are a number of definitions of what exactly constitutes the “Bottom of the Pyramid” or “Base of the Pyramid”4. However, the $2.5 per day income criteria (PPP) is currently used in literature and is the definition adopted by the World Bank Group. For this study, we therefore used the $2.50/day income line and adjusted for purchasing power parity (PPP) using 2006 prices. This comes to a poverty line of approximately 2,646.20 Kenyan Shillings income per person per month as of November 2012.5 In addition to using an income line to categorize the BoP, we also used a Living Standards Measure (LSM) to categorize and screen our respondents. LSM refers to a household’s consumption habits as measured by the ability to purchase and consume a variety of goods and services. Kenya’s population is divided into bottom, middle, and upper classes. The Economic Survey 2011 (Kenya National Bureau of Statistics 2011) found that 72% of the Kenyan population belongs to the lower class (24.1% to the middle and 3.6% to the upper class). Our field research categorized and targeted the Kenyan base of the pyramid using both the $2.5/day PPP income line as well as the LSM categorizations. See Appendix A for the cross tabulation of income versus LSM categorization.
4 The Bottom of the Pyramid (BoP) concept was made famous by Prahalad & Hart in 2002.
5 http://www.povertytools.org/countries/Kenya/Kenya.html

11
Figure 1. Overview of methods used
1.2.2 Sample Size This study did not aim to be representative, as our colleagues at Research ICT Africa (RIA) collected nationally representative data from 12 different African countries (including Kenya) and have shared this data with us. We have highlighted their data throughout this report in order to offer the representative statistics of Kenya to compare with our own findings.6 Our own data was purposefully gathered in 6 locations across the country (explained below) where mobile application initiatives are being piloted and where a wide range of Kenyan population groups are represented. Within these regions, sampling was randomized. Interviews with non-phone owners were terminated and replaced with the next random candidate. In contrast to the RIA study, which used random sampling methods across Kenya (see RIA Household and Small Business Access & Usage Survey 2011), our BoP study respondents were either current or previous mobile device owners as a requisite to participate in the research. This phone owning BoP population constitutes approximately 60% of the total BoP population (RIA, 2012).
6 Where Research ICT Africa data is used, we have indicated “(RIA, 2012)”.

12
Figure 2. Survey locations across Kenya
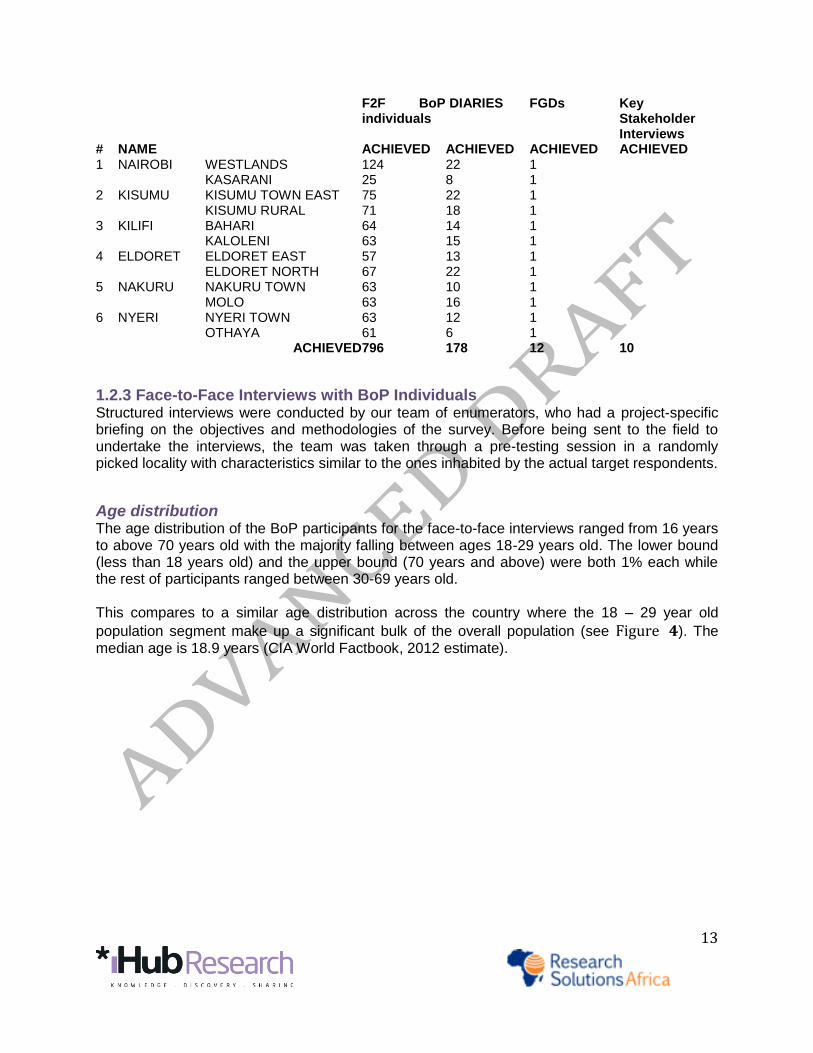
Selection of locations Locations were selected where mobile applications for the BoP are being piloted in order to potentially speak to some of the individuals who have been using the service. Locations were identified based on the literature review and interviews with existing mobile developers. The locations were chosen with the hope of finding larger pockets of mobile phone users at the BoP in order to achieve the project objective of better understanding how mobile phones are being used by the BoP. Nevertheless, despite this purposeful targeted sampling strategy, most research participants interviewed were still unaware of the existence of these mobile applications. We discuss this in greater detail under Key Findings. Table 1. Summary of achieved survey outputs by data collection approach and sample area
COUNTY CONSTITUENCY DELIVERABLES BY DATA COLLECTION APPROACH
13
F2F BoP individuals
DIARIES FGDs Key Stakeholder Interviews
# NAME ACHIEVED ACHIEVED ACHIEVED ACHIEVED 1 NAIROBI WESTLANDS 124 22 1
KASARANI 25 8 1 2 KISUMU KISUMU TOWN EAST 75 22 1
KISUMU RURAL 71 18 1 3 KILIFI BAHARI 64 14 1
KALOLENI 63 15 1 4 ELDORET ELDORET EAST 57 13 1
ELDORET NORTH 67 22 1 5 NAKURU NAKURU TOWN 63 10 1
MOLO 63 16 1 6 NYERI NYERI TOWN 63 12 1
OTHAYA 61 6 1 ACHIEVED 796 178 12 10
1.2.3 Face-to-Face Interviews with BoP Individuals Structured interviews were conducted by our team of enumerators, who had a project-specific briefing on the objectives and methodologies of the survey. Before being sent to the field to undertake the interviews, the team was taken through a pre-testing session in a randomly picked locality with characteristics similar to the ones inhabited by the actual target respondents.
Age distribution The age distribution of the BoP participants for the face-to-face interviews ranged from 16 years to above 70 years old with the majority falling between ages 18-29 years old. The lower bound (less than 18 years old) and the upper bound (70 years and above) were both 1% each while the rest of participants ranged between 30-69 years old. This compares to a similar age distribution across the country where the 18 – 29 year old
population segment make up a significant bulk of the overall population (see Figure 4). The median age is 18.9 years (CIA World Factbook, 2012 estimate).

14
Figure 3. Respondents' Age Distribution
Figure 4. Kenya National Age Distribution in 2010. Source: US CEnsus Bureau, International
Database.
Gender 53% of the survey research participants were females compared to 47% of interviewed respondents being males. The sex ratio in Kenya is 1 (CIA World Factbook, 2012). We aimed for a 1:1 split in gender of respondents.
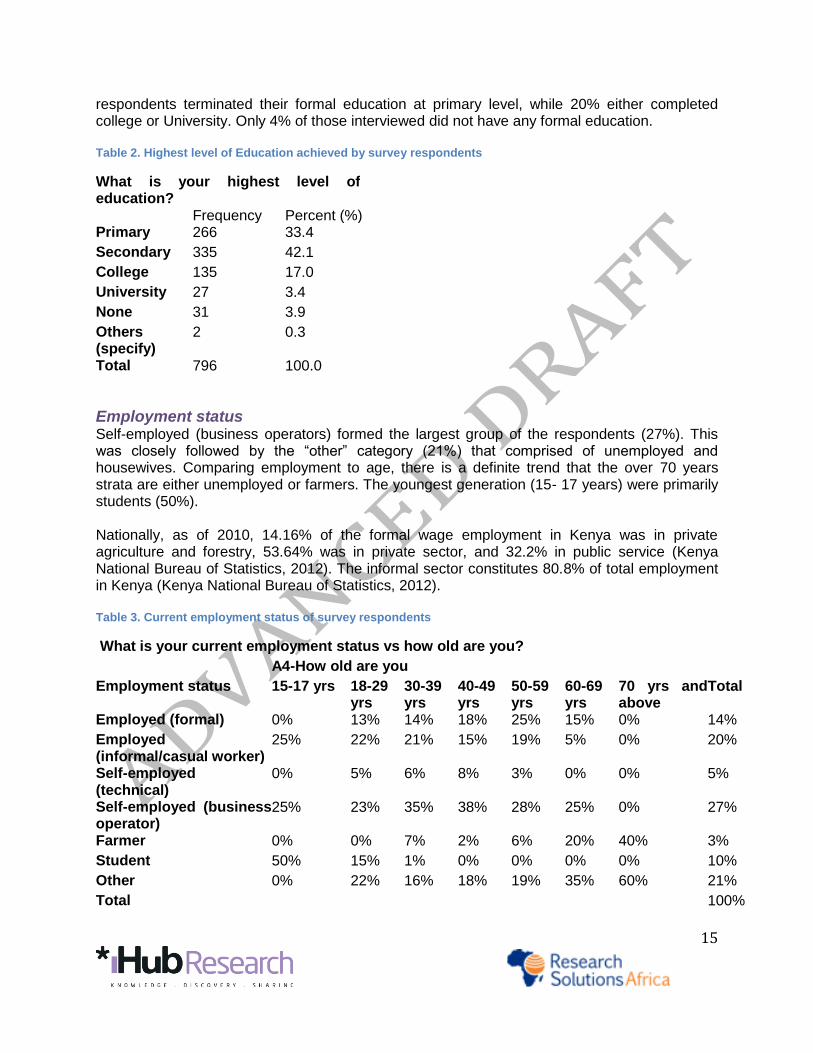
Education level The respondent’s education level ranged from no formal education to University, with the highest number—42%—stating secondary school as their highest level of education. 33% of
15
respondents terminated their formal education at primary level, while 20% either completed college or University. Only 4% of those interviewed did not have any formal education. Table 2. Highest level of Education achieved by survey respondents
What is your highest level of education? Frequency Percent (%) Primary 266 33.4
Secondary 335 42.1
College 135 17.0
University 27 3.4
None 31 3.9
Others (specify)
2 0.3
Total 796 100.0
Employment status Self-employed (business operators) formed the largest group of the respondents (27%). This was closely followed by the “other” category (21%) that comprised of unemployed and housewives. Comparing employment to age, there is a definite trend that the over 70 years strata are either unemployed or farmers. The youngest generation (15- 17 years) were primarily students (50%). Nationally, as of 2010, 14.16% of the formal wage employment in Kenya was in private agriculture and forestry, 53.64% was in private sector, and 32.2% in public service (Kenya National Bureau of Statistics, 2012). The informal sector constitutes 80.8% of total employment in Kenya (Kenya National Bureau of Statistics, 2012). Table 3. Current employment status of survey respondents
What is your current employment status vs how old are you?
A4-How old are you Employment status 15-17 yrs 18-29
yrs 30-39 yrs
40-49 yrs
50-59 yrs
60-69 yrs
70 yrs and above
Total
Employed (formal) 0% 13% 14% 18% 25% 15% 0% 14%
Employed (informal/casual worker)
25% 22% 21% 15% 19% 5% 0% 20%
Self-employed (technical)
0% 5% 6% 8% 3% 0% 0% 5%
Self-employed (business operator)
25% 23% 35% 38% 28% 25% 0% 27%
Farmer 0% 0% 7% 2% 6% 20% 40% 3%
Student 50% 15% 1% 0% 0% 0% 0% 10%
Other 0% 22% 16% 18% 19% 35% 60% 21%
Total 100%

16
1.2.3.1 Diaries with BoP individuals This approach was complimentary to the face-to-face interviews, so that in each of the rural and urban communities of the survey, a selected fraction of the respondents not only had the face-to-face interviews, but also were recruited into the diary-data capture program of the survey. The diary method by design implies at least two interview sessions with the respondents in question. During the first interview session the participants were trained on the use of the diaries, and how to input the relevant data in the appropriate sections of the tool. Upon the interviewer verifying that the respondent in question had absorbed the basics of entering data in the diaries, he/she gave the respondents a copy of the diary to be filled as appropriate by the respondent during the entirety of the allocated data capture period (4 days). The data capture period was not the same days of the week for all locations. Since the diaries were parallel with the survey, the days were selected randomly. Whenever the research team arrived at a location, the diaries began. This distributes the diaries randomly over the week and therefore provides an accurate representation of the activities. The only shortcoming is that comparisons between different regions might be biased. Since the regional differentiation was explicitly not of key interest in the study, we accepted this shortcoming. The data collected by this method supplemented that which was collected during the face-to-face interviews, and verified the face-to-face interview data.
1.2.4 Focus Group Discussions (FGDs) with BoP communities The FGDs were conducted with users of mobile phones at the Base of the Pyramid (BoP), in the various sample points of the survey. Each FGD had an average of ten participants. One FGD was conducted in each of the rural and urban setups of the communities of the survey.
1.2.5 Face-To-Face Interviews With Existing Mobile Application Developers In order to report the existing mobile applications targeting the BoP as well as the business plans already developed, face-to-face interviews were conducted with such relevant stakeholders. Stakeholders were identified during the literature review period, as well as taken from a January 2012 in-house research survey conducted by iHub Research on the entrepreneurs in the iHub/m:lab space. These interviews focused on understanding the products, business models, and the barriers and critical success factors for each approach. Table 4. Interviews conducted with Start-up Mobile Application Developers
MFarm MPrep Soko Shambani FishMate Clubsoci UASAY mScheduler Seeds Uguard mLifeSaver

17
1.2.6 Key Informant Interviews The key informants were persons with some direct established knowledge and/or involvement with the mobile telephony in the country. Respondents were as follows: Table 5. Key Informant Interviews conducted in September 2012.
Job Title/Position Company Director Information Technology Mobile Network Operator Entrepreneur/Administrator Investment Fund East Africa Director of Mobile Banking & Payments Innovation
Major Bank
Director Regulatory Body Africa Director Donor Sales Manager East African electronics retailer Sales Manager Handset retailer Sales Manager Mobile phone manufacturer Retail Proprietor Handset retailer Chain Assistant Manager Local business focused on handset
sales The instruments used in these interviews focused largely on the successes and failures of Kenyan mobile network operators.
1.2.7 Analysis and Reporting Statistical Package for the Social Sciences (SPSS) was used to process the quantitative field data. The field data was first captured and then collapsed to develop unique codes used in coding the completed field questionnaires. The coded data from the said questionnaires was then double entered by the clerks, in close supervision by the Data Processing manager and supervisor. The latter two then cleaned the full survey data to come up with the final clean data set ready for analysis. Statistical analysis software SPSS was then used to analyse the data set. The processing of the qualitative data entailed a thorough transcription of all tape-recorded survey data during the key informant interviews and the focus group discussions. This data was then manually reviewed for interesting key findings and important trends, which were extracted into XLS for further review.

18
Chapter 2
Key Findings
2.1 General Usage of Mobile Phones
2.1.1 Acquiring of Phone There has been a steady rise in mobile acquisition at the BoP since 2000. As of mid-2012, over 60% of the Kenyan base of the pyramid owned a mobile phone (RIA, 2012). Of the remaining BoP who did not have mobile phones, most did not have a mobile phone for the following reasons:
- They cannot afford it (84.7%; RIA, 2012); - There is no electricity at home to charge the mobile phone (44.9%; RIA, 2012); - Their phone got stolen (22.6%; RIA, 2012); - Their phone is broken (11.2%; RIA, 2012); - There is no mobile coverage where they live (5.4%; RIA, 2012); - They don’t have anyone to call (4.8%; RIA, 2012).
It is worth noting that the year 2009 recorded the highest percentage of mobile acquisition both amongst our study respondents as well as nationally representative data. This could be attributed to the drastic fall of prices after the Kenyan government exempted VAT on mobile handsets in June 2009 (GSMA 2011). It is also interesting that in 2007, there is another spike in acquisition of mobile phones and this is the same year that the third mobile network operator (Orange Kenya) entered the Kenyan mobile telephony market. Based on the RIA data, it is appears that very few members of the BoP were interested in or could afford to acquire phones between 1997 and 2001, when the cost and service charges were beyond the reach of most people in the country.

19
Figure 5. Year of First Phone Acquisition by Kenyan BoP. Source: RIA, 2012 data (2012). NB: Mobile penetration at the BoP now stands at 60% of the BoP population (RIA, 2012).
The study established that, of those who had phones, more than half had bought the device themselves. This is surprising since, according to existing literature, the cost of mobile phone services is expected to still pose a burden to low-income earner. According to 2009 data collected by Research ICT Africa, the cost of mobile services can be up to 27% of monthly income in Kenya (Hystra, 2011). Nevertheless, it appears that the value of the phone is significant enough to warrant the purchase. In a subsequent section, we will explore any trade-offs necessary to cover the mobile handset costs. About a quarter of respondents stated that their mobile handset was purchased for them by their parents, relatives or friends. This figure is quite low compared to findings from South Asia (see GSMA mWomen 2012) where ownership through the gifting of phones was as high as 78% (North India). Reasons for this difference is could be attributed to the relative affordability of phones in Kenya and the perceived necessity as a personal device. During a focus group discussion, youth stated that they “hustled” in order to purchase their phone. “Hustling” entailed looking for extra menial work or side businesses such as selling roasted corn, working part-time as construction workers, or “inheriting” their phones. This indicates the strong value attached to owning a mobile phone at the BoP. There is little literature on the prevalence of theft and reselling or gifting of mobile phones in Kenya, but a study on the diffusion of ICTs in the informal sector in Kenya found that respondents complained that the mobile phone had become a target for thieves – in cases of theft, the mobile phone was the first to go (Gikenye & Ocholla, 2012). Also, as mentioned earlier, 22.6% of the BoP in Kenya stated that they do not have a mobile phone because it was stolen from them (RIA, 2012). Wyche et al. (2010) also found that anxieties about theft inhibited some citizens in Nairobi from purchasing
0
2
4
6
8
10
12
14
1997 1998 1999 2000 2001 2002 2003 2004 2005 2006 2007 2008 2009 2010
Pe
rce
nta
ge o
f M
ob
ile P
ho
ne
Ow
ne
rs (
%)

20
the phones they most desired because phones with features such as Internet access and color screens were more likely to be snatched. Table 6. Method of acquisition of current phone. Source: iHub Research/RSA, 2012.
How did you acquire your phone? Responses N Percent
How did you acquire
this phone?
Bought it myself 455 61.4%
Bought for by parents/relative/friend 189 25.5%
Given as a present by
parents/relatives/friend
86 11.6%
Won in a competition 3 .4%
Given by the employer 8 1.1%
Total 741 100.0% Most research participants interviewed had only one mobile handset. Of the 7% that had more than one mobile handset, most had multiple phones to reduce on the inter-network calling costs.7 The reason for owning multiple phones rather than simply multiple SIM cards is likely due to a combination of factors including the hassle to switch SIM cards in and out of one phone (easily lost), and also in order not to miss any calls on either line. At the BoP, more common than multiple handsets are multiple SIM cards, as discussed earlier on page 8. 60.5% of the Kenyan BoP own a mobile phone, but 82% of the Kenyan BoP have at least one active SIM card (RIA, 2012); 15.2% of the Kenyan BoP had 2 active SIM cards (RIA, 2012). These findings based on the RIA data indicate that approximately a fifth of the Kenyan BoP population own a SIM card even if they do not own a mobile phone. Therefore, even if a member of the BoP does not own a mobile handset, they likely have at least a SIM card. This allows the BoP user to have their own phone number and credit to make a call on any borrowed mobile phone device. If a mobile device is owned, owning multiple SIM cards entails swapping of SIM cards depending on which Mobile Network Operator (MNO) service is favorable at that particular moment. Another reason for a greater number of SIM cards than handsets is because of the popularity of dual SIM phones— one handset, which can hold 2 or even 3 SIM cards at a time (such as the Dual SIM Nokia X1-01 and Nokia C2-00). Table 7. Reasons for multiple phone ownership. Source: iHub Research/RSA
Why do you have more than one phone?
7 For example, one phone will have one SIM card, and the other phone, another SIM card so from a
different mobile service provider so that the individual can use either phone/SIM to call depending on the service provider of the person they are calling. This is similar to having 2 SIM cards that are exchanged between one phone, but this allows the owner to send and/or receive calls simultaneously rather than having to swap one out for the other.

21
Responses Percent of Cases To reduce on the inter-network calling costs 17 59%
Some of the networks not available in given areas
10 34%
Each of the phone has specific functional advantage
6 21%
For class/image in various settings 5 17%
The majority of our interviewed respondents do not share their mobile device with anyone else in their household. This is in line with the nationally representative data from RIA (2012), whose findings show that 68% of mobile phone owners at the BoP do not regularly share their mobile phone with others. About a quarter of our respondents stated sharing their mobile device with one other member of their household, usually the spouse. The mobile handset, amongst Kenya’s BoP, thus seems to have become a very personal device. This finding is in line with a study on mobile phone ownership and usage patterns in Kenya using data from 2009 showing a strong nonlinear relationship between phone ownership and phone sharing behavior across 8 African countries (Wesolowski et al., 2012). The study found that mobile phone ownership and phone sharing were strongly negatively correlated with the percentage of sharers decreasing as the percentage of owners increases. Although mobile phone owners at the BoP do not regularly share their phones, it does appear that they still allow others to use their phones on one-off occasions. About half of the respondents who completed diaries had shared their phones with other people during the period of the 4-day diaries. Most of these respondents (66%) shared their phones with other people who wanted to make use of the calling service, while 10% lent their phones to other people to send SMS. The shared phone activities cost an average of 14 shillings per day. In other words, mobile phone owners allowed others to use on average about 14 shillings of their airtime credit per day. It is unclear whether the amount spent on the phone by the borrower was paid back to the phone owner in cash. Majority of the respondents recorded that they mainly shared their phones in the morning.
Table 8. Phone sharing amongst survey respondents. Source: iHub Research/RSA
How many other people regularly use your phone?
Frequency Valid Percent None 483 64.5
One 166 22.2
Two 62 8.3
Three 29 3.9
Four 6 0.8
Five 2 0.3
Eighteen 1 0.1
Total 749 100.0

22
2.1.2 Mobile Service Providers Nationally, Safaricom holds 64% of the Kenyan Mobile Phone Subscription Market (CCK 2012). Airtel holds 16.5%, Orange 10.5%, and Essar Yu 9.0%. Of our study’s survey research participants, 95% use a Safaricom line. Airtel followed behind at 22%, Yu at 13%, and Orange at 4%.8 The huge number of Safaricom subscribers could be attributed to a number of factors including the fact that the operator has been in existence over a long period of time. When respondents were asked why they use a particular network, one respondent stated, “I have been using Safaricom for a long time and my number is widely known to many of my friends and clients.” Many people interviewed felt that changing their phone numbers would highly inconvenience them, since there is no easy way to inform all of their friends or clients that they have changed their number. Nevertheless, 76.6% of the Kenyan mobile phone owners BoP stated that they would not consider changing their service provider even if they could keep their phone number (RIA, 2012). It therefore appears that there are still other benefits other than sustaining a particular phone number that keep the BoP using their particular MNOs. In April 2011, the CCK introduced a “Mobile Number Portability” service that allows subscribers to retain their phone numbers even when switching between mobile service providers (CCK, 2012). However, the use of this service is still lagging, possibly because of lack of awareness about the service or difficulties and inconveniences associated with the process.
Figure 6. Percentage Subscription Market Share per Operator. Source: CCK Q4 2012 Report.
Table 9. Network usage by survey participants. Source: iHub Research/RSA
Which networks do you use? Frequency Percent (%) Safaricom 755 94.8 Airtel 177 22.2 Yu 106 13.3 Orange 32 4.0
8 The 100%+ total is due to multiple SIM card ownership.

23
The emergence of many Mobile Network Operators (MNOs) in the country has resulted in stiff price competition. Many MNOs are trying to penetrate the market by lowering service charges. In order to take advantage of the different deals offered by the MNOs, a number of interviewed BoP mobile phone owner respondents (30%) have opted to use more than one network provider. Table 10. Number of network providers used. Source: iHub Research/RSA
How many network providers are you subscribed to?
Count Percent
One 561 70.5
Two 199 25.0
Three 28 3.5
Four 8 1.0
Total 796 100.0
As illustrated in the table below, service cost plays an important role in attracting subscribers. Apart from Safaricom, the key determinant for choosing to subscribe to a particular MNO is how cheap the services are. 73% of those subscribed to either Yu or Airtel networks noted cheap services as the main reason. However, this preference for cheap services did not hold true for Safaricom subscribers, where the majority of people stated that they subscribed because their friends were already subscribed to the network. This helps to further explain why 30% of the interviewed respondents had subscribed to more than one network provider (so they could both have cheap services [Airtel and Yu], but also have a Safaricom line). Safaricom also boasts of strong and consistent national network coverage, making it stand out from the other networks. Table 11. Cross tabulation between Network chosen and reason for choosing network. Source: iHub Research/RSA
Which Networks/Why? Safaricom Yu Airtel Orange
Count Percent Count Percent Count Percent Count Percent Cheaper services provider 279 37.0 77 72.6 130 73.4 19 59.4
Good customer care 321 42.5 25 23.6 56 31.6 8 25.0
Good network service provision/connectivity (strong & stable connections)
407 53.9 20 18.9 63 35.6 11 34.4
The only option available here 41 5.4 0 0.0 3 1.7 0 0.0
Has a wide range of network tariff to pick from
219 29.0 14 13.2 34 19.2 5 15.6
Has national network coverage 429 56.8 8 7.5 46 26.0 4 12.5
Most of my friends are in the same network
487 64.5 19 17.9 32 18.1 5 15.6
Another boost for Safaricom subscriptions was M-PESA, Safaricom’s mobile phone-based money transfer service, which many (68%) respondents stated as the reason they use Safaricom. Safaricom’s M-PESA has made it easier for the base of the pyramid to use financial services previously associated with banking and receive support from others outside of immediate geographical proximity. It is worth noting that at the moment, all of the Kenyan network service providers have mobile money transfer services, for instance, Yu has Yu money,

24
Airtel has Zap, and Orange has Orange money. However, despite this, most users still prefer M-PESA due to its widespread agent network and established trust for the brand. One focus group respondent explained, “Safaricom has an advantage of the M-PESA service, so one can’t afford to move [to another operator] and even if you do so eventually you will come back even for the M-PESA service." Continent-wide, Kenyans far exceed their counterparts in their use of mobile money transfer services. 60.3% of all Kenyans send or receive mobile money, compared to Tanzania’s 14.1%, Nigeria’s 0.5%, and South Africa’s 3.2% usage (RIA, 2012). 73.5% of the overall “top of the pyramid” (ToP)9 send/receive mobile money. Within the entire BoP segment, both owners and non-owners of handsets, 41.6% send/receive mobile money (RIA, 2012). Table 12. Reasons given for choosing a particular mobile network operator service. Source: iHub Research/RSA
Why do you subscribe to the given MNO?
Reason for this particular mobile network operator?
Which Networks are these?
Safaricom Yu Airtel Orange Total Count Percent Count Percent Count Percent Count Percent
M-PESA Services 95 67.9 1 14.3 1 11.1 1 16.7 98
Customer loyalty offers (e.g. bonga points/credit borrowing)
8 5.7 1 14.3 2 22.2 2 33.3 13
Has used for a long time 24 17.1 0 0.0 1 11.1 0 0.0 25
Free talk time/SMS 13 9.3 5 71.4 5 55.6 3 50.0 26
Total 140 100.0 7 100.0 9 100.0 6 100.0 162
2.1.3 Phone Functionalities Almost all interviewed respondents had a calculator, alarm, and clock function on their mobile handset. Half of the phones had a torch/flashlight and a little less than half of the phones had a web browser, as reported by the respondents. This is aligned with the phone categories given by survey participants where approximately half of the phones were feature or smart phones
(see Figure 7). Normally, both of these types of phones have a basic web browser.
Table 13. Mobile devices and their capabilities. Adapted from Box 1.1 in infoDev's ICT4D 2012 Report.
Phone Type Characterized by: Top 2 models among survey participants
Basic Phone Second-generation (2G) Global System for Mobile communications (GSM) standards. Services include Short Message Service (SMS);
Nokia 1110 (16% of total basic phones)
Nokia 1200 (7% of the total basic phones)
9 ToP refers to the portion of the population who are not BoP. ToP therefore includes those above the 2.5
USD/day income line.

25
Unstructured Supplementary Service Data (USSD); and calling. Alarm clock, calculator, flashlight, are also common on basic phones.
Feature Phone Same features of basic phone with added Internet-enabled services such as the downloading of music. Feature phones often also have a built-in camera. Internet access (if enabled) on EDGE or 2.5G network.
Nokia C1-01 (8% of the total feature phones)
Nokia 1680 (4% of the total feature phones)
Smart Phone Smart phones have the same features of basic phones and feature phones but typically also feature graphical interfaces and touchscreen capability, built-in Wi-Fi, and Global Positioning System (GPS) capability. If not touchscreen, QWRTY keypads are also sometimes characteristic. 3G+ Internet access.
Nokia C3 (18% of total smart phones)
Ideos U8150-D (7% of total smart phones)
The nationally representative data where 20.5% of the BoP stated that their mobile phone is capable of browsing the Internet (RIA, 2012). 15% of our research respondents stated their phone had a QWERTY keypad. QWERTY keypads are often only found on mobile devices that have more than basic functionalities (able to access Internet, download applications, etc.). It can therefore be inferred that approximately 15% of the survey respondents likely owned “smart phones”. This can further be extrapolated from the phone models, which we were able to collect from the respondents. Of the phone models that were provided by survey respondents, 9% were “smart” phones. 37% were feature phones and 53% were basic phones.10
10
Note that 211 (of 796 total survey respondents) phones were not categorized because the model provided could not be identified (likely indicating that they are “fake” phones) or the phone model was not provided.

26
Figure 7. Phone type categorized based on phone model provided by respondents. n = 592. Source: iHub Research/RSA
Table 14. Count of Phone Functionalities based on survey respondents. Source: iHub Research/RSA
Phone functionality Yes
Count Percent
Calculator 771 96.9
Alarm 749 94.1
Clock 741 93.1
Games 729 91.6
Calendar 700 87.9
Timer/Stop watch 623 78.3
Converter 579 72.7
Organizer 566 71.1
Radio 524 65.8
27
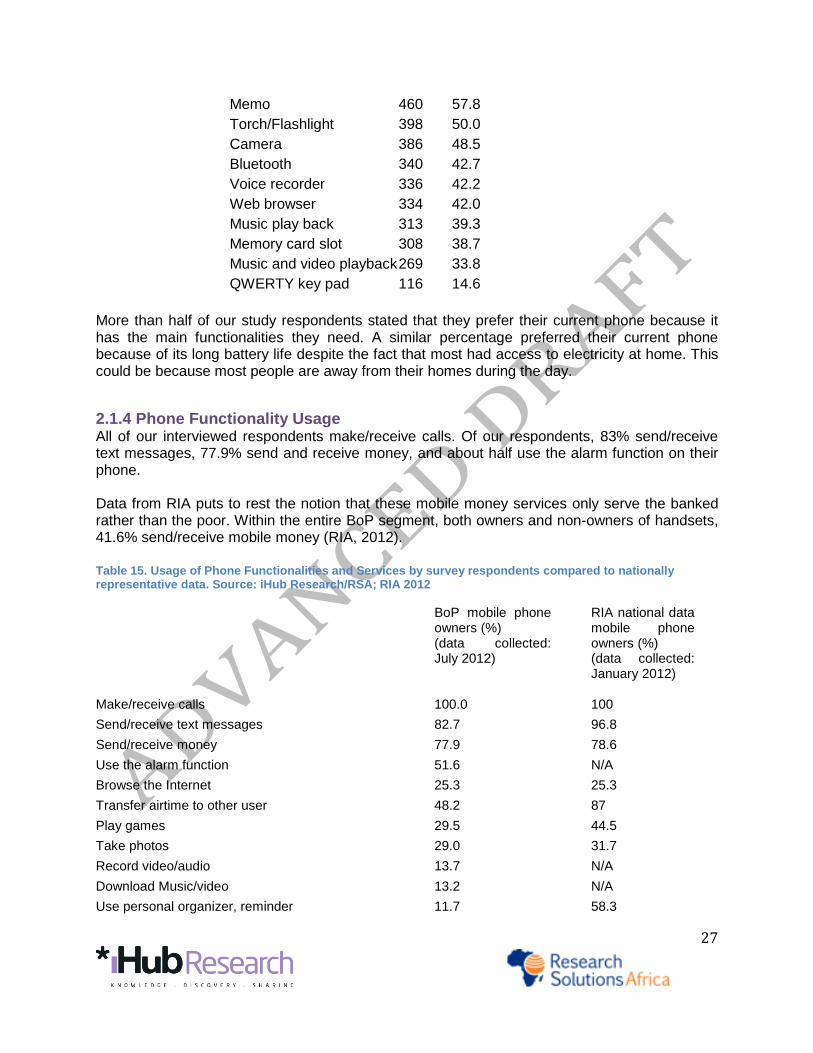
Memo 460 57.8
Torch/Flashlight 398 50.0
Camera 386 48.5
Bluetooth 340 42.7
Voice recorder 336 42.2
Web browser 334 42.0
Music play back 313 39.3
Memory card slot 308 38.7
Music and video playback 269 33.8
QWERTY key pad 116 14.6
More than half of our study respondents stated that they prefer their current phone because it has the main functionalities they need. A similar percentage preferred their current phone because of its long battery life despite the fact that most had access to electricity at home. This could be because most people are away from their homes during the day.
2.1.4 Phone Functionality Usage All of our interviewed respondents make/receive calls. Of our respondents, 83% send/receive text messages, 77.9% send and receive money, and about half use the alarm function on their phone. Data from RIA puts to rest the notion that these mobile money services only serve the banked rather than the poor. Within the entire BoP segment, both owners and non-owners of handsets, 41.6% send/receive mobile money (RIA, 2012).
Table 15. Usage of Phone Functionalities and Services by survey respondents compared to nationally representative data. Source: iHub Research/RSA; RIA 2012
BoP mobile phone owners (%) (data collected: July 2012)
RIA national data mobile phone owners (%) (data collected: January 2012)
Make/receive calls 100.0 100
Send/receive text messages 82.7 96.8
Send/receive money 77.9 78.6
Use the alarm function 51.6 N/A
Browse the Internet 25.3 25.3
Transfer airtime to other user 48.2 87
Play games 29.5 44.5
Take photos 29.0 31.7
Record video/audio 13.7 N/A
Download Music/video 13.2 N/A
Use personal organizer, reminder 11.7 58.3

28
Mobile Internet Usage 25.3% of our study respondents stated that they browse the Internet on their mobile handset. This is higher than the RIA data, which puts the percentage of the BoP mobile phone owners who browse the Internet from their mobile device at 16.2% (RIA, 2012). The difference is attributed to the purposeful sampling of 6 major areas of Kenya (compared to the random sampling conducted by RIA) as well as the 6-month difference in the two data collections (January 2012 and June 2012). Keeping in mind that, at the end of June 2012, 35.5% of the Kenyan population had Internet access, and 98.9% of Kenyan Internet users access the Internet on their mobile phone through GPRS/EDGE or 3G (CCK Q4 2012), the mobile Internet usage is not too surprising. With Essar Yu offering Free Facebook browsing11 and Orange Kenya offering Free Wikipedia access12, many of the BoP are also likely drawn to use the Internet more to take advantage of such free offers.
Figure 8. Estimated Number of Internet Users and Internet Penetration. Source: CCK Q4 2011/2012 Report
11
Essar Yu launched free browsing on Facebook 24/7 in December 2011 in an attempt to expand its subscriber base. 12
On August 20, 2012, Orange Kenya announced that subscribers of Orange with an Internet-enabled mobile phone will be able to access Wikipedia as many times as they want at no cost through their Internet browser (http://allafrica.com/stories/201208210174.html).
Reading and writing emails 11.3 19.7
Download mobile phone application 10.8 20.9
Send SMS to Radio or TV programme 9.3 29.3
Skype/VOIP 1.5 3.7
Roam when abroad 1.1 6.4

29
Figure 9. An Essar Yu advertisment for free Facebook browsing
If the activities conducted on the phone are disaggregated along an urban and rural split, more urban residents (29%) browse the Internet than rural (19%). Similarly, more urban residents use SMS, download music, send/receive email, and download mobile applications. There was also a higher likelihood of technology usage by those with more education. Most respondents without any formal education did not send SMS messages, browse the Internet on their mobile phone, nor use M-PESA as much as their educated counter-parts.
Appendix B illustrates that overall, 18-29 year old males who had, at a minimum, finished
primary school education, browsed the Internet and conduct online activities (Skype, download mobile applications, check email) the most. Otherwise, no significant gender difference in the activities being conducted on mobile phones was noted. This is largely similar to findings from the Philippines and Thailand (Zainudeen et al., 2010) and an early study in Ghana, Botswana, and Uganda (Scott & McKemey, 2002). Important to remember is the fact that no notable gender difference in mobile phone activities does not translate into an absence of a gender disparity in mobile phone ownership. According to Wesolowski et al., poor rural Kenyan women are still underrepresented in mobile phone ownership and usage (2012). A recent Financial Access study found that men are more likely to have M-PESA than women (FSD Kenya, 2012). Our study did not collect national mobile phone ownership data, but aimed to understand how, once acquired, mobile phones were being used by the BoP. Our study shows that once a phone is acquired, men and women use similar activities and services on the device. The data from the diaries supports the fact that phone calling was the most frequent use of the mobile phone by the respondents. Most respondents made more than one call a day (an average of four phone calls per respondent daily). The most used mobile phone activity was calling service with a daily average usage rate by 72% of the respondents, followed by SMS (20%) and Internet (3%). Table 16. Daily average mobile usage based on diary respondents. Source: iHub Research/RSA
Activity Average daily usage (%)
Calling Service 72.43% SMS 20.18% Internet 2.94% Credit Borrowing 1.60%

30
M-PESA 1.08% Please Call Me 0.35% Voice Mail 0.35% Receiving Call 0.30% Semeni Sms (a Safaricom offer)
0.29%
Call Waiting 0.17% Purchase Airtime 0.17% Directory 0.09% Games 0.04%
Time for Making Calls The majority of the calls were made in the morning hours over a four-day diary period, and then again at night. This may be due to the fact that these respondents are engaged in economic activities during the day and therefore hardly get time to make as many calls in middle of the day.
Figure 10. Number of calls made by time of day as documented in a 4-day diary (n=176). Source: iHub Research/RSA

31
Figure 11. Number of SMS sent by time of day as documented in the 4-day diaries (n=176). Source: iHub Research/RSA
Table 17. Total Count of Calls Recorded Over the Four-Day Period of the Diary Study. Source: iHub Research/RSA
Morning Afternoon Evening Night
Day 1 136 103 101 114 Day 2 128 107 99 120 Day 3 130 96 90 89 Day 4 119 86 73 82 Total 513 392 363 405 Further analysis of the diary data shows that despite most calls being made in the morning, the longest average duration of calls was observed in the night hours13 - 6 minutes on average as compared to daytime when the average was about 4 minutes. Table 18. Average duration of calls by time of day based on diary respondents. Source: iHub Research/RSA
Row Labels MORNING Afternoon EVENING NIGHT
Calling 4.256741808 4.46440118 4.710496795 6.420960615
13
Many of the MNOs offer special deals on calling at night, likely the reason for the increased duration of calls.

32
SMS Most SMS messages were sent in the night as well as in the afternoon hours. This trend is similar to calling service and could again be attributed to the fact that the respondents are less preoccupied at night. Table 19. Count of Respondent Sending SMS per Period. Source: iHub Research/RSA
Row Labels MORNING Afternoon EVENING NIGHT Day 1 12 51 37 51 Day 2 11 37 24 48 Day 3 8 19 27 43 Day 4 7 22 28 41 Total 38 129 116 183
Other Phone Functions Activities such as Internet and credit borrowing were done most at night, while all other functions enjoyed most usage during the day. Services such as M-PESA and buying airtime require a third party agent to do deposits and withdrawals and this could explain why such services were not used at night. For this reason, it was more common to borrow credit in the night, since it was not possible to purchase airtime cards or top up M-PESA to use to buy airtime.

33
Figure 12. Usage of Phone Activities Throughout the Day (n = 157) (other than calling and SMS). Source: iHub Research/RSA

34
2.2 Mobile Money Making Potential Three methods of earning money through a mobile handset were identified at the start of the study—microwork; finding out about a job because of increased communication using a mobile phone; and directly getting more work because of being more “reachable” (e.g. taxi driver, informal/casual worker). Of the three methods, about 83% of those who had earned money by having a mobile phone did so by directly getting more work because they were more “reachable.” That said, only 22% of all study respondents stated that they had earned money through the use of their mobile phone. Microwork has been identified as one of a handful of emerging categories of jobs that anyone with a mobile phone, regardless of other circumstances, can do to make a living (Knowledge Map of the Virtual Economy 2011). An infoDev report estimated that while the current global marketplace for microwork is in the neighborhood of “double-digit millions,” a very rough calculation estimates “the microwork market could be worth several billion dollars within the next five years.” Nevertheless, such microwork seems to have still yet to reach Kenya’s BoP. Table 20. Money made through the use of mobile phones based on survey respondents. Source: iHub Research/RSA
Frequency Percent (%)
Yes 172 21.6
No 624 78.4
Total 796 100.0
Table 21. Activities which made money through the mobile phone. Source: iHub Research/RSA
If yes, through which activities? Frequency Percent (%)
For casual job offer (e.g. till a shamba, wash car, etc.)
60 34.9
To sell commodity (e.g. clothes, food, etc.) 43 25.0
To offer professional services (e.g. teaching, medical, hairdressing, etc.)
40 23.3
Use of phone functionality (e.g. credit transfer, lending phone, M-PESA services, etc.)
11 6.4
Other (e.g. other business deals) 10 5.8
For permanent job offer 8 4.7
Total 172 100.0
Of those that made money through the use of their mobile phone, about half had made less than 500 Kenyan Shillings (approximately 6 USD) for the stated activity. 8% estimated that they had made over 5,000 Ksh (approximately 60 USD).

35
Table 22. Cross-tabulation between the activity conducted and money amount received based on survey respondents. Source: iHub Research/RSA
Amount Total
Activity Less than Ksh. 500
Ksh. 501-1,000
Ksh. 1,001-5,000
Ksh. 5,001-10,000
To sell commodity (e.g. clothes, food, etc.)
Count 12 10 16 5 43
% of Total 7.0% 5.8% 9.3% 2.9% 25.0%
To offer professional services (e.g. teaching, medical, hairdressing, etc.)
Count 21 3 13 3 40
% of Total 12.2% 1.7% 7.6% 1.7% 23.3%
For casual job offer (e.g. till a shamba, wash car, etc.)
Count 32 8 16 4 60
% of Total 18.6% 4.7% 9.3% 2.3% 34.9%
Use of phone functionality (e.g. credit transfer, lending phone, M-PESA services, etc.)
Count 10 0 1 0 11
% of Total 5.8% 0.0% 0.6% 0.0% 6.4%
For permanent job offer Count 4 0 4 0 8
% of Total 2.3% 0.0% 2.3% 0.0% 4.7%
Other (e.g. other business deals) Count 2 1 5 2 10
% of Total 1.2% 0.6% 2.9% 1.2% 5.8%
Total Count 81 22 55 14 172
% of Total 47.1 12.8 32.0 8.1 100.0
Similar to what was found in the surveys, only a small number (12%) of the diary respondents had earned money through their mobile phones. About a quarter of the diary participants had obtained work by being more “reachable” through their phones. A fifth of those who received payments for work done had done so via M-PESA or other application on their phone. The remaining respondents who had made earnings through their phones were able to connect with clients for their businesses. The respondents’ earnings from their mobile phones ranged between Kenyan Shillings 80 (0.95 US cents) and 20,000 ($238 USD). Again, microwork was not mentioned.

36
2.3 Phone Expenses Over half of the survey respondents (55%) get the money to charge and reload the airtime on their handsets from the savings they get from their own business. This can likely be attributed to the fact that the most common occupation of people interviewed in the study was self-employment (business operator). Approximately 13% get the money to put airtime on their phone from their parents. Table 23. Source of money for reloading airtime on mobile phone. Source: iHub Research/RSA
Responses Percent N
From my formal employment 199 25%
From savings from my business 435 55%
From my employer (as distinct from the salary/wages) 79 10%
From parents 101 13%
From relatives 103 13%
From spouse/partner 158 20%
Total 1075 135%
Table 24. Foregoing of expenses in order to use mobile phone. Source: iHub Research/RSA
Frequency Percent Yes 166 20.9
No 628 79.1
Total 794 100.0
2.3.1 Sacrificing One in 5 respondents interviewed had foregone some usual expenditure in order to reload their phone with credit. This finding echoes earlier findings by Banerjee and Duflo (2007), which found that even extremely poor, do not seem to put every available penny into buying more calories, as one would likely expect. Instead of buying more food, it was noted that the poor were spending on festivals or other entertainment. In another case, a World Bank study from the Philippines found that mobile phone and credit purchases have displaced tobacco consumption (Labonne & Chase, 2008). A household study by Diga (2007) conducted in Uganda similarly found that women were willing to forego store-bought items in order to purchase mobile phones and credits. These substitutions were largely undertaken in order to strengthen the longer-term asset accumulation of micro-enterprises. But such reallocation of resources and diverting of expenditure within the limited household budgets can possibly give rise to opportunity costs and negative impacts (May, 2010). Among our survey respondents who did forgo a usual expense in order to buy airtime, it was established that on average they forwent Ksh72 per week (approximately 86 US cents) in order to reload and use their mobile phone, with the maximum amount being Ksh 999 and minimum being Ksh 10. The greatest number of respondents (n=92) forwent between 10 to 250 Ksh once a week.

37
The most common expenditure foregone was the purchase of food, followed by the purchase of bus fare. During the focus group discussions, it emerged that the meals forgone were sometimes entire meals, meals for the family, or were cheaper meal options chosen. More study should be done on exactly how this may impact other members of the family and if there are any long-term implications. Disaggregating the purchase of food from the purchase of alcohol may also raise interesting findings. There is still high uncertainty about the impact of these substitutions and reallocation of cash resources. Table 25. Expenditures forwent and approximate frequency. Source: iHub Research/RSA
Amount Expenditure Frequency Total
Daily 2-5 times a week
Once a week
2 times a month
Once a month
Less than Ksh.500
Buying food stuff 4.6% 20.4% 44.7% 1.3% 12.5% 83.6%
Paying bus fare 0.7% 4.6% 3.3% 0.0% 0.7% 9.2% Buying body lotion 0.0% 0.0% 0.0% 0.0% 0.7% 0.7%
Buying clothing 0.0% 0.0% 1.3% 0.0% 0.0% 1.3%
Buying soap 0.0% 2.0% 2.0% 0.0% 0.0% 3.9%
Other (e.g. buying water, paying collection bills)
0.0% 0.0% 0.7% 0.7% 0.0% 1.3%
Total 5.3% 27.0% 52.0% 2.0% 13.8% 100.0%
Ksh.101-500 Buying food stuff 0.0% 10.0% 36.7% 3.3% 20.0% 70.0%
Paying bus fare 0.0% 3.3% 3.3% 0.0% 3.3% 10.0%
Buying body lotion 0.0% 0.0% 0.0% 0.0% 3.3% 3.3%
Buying clothing 0.0% 3.3% 0.0% 3.3% 6.7% 13.3%
Other (e.g. buying water, paying collection bills)
0.0% 0.0% 3.3% 0.0% 0.0% 3.3%
Total 0.0% 16.7% 43.3% 6.7% 33.3% 100.0%
Ksh.501-1000 Buying food stuff 0.0% 0.0% 0.0% 16.7% 66.7% 83.3%
Buying clothing 0.0% 16.7% 0.0% 0.0% 0.0% 16.7%
Total 0.0% 16.7% 0.0% 16.7% 66.7% 100.0%
2.3.2 Mobile Services Spending Habits On average, diary respondents reported spending a total of about 23 Kenyan shillings (Ksh) in a day. While the respondents did not use M-PESA much during the period of the 4-day diary, it was one of the largest single point of expenditure, with an average transaction amount of approximately Ksh 42 over the four days. Most of the transactions costs given were 25 - 30 shillings each. Based on the tariff guides provided by Safaricom, this indicates transactions of amounts between 100 and 2,500 Kenyan shillings. It should be noted here that many respondents did not understand the notion of transactional costs, choosing to record instead the actual transactional value.

38
Many of the focus group respondents complained about the mobile money networks often being down and unable to transact, but specific data on the frequency and impact of such network outages is not yet openly available. According to the diaries collected, the average calling costs per day were less than 30 Kenyan shillings, while 8 Ksh were typically spent on SMS. In comparison, survey respondents stated spending approximately Ksh 49 daily to make calls and Ksh 10 daily to send SMS. The average daily spending on Internet stated by survey respondents was Ksh 22 a day. Table 26. Daily spending on mobile services. Source: iHub Research/RSA
Daily spending
N Minimum Maximum Mean
Amount spent on calls daily
782 2 500 49
Amount spent on sending SMS daily
626 1 400 10
Amount spent browsing Internet daily
186 1 500 22
It is interesting to note that some of the functionalities that respondents reported as a cost are free services, such as sending a Please Call Me, purchasing airtime, receiving calls and credit transfers message. Spending habits are directly proportional to mobile phone usage patterns. Table 27. Mobile phone activity and average associated cost based on diary respondents. Source: iHub Research/RSA
Mobile Phone Activity Average Associated Cost (KSH)
Calling Service 27 Credit Borrowing 13 Credit Borrowing/Internet 45 Games 4 Go Crazy 10 Internet 11 M-PESA 42 Please Call Me 30 Purchase Airtime 12 Receiving Call 8 Sambaza/Credit Transfer 20 Semeni Sms 10 SMS 8 Voice Mail 16

39
2.3.3 Charging mobile phone battery Almost 60% of our study respondents stated that they normally charge their mobile handset in the house. This reveals the recent good progress being made by the Government’s rural electrification program. 14 In 2009, there was an estimated 78% of Kenyans living without electricity in their house (Google Public Data 2009). Today, according to the latest data by RIA (2012), over 60% of all Kenyan households are now connected to the main electricity grid. Nevertheless, the consistency and reliability of the power is still questionable. With only 0.6% of households with a generator (RIA, 2012), blackouts are still likely to be quite frequent. Table 28. Mobile phone charging location based on survey respondents. Source: iHub Research/RSA
Where do you usually charge your phone? Place Responses
Count Percent
In the house, at home 470 59.8
At the work place 51 6.5
At home and at the work place 48 6.1
At a friend’s place/house 50 6.4
At a nearby commercial outlet 167 21.2
Total 786 100.0
Our survey respondents stated that on average, 22 ksh were spent a week on charging their phone battery.
Table 29. Amount spent on charging of phone battery per week. Source: iHub Research/RSA
N Minimum Maximum Mean
Amount spent on charging phone battery per week
134 5 300 22
14
With the formation of the Rural Electrification Program/ Group Scheme in 2006, (http://www.rea.co.ke/index.php?option=com_frontpage&Itemid=1), applying for electricity became much easier and cheaper.

40
2.4 Mobile Phone Services, Products, and Applications With the rise in mobile phone ownership across the country, many entrepreneurs have seen the opportunity to use mobile phones to provide users with relevant information. Beyond global favorites, Facebook and Twitter, locally built applications tailored to the country’s unique challenges and demands are also quickly emerging as shown in the table below. Table 30. Crowd-sourced list of mobile phone applications in Kenya. Most of these applications have been developed by start-up tech companies. Source: iHub Research
Count of APP CATEGORY (Health, Education, Water, Local Government, etc)
Row Labels APPLICATION NAME Total
Accounting Cleanbill
QuickPayroll
Accounting Total 2
Education Campomoja
EDUWeb
M-Prep
eLimu
Sekoo
Primoo
AMUA
Examination Results
Life Skills
Mxit
SMS and Direct email innovation
Education Total 11
Documents /Registry DoQFINDER
Documents /Registry Total 1
Sports Qurasa
Sports Total 1
Government County Scorecard
Msema Kweli
Mzalendo
Budget Explorer
Government Total 4
Natural disasters Ufahamu
Natural disasters Total 1
Service Delivery Huduma
My_Order
Service Delivery Total 2
Health Child count +
WelTel
MedAfrica
Medic Mobile
MEDKenya
Hosii
M-Chanjo
Employee Quizzes for HIV/AIDS

41
Mobile Direct Observation Treatment for TB Patients
Mobile4Good Health
Changamka Smart Card
Community Based Health Management Information Systems
Medical and scientific consulting for evidence-based, patient-centred mobile health
Using SMS to Help People with HIV in Rural Kenya
Health at Home
Mashavu
Mobile Product Authentication (MPA)
Afya Milele Halisi
Health Care at my Fingertips
M-Afya Kiosk
Mamakiba
Daktari 1525
KimMNCHip
HIV/AIDS Program
Open Data Kit
m4rh
EpiSurveyor
Freedom HIV/AIDS
Baby Monitor
Wireless Reach (for ART)
Mobile Interactions bringing Hope
mPedigree
Health Total 32
Agriculture DrumNet
M-Kilimo
M-Farm
iCow
mkulima mobile R
Fishmate
Agriculture Total 6
Employment Kazi560
JAMOBI
Employment Total 2
Financial M-Kesho
PesaPal
TxtEagle
CrowdPesa
Musoni
Uhasibu
Kopokopo
Financial Total 7
Water Ufahamu
M-maji
Water Gizmo
Web Maji
Drop
Beek hackers

42
Tear Drop
3dyzine
Mai Mahiu
Tatua Maji
Onkesean
Water Flow
Huduma (Water thematic area)
Water Total 13
Transport Ma3 Route
Kamatakab
AroundMe
Motogari
Transport Total 4
Maps Virtual Kenya
Maps Total 1
Entertainment Ghafla
Entertainment Total 1
News Afrosilicon
News Total 1
Grand Total 88
Our study however, found that most base of the pyramid mobile phone users are still unaware of the various applications and services available to them through their mobile phone. Many respondents do not understand what mobile applications are and in their diaries, ended up listing basic phone functions such as alarm clocks, calculators, SMS, calling services and torch as “applications”. Others listed mobile Internet sites as applications.15
Table 31. Definitions around mobile applications and services. Source: iHub Research
Term Characterized by: Phone Functionality Phone functionalities are pre-installed on the
phone and often are related to hardware components. These functionalities include flashlight, diary/organizer, alarm clock, and radio.
Mobile Phone-based Service Mobile phone-based service is a generic term for any system that integrates a mobile phone component as part of the service delivery system.
Mobile Phone Application Mobile Phone applications (“apps”) carry out
15
For many BoP in developing economies, the Internet is increasingly becoming equivalent to Facebook. For more discussion on this, see http://www.ictworks.org/news/2012/10/12/do-not-pity-those-think-facebook-internet?utm_source=feedburner&utm_medium=twitter&utm_campaign=Feed%3A+Ictworks+%28ICTWorks%29. A growing number of corporates are seeing opportunities to get feature phone users onto the Internet using freemium pricing models (see http://www.reuters.com/article/2012/11/08/us-google-philippines-idUSBRE8A70IR20121108?feedType=RSS.)
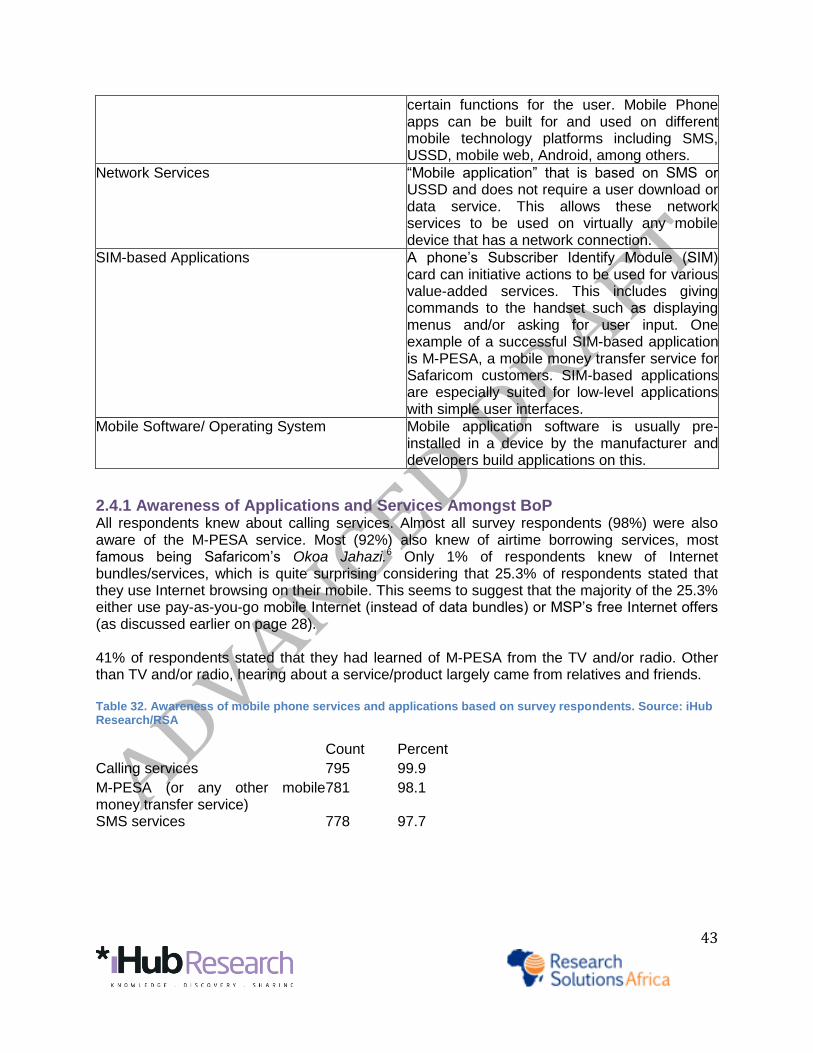
43
certain functions for the user. Mobile Phone apps can be built for and used on different mobile technology platforms including SMS, USSD, mobile web, Android, among others.
Network Services “Mobile application” that is based on SMS or USSD and does not require a user download or data service. This allows these network services to be used on virtually any mobile device that has a network connection.
SIM-based Applications A phone’s Subscriber Identify Module (SIM) card can initiative actions to be used for various value-added services. This includes giving commands to the handset such as displaying menus and/or asking for user input. One example of a successful SIM-based application is M-PESA, a mobile money transfer service for Safaricom customers. SIM-based applications are especially suited for low-level applications with simple user interfaces.
Mobile Software/ Operating System Mobile application software is usually pre-installed in a device by the manufacturer and developers build applications on this.
2.4.1 Awareness of Applications and Services Amongst BoP All respondents knew about calling services. Almost all survey respondents (98%) were also aware of the M-PESA service. Most (92%) also knew of airtime borrowing services, most famous being Safaricom’s Okoa Jahazi.6 Only 1% of respondents knew of Internet bundles/services, which is quite surprising considering that 25.3% of respondents stated that they use Internet browsing on their mobile. This seems to suggest that the majority of the 25.3% either use pay-as-you-go mobile Internet (instead of data bundles) or MSP’s free Internet offers (as discussed earlier on page 28). 41% of respondents stated that they had learned of M-PESA from the TV and/or radio. Other than TV and/or radio, hearing about a service/product largely came from relatives and friends. Table 32. Awareness of mobile phone services and applications based on survey respondents. Source: iHub Research/RSA
Count Percent
Calling services 795 99.9
M-PESA (or any other mobile money transfer service)
781 98.1
SMS services 778 97.7
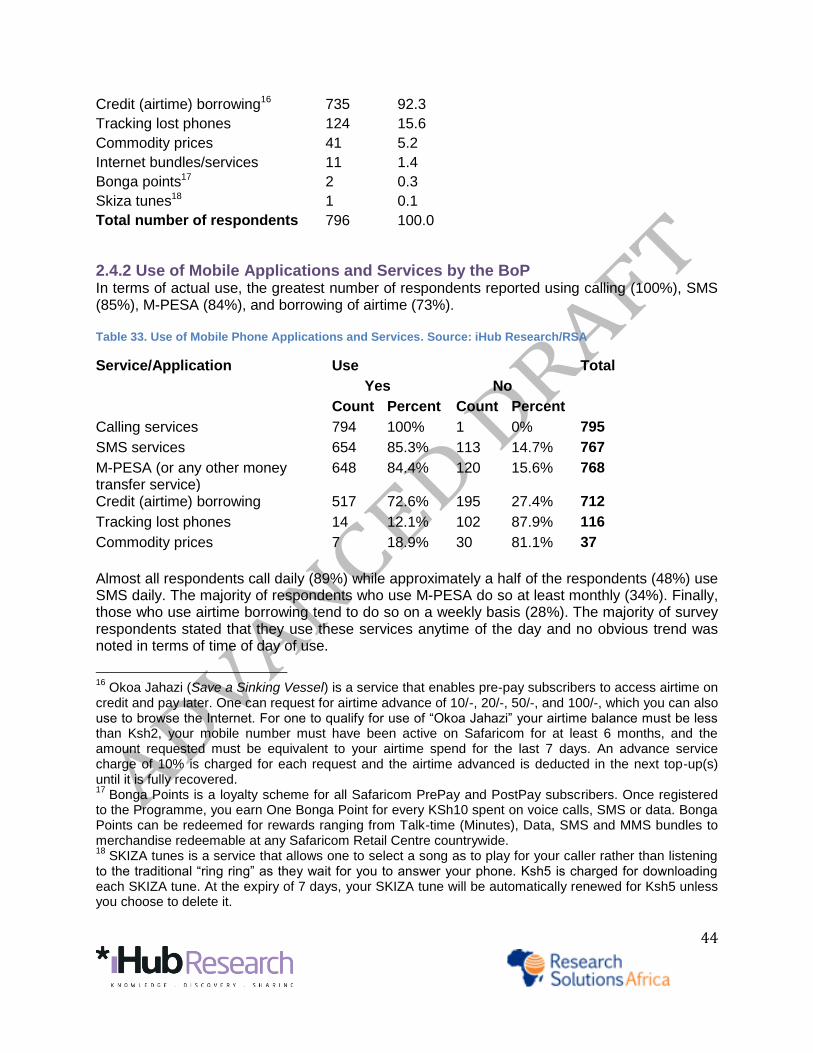
44
Credit (airtime) borrowing16 735 92.3
Tracking lost phones 124 15.6
Commodity prices 41 5.2
Internet bundles/services 11 1.4
Bonga points17 2 0.3
Skiza tunes18 1 0.1
Total number of respondents 796 100.0
2.4.2 Use of Mobile Applications and Services by the BoP In terms of actual use, the greatest number of respondents reported using calling (100%), SMS (85%), M-PESA (84%), and borrowing of airtime (73%). Table 33. Use of Mobile Phone Applications and Services. Source: iHub Research/RSA
Service/Application Use Total
Yes No
Count Percent Count Percent
Calling services 794 100% 1 0% 795
SMS services 654 85.3% 113 14.7% 767
M-PESA (or any other money transfer service)
648 84.4% 120 15.6% 768
Credit (airtime) borrowing 517 72.6% 195 27.4% 712
Tracking lost phones 14 12.1% 102 87.9% 116
Commodity prices 7 18.9% 30 81.1% 37
Almost all respondents call daily (89%) while approximately a half of the respondents (48%) use SMS daily. The majority of respondents who use M-PESA do so at least monthly (34%). Finally, those who use airtime borrowing tend to do so on a weekly basis (28%). The majority of survey respondents stated that they use these services anytime of the day and no obvious trend was noted in terms of time of day of use.
16
Okoa Jahazi (Save a Sinking Vessel) is a service that enables pre-pay subscribers to access airtime on credit and pay later. One can request for airtime advance of 10/-, 20/-, 50/-, and 100/-, which you can also use to browse the Internet. For one to qualify for use of “Okoa Jahazi” your airtime balance must be less than Ksh2, your mobile number must have been active on Safaricom for at least 6 months, and the amount requested must be equivalent to your airtime spend for the last 7 days. An advance service charge of 10% is charged for each request and the airtime advanced is deducted in the next top-up(s) until it is fully recovered. 17
Bonga Points is a loyalty scheme for all Safaricom PrePay and PostPay subscribers. Once registered to the Programme, you earn One Bonga Point for every KSh10 spent on voice calls, SMS or data. Bonga Points can be redeemed for rewards ranging from Talk-time (Minutes), Data, SMS and MMS bundles to merchandise redeemable at any Safaricom Retail Centre countrywide. 18
SKIZA tunes is a service that allows one to select a song as to play for your caller rather than listening to the traditional “ring ring” as they wait for you to answer your phone. Ksh5 is charged for downloading each SKIZA tune. At the expiry of 7 days, your SKIZA tune will be automatically renewed for Ksh5 unless you choose to delete it.

45
The most used “application” reported by the BoP in their diaries was M-PESA, which is essentially a SIM-based application (see page 42 for more on SIM-based applications). M-PESA was mostly used during daylight hours (in the afternoon). This is because M-PESA agents are typically only open during regular hours (usually within the range of 8 am – 8 pm). Games and Internet were also popular among the diary respondents, mostly used in the mornings and evenings respectively. Mobile Internet-based activities and sites were mainly used in the evenings and at night.
M-Kesho Second to M-PESA in terms of awareness and number of users was M-Kesho, Equity Bank’s savings application, which integrates with M-PESA and allows users to earn interest on money kept in a special mobile savings account. Nevertheless, despite 56% of respondents having heard of M-Kesho, only 4% had ever used it. The low uptake of M-Kesho may be because the marginal gain to using it versus saving with M-PESA is low. M-Kesho pays a maximum interest rate of 3 percent, which is better than zero, but not by much.19 Also, during the focus group discussions, it became clear that most people do not use M-Kesho because they think they need to have a bank account to use it and it is too
much of a process (signing up as well as the process to actually use).
2.4.3 Mobile Applications Uptake As stated earlier, a number of mobile applications are being developed in Kenya, many of them potentially useful for the BoP and some of them particularly targeting the BoP. It is however evident that other than M-PESA (and all mobile money transfer services), there is low awareness of other mobile phone based services and applications, and woefully low usage of applications and services. This lack of uptake could be attributed to several reasons including lack of a strong and creative marketing plan, and the difficulty of acquiring and memorizing different SMS and USSD short-codes. As noted earlier, in the diary studies we found that some phone owners at the BoP are unaware of the difference between phone-based features, applications, or Internet. This confusion around applications could also be another reason for such low uptake.
Creative Marketing Strategy Most start-ups developing applications that can be used by the BoP do not focus on marketing their products to the BoP user. With limited time and initial resources, often the start-up chooses
19
For more information on M-Kesho, visit http://goo.gl/Mi8Cv.
Figure 13. M-Kesho is a product created collaboratively between Equity Bank and Safaricom
“[Maybe M-Kesho is not so
popular because]…it deals so
much with the transaction
and accounts details, which
many customers would
prefer having access to
physically.”
- Director of Mobile
Banking and Payments
Innovation, Major Bank
46
to focus on the development of the product and building their user base through face-to-face interactions. Some start-ups dismiss marketing because they equate marketing to the use of general media outlets, such as TV and newspaper, which can often be very costly. While understandable, this decision results in very low awareness amongst BoP users especially, who largely get their information through word of mouth, TV, radio, and newspaper. Low awareness translates to low usage, since a new user cannot use a product that they know nothing about. Therefore, investment of time and resources into marketing is essential for a start-up (Monitor Group, 2011). It would be very beneficial for start-ups to thoughtfully develop a feasible marketing plan for their business and to actively work towards implementing it. This plan does not have to be extensive, involving billboards and full-page newspaper ads. Rather, start-ups are well placed to develop innovative, on-the-ground-based approaches to marketing. For example, partnering with community radio stations to host a Q&A session about the technological product could help a start-up reach new users much faster than one-on-one face-to-face interactions or in urban communities, small fliers and posters could be equally effective. Consider building strategic partnerships with media outlets that might benefit from your product or data as well.
Memorization of USSD and SMS short-codes Most at the BoP still have basic or feature phones. Therefore, to develop a mobile phone solution for this market, building applications and services that can be used with these basic and features phones is still necessary. This essentially means, building on a SMS, USSD, calling or SIM-based platform. There are unique challenges associated with USSD and SMS platforms. Another likely reason for slow uptake of services and applications at the BoP is that many of the SMS and USSD-based products require users to know the associated short-codes. Even if a user wants to use the service, if they cannot remember the right code, they will not be able to access the service. This problem will only be exacerbated as more applications are developed, each with their own unique short-code. This problem is an intrinsic characteristic of a SMS/USSD application and may prove to be one of its greatest limitations for scaling. In Chapter 3, we will advise on other possible development platforms to explore that might by-pass this issue. This is not to say that SMS and USSD are not viable options for mobile service delivery to the BoP; the appropriateness of the solution needs to be determined on an individual basis.

47
2.4.4 Mobile Services Desired Our data showed that the greatest demand by BoP mobile phone users was for access to health information through their mobile phone. As observed in Table 29 on page 40, there are a number of health-related applications already available. Again, this calls into question the outreach and marketing initiatives from these technology start-ups as discussed above. Further research needs to be done specifically on marketing outreach for start-ups and how to raise awareness and use amongst users. Organizations like MPrep and MFarm (profiled on page 47 and Error! Bookmark not defined.), have realized the value of their network of users and have built their businesses around expanding their networks. MFarm is doing this through incentive programs with their farmers, and MPrep, through positive reinforcement and networking with schools. The impact of these strategies should be explored and analyzed in future research.
CASE STUDY: MPrep Description: MPrep aims to engage schools in the poorest areas of the world by utilizing simple, ubiquitous technology. Its main objective is to give students access to education when other resources have failed them. Our tools consist of scaffold assessments of primary students, direct feedback to parents, head teachers, and schools, and high engagement. MPrep is a mobile phone-based platform for Kenyan students to assess themselves on various national curriculum-based testable subjects. Started in: 2011 Motivation(s): Initially started by Kenyan teachers and educators serious about making technology useful for their students. From the rural areas of Nyanza to Wajir Town and the Mombasa Coast, Kenyan teachers united to create the content of the initial 7
th and 8
th grade study tool.
Major source of initial funding: Self-funded initially until received prizes from Teach For America, UPenn, and Desire2Learn. Products (and brief description): The initial product was focused on the front-end product, basically, creating an SMS-based quiz for students with basic phones. However, that product has evolved into an entire educational ecosystem. MPrep realized that the data being generated by the SMS-tool was just as valuable, as it allows parents and teachers to know how to better tailor lessons for students and to gauge how well students are grasping the concepts being taught. With automated data, MPrep is therefore now able to give schools and parents ongoing information about their students. Business Model outline: MPrep is currently using a "freemium" business model - offering basic services for free to acquire a large network of customers, while charging a premium for advanced features. MPrep Premium subscriptions for teachers and schools are offered on a web portal. MPrep decided to use this model in order to build their network of users and to increase the MPrep “community”. The decision to go with this model was from the realization that MPrep’s greatest business value was their network and the ability to connect people and provide them with information from this connection. Target Market: MPrep targets three stakeholders in the primary education ecosystem: Schools; Students; and Parents. The idea is that students study using MPrep SMS-based quizzes, teachers get the data about their students and their progress, and parents are connected and can monitor their child’s strengths, weaknesses and gain insights into what their child might need to improve in their studies. Additional information: The current focus is on building the MPrep platform from an assessment-based system that quizzes students on topics learned in class to a multi-media learning platform accessible to as many students and schools as possible through widely used ICT.
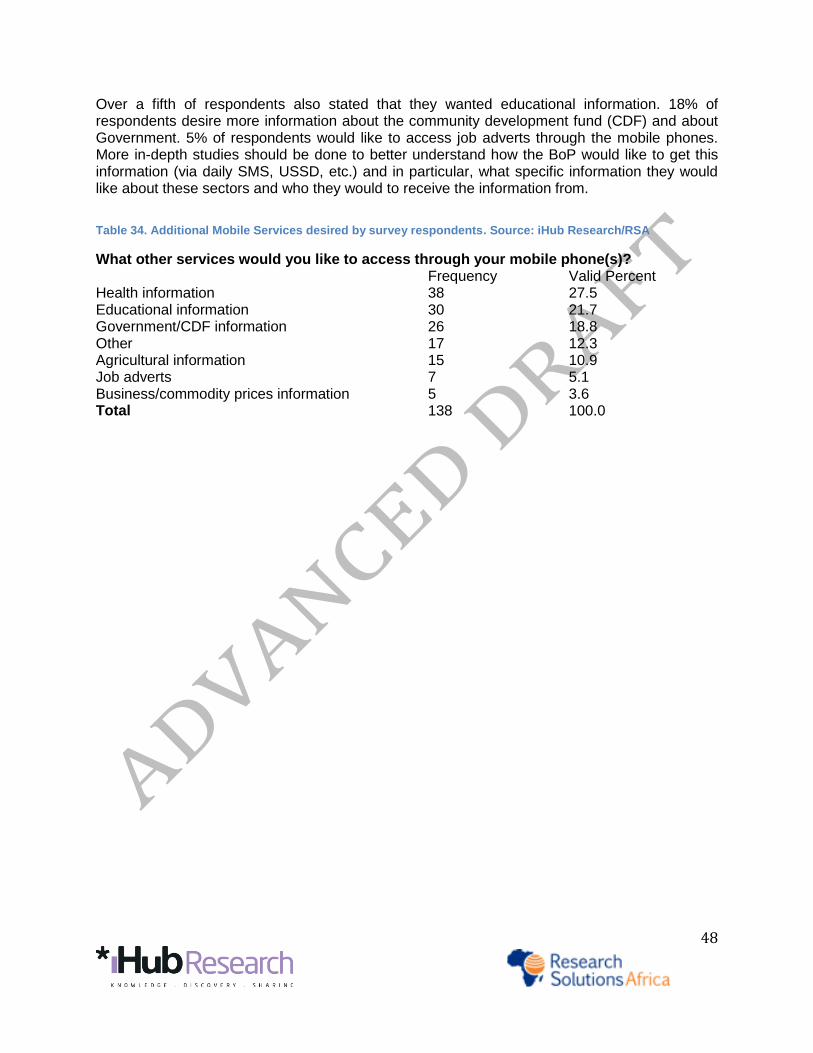
48
Over a fifth of respondents also stated that they wanted educational information. 18% of respondents desire more information about the community development fund (CDF) and about Government. 5% of respondents would like to access job adverts through the mobile phones. More in-depth studies should be done to better understand how the BoP would like to get this information (via daily SMS, USSD, etc.) and in particular, what specific information they would like about these sectors and who they would to receive the information from.
Table 34. Additional Mobile Services desired by survey respondents. Source: iHub Research/RSA
What other services would you like to access through your mobile phone(s)? Frequency Valid Percent Health information 38 27.5 Educational information 30 21.7 Government/CDF information 26 18.8 Other 17 12.3 Agricultural information 15 10.9 Job adverts 7 5.1 Business/commodity prices information 5 3.6 Total 138 100.0

49
CASE STUDY: MFarm Description: An application that aims to enhance transparency in the agricultural commodity market place. The application also facilitates collective buying of inputs and collective selling of produce among farmers. The application also builds on its accumulated commodity price data from 5 key locations in Kenya to provide analytics on commodity market trends. Through sending a structured SMS to 3555 in Kenya (Safaricom and Airtel), farmers, buyers and other interested parties can access the daily prices of commodities in various key market places in Kenya. The application’s services are currently available through an android application, a web portal and through SMS. Started in: October 2010 Motivation(s): After reading multiple newspaper stories about the plight of farmers unable to sell their crops in one area of Kenya and famine in other areas of Kenya Major source of initial funding: MFarm was launched after winning the IPO48 competition — a 48-hour boot-camp event aimed at giving web/mobile start-ups a platform to launch their start-ups. M-Farm took away the €10,000 prize as capital investment. Currently, Tech4Trade, a charity that aims to alleviate poverty through trade, also financially supports MFarm with a social investment. Products (and brief description): MFarm has 3 major products:
● M-Farm: An SMS-based system that allows farmers to inquire current market prices of different
crops from different regions and/or specific markets;
● “Group Buying”: Aggregate farmers needs/orders and connect them with farm input suppliers;
● “Group Selling”: Enable farmers to sell collectively and connect them with a ready market.
Business Model outline: MFarm has three major revenue streams - selling the market price data collected; advertising; and a margin on the revenue generated from selling and buying together modules. Partnerships with donors and private organizations have also contributed to MFarm income as they work to establish their start-up. To date, the greatest revenue has been from selling their data. MFarm continues to modify their approach as they gain more traction and identify additional areas of improvement in their services. Target Market: MFarm products target 4 groups: small-scale farmers in Kenya; agricultural input companies; agricultural output buyers both locally and internationally; and agricultural stakeholders interested in Kenyan market price information. Researchers are also interested in MFarm products, especially the data. Additional information: MFarm is currently working on their “Group Selling” module to address the problem of many of the farmers desiring cash upon immediate receipt of the crop.
50
2.5 Impact of Mobile Phones on Kenyan BoP
BoP communities share certain characteristics according to the World Resources Institute’s “The Next 4 Billion” report (2007). Namely, the BoP are not integrated into the global economy, have significant unmet needs, and are dependent on informal or subsistence livelihoods. What is the impact of mobile phones on such communities in Kenya? Our data revealed that the greatest value of the mobile phone for most BoP is as a financial tool. M-PESA and other mobile money transfer systems have changed the ease with which money can be remitted and payments made and received. The phone has also increased communications and strengthened relationships for the BoP. Internet use is slowly spreading amongst the BoP, but there are still many misunderstandings around it as well as “mobile applications.” The recent switch-off of over 1.5 million counterfeit mobile handsets is likely to significantly impact the BoP by pushing many who had acquired fake feature phones back to using basic phones. Stakeholders in the mobile telephony industry have an overall positive outlook for the future of the sector in Kenya. Many believe that there will continue to be increased economic growth in the industry. Several individuals mentioned the need for greater promotion of local talent and development of local content. Innovation hubs and incubators such as the iHub, m:lab East Africa, 88mph, iLab, Nailab, among others are working to stimulate such local innovation and growth. The success of such community spaces will help in the promotion of more local content and entrepreneurship, and fostering of a dynamic tech eco-system in Kenya. A focus on how to develop market-based solutions for the needs of the BoP should be applied through trainings to the developers at innovation hubs in order to teach some of the best practices being established through experience and research in the region. The major benefits of a mobile phone, as identified by our BoP respondents were:
COUNTERFEIT PHONE SWITCH-OFF
The big topic on all stakeholders’ lips was the
recent switch-off of counterfeit mobile devices
(largely imported in to the country from China).
The reason for this switch off was to raise the
quality of devices in Kenya and to also
decrease the potential for conning and fraud
through mobile phones. In order to avoid being
switched off, mobile phones users needed to
own mobile devices from genuine approved
manufacturers. This much-awaited regulatory
move resulted in approximately 1.5 million fake
mobile handsets switched off on September
30th/October 1
st, 2012. All interviewed
stakeholders perceived that this move has
heavily affected the Base of the Pyramid
mobile phone users, many of who were
perceived to be the owners of counterfeit
mobile phones.
This regulatory move essentially pushes the
BoP backwards in terms of mobile phone
access, as many of those who had counterfeit
mobile phones will not likely be able to replace
their mobile handsets in the short-term. The
impact of the recent switch-off of counterfeit
phones could be observable in the next CCK
quarterly report by an overall decrease in the
country’s mobile phone penetration. However,
the long-term effect of this move is to hopefully
increase the quality of phones and products on
the market and to also decrease the instances
of conning via mobile phones. The real impact
of this regulatory move on the BoP is still to be
seen.
For more discussion around this topic, see
http://www.ihub.co.ke/blog/2012/10/phones-
switch-off-how-it-was-done-why-and-what-
next/.
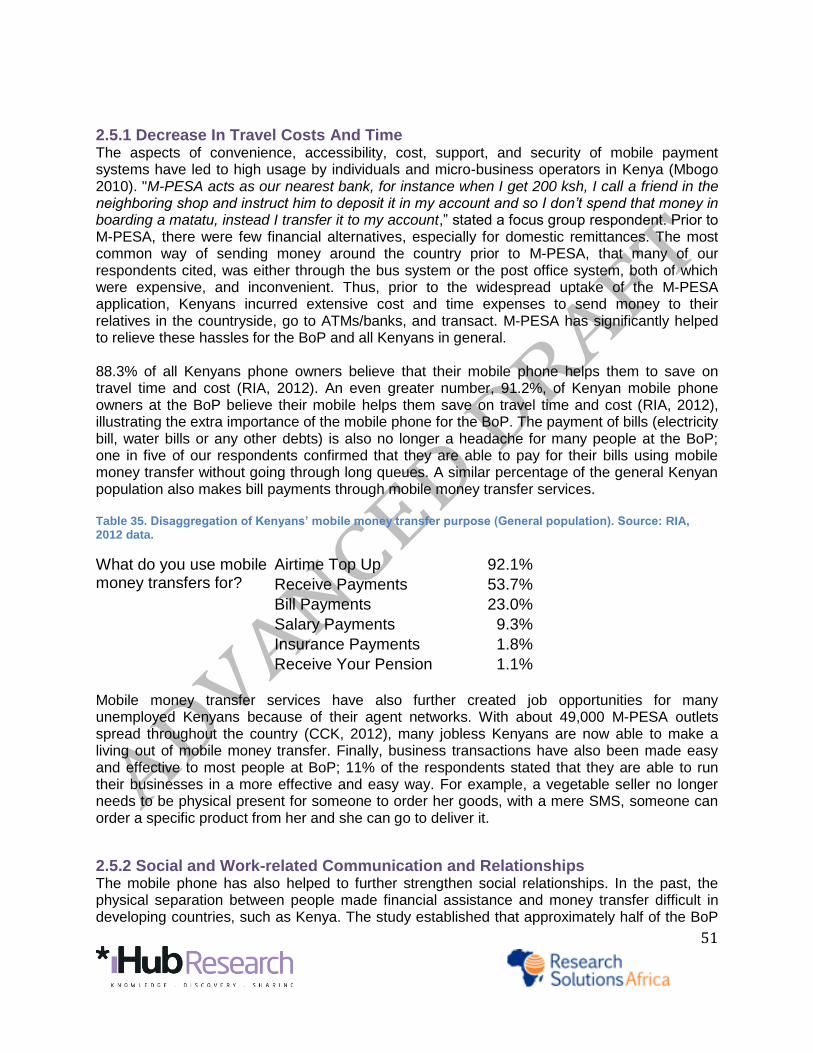
51
2.5.1 Decrease In Travel Costs And Time The aspects of convenience, accessibility, cost, support, and security of mobile payment systems have led to high usage by individuals and micro-business operators in Kenya (Mbogo 2010). "M-PESA acts as our nearest bank, for instance when I get 200 ksh, I call a friend in the neighboring shop and instruct him to deposit it in my account and so I don’t spend that money in boarding a matatu, instead I transfer it to my account,” stated a focus group respondent. Prior to M-PESA, there were few financial alternatives, especially for domestic remittances. The most common way of sending money around the country prior to M-PESA, that many of our respondents cited, was either through the bus system or the post office system, both of which were expensive, and inconvenient. Thus, prior to the widespread uptake of the M-PESA application, Kenyans incurred extensive cost and time expenses to send money to their relatives in the countryside, go to ATMs/banks, and transact. M-PESA has significantly helped to relieve these hassles for the BoP and all Kenyans in general. 88.3% of all Kenyans phone owners believe that their mobile phone helps them to save on travel time and cost (RIA, 2012). An even greater number, 91.2%, of Kenyan mobile phone owners at the BoP believe their mobile helps them save on travel time and cost (RIA, 2012), illustrating the extra importance of the mobile phone for the BoP. The payment of bills (electricity bill, water bills or any other debts) is also no longer a headache for many people at the BoP; one in five of our respondents confirmed that they are able to pay for their bills using mobile money transfer without going through long queues. A similar percentage of the general Kenyan population also makes bill payments through mobile money transfer services. Table 35. Disaggregation of Kenyans’ mobile money transfer purpose (General population). Source: RIA, 2012 data.
What do you use mobile money transfers for?
Airtime Top Up 92.1%
Receive Payments 53.7%
Bill Payments 23.0%
Salary Payments 9.3%
Insurance Payments 1.8%
Receive Your Pension 1.1%
Mobile money transfer services have also further created job opportunities for many unemployed Kenyans because of their agent networks. With about 49,000 M-PESA outlets spread throughout the country (CCK, 2012), many jobless Kenyans are now able to make a living out of mobile money transfer. Finally, business transactions have also been made easy and effective to most people at BoP; 11% of the respondents stated that they are able to run their businesses in a more effective and easy way. For example, a vegetable seller no longer needs to be physical present for someone to order her goods, with a mere SMS, someone can order a specific product from her and she can go to deliver it.
2.5.2 Social and Work-related Communication and Relationships The mobile phone has also helped to further strengthen social relationships. In the past, the physical separation between people made financial assistance and money transfer difficult in developing countries, such as Kenya. The study established that approximately half of the BoP

52
respondents now receive or send financial assistance to friends and relatives. The literature has shown that about 40% of M-PESA money transfers are sent to parents (Suri & Jack, 2008) while 8% is sent to children. This suggests that M-PESA fills the role of domestic remittance in a culture where giving back to elders is still a critical aspect of the parent-child relationship; children who leave the rural home to work in urban cities are sending money back to help their parents who remain in rural Kenya. The mobile phone technology has also strengthened the communication bond between families, friends, and colleagues: BoP mobile phone owners responded that they have increased their contact with family and friends (85.9%) and colleagues (67%) (RIA, 2012). One person from a focus group discussion stated, “M-PESA makes me have less quarrels with mum,” suggesting the social benefit of the application in addition to its important economic effects. A bodaboda bicycle driver from Kisumu said that for him, M-PESA “prevents conflict because now, even if one doesn't have cash, you can still pay via M-PESA.” While the positive impacts of the mobile phone in Kenya are great, it is important to remember that the mobile phone also has brought new difficulties upon many. The most common negative aspects of mobile phones that emerged during this study are as follows:
2.5.3 Lost Money Due To Lack of Technical Know-How A frustration for many users of M-PESA was losing money due to lack of technical know-how and the lack of follow-up and assistance from Safaricom. "For me, I have sent money to a wrong [phone] number...I confused a number and that amount just went to the person...I sent 500 and there is no way Safaricom helped me get it back,” lamented one focus group participant. Another disenchanted user said, "There is somebody who withdrew my money and I didn’t know him, but when I followed through M-PESA, they told me, maybe I gave someone my phone and when I try to figure out whom I could have given my phone, no none at all. I just left that story [i.e. I just gave up]. "
2.5.4 Security Concerns And Conning BoP respondents noted that there are certain security risks involved with owning a phone. The nature of the phone aids the lying and cheating process. "It [the phone] has contributed to evil in the society especially through lies; phones have contributed to a lot of lies so to me they are advantageous and disadvantageous." Another respondent described how a neighbor was conned by a group of thugs who also had his phone number and after the incident, frequently called him threatening to kill him if he talked to the police. Many con games have also been known to occur through M-PESA schemes. A common con is via SMS (usually from a public phone number, not Safaricom) where the con artist states that a particular amount was sent to your M-PESA amount wrongly so please send it back because the transfer was a mistake (http://kenyansindiaspora.com/551/). Kidnapping in Nairobi is increasingly becoming more common. Kidnappers typically hold their victims captive while extorting money through the various mobile phone money transfer service providers (M-PESA, Airtel Money, etc.). Increased coordination between mobile money transfer service providers and the police should be made in order to work towards preventing these crimes and catching the perpetrators.

53
The mobile phone has also been used to spread hate and dangerous speech in Kenya, most notable during the Post-Election Violence in 2007/2008. The technology is an amplifier and therefore can amplify any message, both positive and negative. In an attempt to dissuade such messages from being spread during the upcoming 2013 elections in Kenya, the Communications Commission of Kenya (CCK) has announced that it will require mobile operators to review and approve all political bulk SMS at least 48-hours prior to being sent to the public (ITWeb Africa, 2012). Nonetheless, the benefits of the mobile phone seem to outweigh the negatives, "I used to dislike it [phones] when I used to hear how people lie on phone…People cheat others, that I am in such and such a place and you are just telling lies. But when I came to know that you can use it on money, it can make you save 200/= for going somewhere, you can just use 5 shillings. I felt I should also have it.”
2.5.5 Sacrificing (especially of food stuffs) A rather surprising fact revealed through this study was the commonplace sacrificing of items in order to use one’s mobile phone. Slightly worrying was the fact that sometimes this sacrificing led to missed meals, not just for the individual but also for their families. For most, this sacrifice is worth it because it can lead to making money. Focus group respondents stated, "Why not buy credit and forgo bread so that I make more money for daily use than bread for a day’s use.” "When you use shillings 50 on bread you only get shillings 2 as balance, its better you buy credit and make inquiry from a friend whether there is a job. And I could get two thousand if I go there.” More detailed research should be conducted to better understand this behavior of foregoing and the potential effects on income, nutritional intake, and family relations.

54
Chapter 3
Opportunities and Challenges in the Kenyan Mobile Eco-system
Understanding current mobile usage habits at the base of the pyramid in Kenya, as described in Chapter 2, offers those in the Kenyan mobile telephony industry the opportunity to make their products and systems more effective. Many of the necessary changes to better develop programs for the BoP require commitment from the various stakeholders and a willingness to collaborate.
3.1 Developers
3.1.1 User Needs A key theme mentioned severally in the literature is to put the end-users’ needs first. A product needs to have value for the user, especially if there is going to be a cost involved. Rather than building for what you think your low-income user needs, it is important to go to the field to understand what they really want. This involves market research and user needs assessments, not just once but repeatedly as part of an on-going process to continually confirm that your product addresses your clients’ needs. Market research need not be complicated; it can be done through a pilot, even with limited time and resources. MFarm and MPrep are two examples that have been successful in part because they consistently listen to their end users through in-depth field research, observation, and collection of metrics.
3.2.2 Ponder your platform choice and partnerships Currently, most applications built for the BoP market are on SMS, or USSD. Voice call-based applications are rare, likely due to the high overhead costs required. Two additional platform options, SIM-based and pre-installed in the phone, have not been fully explored to date, largely because of barriers from MNOs. SIM-based applications are particularly suited for older mobile phone handsets because the program can be executed solely on the SIM card and therefore makes no demands on the mobile handset capabilities (Thinyane, 2009). The downside of SIM-based applications is that they cannot use any of the peripheral devices on the handset (such as a camera) and also need to be extremely simple. The SIM has limited space availability to add applications, the major argument against the promotion of SIM-based applications.

55
Figure 14. Facebook's many avenues of reach. Source: http://www.ictworks.org/
The major difficulty with the SIM-based application approach is also that it requires an agreement with the market operator. Most large MNOs are not interested in partnering with start-up technology companies unless there is a clear value-add for the MNO. With start-ups often still struggling to build up their user base, it can be difficult to convince an MNO to partner with such an organization. If an MNO can be convinced of the value add of the application, however, a partnership with an MNO can be an incredible asset to help a start-up scale their product. The trust, resources, and influence that MNOs have in Kenya can allow a start-up to significantly improve their product awareness and uptake through such partnerships.
The research found that there is a growing user base of mobile Internet amongst the BoP. Developers should explore options for linking applications onto free platforms and social networks such as Facebook Zero, which might provide an avenue for further scaling out to BoP users.
Another possible option for developers looking to scale to consider is partnering with mobile phone manufacturers. Nokia Life is an SMS-based information platform developed by the manufacturing company for emerging markets. The subscription service was launched in 2008 as a pilot in India before spreading to 3 additional countries, Indonesia, China, and Nigeria. The service has an icon-based interface that is preloaded on the phone, thereby avoiding a number of the difficulties associated with SMS-based applications. The program is currently available on a few basic phones including the Nokia 2323 classic, 2330 classic, and 2700 classic. The Nokia Life Tools suite has yet to launch in many markets,
including Kenya, largely because the information released on the platform is hyper localized. We anticipate seeing the growth of the Nokia program to other African countries and believe many local start-ups will be approached as local content providers. This can be a great opportunity to scale. Nevertheless, similar to the difficulties of partnering with MNOs, partnering with phone manufacturers can also bring its own host of challenges and negotiations of which SMEs content providers could get the raw end of the deal. As a tech start-up, it is necessary to navigate negotiations carefully and ensure that the partnership adds value to your business and end user.
3.2 Government
3.2.1 Promote cooperation between the various stakeholders Government has a key role in the creation of favorable political, business and legal frameworks that promote cooperation between tech start-ups, MNOs, mobile phone manufacturers, and media. These frameworks can directly attract local and foreign investment in Kenya’s mobile technology sector.
Figure 15. Screenshot of Nokia Life Tools's simple user interface. Source: topnews.in
“The government should
promote local talents that
are interested in mobile
telephony; this will in
turn have a long lasting
impact on the industry
when we have
customized products and
applications by local
developers for local
market.”
- Mobile Product
Retailer, Nairobi

56
Opportunities that arise from this investment include multinational companies outsourcing micro-work tasks, such as Amazon’s Mechanical Turks, to potentially increase use of the mobile phone as a money making tool.
3.2.2 Become a key customer Mobile money operators, especially Safaricom, have been successful in reaching out to a wide majority of the country’s mobile phone users with 68.8% of BoP using mobile money in Kenya. Organizations are increasingly taking advantage of this widespread use of mobile money transfer systems as a platform for other services or businesses to be paid. Both large-scale and small-scale businesses, such as Kenya Airways, M-Farm, and Pete’s Coffee, are allowing customers to pay through mobile money transfer. Start-ups, such as Kopo Kopo and Zege Technologies are helping to facilitate the integration of mobile money into SMEs. This is a potential service channel that still remains untapped by Government. Mobile money systems should be used by Government to enable a broader range of institutional payments, such as government social welfare payment distributions and tax collections. Various extension offices in sectors like agriculture, health, water, education, and Community Development Funds (CDF) should also seriously consider using and integrating many of the mobile tools developed into their activities. This will not only further support the local Kenyan tech sector, but also take advantage of the existing mobile communication infrastructure as a service-delivery platform.
3.3 Donors and Investors “Soft” funding from investors and donors has helped many of the technology entrepreneurs in the mobile telephony space in Kenya to get started before they begin to make profit. International investors currently run the tech investment scene, while local investors are notably missing. This is largely because there is no history of success yet amongst the young tech start-ups in Kenya, and thus no reference point for investors to gauge their potential return on investment. But many foreign investors do not understand the local market well and cannot identify all the possible business opportunities as a local investor would. The tech industry would therefore benefit if local investors would take a careful look at the initiatives emerging from the tech scene and begin to support Kenyan technologists. The high growth rate of the technology sector indicates that an early investment in the tech sector could likely prove worthwhile for investors as well. Donors also play an important role in the tech scene as more organizations take advantage of the mobile phone to reach out to the base of the pyramid in Kenya. Some organizations are running their own initiatives, while others are funding local initiatives. Rather than creating new initiatives that may not be sustained after grant funding runs out, we propose that existing local initiatives be supported instead. This could be in the form of funding the elements identified on page 45, such as media advertising, to help existing initiatives to reach the BoP.
3.4 MNOs and Phone Manufacturers Mobile Network Operators and phone manufacturers should consider working with local BoP-focused start-ups as part of their Corporate Social Responsibility (CSR) initiatives. Not only will they be supporting local tech industry, they will also create greater value for their own end users through localized content. By increasing local content on their networks, there will be increased

57
usage of mobile services such as mobile Internet, calling, and SMS. The challenge thus far has been to get these MNOs to engage with small start-ups.

58
Chapter 4
Conclusions The study, funded by infoDev, has offered updated data on mobile usage patterns at the Kenyan base of the pyramid, and revealed key insights on BoP perceptions about the value and challenges of mobile phones. Our hope is that this work will advise local Kenyan mobile application developers about the BoP end user, and highlight to Mobile Network Operators (MNOs), Investors, and Government the importance of partnering and collaborating in order to meet the dynamic Kenyan BoP user’s mobile telephony needs. General Usage – Despite complaints on the high costs of services, Safaricom is the most popular mobile network operator in Kenya, largely because of M-PESA and the value of its huge network of users. Nevertheless, Safaricom’s shares are slowly decreasing over time. As other network operators steadily gain market shares, it will be interesting to follow how Safaricom will attempt to keep its hold of the market. The top three activities conducted on the mobile phone by the BoP are calling, SMS, and sending/receiving mobile money. 25.3% of the Kenyan mobile phone owners at the BoP stated they browse the Internet from a mobile device. This figure illustrates the increase in mobile Internet use at the base of the pyramid and the potential long-term future opportunity to build for such feature phone and smart phone platforms. Nevertheless, in the short-term, the obvious mobile platforms to reach BoP markets are still voice, SMS, USSD, and SIM-based platforms. Mobile Money Making Potential – Only 22% of our study respondents stated that they had earned money through the use of their mobile phone. Within that 22%, the majority had earned money by directly getting more work because they were more “reachable” with their mobile phone. Microwork has been identified as one of a handful of emerging categories of jobs that anyone with a mobile phone, regardless of other circumstances, can do to make a living (Knowledge Map of the Virtual Economy 2011). Nevertheless, such microwork seems to have still yet to reach Kenya’s BoP. If Government can develop more favorable political, business and legal frameworks to promote cooperation between tech start-ups, MNOs, mobile phone manufacturers, and media, these frameworks could likely directly attract local and foreign investment in Kenya’s mobile technology sector. Opportunities that arise from this investment include multinational companies outsourcing micro-work tasks, such as Amazon’s Mechanical Turks, to potentially increase use of the mobile phone as a money making tool. Phone Expenses –

59
Our study found that it was quite common for those at the BoP to forego an expense in order to purchase airtime credit to use their mobile phone. The greatest number of respondents (n=92) forwent between 10 to 250 Ksh once a week. On average, diary respondents reported spending a total of about 23 shillings in a day. While the respondents did not use M-PESA much during the period of the 4-day diary, it was the largest single point of expenditure, with an average transaction fee amount of approximately Ksh. 42 over the four days. Despite the relatively high cost associated with the service, the BoP still value the service enough that a great majority uses it. Mobile Phone Applications – One of the biggest realizations from this research was that most BoP in Kenya are still not aware of the new applications and services that are available to them. Despite the good work being done on a small level with many individuals and households at the BoP through applications like those listed in Table 29, none of these tools have scaled the way M-PESA has. So what options do small-scale developers have if they want to work for the BoP – do they have to work with the Mobile Network Operators (MNOs) as part of their business models and how viable and sustainable is that? These questions still need to be answered with further in-depth research. Impact of Mobile Phones – Our respondents raised both positive as well as negative ways in which the mobile phone has impacted their lives. The most significant impact has been a decrease in travel costs and time (largely because of money transfer services). The phone has also led to increased social and work-related communication. On the flip side, many respondents have either lost of know others who have lost money through their phone, either by being conned or simply mistakenly sending money to the wrong person. Platforms and Partners - Our results showed that most BoP did not know the difference between SIM-based applications, phone-based services, and network-applications. We conclude that SIM-based applications, or applications building on free social networks (e.g. Facebook Zero), could be some more viable ways to reach mass market that should be explored by developers. Another potentially viable way to reach mass market is through partnerships directly with phone manufacturers. All of these avenues have thus far not been utilized due to challenges in negotiating partnerships. If progress in this regard can be made, either through company initiative or Government intervention, the overall tech sector could stand to gain greatly and new innovative ways to scale applications and reach the BoP market could be developed. Future Developments – Conducting an annual iteration of this study will be extremely useful for the ICTD research community to witness the changing and dynamic nature of mobile phone use at the Kenyan BoP. The LIRNEasia studies, which were conducted annually to understand teleuse at the BoP in South Asia, have contributed greatly to the literature and also identified early mobile practices such as the practice of “flashing” or “beeping”. We look forward to similarly studying the dynamic changes occurring in the mobile telephony sector over time in Kenya.