Embed Size (px)
DESCRIPTION
MnTrip
Citation preview

Medium–Alloy Manganese–RichTransformation–Induced Plasticity Steels
D. W. Suha, J. H. Ryua, M. S. Jooa, H. S. Yangb, K. Y. Leeb, H. K. D. H.Bhadeshiaa,c
aGraduate Institute of Ferrous Technology, POSTECH, Republic of Korea
bTechnical Research Laboratories, POSCO, Republic of Korea
cMaterials Science and Metallurgy, University of Cambridge, U.K.
Abstract
The manganese concentration of steels which rely on transformation–induced
plasticity is generally less than 2 wt%. Recent work has highlighted the po-
tential for strong and ductile alloys containing some 6wt% of manganese,
but with aluminium additions in order to permit heat treatments which are
amenable to rapid production. However, large concentrations of aluminium
also cause di!culties during continuous casting. Alloy design calculations
have been carried out in an e"ort to balance these conflicting requirements,
whilst maintaining the amount of retained austenite and transformation ki-
netics. The results indicate that it is possible by adjusting the carbon and
manganese concentrations to reduce the aluminium concentration, without
compromising the mechanical properties or transformation kinetics. The
deformation–induced transformation of retained austenite is explained quan-
titatively, for a range of alloys, in terms of a driving force which takes into
account the very fine state of the retained austenite.
Email addresses: [email protected] (D. W. Suh), [email protected] (H. K.D. H. Bhadeshia)
Preprint submitted to Metallurgical and Materials Transactions A December 26, 2012

Keywords: transformation-induced plasticity, steel, manganese, austenite,
stability
1. Introduction
Work by Miller [1] established the possibility of alloys containing a medium
manganese concentration, Fe–0.11C–5.7Mn wt%, in order to generate a
mixed microstructure of ferrite and austenite by intercritical annealing. The
plasticity obtained during the deformation–induced martensitic transforma-
tion of austenite (TRIP) led to impressive values of total elongation (34–19%)
for tensile strengths in the range 875–1200MPa. The time periods for inter-
critical annealing were in the range 1–16 h.
In an e"ort to make the process more amenable to industrial production,
Suh and co–workers [2] added up to 3 wt% of aluminium to the steel, on
the basis that this solute increases the free energy change associated with
the austenite to ferrite transformation [3]. This has the e"ect of increasing
the temperature at which the steel can be intercritically annealed, thus per-
mitting the time period of annealing to be reduced to just two minutes [2].
However, it is considered that 3wt% is too large a concentration from the
point of view of steel manufacture by continuous casting because of the pos-
sibility of nozzle clogging [4]. The purpose of the present work was to see if a
similar alloy system can be designed with a reduced aluminium concentration
of 2wt%, a content which is considered acceptable from a steelmaking point
of view. It may be possible to compensate for the reduction in aluminium
concentration by altering the carbon and manganese concentrations, and this
formed the motivation for the present work.
2. Experimental method
Table 1 lists the chemical compositions of the alloys. Compared to
the previous work based on Fe–0.12C–5.8Mn–0.47Si–3.1Alwt% [2], the alu-
2

minium content is reduced to 2wt%. The carbon and manganese concentra-
tions were adjusted systematically using phase diagram calculations in order
to obtain a comparable austenite fractions during intercritical annealing. Fig.
1 shows the change of equilibrium fraction of austenite estimated using the
Thermo-Calc software [5] with TCFE 6 database [6]. It clearly is possible
in principle to maintain the austenite content in the temperature range of
intercritical annealing.
Table 1: Chemical compositions (wt%) of alloys
Sample C Mn Si Al
Alloy 1 0.11 4.5 0.45 2.2
Alloy 2 0.075 5.1 0.49 2.1
Alloy 3 0.055 5.6 0.49 2.2
Ingots 300! 150! 100mm were prepared by vacuum–induction melting,
after which they were reheated to 1473 K (1200 !C) for 2 h and hot–rolled to
3mm thick sheet, with a finish–rolling temperature above 1000 K (727 !C),
before the samples were finally air–cooled. After pickling in a 10% HCl
solution, the sheets were cold–rolled to 1mm in thickness.
The samples were then annealed using an infrared heating furnace at tem-
peratures in the range 973 to 1053 K (700 to 780 !C) in 20 K ( !C) steps, with
a holding time during annealing of 120 s before cooling to ambient tempera-
ture. The heating and cooling rates to and from the annealing temperature
were in all cases ±10 Ks"1 ( !Cs"1).
The microstructures were characterised using light and scanning elec-
tron microscopy (SEM), and electron back–scattered di"raction (EBSD).
The fraction of austenite was determined using X–ray di"raction with Cu
K! radiation; for this purpose the specimens were prepared by mechanical
polishing followed by chemical polishing in a 10% HF+H2O2 solution in
3

order to remove any deformed surface which would influence the retained
austenite. The integrated intensities of (200)!, (211)!, and (220)", (311)"
reflections were used to quantitatively determine the austenite content [7].
Tensile tests were conducted on a universal testing machine at a crosshead
speed of 2mmmin"1, using sub–sized test coupons according to the ASTM
[8].
3. Results and discussion
3.1. Microstructures
Fig. 2 shows the microstructures of the hot–rolled steels. The dark grey
matrix is martensitic, while the grey streaks represent #–ferrite retained due
to non–equilibrium cooling during solidification, and spread out into layers
during hot–rolling [9]. Optical microscopy was conducted for all annealing
treatments and the results are available for inspection, but the phase maps
in Fig. 3 have much greater clarity. They reveal relatively coarse regions of
recrystallised–ferrite and much finer ferrite grains which still contain sub–
grain boundaries. The black lines in Fig. 3 correspond to large angle grain
boundaries of which misorientation is larger than 15!, whereas the blue lines
are low–misorientation sub–grain boundaries.
The grains with green colour are extremely fine austenite grains, located
within the relatively fine–grained ferrite regions. The quantitative measure-
ments presented in Fig. 4 confirm a size of the order of 0.3µm, insensitive to
the annealing conditions, or even alloy composition within the range studied.
The austenite grains are equiaxed and are mostly isolated rather than in the
form of allotriomorphs, indicating that they nucleate at triple points within
the fine–grained ferrite, and have a limited growth rate.
The presence of the coarse ferrite grains indicates that they were the first
to recrystallise during annealing, and that their growth is stifled subsequently
by the formation of austenite in the unrecrystallised regions. This explains
why the coarse ferrite grains are essentially free from austenite.
4

The boundary character in the phase maps suggests that the coarse fer-
rite grains are completely recrystallised but the small angle boundaries ob-
served in the fine–grained regions indicates incomplete recrystallisation. The
observed microstructure is comparable to that from previous work [2], but
more homogeneous because the lower aluminium concentration leads to a re-
duced content of the coarse ferrite which originates from the #–ferrite formed
during solidification.
The fraction of austenite is plotted in Fig. 5 for the complete set of ex-
periments conducted, along with that expected from equilibrium (calculated
using Thermo–Calc). Given that the alloys were designed to show similar
austenitisation behaviour (Fig. 1), the experimentally determined austenite
content does not di"er much between the di"erent alloys – it increases grad-
ually up to 1033 K (760 !C) but then drops sharply for samples annealed
at 1053 K (780 !C). This is because when the volume fraction of austen-
ite becomes large, a quantity decomposes by martensitic transformation on
cooling to ambient temperature as is evident from the dilatometric curves
presented in Fig. 6. The reasons for the reduced stability of the austen-
ite when the volume fraction is large include the dilution of solute content
(carbon, manganese) and secondly, it is well known that the stability of the
austenite decreases with increasing grain size [10, 11]. Fig. 7 is a representa-
tive transmission electron micrograph in which the austenite grains subjected
to energy dispersive X-ray microanalysis are marked. The data thus obtained
are summarised in Table 2 and the measured values compare within experi-
mental error with those expected from equilibrium. Although there may not
be an exact match with equilibrium, it is obvious that Mn is likely to be
partitioned into austenite. It is noted that cementite was not observed in
the annealed samples since the annealing temperatures used exceed the the
dissolution temperature of that carbide.
5

Table 2: Mn content in austenite after annealing at 720 !C (in wt%). Thecalculated equilibrium concentrations are also stated for comparison.
Measured Mn Equilibrium Mn No. of grains measured
alloy 1 7.4 ± 1.2 8.8 22alloy 2 8.1 ± 0.9 9.6 26alloy 3 9.1 ± 0.8 10.3 32
3.2. Mechanical behaviour and austenite stability
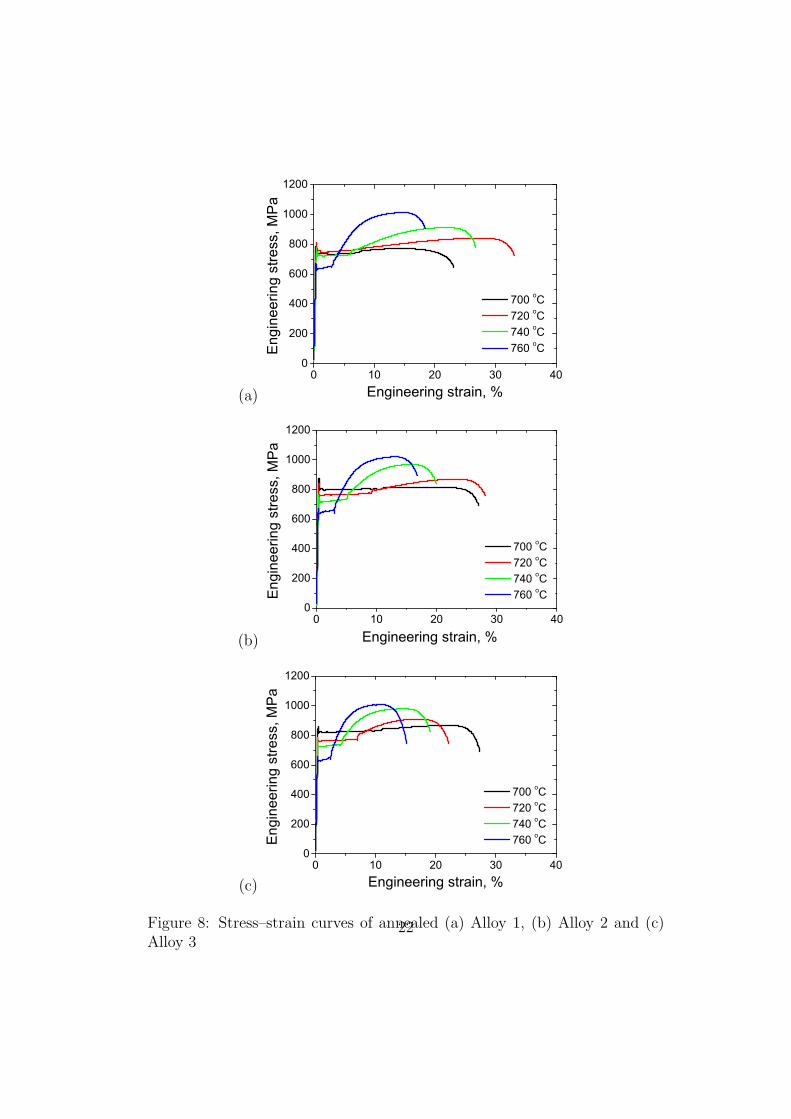
Fig. 8 (a) to (c) show representative stress–strain curves. The mechanical
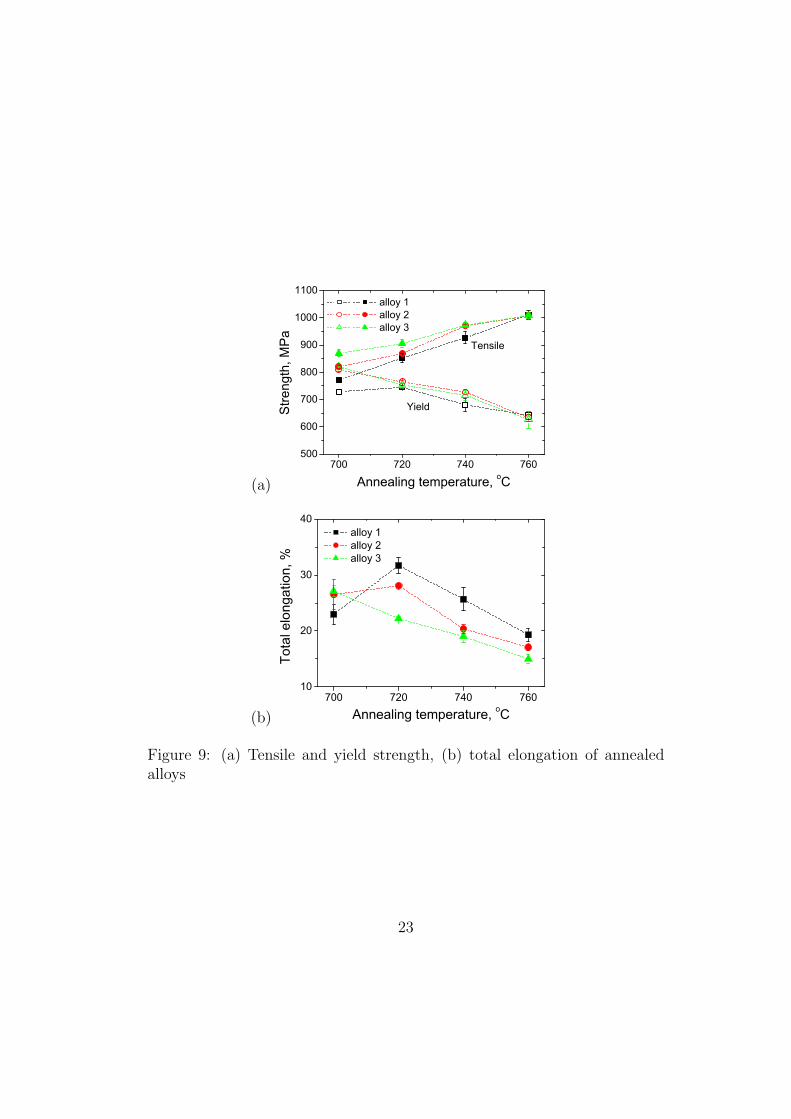
properties are summarised in Fig. 9. The yield strength decreases with an
increase in the annealing temperature, possibly because of the corresponding
greater degree of softening of the initially cold–deformed ferrite. The tensile
strength on the other hand, increases with the annealing temperature and a
close examination of Fig. 8 shows that this is entirely due to the fact that
the work hardening rates are greatest for samples annealed at the highest of
temperatures, i.e., containing the largest amount of retained austenite.
The observed variations in elongation Fig. 9 are particularly interesting,
and are attributed to changes in the stability of the retained austenite. For
annealing temperature ranging from 973–1033 K (700–760 !C), a maximum
elongation is obtained for the annealing temperature of 993 K (720 !C) in
Alloy 1 but that in Alloy 3 decreases monotonously; Alloy 2 shows a weak
maximum at 993 K (720 !C). Since the deformation–induced martensite plays
a role in inducing more homogeneous deformation (avoiding plastic instabil-
ities) [12, 13], there is an optimum austenite stability which is conducive to
the late onset of necking during tensile tests. The austenite should not all
decompose at an early stage of deformation, and it should not be so stable
that assistance from transformation plasticity in preventing necking is absent
[14].
6

The symbols in Fig. 10 are experimental data which show how the re-
tained austenite decomposes as a function of plastic strain. The austen-
ite is particularly stable in Alloy 1 annealed at 973 K (700 !C) and the
deformation–induced transformation becomes more rapid as the annealing
temperature is increased. It is therefore expected that the optimum stability
of austenite consistent with homogeneous deformation will be obtained at an
intermediate annealing temperature. Compared with Alloy 1, the austenite
in Alloy 3 annealed at 973 K (700 !C) is less stable and thus an increase
of annealing temperature by 20 K ( !C) reduces the mechanical stability of
austenite to such an extent that the homogeneous deformation is exhausted
at an early stage in the tensile test.
As pointed out, there are two major parameters controlling the stability
of austenite, the concentrations of alloying elements and the grain size. Ac-
cording to the Sherif et al. [15], the influence of the alloy composition can
be expressed as follows,
V"
V !"
= exp ("k1#G"!!$). (1)
Here, V !" is the austenite fraction prior to deformation, and V" the corre-
sponding fraction at any value of the true plastic strain $. The parameter k1
is a fitting constant. This equation does not include any e"ect due to the size
of the austenite regions, so only the chemical driving force #G"!!= G!! "G"
(J mol"1), a function of the chemical composition of the austenite, was con-
sidered. In the present study, the term was modified to reduce the magnitude
of #G"!!by #GS, where the latter depends on the austenite grain size. #GS
was calculated from the reduction in the martensite–start temperature,#MS,
caused purely by the size of the transforming region, according to Ref. [11]
as follows:
#Ms =1
bln
!1
aV"
"exp
#" ln(1" f)
m
$" 1
%+ 1
&(2)
7

Here, V" is average volume of an austenite grain, f is the first detectable
martensite fraction (0.01) andm is the aspect ratio of martensite plate (0.05),
respectively. a and b are constants of 1.57 ! 10 "21 µm and 0.253 respectively
[11]. The influence of austenite grain size on the reduction of the martensite–
start temperature, #MS, was converted into the extra free energy required
for the transformation due to the size e"ect, #GS. The free energies were all
calculated using ThermoCalc and the TCFE 6 database assuming an equi-
librium concentration of substitutional solutes, but the carbon content was
estimated from a mass balance between the ferrite and measured austenite
fraction. The assumption on the substitutional solutes is reasonable given
the large degree of partitioning of manganese in Table 2 when compared with
the average values listed in Table 1. The lines in Fig. 10 shows the calculated
austenite fractions during deformation. The stability of the austenite in all
cases is reasonably captured using a single fitting parameter, k1 = 0.008 mol
J"1. Comparing Figs. 10 (a) and (b) suggests that the austenite has worse
stability as carbon is replaced by manganese during alloy design. On the
basis of equation 1, this e"ect has its origin in the larger influence of carbon
on the driving force for martensitic transformation.
From the kinetics of deformation–induced transformation, the contri-
bution of martensite formation on the work–hardening behaviour was es-
timated. Fig. 11 shows the calculated hardness increment accompanying
to the martensite formation during straining in Alloy 1, with the hardness
of martensite evaluated following Ion et al. [16] and the hardness ratio of
austenite to martensite is assumed to be 0.6 [17]. The increments of hard-
ness corresponding to the strain consistent with the ultimate tensile strength,
are #H700V = 6.9, #H720
V = 46.7, #H740V = 58.4 and #H760
V = 65.6. These
can be used to estimate strength increments due to work–hardening caused
by martensitic transformation [18], as #%700 = 16 MPa, #%720 = 84 MPa,
8

#%740 = 118 MPa and #%760 = 150 MPa.1 Comparison with the observed
work–hardening, #%700 = 42 MPa, #%720 = 107 MPa, #%740 = 246 MPa
and #%760 = 369 MPa, indicates that the real hardening is much larger than
that expected from the hardness increment due to martensite formation, ex-
cept for the case of annealing at 993 K (720 !C). The discrepancy may arise
from known e"ects associated with the creation of dislocation debris during
transformation, and the composite e"ect of multiphase deformation [13, 19].
4. Conclusions
Alloys relying on transformation–induced plasticity, containing a rela-
tively large manganese concentration and a reduced aluminium concentration
have been designed and validated experimentally. It is found that:
1. Reducing either the carbon or manganese concentrations can permit the
aluminium content to be reduced without compromising the required
15 – 25 % retained austenite generated during intercritical annealing
for short time periods.
2. The structure obtained is found to contain incredibly fine and equiaxed
grains of retained austenite, and the approximately 0.3µm scale of these
grains is insensitive to the annealing temperature over the range stud-
ied. Furthermore, the fine scale adds significantly to the stability of the
retained austenite. The formulation combining the influence of chem-
ical driving force and grain size captures reasonably the mechanical
stability of austenite and the kinetics of deformation–induced transfor-
mation in the investigated alloys.
3. For the range of alloys studied, it is noteworthy that the dependence
of tensile properties of the composition itself is not large with respect
to variations in the carbon and manganese levels. This bodes well for
1Following [18], !! (kg/mm2)=!H3 (0.1)n, n is strain hardening coe"cient
9

mass manufacture where strict composition specifications are hard to
maintain, and where solidification–induced segregation can produce a
heterogeneous distribution of the the intended concentration.
10

Acknowledgments: The authors are grateful for support from the POSCO
Steel Innovation Programme, and to the World Class University Programme
of the National Research Foundation of Korea, Ministry of Education, Science
and Technology, project number R32–2008–000–10147–0.
[1] R. L. Miller: Metallurgical Transactions 3 (1972) 90–912.
[2] D. W. Suh, S. J. Park, T. H. Lee, C. S. Oh, S. J. Kim: Metallurgical
and Materials Transactions A 41A (2010) 397–408.
[3] H. Aaronson, P. G. Domian, H.A.: TMS-AIME 236 (1966) 781–796.
[4] S. Abdelaziz, G. Megahed, I. El-Mahallawi, H. Ahmed: Ironmaking and
Steelmaking 36 (2009) 432–441.
[5] B. Sundman, B. Jansson, J. Andersson: CALPHAD 9 (1985) 153–190.
[6] Bratberg: TCFE6-TCS Steels / Fe-Alloys Database, Version 6.2: Tech.
rep.: Thermo-Calc software AB: Stockholm, Sweden (2011).
[7] C. F. Jatczak: SAE Technical Paper Series 800426: Tech. rep.: SAE
(1980).
[8] ASTM E8M3 Standard Test Method for Tension Testing of Metallic
Materials.
[9] H. Yi, Lee.K.Y., H. Bhadeshia: Materials Science and Technology 27
(2011) 525–529.
[10] P. Brofman, G. Ansell: Metallurgical Transactions A 14A (1983) 1929–
1931.
[11] H. S. Yang, H. K. D. H. Bhadeshia: Scripta Materialia 60 (2009) 493–
495.
11

[12] W. Gerberich, G. Thomas, E. Parker, V. Zackay: Metastable austenite:
Decomposition and strength: in: Second International Conference on
Strength of Metals and Alloys: ASM International, Ohio, USA, 1970:
pp. 984–899.
[13] H. K. D. H. Bhadeshia: ISIJ International 42 (2002) 1059–1060.
[14] J. M. Jang, S. J. Kim, N. H. Kang, K. M. Cho, D. W. Suh: Metals and
Materials International 15 (2009) 909–916.
[15] M. Sherif, M. Garcia Mateo, T. Sourmail, H. Bhadeshia: Materials Sci-
ence and Technology 20 (2004) 319–322.
[16] J. Ion, L. Anisdahl: Journal of Materials Science and Technology 65
(1997) 261–267.
[17] Q. Furnemont, M. Kempf, P. Jacques, M. Goken, F. Delannay: Materi-
als Science and Engineering A328 26–32.
[18] J. Cahoon, W. Broughton, A. Kutzak: Metallurgical Transactions 2
(1971) 1979–1983.
[19] Y. Tomota, K. Kuroki, T. Mori, I. Tamura: Materials Science and En-
gineering 24 (1976) 85–94.
12

Figure 1: Equilibrium phase fraction of investigated alloy at elevated tem-perature
13

(a)
(b)
Figure 2: Optical micrographs of hot-rolled (a) Alloy 1, (b) Alloy 2. (con-tinued on next page)
14
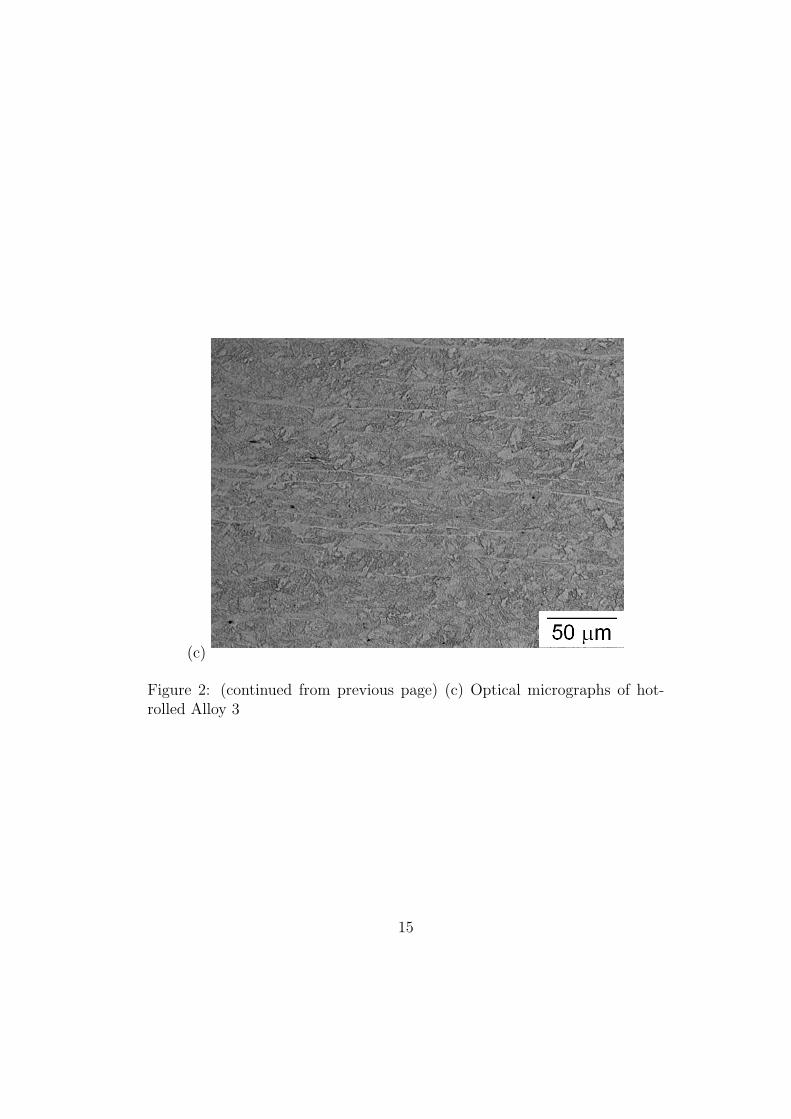
(c)
Figure 2: (continued from previous page) (c) Optical micrographs of hot-rolled Alloy 3
15

(a)
(b)
Figure 3: Phase maps of annealed (a) Alloy 1, (b) Alloy 2, following annealingat 993 K (720 !C). (continued on next page).
16

(c)
Figure 3: (continued from previous page) (c) Phase map of annealed Alloy 3following annealing at 993 K (720 !C).
17

Figure 4: Austenite grain size as a function of annealing temperature.
18

Figure 5: Austenite fraction as a function of annealing temperature. Thelines without points represent the calculated equilibrium fractions.
19
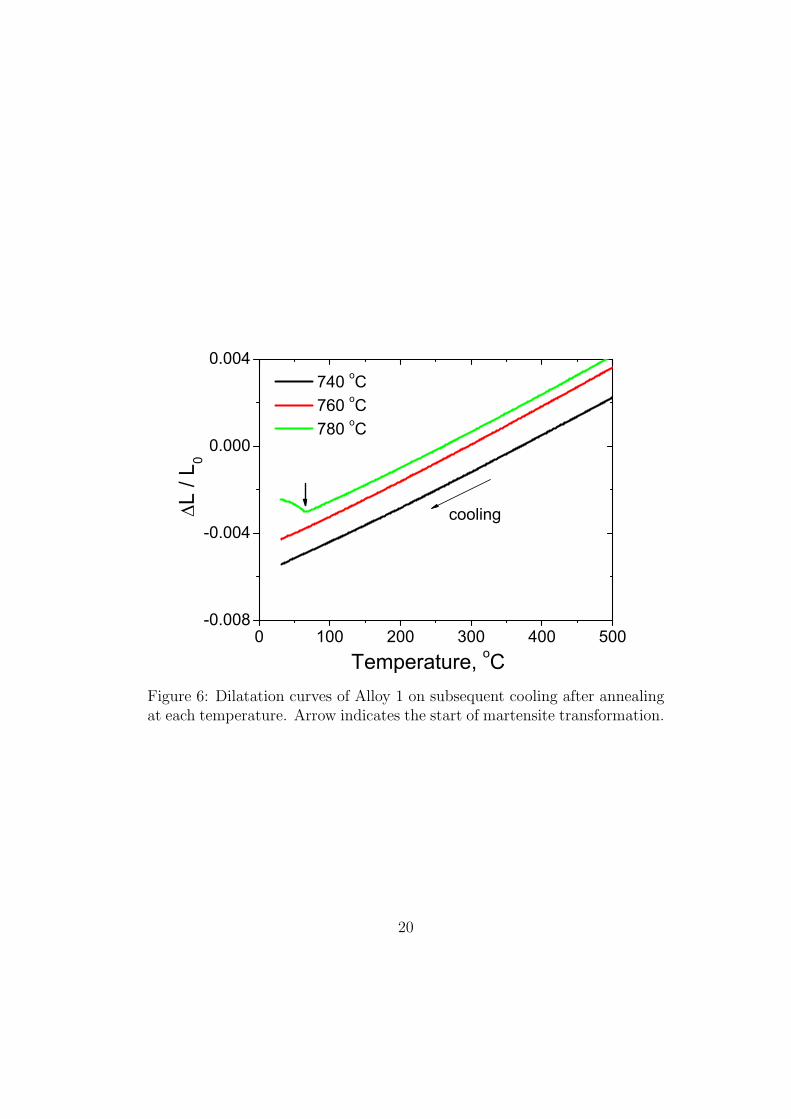
Figure 6: Dilatation curves of Alloy 1 on subsequent cooling after annealingat each temperature. Arrow indicates the start of martensite transformation.
20

Figure 7: TEM micrograph of alloy 3 annealed at 720 ! C
21
(a)
(b)
(c)
Figure 8: Stress–strain curves of annealed (a) Alloy 1, (b) Alloy 2 and (c)Alloy 3
22
(a)
(b)
Figure 9: (a) Tensile and yield strength, (b) total elongation of annealedalloys
23

(a)
(b)
Figure 10: Austenite fractions in (a) Alloy 1 and (b) Alloy 3 as a function ofstrain. Symbols are measured values and lines are calculated ones.
24

Figure 11: Calculated hardness increment from the strain–induced marten-site transformation in Alloy 1.
25


