Embed Size (px)
Citation preview

CHAPTER 5 RISK MANAGEMENT ANALYSIS PAGE 49
Chapter 5RISK MANAGEMENT ANALYSIS

MINNESOTA GO MNDOT TRANSPORTATION ASSET MANAGEMENT PLANPAGE 50
This page intentionally left blank.

CHAPTER 5 RISK MANAGEMENT ANALYSIS PAGE 51
RISK MANAGEMENT ANALYSISOverview
Risk is frequently defined as the effect of uncertainty on objectives. When applied to the management of transportation assets, acknowledging and understanding risk can help a transportation agency more effectively plan for possible system and program disruptions and complications, mitigate potential consequences, and improve agency and infrastructure resiliency.
MnDOT understands the value of accounting for and managing risk and has been incorporating risk into both capital and highway operations planning, as well as into business planning for each of the agency’s functional areas. Most recently, risk assessment has been formally incorporated into the Minnesota 20-year State Highway Investment Plan (MnSHIP), published in 2013, and played a prominent role during its development. MnDOT also produced an Enterprise Risk Management Framework and Guidance document in 2013, which “establishes the standards, processes and accountability structure used to identify, assess, prioritize and manage key risk exposures across the agency.” Risk also factors into the most recent Statewide Highway Systems Operation Plan (HSOP), where it influences tradeoff discussions and funding prioritization.
This strong history with risk prompted MnDOT to take a somewhat unique approach to the Risk Management Analysis section of the TAMP. Because risk management is already integrated into most agency planning and management practices, it was recognized that focusing on “global” risks (e.g. natural events, operational hazards, aging assets) would be less beneficial than assessing and developing mitigation strategies for “undermanaged” risks – opportunities that exist for MnDOT to further improve its asset management processes.
Risk and Transportation
Like many transportation departments, MnDOT endeavors to provide the level of service demanded by the public at minimum cost. Unexpected events – including external hazards, economic disruptions, or insufficient understanding – can reduce the effectiveness of an agency in achieving its goals, however. Figure 5-1 shows several examples of risks that are of particular concern to transportation agencies.

MINNESOTA GO MNDOT TRANSPORTATION ASSET MANAGEMENT PLANPAGE 52
Figure 5-1: Key Transportation-Related Risk Factors
RISK FACTORNatural events (e.g. floods, storms, earth movement)Operational hazards (e.g. vehicle and vessel collisions, failure or inadequacy of safety features, and construction incidents)Asset ageing effects (e.g. steel fatigue or corrosion, advanced deterioration due to insufficient preservation or maintenance)Adverse conditions in the economy (e.g. shortage of labor or materials, recession)Staff errors or omissions in facility design, operations, or provision of services; or defective materials or equipmentLack of up-to-date information about defects or deterioration, or insufficient understanding of deterioration processes and cost drivers

CHAPTER 5 RISK MANAGEMENT ANALYSIS PAGE 53
Consequences of such risks can include:
• Personal injury
• Loss of life
• Private property damage
• Infrastructure damage
• Traffic congestion
• Loss of access
• Loss of economic activity
• Harm to the environment
• Harm to public health
• Litigation and liability losses
• Resource waste
• Harm to agency reputation
Each of these can adversely affect the achievement of program goals and performance targets.
Some of these risk factors can be partially quantified by studying historical records, via active monitoring, or through quality assurance processes. Many significant risk factors, however, are prohibitively expensive or technologically impossible to measure. Even for factors that are difficult to measure, though, it is possible to adopt general risk management strategies, such as:
• Raising awareness of risks among staff and the public
• Adopting management strategies and techniques to avoid risks
• Prioritizing risk-prone assets for replacement
• Mitigating asset risks based on measurable characteristics that affect their resilience and exposure
• Working with partners and stakeholders on ways to reduce or to jointly manage risks

MINNESOTA GO MNDOT TRANSPORTATION ASSET MANAGEMENT PLANPAGE 54
Risk at MnDOT
The principles of risk management have been adopted throughout the agency in recent years, from high level investment, management, or operations plans (MnSHIP, TAMP, HSOP) to individual asset management and programming systems and even research projects.
ENTERPRISE RISK MANAGEMENT (ERM)To help guide the transition to formal and universal consideration of risk, MnDOT has implemented an ERM framework. The framework – illustrated in Figure 5-2 – is an integral part of MnDOT’s business processes, linking strategic risk assessments by senior executives to risks at the business line (program) level that affect products and services and at the project level that affect project objectives like scope, schedule, and cost. MnDOT created and now maintains a risk register to support the risk assessment processes, which reflects at any given time the current status of strategic and business line risks, including relevant performance objectives.
Figure 5-2: Levels of Risk Management MnDOT

CHAPTER 5 RISK MANAGEMENT ANALYSIS PAGE 55
MINNESOTA 20-YEAR STATE HIGHWAY INVESTMENT PLAN (MNSHIP)Risk was a key factor considered during the 2013 MnSHIP process. Risk-based planning was central to its development, as MnDOT systematically identified the likelihood and impact of different risks to assess the tradeoffs associated with various investment mixes. The resulting comprehensive and dynamic document guides MnDOT’s future investment planning.
As a result of changes in performance requirements, targets, and prioritization established by MAP-21, MnDOT also developed two programs – the Statewide Performance Program (SPP) and the District Risk Management Program (DRMP). By enhancing flexibility and collaboration with regional and local MnDOT staff, these programs help the agency effectively reallocate funding and address these changes. Further discussion of MnSHIP, the SPP, and the DRMP is found in Chapter 8: Financial Plan and Investment Strategies.
Figure 5-3 displays the capital investment risks categories considered in MnSHIP and the degree to which each is mitigated via the strategies outlined in the plan. Risks were not mitigated as well in years 11-20 (not relevant to the TAMP planning horizon and therefore not shown).
Figure 5-3: Investment Risk Mitigation in MnSHIP
KEY CAPITAL INVESTMENT RISKS MITIGATED RISK THROUGH YEAR 10GASB 34: pavement and bridge conditions deteriorate, jeopardizing state bond rating
Partially mitigated.
MnDOT mitigates most of the risk through its investment priorities
Federal policy: failure to achieve MAP-21 performance targets on NHS reduces funding flexibility
Adequately mitigated.
MnDOT mitigates most or all of the risk through its investment priorities
MnDOT Policy: misalignment with Vision and Statewide Multimodal Transportation Plan results in loss of public trust
Partially mitigated.
MnDOT mitigates most of the risk through its investment priorities
Bridges: deferring bridge investments viewed as an unwise / unsafe strategy
Adequately mitigated.
MnDOT mitigates most or all of the risk through its investment prioritiesResponsiveness: rigid investment priorities limits ability to support local economic development and quality of life opportunities
Partially mitigated.
MnDOT mitigates most of the risk through its investment priorities
Operations budget: untimely or reduced capital investment leads to unsustainable maintenance costs
Partially mitigated.
MnDOT mitigates most of the risk through its investment priorities
Public outreach: investment inconsistent with MnSHIP public outreach results in loss of public trust
Partially mitigated.
MnDOT mitigates most of the risk through its investment priorities
MINNESOTA GO MNDOT TRANSPORTATION ASSET MANAGEMENT PLANPAGE 56
STATEWIDE HIGHWAY SYSTEMS OPERATION PLAN (HSOP)MnDOT’s Statewide Highway Systems Operation Plan provides a framework for managing key operations and maintenance activities throughout the state, supports the agency’s vision, and complements other planning efforts. It advocates performance-based planning and data-driven decision making for operations and maintenance. An Enterprise Risk Management assessment was completed as part of the HSOP and helped to identify, assess, manage, and communicate operations- and maintenance-related opportunities and threats. Assessments of risk are also driving factors for many operations and maintenance treatment decisions. With such a structure in place, MnDOT operations decision-makers and managers have a good baseline understanding of the current risk environment, a common language in operations, a risk inventory, and a risk-ranking methodology to prioritize risks within and across functions.
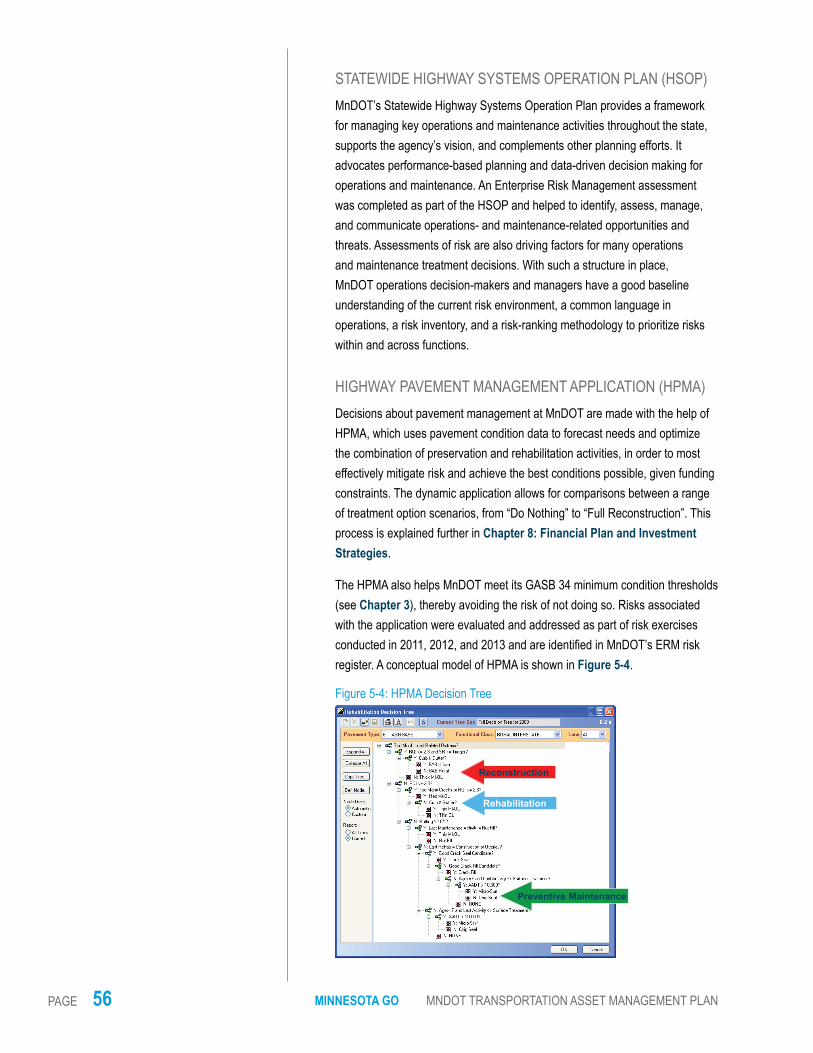
HIGHWAY PAVEMENT MANAGEMENT APPLICATION (HPMA)Decisions about pavement management at MnDOT are made with the help of HPMA, which uses pavement condition data to forecast needs and optimize the combination of preservation and rehabilitation activities, in order to most effectively mitigate risk and achieve the best conditions possible, given funding constraints. The dynamic application allows for comparisons between a range of treatment option scenarios, from “Do Nothing” to “Full Reconstruction”. This process is explained further in Chapter 8: Financial Plan and Investment Strategies.
The HPMA also helps MnDOT meet its GASB 34 minimum condition thresholds (see Chapter 3), thereby avoiding the risk of not doing so. Risks associated with the application were evaluated and addressed as part of risk exercises conducted in 2011, 2012, and 2013 and are identified in MnDOT’s ERM risk register. A conceptual model of HPMA is shown in Figure 5-4.
Figure 5-4: HPMA Decision Tree
Reconstruction
Rehabilitation
Preventive Maintenance

CHAPTER 5 RISK MANAGEMENT ANALYSIS PAGE 57
BRIDGE REPLACEMENT AND IMPROVEMENT MANAGEMENT (BRIM)Many of MnDOT’s asset-related risks are managed in whole or in part by established asset management processes, such as the BRIM program and the Highway Pavement Management Application (HPMA). BRIM is used by MnDOT to identify, classify, evaluate, and plan for a variety of quantifiable risks that apply to highway bridges. Hazards analyzed in BRIM include:
• Advanced deterioration of bridge decks, superstructures, and substructures
• Scour of riverbeds around bridge foundations
• Fracture criticality (possibility of bridge instability due to failure of only one element)
• Fatigue cracking
• Overload
• Collisions with over-height vehicles
Bridge characteristics related to each of these hazards are routinely updated in the MnDOT inventory. The information is used to prioritize necessary mitigation or replacement projects (illustrated in Figure 5-5). So far, MnDOT has not developed any network-level performance measures that can be used to track improvements in bridge resilience over time as a result of the BRIM analysis. This would be a logical next step to ensure effective implementation.
Figure 5-5: MnDOT Bridge Programming Risk Assessment
None Tiny Low Medium High
0% 100 100 100 100 100 100 10% 10 0 1 00 95 95 85 85 20% 95 95 90 90 80 80 30% 90 90 85 85 75 75 40% 75 75 70 70 55 55 50% 55 55 50 50 35 35 60% 35 35 30 30 20 20 70% 20 20 15 15 10 10 80% 10 10 5 5 0 0 90% 5 5 5 5 0 0
100% 0 0 0 0 0 0
Like
lihoo
d of
haz
ard
Consequence to structure Impact on the public
Facility Level Resilience (0-100)
Tra�
c vo
lum
e at
faci
lity
0
10000
100000
more
Role of facility in network (Importance factor) minor major
Facility Weight (0- ∞) Advanced deterioration - deck
Advanced deterioration - superstructure
Advanced deterioration - substructure
Scour - erosion at foundation
Fatigue and fracture criticality
Over-weight trucks - load rating
Over-height trucks - vertical clearance
Loss of control of vehicle - road width
Flooding - waterway adequacy Relative weights
Network Level Resilience(0- ∞)
Compute weighted sum over groups of bridges or network
(separate scaling table or formula for each type of risk)
Compute weighted average over the types of hazards Σ
Σ
Extreme
Source: NCHRP Report 706, Uses of Risk Management and Data Management to Support Target-Setting for Performance-Based Resource Allocation by Transportation Agencies (2011).

MINNESOTA GO MNDOT TRANSPORTATION ASSET MANAGEMENT PLANPAGE 58
Figure 5-6: Risk Rating Matrix
CONSEQUENCE RATINGS
LIKELIHOOD RATINGS AND RISK LEVELSRATE UNLIKELY POSSIBLE LIKELY ALMOST
CERTAIN
CATASTROPHIC Medium Medium High Extreme Extreme
MAJOR Low Medium Medium High High
MODERATE Low Medium Medium Medium High
MINOR Low Low Low Medium Medium
INSIGNIFICANT Low Low Low Low Medium
RESEARCH PROJECTSFinally, the concept of risk also factors heavily into several past and current research projects at MnDOT. For instance, the agency was selected to participate in an FHWA Flash Flood Vulnerability and Adaptation Assessment Pilot Project that will help MnDOT (and other state DOTs) better understand the process for incorporating climate change in asset management planning. This project is currently underway and results, when ready, will help inform future asset management initiatives.
TAMP Risk Assessment
As detailed above, risk is an important part of MnDOT’s practices. Nevertheless, the agency’s approach to the risk section of the TAMP process began with a focus on “global” risks (e.g. natural events, operational hazards) and their effects on the asset, the public, and the agency. MnDOT engaged in an exercise to identify and prioritize strategic and business risks that could impact its ability to deliver the level of service expected by the public. Discussions were held with Work Groups of technical experts to describe and rate the major risks related to each asset category. Figure 5-6 illustrates MnDOT’s risk rating scale. In consultation with agency risk experts, each Work Group developed a series of risk statements and risk ratings, described potential mitigation strategies for each risk, and developed methods for estimating mitigation costs. This process was iterative, extending over three formal workshops, with opportunities between workshops to modify aspects of the product. Participants took advantage of the process to learn about the risks, assess the ability of existing information systems to quantify risks and costs, and reach consensus on priorities and approaches for future improvements.

CHAPTER 5 RISK MANAGEMENT ANALYSIS PAGE 59
Given MnDOT’s previous efforts at incorporating risk throughout its planning and management, the risk identification and mitigation process also sparked a debate as to the merits of a more conventional risk approach. It was concluded that MnDOT’s current practices were already mindful of many global risks, and that the agency (and the public it serves) would therefore benefit most if the risks addressed in the TAMP emphasized “undermanaged risks” – areas in which there were clear opportunities for improvement at MnDOT. After pivoting to this concept and eliminating well-managed risks, a final list of undermanaged risks – relating to data, maintenance, or inspections – and associated risk mitigation strategies was presented to the Steering Committee for prioritization. The steps taken during the risk and mitigation strategy identification, prioritization, and costing exercises are described in detail in the accompanying Technical Guide.
Figure 5-7 identifies the risk mitigation strategies, separated into three priority levels based on factors like need, ease of implementation, and ability to reduce the perceived risk. Chapter 9: Implementation and Future Developments provides more detail for these priorities, including purposes, responsible parties, expected timeframes, and estimated implementation costs.
Figure 5-7: Undermanaged Risk Mitigation Strategy Prioritization
PRIORITY LEVEL 1: HIGH PRIORITY, ADDRESS IMMEDIATELY
• Pavements: Annually track, monitor, and identify road segments that have been in Poor condition for more than five years, and consistently consider them when programming.
• Deep Stormwater Tunnels: Address the repairs needed on the existing South I-35W tunnel system.
• Deep Stormwater Tunnels: Investigate the likelihood and impact of deep stormwater tunnel system failure.
• Highway Culverts: Develop a thorough methodology for monitoring highway culvert performance.
• Overhead Sign Structures and High-Mast Light Tower Structures: Develop and adequately communicate construction specifications for overhead sign structures and high-mast light tower structures.
• Overhead Sign Structures and High-Mast Light Tower Structures: Track overhead sign structures and high-mast light tower structures in a Transportation Asset Management System (TAMS).

MINNESOTA GO MNDOT TRANSPORTATION ASSET MANAGEMENT PLANPAGE 60
PRIORITY LEVEL 2: ADDRESS BASED ON ESTABLISHED PRIORITIES
• Pavements: Collect and evaluate performance data on ramps, auxiliary lanes, and frontage road pavements for the highway system in the Twin Cities Metro Area.
• Bridges: Augment investment in bridge maintenance modules and develop related measures and tools for reporting and analysis.
• Highway Culverts: Include highway culverts in MnDOT’s TAMS.
• Deep Stormwater Tunnels: Place pressure transducers in deep stormwater tunnels with capacity issues.
• Deep Stormwater Tunnels: Incorporate the deep stormwater tunnel system into the bridge inventory.
• Overhead Sign Structures: Develop a policy requiring a five-year inspection frequency for overhead sign structures, as well as related inspection training programs and forms.
PRIORITY LEVEL 3: REVISIT WHEN ADDITIONAL FUNDING BECOMES AVAILABLE (AFTER ITEMS IN PRIORITY LEVELS
1 AND 2 HAVE BEEN ADDRESSED)• Highway Culverts: Repair or replace highway culverts in accordance
with recommendations from the TAMS.