Embed Size (px)
Citation preview

Geographic Diversification and Agency Costs of Debt of Multinational Firms
John A. Doukas and Christos Pantzalis*
October 3, 2001
Abstract
This paper examines the agency conflicts between shareholders and bondholders of multinational and non-multinational firms and provides an explanation for the puzzle that multinational firms use less long-term debtbut more short-term debt than domestic firms. Using a sample of 6,951 firm-year observations for multinationaland domestic firms over the 1988-1994 period, we find that alternative measures of agency costs havestatistically significant negative effects on firm long-term leverage. The results, however, also show that thenegative effects of agency costs of debt on long-term leverage are significantly greater for multinational thannon-multinational firms. It is documented that the effect of the agency costs of debt on leverage are increasedby the firm’s degree of foreign involvement. The evidence shows that firm’s increasing foreign involvementexacerbates agency costs of debt leading to lower (greater) use of long-term (short-term) debt financing. Thisresult is also confirmed using alternative measures of foreign involvement. The evidence is consistent with theview that multinational corporations are susceptible to higher agency costs of debt than domestic corporationsbecause geographic diversity renders active monitoring more difficult and expensive in comparison to domesticfirms. The results fail to support the view that MNCs’ lower long-term debt ratios are due to the advantages ofthe internal capital markets.
*Department of Finance, Stern School of Business, New York University, New York, NY 10012, School ofBusiness and Public Administration, Old Dominion University, Norfolk, VA 23529-0218, Tel: (757) 683-5521,Fax: (757) 683-5639, E-mail: [email protected], Distinguished Senior Research Fellow, Cardiff BusinessSchool, Cardiff, UK and Department of Finance, College of Business Administration, University of South Florida,Tampa, FL 33620-5500, Tel: (813) 974-6326, Fax: (813) 974-3030, E-mail: [email protected], respectively.We would like to thank an anonymous referee and participants at the 1997 FMA meetings for useful commentsand suggestions that have improved the paper.
1 The theoretical literature includes the work of Modigliani and Miller (1958), Myers (1977), Jensen(1986), and Stulz (1990), among others, while the empirical literature contains studies by Holderness andSheehan (1988), Morck, Shleifer and Vishny (1988), McConnell and Servaes (1990,1995), Hermalin andWeisbach (1991), Phelps, Moore and Roenfeld (1991), Kole (1994), and Lang, Ofek and Stulz (1996), amongothers.
2 Myers(1977) shows that firms with higher-valued investment opportunities have higher agency costsof debt.
3 See, for example, Titman and Wessels (1988) and Long and Malitz (1985). Prowse(1990) hasexamined the effects of agency costs on leverage for US and Japanese firms. The evidence of these studiessuggests that debt ratios are inversely related to the firm’s potential to engage in risky and sub-optimalinvestments. These findings are consistent with the notion that agency problems increase when sub-optimal
Geographic Diversification and Agency Costs of Debt of Multinational Firms
1.Introduction
Although the positive and negative attributes of debt as a corporate financing instrument have
been theoretically and empirically examined, the impact of agency costs of debt on the financial
structure of multinational corporations (MNCs) remains unknown.1 Furthermore, the documented
puzzle that multinational firms have less long-term debt but more short-term debt than domestic
firms also warrants investigation.
Recent empirical evidence indicates that firms with foreign operations have greater growth
opportunities than firms with only domestic operations (Bodnar and Weintrop (1997) among others).
Doukas (1995) shows that expansion of foreign operations by US multinational firms, does not elicit
a positive market reaction due to market’s perception of increasing agency costs in managing
geographically diverse operations. Consistent with Myers (1977), these results imply that MNCs
may be subject to greater agency costs of debt than domestic firms.2
While recent studies show that debt ratios are inversely related to the firm’s agency costs
of debt, estimates of the agency cost implications on debt for geographically diversified firms do not
exist.3 The issue of geographic diversification on firm leverage has been ignored despite the fact that

2
investment decisions are made that compromise debtholder interests.
4 As Burgman (1996) states “most of the empirical literature on capital structure has either completelyignored international factors, or implicitly assumed that they are adequately proxied by the standard business riskmeasures”. While Fatemi (1988) and Lee and Kwok (1988) compare leverage measures of MNC and domesticfirms they do not examine the relation between leverage and capital structure determinants for the two types offirms.
many US corporations maintain operations in several countries. The geographic structure of these
corporations may exacerbate or mitigate the inherent conflict between shareholders and
debtholders. This lack of control for geographic diversification permits a bias in existing estimates
of the negative relation between leverage and agency costs of debt due to a correlated omitted
variable problem. Since a considerable number of firms, considered in previous studies, are
industrially and geographically diversified, this potential bias needs to be accounted for in order to
obtain a more precise estimate of the impact of agency costs of debt on firm leverage. Because
MNCs are typically also industrially diversified, they offer a unique opportunity to examine the effects
of agency costs of debt on leverage in a framework where we simultaneously control for both
dimensions of diversification.
In this paper we estimate the relation between leverage and alternative measures of agency
costs of debt for U.S. multinational and non-multinational corporations. Our approach allows us to
estimate the independent effects of geographic and industrial diversification on firm leverage.
Specifically, we use industry segment and geographic diversification data to address the question
of whether MNCs are plagued by more severe agency cost of debt problems than domestic firms.
While past studies have shown that MNCs tend to make less use of long-term debt than domestic
firms (Fatemi (1988) and Lee and Kwok (1988)), they fail to explain why multinational firms have
less long-term debt but more short-term debt than domestic firms. Our interest on the capital
structure of MNCs and non-MNCs is also motivated by the need to examine why multinational firms
may exhibit distinctly different financial structures than firms without international involvement.4
3
5 Market segmentation is caused by market imperfections, such as informational barriers, differing taxand legal systems, government regulations and restrictions imposed on capital flows, etc.
6 Kedia and Mozumdar (1999) show that firms with high aggregate foreign exchange exposure tend toissue more foreign currency denominated debt.
There are several reasons one would expect MNCs to have different leverage ratios than
domestic firms. First, MNCs have access to more sources of capital than domestic firms as a result
of the international nature of their operations. Therefore, to the extent that financial markets are not
integrated MNCs could raise more capital through foreign debt financing and at more favorable
terms than domestic firms.5 For example, consider the case of MNCs with subsidiaries in countries
with different tax rates on interest payments. MNCs can benefit by borrowing through foreign
affiliates exposed to high tax rates, thus increasing their interest tax shields (see Butler (1999),
p.416). Hence, access to external sources of financing should result in higher debt ratios for MNCs
than domestic firms. Thomadakis and Usmen (1991) show that, under segmented capital market
conditions, foreign risky debt can increase shareholder wealth. However, easier access to foreign
financial markets by MNCs may also result in equity rather than debt financing. Consequently, the
expected relation between the international operations of the firm and debt financing is non-negative.
Second reason for expecting MNCs to display higher debt ratios than domestic firms is the that
foreign debt can be used as a hedging instrument against foreign exchange risk.6 Because MNCs
have higher levels of foreign exchange exposure than domestic firms, it is expected that they make
greater use of debt financing than domestic firms. Furthermore, a large proportion of foreign
currency denominated debt can be motivated by the need of MNCs to partially hedge against country
and political risk exposures. Consequently, because MNCs are subject to currency, country and
political risk exposures they are expected to have higher overall debt ratios than domestic firms.
Apparently, the capital structure of MNCs is more likely to have a larger component of foreign-
denominated debt than non-MNCs. Thus, the expected relation between foreign involvement and
4
leverage is non-negative. Third, since the operations of MNCs are industrially and geographically
diversified, the business and financial risk of multinational corporations is expected to be lower in
comparison to that of domestic firms. This would tend to reduce the cost of debt and as a result
raise MNCs’ leverage. Therefore, this suggests that financial distress should have a negative and
greater bearing on the leverage of domestic firms than MNCs, while MNCs’ leverage should be
positively related with foreign involvement.
While liquidity, hedging, financial distress and operating considerations imply that MNCs are
likely to have greater leverage than firms without foreign involvement, empirical studies show that
MNCs have lower long-term leverage than domestic firms (Fatemi (1988) and Lee and Kwok
(1988)). There are three possible explanations for this finding. The first is associated with the
potential efficiencies of internal capital markets. The second explanation relates to the potential
effects of agency costs of debt. Another reason that MNCs have lower long -term leverage could
be attributed to the legal and institutional differences that persist across counties (Demirguc-Kunt
and Maksimovic (1999), Booth, Aivazian, Demirguc-Kunt and Maskimovic (2001)) where MNCs have
operations.
The effects of internal capital markets and agency costs of debt on firm leverage have not
received the required attention in the finance literature. Unlike previous studies, our empirical tests
are designed to address the agency costs of debt of MNCs in comparison to domestic firms, while
we control for the effects of internal capital markets on leverage. We argue that because MNCs are
geographically more diversified than domestic corporations they are more likely to be associated
with higher agency costs of debt problems than domestic firms. We hypothesize that if
geographically diversified firms suffer from higher agency costs of debt than domestic firms, the
relation between leverage and different measures of debt agency costs should be negative and
more pronounced for MNCs.
5
7In the context of corporate diversification, Doukas and et al.(2000) show that the monitoringeffectiveness of security analysts decreases with diversification.
Our results show that the capital structure of multinational corporations differs significantly
from that of domestic firms, in that MNCs tend to display lower long-term debt ratios and higher
short-term debt ratios than domestic firms. We also find the long-term debt ratios of multinational
corporations to be negatively related to the firm’s potential to engage in risky, suboptimal
investments, whereas the long-term debt ratios of non-MNCs are shown to be substantially less
negatively influenced by agency costs of debt in comparison to MNCs. This implies that MNCs have
significantly higher agency costs of debt than domestic firms. Furthermore, we find that the agency
costs of debt are positively related to the firm’s degree of international involvement. In particular, our
findings show that MNCs make less (more) use of long-term(short-term) debt financing because
they are subject to higher agency cost of debt than domestic firms. This result remains robust even
after controlling for the degree of industrial diversification, the structure of foreign operations and the
ownership structure characteristics of the firm. Our evidence is consistent with the view that
multinational corporations are subject to higher agency costs than domestic corporations because
international diversity increases information asymmetries rendering active monitoring more difficult
and expensive for MNCs in comparison to domestic firms.7
The remainder of the paper is organized as follows. In the next section we discuss the
effects of internal capital markets and agency costs of debt on firm leverage. In Section 3 we provide
a description of the data sources and the sample selection procedure, as well as the empirical
methodology. Section 4 contains the empirical results. Concluding remarks are provided in Section
5.
2.The Effects of Internal Capital Markets and Agency Costs of Debt on Firm Leverage
2.1 Internal capital markets and firm leverage
6
8 See Lamont (1997), Lang, Ofek and Stulz(1994), Houston, James and Markus (1996), and Scharfstein(1997) for evidence on the functioning of internal capital markets.
9 Most of the empirical evidence, however, indicates that internal capital markets do not work (Lamont(1997), Rajan, Servaes and Zingales(2000), Shin and Stulz (1998),and Lins and Servaes (1999a,1999b)).
Because MNCs consist of numerous divisions operating across industries and countries,
it can be argued that their operations allow them to create extensive internal capital markets that are
likely to provide them with cheaper financing than the external markets. Hence, if internal capital
markets work efficiently, MNCs are expected to rely more on internal than external financing and,
therefore, have lower leverage than domestic firms that lack MNCs’ depth of internal capital markets.
Consequently, a non-positive relation is predicted between the firm’s foreign operations and leverage
when internal capital markets bypass the informational asymmetries of external capital markets
(Stein (1997)). Recently, Scharfstein and Stein (1997) and Matsusaka and Nanda (1997) consider
the improved allocation of capital in internal capital markets and the associated agency costs for
diversified firms.8 They show that diversified firms can utilize internal capital markets to fund
profitable projects that, because of agency costs and information asymmetries, cannot be financed
in external capital markets. This implies that MNCs’ external debt financing needs will be attenuated
and, therefore, MNCs’ lower leverage should reflect the strengths of internal capital markets. This
view predicts a negative relation between industrial diversification and MNCs’ leverage. Therefore,
the debt ratios of MNCs (i.e., firms with internal capital market advantages) should exhibit an inverse
and more pronounced association with industrial diversification (i.e., number of business segments
) than non-MNCs.9
Several authors (Williamson (1975, 1986), Myers and Majluf (1984), Shleifer and Vishny
(1992), Stein (1997), and Lewellen (1971)), however, argue that diversified corporations create
internal capital markets, which are less prone to asymmetric information problems and hence they
can sustain higher levels of debt. This implies a positive relation between industrial diversification

7
and firm leverage. In addition, it is expected that this relation should be stronger for MNCs than
domestic firms since MNCs are likely to be more industrially diversified than domestic firms. The
two opposite views of the effects of the internal capital markets on firm leverage are tested by
examining the relation between corporate diversification and firm leverage. Furthermore, we test for
the effects of increased internal capital market advantages on leverage that may arise from the
geographic diversification of MNCs. The two competing views associated with the effects of the
internal capital market advantages on firm leverage should be amplified if geographic diversification
increases the internal capital market advantages of the firm.
2.2 Agency costs of debt and firm leverage
The negative effects of agency costs of debt on MNCs’ leverage arise from their geographic
diversity. Because the operations of MNCs are geographically dispersed, difficulties in gathering and
processing information make monitoring more costly than the cost of monitoring domestic firms.
Hence, it is expected that the inherent agency problem between shareholders and debtholders will
be exacerbated with the diverse geographic structure of MNCs and, therefore, bondholders will
require higher interest payments on loans to firms that are more susceptible to information
asymmetries and greater monitoring costs. This implies that diversified firms across countries are
likely to have lower debt ratios than pure domestic firms. Furthermore, it is expected that the
negative relation between leverage and agency costs of debt will be more pronounced for firms with
greater foreign involvement. Thus, the agency costs of debt view on firm leverage predicts that
MNCs’ leverage should be inversely related with agency costs of debt and that this relation should
be more pronounced in comparison to domestic firms.
The internal capital market view on firm leverage, however, predicts that MNCs’ leverage
should be positively related with internal capital markets and it should be considerably more

8
pronounced in comparison to domestic firms. A competing prediction of the internal capital markets
view, suggests that MNCs’ leverage should be negatively related with internal capital markets.
Testing for the effects of the agency costs of debt on leverage requires to control for the possible
effects of internal capital markets. If a positive relation between the MNCs’ leverage and internal
capital markets is found, while simultaneously an inverse relation is documented between MNCs’
leverage and agency costs of debt, then, that would suggest that the agency costs of debt have a
distinct influence on firm leverage. Furthermore, if the agency costs of debt exert a negative and
more amplified influence on the leverage of MNCs than non-MNCs it would imply that the agency
costs of debt are exacerbated by the firm’s foreign involvement. Since MNCs’ leverage could be
influenced by the legal and institutional characteristics of the host country, our analysis is designed
to control for such effects as well. Therefore, agency costs of debt aspects of multinational firms
warrant a closer examination.
3. Data and Methodology
3.1. Data selection and sources
The sample consists of mining, agricultural and manufacturing firms over the 1988-1994
period. The sample includes U.S. MNCs and pure domestic (non-MNCs) corporations. Originally,
we considered all firms with four-digit SIC industry codes of 3999 or less in the Compustat PC Plus
database. Excluding firms with missing financial and ownership structure information resulted in a
final sample of 6,951 firm-year observations. In this study a firm is defined as an MNC if it reports
foreign assets and foreign sales ratios of 10% or more. This classification is based on the
requirements of the Statement of Financial Accounting Standard No. 14 (FASB 1976), where MNCs
are identified as firms that report ratios of foreign assets, foreign sales or foreign income of at least
9
10 We choose the foreign assets and foreign sales ratio over the foreign income criterion, becauseforeign income is not reported uniformly across firms.
11 A less stringent classification of domestic firms that allows all firms that have foreign asset or foreignsales ratios of less than 10% to be labeled as domestic was also investigated. The results are qualitativelysimilar to the ones presented here and are available from the authors upon request.
12 According to the ownership definitions of Disclosure, institutional holders may include blockholdersand the blockholders may include both institutions and insiders.
10%.10 Firms are classified as domestic if they do not report any foreign assets and foreign sales.11
The financial data and the number of business segments for the period 1988-1994 were extracted
from the Compustat PC Plus CD-Rom database.
The common equity ownership data over the same period were obtained from the Compact
Disclosure CD-Rom database. Disclosure ownership data are compiled from the different SEC
filings included in the Spectrum databases. The data represent end of the year percentage of
common shares owned by insiders (members of the board of directors), blockholders ( investors
owning at least 5% of the outstanding shares), and institutional investors.12
The intersection of the above data sets resulted into 2,502 and 4,449 firm-year observations
for U.S. MNCs and domestic firms, respectively, for which leverage ratios could be computed over
the 1988-1994 period. Because of missing market-to-book observations, the tests that include a
variable based on market-to-book display a lower number of observations (2266 and 3855
observations for MNCs and domestic firms, respectively).
Table 1-Panel A provides a comparison of the means of the three leverage ratios (total debt
ratio (LEV), long-term debt ratio (LTD), and short-term debt rat io (STD)), between the MNC and
domestic samples, across different industries. Firms are assigned to different industries based on
their primary two-digit SIC industry code. LTD is measured as the ratio of Long Term Debt to Total
Debt plus Market Value of Equity. STD is measured as the ratio of Debt in Current Liabilities to Total
Debt plus Market Value of Equity. The STD measure is constructed so that it does not include
10
13We compared the average of quarterly STD ratios to calendar year-end STD ratios by 2-digit SIC codeindustry and found no significant differences, indicating that STD is not driven by cash-flow seasonality.
accounts payable and accrued expenses which may fluctuate seasonably and may not represent
ongoing sources of short term financing. LEV is the sum of STD and LTD. Debt ratios vary
considerably across industries and across type of firms. In thirteen out of the twenty two industries
LTD is lower for the MNC group in comparison to the non-MNC group. STD is higher for MNCs in
twelve industries. Table 1 - Panel A implies that a thorough examination of the determinants of
firm’s leverage should control for industry effects. The pooled sample averages reveal that while the
total debt ratios are very similar, MNCs display higher short-term debt ratios and lower long- term
debt ratios than domestic firms. A closer comparison of aggregate debt ratios between domestic
firms and MNCs with different degrees of foreign involvement is reported in Table 1 - Panel B.
[ Insert Table 1 Panel A About Here ]
Panel B provides the means and medians of the leverage variables as well as the t-statistics
and the Wilcoxon rank sum z-scores for the means and medians difference tests between the
domestic sample (DOM) and several MNC samples consisting of firms classified based on their
degree of foreign involvement measured by the levels of their foreign assets (FAR) and foreign sales
ratios (FSALER). The means difference tests show that LTD (STD) is significantly lower (higher)
for MNCs than for domestic firms. The Wilcoxon rank sum z-scores indicate that STD is
significantly higher for MNCs than domestic firms while this is not the case for LTD with the
exception of the first group of MNCs. Finally, the means and medians difference tests do not provide
significant results for the total debt ratios (LEV). Overall, the results from Panel B of Table 1 indicate
that MNCs have, on average, lower LTD and higher STD, but their overall debt ratios are not much
different than that of domestic firms.13 The evidence here is generally consistent with previous
research that indicates that larger firms (such as MNCs) have lower long-term debt ratios and
higher short-term debt ratios. Chung (1993) in an empirical study rejects the hypothesis that larger

11
14
firms have larger long-term debt capacity, and argues that larger firms have easier access to short-
term borrowing than smaller firms. Since MNCs are likely to be assigned higher credit ratings than
domestic firms, our evidence seems to be also consistent with Diamond (1991), who argues that
borrowers with higher credit ratings prefer short-term debt, while those with somewhat lower ratings
prefer long-term debt. In addition, if MNCs are subject to severe informational asymmetries and
more pronounced agency cost of debt problems, our findings are consistent with Barclay and Smith
(1995) and Easterwood and Kadapakkam (1994) who show that firms with higher information
asymmetries tend to issue more short-term debt.
This also implies that
they are likely to be subject to more pronounced agency costs than domestic corporations.
[ Insert Table 1 Panel B About Here ]
Panel C of Table 1 provides the means and standard deviations of the variables measuring
the firms’ potential for agency cost of debt , and of the other control variables included in our
regression analysis for the MNC and domestic sample, as well as the t-statistics for the means
difference test between the two samples. The t-statistic is significant for the short-term debt and
long-term debt ratios, verifying the evidence reported in Panel A that MNCs use more short-term and
less long-term borrowing. The domestic group has higher mean values of the proportion of the firm's
assets not tied up in fixed plant and equipment (AD2), and of a proportional measure of free cash
flow (AD3), in comparison to the MNC group. Interestingly, since these variables proxy for the
12
15 We also experimented with two alternative corporate focus measures. FOCUS: Corporate focus,measured as RDIV / (RDIV+UDIV), where RDIV (related diversification) is the number of 4-digit SIC codes withinthe firm’s primary 2-digit SIC code industry, and UDIV (unrelated diversification) is the number of 2-digit (SIC)codes outside the firm’s primary 2-digit SIC code industry. CON: concentration within the firm’s primary 2-digit SICcode industry, measured as RDIV / SIC4, where SIC4indicates the total number of 4-digit SIC reported codes .Based on the corporate focus measure (FOCUS), our sample shows that non-MNCs are significantly morefocused ( less diversified ) than MNCs. Using an alternative corporate focus measure (CON), the sample of firmsindicates that the business operations of domestic firms are significantly more concentrated ( focused) withintheir primary two-digit SIC code industry than MNCs. This SIC count-based measure differs conceptually from theHerfindahl-based measures of corporate diversification used in other studies (see among others Lang and Stulz(1994), and Comment and Jarrell (1995)). It is closer related to the number-of-segments measure (e.g., Lang andStulz (1994)) that essentially captures the same effects as the Herfindahl measure.
16 This is not consistent with Fatemi’s (1988) evidence which shows, among other factors contributing toMNCs' lower debt ratios, that MNCs have higher expected non-debt tax shields.
potential of agency costs, one would expect to find the opposite. It should be noted however that
whether the differences in leverage between MNCs and domestic firms are due to agency costs of
debt or due to the existence of more efficient internal capital markets for MNCs, cannot be detected
from univariate tests alone.
MNCs, on average, report a higher number of business segments than domestic firms. The
difference between the two samples is statistically significant at the 1% level (with a t-statistic of
9.64). This implies that MNCs are considerably more diversified than domestic firms.15 MNCs are
also different from domestic firms in terms of equity ownership structure. MNCs have considerably
lower mean insider shareholdings (INSIDE) and higher mean institutional shareholdings (INSTIT)
than domestic firms. This implies that firms without international involvement are characterized by
higher insider ownership concentration than MNCs. There are no significant differences in terms of
the mean outside blockholdings (OUTBLOCK) between MNCs and domestic firms. The sample
also suggests that domestic firms have higher operating risk (OPRISK), and lower past profitability
(PROF) and levels of non-debt tax shields (NDTS) than MNCs.16 The mean value of the current
assets as a percentage of total assets (CA/TA) is significantly lower for MNCs. This implies that the
greater use of short-term debt by MNCs is not part of a “matching” strategy, that would require firms
13
with higher short-term debt ratios to carry more current assets in order to obtain desired current
ratios.
[Insert Table 1 Panel C About here ]
Overall, the sample characteristics recorded in Table 1 suggest that MNCs have higher
(lower) short-term debt (long-term debt) ratios than domestic firms. Average total leverage ratios
(LEV) are not significantly different between MNCs and domestic firms in the sample. These ratios,
however, vary considerably across industries. As expected, MNCs also appear to be more
industrially diversified and more widely held than non-MNCs, implying that diversification and/or
equity ownership structure could explain potential capital structure differences between MNCs and
domestic firms. Consequently, examination of the agency cost of debt hypothesis requires that we
control for corporate diversification and ownership structure effects.
3.2. Methodology
To examine whether the international operating structure of the firm exacerbates the agency
costs of issuing debt in comparison to firms without international involvement we conduct a
comparison of the effects of agency cost of debt on long-term leverage using a sample of 2,502
and 4,449 year-firm observations for U.S. MNCs and non-MNCs, respectively, over the 1988-1994
period. Specifically, we analyze the extent to which the shareholder-bondholder agency problem is
significantly higher for MNCs than non-MNCs. If the international character of MNCs raises the
agency costs of issuing debt, MNCs should have lower debt ratios than non-MNCs with lower such
costs. That is, if the diversified operating structure of MNCs results into higher agency costs rational
investors are expected to demand a higher discount for holding debt issued by MNCs in relation to
domestic firms with lower agency costs. Therefore, agency cost measures should exhibit a
significant negative relation with MNCs’ leverage, whereas for non-MNCs the relation should be
negative and less pronounced. It has been shown (Barclay and Smith(1995) and Easterwood and

14
17 This model is based on those used by Titman and Wessels (1988), and Prowse (1990), with the addition of thecorporate diversification and the ownership structure variables.
18 Prowse (1990) compared the magnitude of the debt agency problem of U.S. firms with a sample of Japanesefirms. He provided evidence that the debt agency problem is less severe in Japan than in the U.S., and based thisfinding on the fact that Japanese financial institutions take large positions in firms to which they lend, therebymitigating the agency conflict.
Kadapakkam (1994)), however, that firms with higher informational asymmetries issue more short-
term debt. Moreover, Diamond (1991) argues that larger firms have easier access to short-term
capital than smaller firms. Therefore, the notion that higher agency and informational costs have an
adverse effect on the debt capacity of MNCs may understate the impact of agency costs on total
leverage because firms with high agency costs are likely to resort to short-term debt. Hence, it is
appropriate to examine whether agency costs reduce the long-term debt of the firm. Furthermore,
because long-term debt is more likely to be used for funding long-term investment projects, agency
costs of debt are expected to have a greater impact on the firm’s long-term leverage. This
hypothesis is tested, controlling for the firm’s degree of industrial diversification and other
characteristics, using a modified regression model for firm long-term leverage17 used in previous
studies by Titman and Wessels (1988) and Prowse (1990):18
LTD = f(AD, SEGNUM, OPRISK, NDTS, PROF, SIZE, DIVPOR, STDLIB, INSIDE, OUTBLOCK, INSTIT) (1)
The firm’s long-term leverage ratio, LTD, is measured as (Long-Term Debt)/(Total
Debt+Market Value of Equity). We use three agency costs of debt, AD, measures that have been
used in other empirical studies (e.g., Titman and Wessels(1988) and Prowse(1990) among others).
The first agency cost of debt measure, AD1 =Market-to-book ratio of equity, measures the firm’s
future growth opportunities. The growth opportunities of the firm can be viewed as a call option held
by the equity holders. As shown in Myers (1977), in the presence of risky debt, these options may
be left unexercised because the valuation gains from their exercise would accrue to the firm’s
bondholders in the form of reduced risk of their claims on the firm. Thus, firms with greater growth
15
19 Alternatively, we have used the R&D intensity of the firm as a measure of potential for debt agencycosts. The results are consistent with the evidence presented here even though the sample size wasconsiderably smaller due to missing observations of R&D expenditures for many firms. R&D intensity is oftenused as a measure of debt agency costs because R&D investments are considered long-term and risky projectsthat are difficult to be monitored by debtholders. Therefore, creditors find it practically impossible to engage intocontracting with equity holders in order to prevent from being exploited by them. Hence, the R&D intensitymeasure captures the firm's range of options for discretionary behavior.
20 This measure has also been used in the corporate diversification literature (see, for example, Lang andStulz(1994) and John and Ofek (1995)
opportunities should be more susceptible to agency costs of debt.19 The second agency cost of debt
measure, AD2 =[(Total Assets)/(Gross Fixed Assets)], measures the firm's non-collateralized
assets. The higher the AD2 ratio the larger the proportion of non-collateralized assets. Since equity
holders find it easier to engage into wealth-transferring actions when the non-collateralized assets
of the firm are of large proportions, this is considered an appropriate measure of debt agency costs.
That is, shareholders are less likely to be motivated by wealth transfer incentives at the expense of
bondholders when more of the firm’s total assets are fixed (i.e., fixed plant and equipment). The third
agency cost of debt measure, AD3 =(Operating Income before Depreciation-Interest Expenses-
Taxes-Dividends)/(Total Assets), represents the liquidity of the firm’s assets. Dividends refer to the
sum of common and preferred stock. In other words, this measure reflects the available free cash
flows that can be manipulated by the shareholders at the expense of debtholders.
To account for the industrial diversification of the firm, we introduce the SEGNUM variable.
The SEGNUM variable represents the firm’s reported number of business segments.20 Since, the
number of business segments proxies for the extent of the firm’s internal capital markets, the sign
and magnitude of the coefficient of the SEGNUM variable will provide evidence on the impact of
internal capital markets on firm’s leverage. If internal capital market efficiencies increase the debt
capacity of the firm (Williamson (1975, 1986), Myers and Majluf (1984), Shleifer and Vishny (1992),
Stein (1997), and Lewellen (1971)), the coefficient of the SEGNUM variable should be positive and
significant. However, if internal capital markets bypass information asymmetry problems associated
16
21 See for example, Warner (1977), Ang, Chua and McConnell (1982), Smith (1977), and Titman and Wessels(1988) among others.
with external capital markets, external financing will be less attractive to firms with internal capital
market advantages and the coefficient of the SEGNUM variable should be negative.
The operating risk variable, OPRISK, measured by the standard deviation of earnings before
interest and taxes (EBIT) divided by sales over the past five years, represents the expected costs
of bankruptcy. It is expected that firms with higher operating risk will have less capacity to sustain
high debt ratios. However, because MNCs have more diversified operations and stable cash flows
than non-MNCs, financial distress should have more pronounced effects on the leverage of
domestic firms than MNCs. Because firms can employ several non-debt tax shields to reduce
taxes, we introduce a non-debt tax shield variable, NDTS=[Operating Income-Interest Expense-
(Total Taxes paid/corporate tax rate)]/Sales, to control for the effects of different tax shields that
tend to reduce the firm's tax burden. A similar non-debt tax shield measure has also been used by
Titman and Wessels (1988) and Prowse (1990). The average corporate tax rate is assumed to be
43% ( i.e., 38% post-1986 federal tax rate, and 5% state tax rate (see Gomi (1986)). The ability of
the firm to use retained earnings over external finance is measured by its past profitability,
PROF=Average (Net Income/Sales), for the past three years. The past profitability measure, is
motivated by the firm’s pecking order preferences for raising capital (Myers and Majluf (1984)).
Since several studies have suggested that leverage is a function of firm size,21 we include
the size variable (SIZE=The book value of the firm’s total assets) in the model to account for
possible size effects on leverage. If larger firms have a greater internal capital markets advantage
than smaller firms, it is expected that they will have more resources available to undertake new
investment projects and, therefore, size should be inversely related with leverage. On the other
hand, size may have a positive effect on leverage because it reduces bankruptcy risk. It should be
noted that all these variables are computed as of the end of each calendar year for the period 1988-
17
22 Denis, Denis and Sarin (1997) provide empirical evidence that value reducing diversification was the outgrowthof agency conflicts between managers and shareholders and that the increased monitoring from the market forcorporate control led to the reversal of the diversification trend in favor of increased corporate focus in the 1980s.
23 See among others Stulz (1988), Kim and Sorensen (1986), Smith and Watts (1992), Lang, Ofek and Stulz (1996),Agrawal and Knoeber (1996).
24 In a cross sectional study Berger, Ofek and Yermack (1997) find that the leverage levels are lower when CEOsare entrenched, i.e. when CEOs do not face intense monitoring from outside shareholders, when their compensationis not tied to performance, or when they already own a large proportion of the outstanding shares.
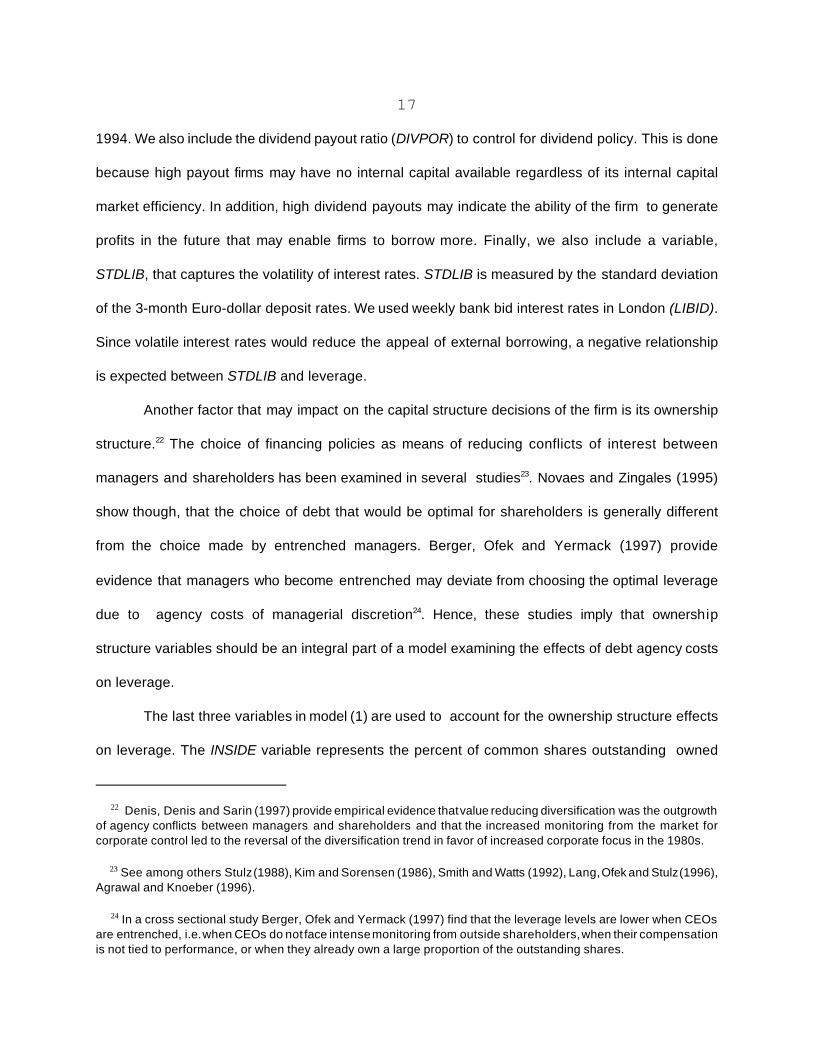
1994. We also include the dividend payout ratio (DIVPOR) to control for dividend policy. This is done
because high payout firms may have no internal capital available regardless of its internal capital
market efficiency. In addition, high dividend payouts may indicate the ability of the firm to generate
profits in the future that may enable firms to borrow more. Finally, we also include a variable,
STDLIB, that captures the volatility of interest rates. STDLIB is measured by the standard deviation
of the 3-month Euro-dollar deposit rates. We used weekly bank bid interest rates in London (LIBID).
Since volatile interest rates would reduce the appeal of external borrowing, a negative relationship
is expected between STDLIB and leverage.
Another factor that may impact on the capital structure decisions of the firm is its ownership
structure.22 The choice of financing policies as means of reducing conflicts of interest between
managers and shareholders has been examined in several studies23. Novaes and Zingales (1995)
show though, that the choice of debt that would be optimal for shareholders is generally different
from the choice made by entrenched managers. Berger, Ofek and Yermack (1997) provide
evidence that managers who become entrenched may deviate from choosing the optimal leverage
due to agency costs of managerial discretion24. Hence, these studies imply that ownership
structure variables should be an integral part of a model examining the effects of debt agency costs
on leverage.
The last three variables in model (1) are used to account for the ownership structure effects
on leverage. The INSIDE variable represents the percent of common shares outstanding owned
18
25 See, for example, O'Brien and Bhushan (1990), Moyer, Chatfield, and Sisneros (1989), Bhushan (1989).
26 Several studies have shown that there is a quadratic relationship between market value and insiders'stakes. See for example, McConnell and Servaes (1990, 1995) where the authors based upon Stulz's arguments(1988) estimate a quadratic regression in which Tobin's q , their measure of firm performance, is the dependentvariable.
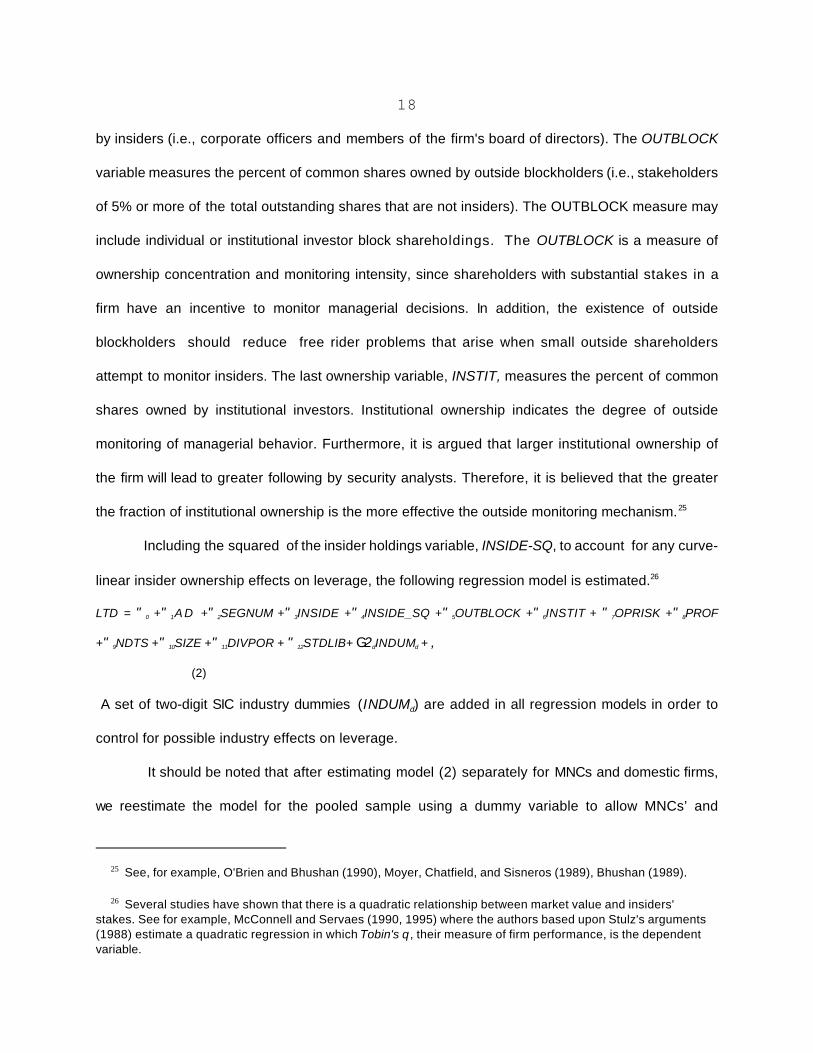
by insiders (i.e., corporate officers and members of the firm's board of directors). The OUTBLOCK
variable measures the percent of common shares owned by outside blockholders (i.e., stakeholders
of 5% or more of the total outstanding shares that are not insiders). The OUTBLOCK measure may
include individual or institutional investor block shareholdings. The OUTBLOCK is a measure of
ownership concentration and monitoring intensity, since shareholders with substantial stakes in a
firm have an incentive to monitor managerial decisions. In addition, the existence of outside
blockholders should reduce free rider problems that arise when small outside shareholders
attempt to monitor insiders. The last ownership variable, INSTIT, measures the percent of common
shares owned by institutional investors. Institutional ownership indicates the degree of outside
monitoring of managerial behavior. Furthermore, it is argued that larger institutional ownership of
the firm will lead to greater following by security analysts. Therefore, it is believed that the greater
the fraction of institutional ownership is the more effective the outside monitoring mechanism.25
Including the squared of the insider holdings variable, INSIDE-SQ, to account for any curve-
linear insider ownership effects on leverage, the following regression model is estimated.26
LTD = "0 +"1A D +"2SEGNUM +"3INSIDE +"4INSIDE_SQ +"5OUTBLOCK +"6INSTIT + "7OPRISK +"8PROF
+"9NDTS +"10SIZE +"11DIVPOR + "12STDLIB+ G2dINDUMd + ,
(2)
A set of two-digit SIC industry dummies (INDUMd) are added in all regression models in order to
control for possible industry effects on leverage.
It should be noted that after estimating model (2) separately for MNCs and domestic firms,
we reestimate the model for the pooled sample using a dummy variable to allow MNCs’ and

19
27 A similar estimation procedure has been used by Prowse(1990) in testing for the differences of theeffects of agency costs on leverage between US and Japanese firms.
domestic firms’ coefficients on each variable to differ.27 The dummy, D, is an indicator variable that
takes the value of one, if the firm is an MNC, and zero if it is a domestic corporation. Specifically,
the indicator variable is used to create interactive variables consisting of the product of each
independent variable, Xi, and D to measure the difference between MNCs and domestic firms on
the coefficients of each independent variable.
The above outlined test procedure involves OLS regressions using the pooled sample of
firms spanning a seven year period. The coefficients of these regressions may suffer from bias due
to autocorrelation of the residuals. The reason for this is that our data set is a panel data set that has
both a time series and a cross section dimension. Thus, it differs from a pooled cross sectional
estimation because for an econometric analysis of panel data one cannot assume that the
observations are independently distributed across time. We therefore perform panel data regression
analysis that accounts for the unobservable firm effect ((i), using the following fixed effects
regression model:
LTD it = $0 +$1ADit + $2(AD*D)it + $3SEGNUMit + $4INSIDEit + $5INSIDE_SQ i t + $6OUTBLOCKit + $7INSTITit +
$8OPRISKit + $9PROFit + $10NDTSit + $11SIZEit + $12DIVPOR it + $13STDLIBit + (i + ,it (3)
where t=1988,...,1994.
This fixed effects regression procedure transforms the data into deviations from individual
means and is appropriate because it does not rely on the assumption that the unobservable firm
effect ((i) is uncorrelated with the observable parameters (i.e., an assumption that underlies the
random effects model). As is shown in the results section the fixed effects regression analysis was
also dictated by the estimation of the Hausman P2-statistic that essentially tests whether the
20
28 As an alternative to the panel data regressions we run OLS regressions on a year-by-year basis. Theresults were qualitatively similar to the ones reported here.
29 The coefficients of the the 2-digit SIC code industry dummies are not shown in the tables, but areavailable upon request.
coefficients of the fixed and random effects regression models are statistically different from each
other.28
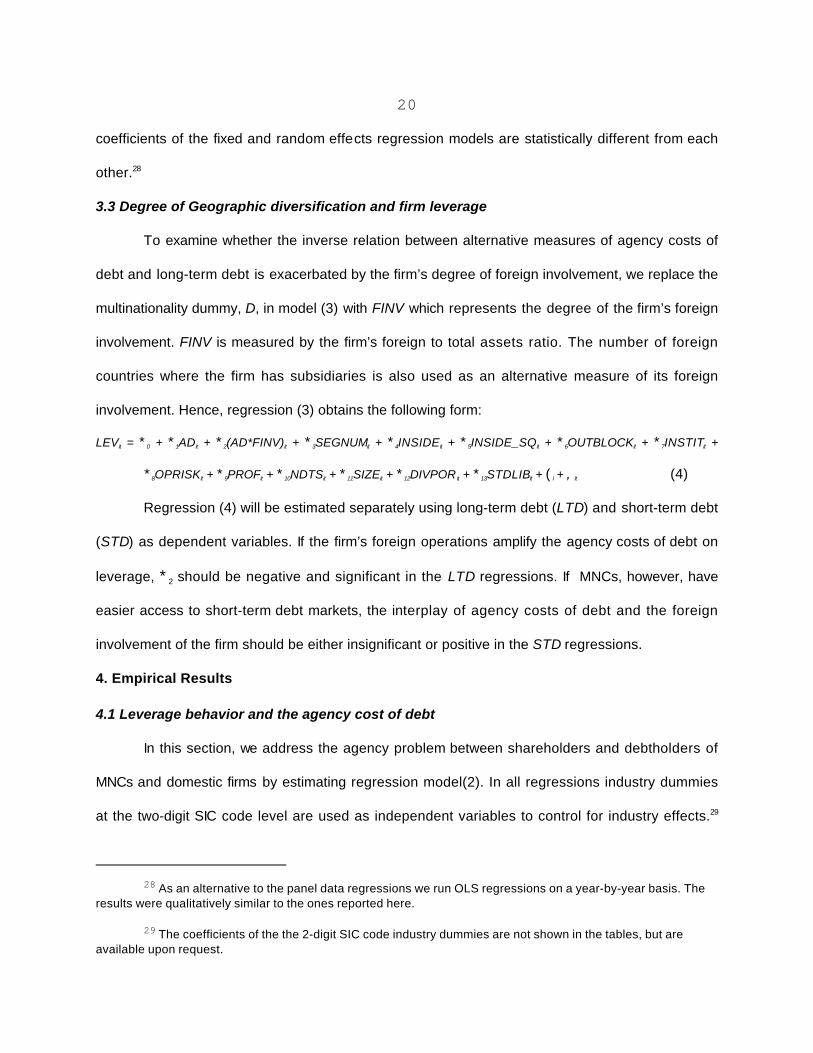
3.3 Degree of Geographic diversification and firm leverage
To examine whether the inverse relation between alternative measures of agency costs of
debt and long-term debt is exacerbated by the firm’s degree of foreign involvement, we replace the
multinationality dummy, D, in model (3) with FINV which represents the degree of the firm’s foreign
involvement. FINV is measured by the firm’s foreign to total assets ratio. The number of foreign
countries where the firm has subsidiaries is also used as an alternative measure of its foreign
involvement. Hence, regression (3) obtains the following form:
LEVit = *0 + *1ADit + *2(AD*FINV)it + *3SEGNUMit + *4INSIDEit + *5INSIDE_SQit + *6OUTBLOCKit + *7INSTITit +
*8OPRISKit + *9PROFit + *10NDTSit + *11SIZEit + *12DIVPOR it + *13STDLIBit + (i + ,it (4)
Regression (4) will be estimated separately using long-term debt (LTD) and short-term debt
(STD) as dependent variables. If the firm’s foreign operations amplify the agency costs of debt on
leverage, *2 should be negative and significant in the LTD regressions. If MNCs, however, have
easier access to short-term debt markets, the interplay of agency costs of debt and the foreign
involvement of the firm should be either insignificant or positive in the STD regressions.
4. Empirical Results
4.1 Leverage behavior and the agency cost of debt
In this section, we address the agency problem between shareholders and debtholders of
MNCs and domestic firms by estimating regression model(2). In all regressions industry dummies
at the two-digit SIC code level are used as independent variables to control for industry effects.29
21
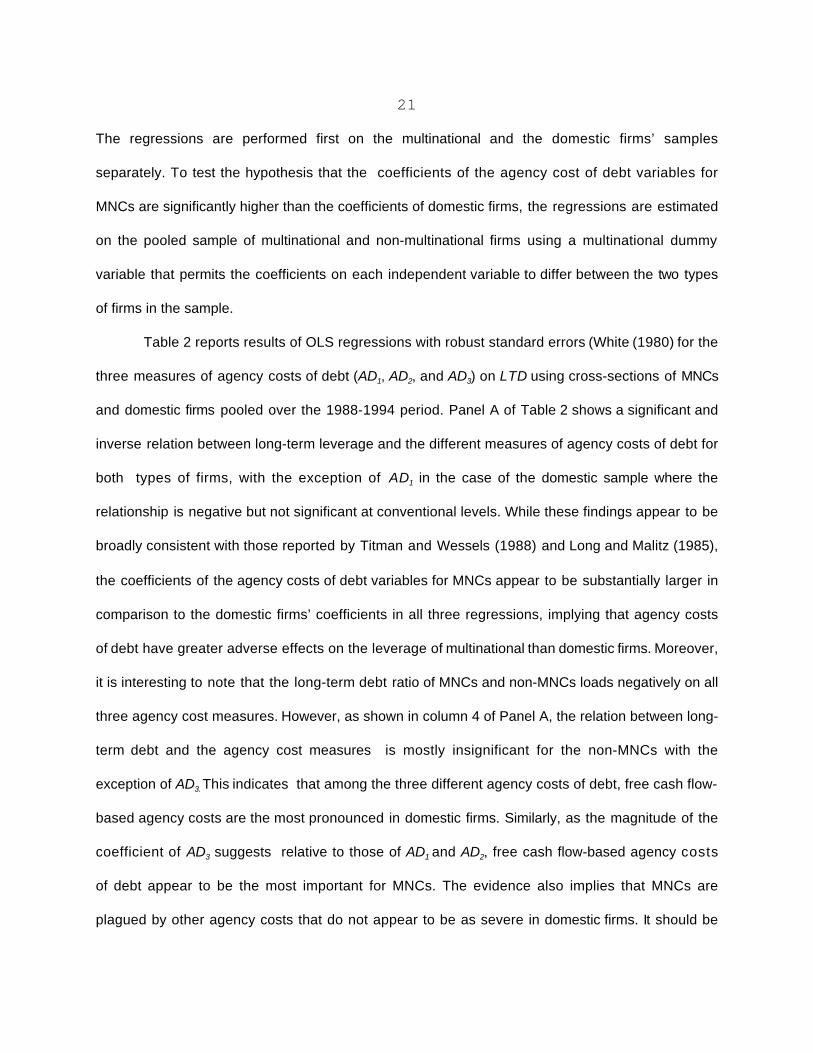
The regressions are performed first on the multinational and the domestic firms’ samples
separately. To test the hypothesis that the coefficients of the agency cost of debt variables for
MNCs are significantly higher than the coefficients of domestic firms, the regressions are estimated
on the pooled sample of multinational and non-multinational firms using a multinational dummy
variable that permits the coefficients on each independent variable to differ between the two types
of firms in the sample.
Table 2 reports results of OLS regressions with robust standard errors (White (1980) for the
three measures of agency costs of debt (AD1, AD2, and AD3) on LTD using cross-sections of MNCs
and domestic firms pooled over the 1988-1994 period. Panel A of Table 2 shows a significant and
inverse relation between long-term leverage and the different measures of agency costs of debt for
both types of firms, with the exception of AD1 in the case of the domestic sample where the
relationship is negative but not significant at conventional levels. While these findings appear to be
broadly consistent with those reported by Titman and Wessels (1988) and Long and Malitz (1985),
the coefficients of the agency costs of debt variables for MNCs appear to be substantially larger in
comparison to the domestic firms’ coefficients in all three regressions, implying that agency costs
of debt have greater adverse effects on the leverage of multinational than domestic firms. Moreover,
it is interesting to note that the long-term debt ratio of MNCs and non-MNCs loads negatively on all
three agency cost measures. However, as shown in column 4 of Panel A, the relation between long-
term debt and the agency cost measures is mostly insignificant for the non-MNCs with the
exception of AD3. This indicates that among the three different agency costs of debt, free cash flow-
based agency costs are the most pronounced in domestic firms. Similarly, as the magnitude of the
coefficient of AD3 suggests relative to those of AD1 and AD2, free cash flow-based agency costs
of debt appear to be the most important for MNCs. The evidence also implies that MNCs are
plagued by other agency costs that do not appear to be as severe in domestic firms. It should be
22
noted, however, that the regression models with all AD measures of agency costs of debt exhibit
multicolinearity among the three AD variables. Therefore, subsequent regression tests are
performed using models with a single AD variable at a time, as in Prowse (1990).
The SEGNUM variable is positively related with the firm’s leverage, indicating that more
(less) diversified firms are likely to have proportionately more (less) long-term debt in their capital
structure. This is consistent with the internal capital markets view which predicts that internal capital
markets tend to increase rather than decrease the external debt capacity of the industrially
diversified firm. The magnitude of the coefficient of the SEGNUM variable suggests that the relation
between internal capital markets and leverage is similar among MNCs and domestic firms. This
evidence suggests that the external debt financing needs of the firm are not mitigated by the
existence of internal capital markets (i.e., internal capital markets do not substitute for external
capital markets). The other control variables have the expected signs for both samples. The
coefficient of OPRISK is negative, however it is significant only for domestic firms, while the PROF
variable exerts a significant negative effect on the firm’s leverage for the MNCs and domestic firms.
The coefficient of the OPRISK variable suggests that financial distress has less dramatic effects
on the leverage of MNCs than non-MNCs. The non-debt tax shield variable is inversely related with
the firm’s leverage while the size variable shows a reliable and positive association with leverage
for both MNCs and domestic firms.
The relationship between long-term debt (LTD) and insider shareholdings (INSIDE) is shown
to be positive for MNCs and negative for domestic firms. This relation, however, is mostly
insignificant at conventional levels. The coefficient of the insider squared variable (INSIDE-SQ) turns
negative near the 40%-50% of insider holdings for MNCs while it is positive and insignificant for
domestic firms. In most cases the insider holdings square coefficients are insignificant and,

23
30 Such a curvilinear relationship would be consistent with Berger, Ofek, and Yermack (1997) whoshowed that managerial entrenchment is inversely related to debt financing.
31 This step requires the assumption that the errors of the MNC and the non-MNC regressions areindependently distributed.
therefore, the evidence does not seem to support a strong curve-linear relation between high levels
of insider holdings and leverage.30
The influence of the outside blockholders (OUTBLOCK) on LTD is positive and significant
in all of six regressions, consistent with the view that blockholders serve a monitoring role (see
Shleifer and Vishny (1986)). The effect of institutional shareholdings on long-term leverage is
negative and significant in all regressions. The negative effect of institutional shareholdings on
leverage is consistent with Pound’s (1988) conflict of interest and strategic alliance hypotheses
which imply that institutional shareholders are inefficient monitors of managerial behavior because
of the lucrative business relations that they maintain with the firms in which they have investment
stakes.
[Insert Table 2 Panel A About Here]
Testing for the hypothesis that the MNC coefficients on the agency costs of debt variables
are significantly larger (in absolute terms) than their domestic counterparts, the three regressions
are estimated on the pooled sample that includes both the MNC and the domestic firms, using a
multinationality dummy variable, D, to allow the coefficients on each independent variable to differ.31
These regressions, presented in Panel B of Table 2, include the same variables as before along
with their interaction terms with the multinationality dummy. The coefficients of the interaction
variables provide a measure of the difference in coefficients between the non-MNC and MNC firms
for each independent variable.
The pattern of these results indicates that the coefficients of the three agency cost variables
are significantly larger in absolute terms for MNCs in comparison to non-MNCs. The coefficients of
24
the interaction variable between the multinationality dummy and the three measures of agency cost
of debt are -0.0072, -0.0051 and -0.2406 with t-values of -2.85, -4.21 and -3.18, respectively. The
significant difference between the coefficients of the agency cost variables for MNCs and non-MNCs
confirms the view that the agency costs of debt are much more severe for MNCs in comparison to
domestic firms. This is reconfirmed, as shown in the last column, when all three interactive
measures of agency costs are included in the regression.
The coefficient of OUTBLOCK’s interactive term suggests that the positive impact of outside
blockholdings on leverage is stronger for non-MNCs in two out of the three models, implying that the
geographic diversity of the firm renders its monitoring more difficult. In addition, the coefficients of
all other independent financial variables’ interactive terms are mostly insignificant, with the exception
of OPRISK and DIVPOR variables, indicating that the impact of most variables on long-term
leverage is similar for MNCs and domestic firms. As expected, the coefficient of the OPRISK
interactive variable is positive and insignificant confirming that financial distress has less dramatic
effects on the leverage of MNCs than non-MNCs.
[Insert Table 2 Panel B About Here]
Our analysis so far provides evidence in support of the view that the agency problem
between shareholders and bondholders is substantially higher for firms with geographically diverse
operations in comparison to firms that are geographically focused. Hence, the geographical
operating diversity of the firm represents an important determinant of the firm’s agency cost of debt.
4.2 A fixed effects regression analysis
It should be noted that the results, reported in Table 2, involve a pooling of the data over the
seven year period of 1988-1994. This estimation procedure may be problematic in the sense that
the correlation of the error terms across years may bias the regression coefficients. Therefore, we
re-estimate model (3) using panel data regression analysis. Fixed effects regression results,
25
32 The high P2-statistic of the Hausman test, reported in table 3, are significant and consistently favoringthe use of the fixed effects model over a random effects model. It should be noted, however that the randomeffects model results are qualitatively similar to the ones presented in Table 3.
reported in Table 3, are quite similar to those of the pooled OLS regressions listed in Table 2. 32 The
coefficients of the agency cost variables (ADj) are negative and significant, as expected, except for
AD1. Furthermore, the interaction coefficients (ADj×D) for all three alternative models (using the
three different ADj measures, one at a time) are negative and significant, indicating that the impact
of the agency costs on leverage is greater (in absolute terms) for MNCs than domestic firms. The
coefficients of the remaining control variables have the hypothesized signs and are mostly
significant with the exception of the INSIDE, OPRISK and PROF variables. Therefore, the results
from the fixed effects-panel data analysis are in conformity with the pooled regression estimations.
[Insert Table 3 About Here]
4.3 Leverage and degree of geographic diversification
We turn to the question of whether the degree of foreign involvement of the firm increases
the negative influence of agency costs of debt on firm leverage. We use the pooled sample of MNCs
and domestic firms and estimate model (4) that includes the interaction term of foreign involvement
with the three measures of agency costs of debt, (ADj×FINV). The fixed effects regressions are
estimated using both long-term debt, LTD, and short-term debt, STD, as dependent variables. Using
one of the three ADj measures for each regression, the results are reported in Table 4.
If international operations exacerbate the agency costs of debt problem we should observe
a significant negative coefficient for the ADj×FINV variable in the LTD regressions and a weaker
negative, or positive coefficient for ADj×FINV variable in the STD regressions. Our results are
consistent with this prediction. The coefficients of the alternative interactive variables have the
predicted negative and significant sign in the LTD regressions and a positive (albeit insignificant in
two out three regressions) sign in the STD regressions. Interestingly, these results imply that

26
33For example only the largest firms are able to issue commercial paper inexpensively, therefore theyhave less costly access to the short term debt market. In addition, due to the ability of larger firms to takeadvantage of scale economies associated with the large fixed component of issuance costs for public debt, largefirms will have better access to long term debt markets. Larger firms tend to be older and more reputable firms(firms with higher credit ratings) which provides them better access to long-term debt markets.
34 Previous studies have found mixed results with regards to the relationship between firm size andleverage. Titman and Wessels (1988) find that short-term debt ratios are negatively related to firm size, whileChung (1993) provides evidence that the long-(short) term debt ratio tends to decrease (increase) with firm size.
increases in foreign involvement exacerbate agency costs of debt that, in turn, increase short-term
leverage but worsen long-term borrowing, consistent with Barclay and Smith (1995) and
Easterwood and Kadapakkam (1994) who show that firms with higher information asymmetries
issue more short-term debt. These results are also in line with the evidence based on univariate
tests, reported in Table 1, showing that, on the average, MNCs display lower long-term debt ratios
and higher short-term debt ratios than domestic firms. The SIZE variable has a positive coefficient
in all LTD and STD regressions. This indicates that larger firms are using more debt financing
consistent with the notion that larger firms have an easier access to debt markets than smaller
firms.33 However, in the LTD regressions the coefficient of the SIZE variable is almost double its
counterpart in the STD regressions, implying that the size effect is much stronger in the case of
long term debt financing.34 The other independent variables in the regressions behave similarly to
those reported in Table 3.
[Insert Table 4 About Here]
4.4 A robustness test: leverage, agency costs and the structure of foreign operations
The previous evidence indicates that agency costs of long-term debt are greater for MNCs
than domestic firms. In addition, this difference seems to arise from the geographic rather than the
industrial diversification dimension of the firm. However, MNCs’ lower long-term leverage could be
attributed to the internal capital markets to fund projects when informational asymmetries render
external financing costly. While our previous analysis controls for the existence of internal capital
27
35 We classified operations in the NAFTA area, the European Union, Western Europe, and advancedAsia (Japan, New Zealand, Australia, Hong Kong, and Singapore) as operations in “Advanced economic regions”.Operations in the rest of the world were classified as operations in “Developing economic regions”. Wedistinguished four such regions Africa, Central & Latin America, Eastern Europe, and Developing Asia. Thus,overall we use a classification of four advanced regions and four developing regions.
markets by including corporate diversification, firm size and the interactive (ADj×FINV) measures
in the regression models, we also consider the effects of the foreign operating structure of the firm
on its leverage. That is, we acknowledge that the foreign involvement variable, FINV, used earlier
may not be an accurate measure of the multinational operating structure of the firm.
We therefore collected information on the firm’s foreign operations for the year 1990. Using
the Directory of International Affiliations we identified the number of countries in which each firm in
our sample had operations, and, then, we classified their operations according to the development
of the country into two regions: advanced and/or developing regions, respectively.35 Therefore,
model (4) is modified as follows:
LTD = *0 + *1AD + *2(AD*NC) + *3SEGNUM + *4INSIDE + *5INSIDE_SQ + *6OUTBLOCK + *7INSTIT + *8OPRISK
+ *9PROF + *10NDTS + *11SIZE + *12DIVPOR + *13REG + G 2dINDUMd + , (5)
where, NC represents the number of foreign countries that a firm has subsidiaries. This is a more
representative measure of the geographic diversity of the firm than the FINV measure (foreign asset
ratio) used before. For example, consider two firms, A and B, that both have a foreign asset ratio
of 50%. Firm A has foreign operations in one country while B has subsidiaries in 10 countries.
Obviously the informational asymmetries would be greater in the case of B. This effect cannot be
captured using the foreign asset ratio as a measure of the geographic operating dispersion of the
firm. We also introduce the REG variable to capture a different aspect of the firm’s geographic
diversity. It measures the number of foreign regions that the firm operates. As indicated in footnote
28, we have considered eight broad geographic regions - four consisting of advanced economies,
and four consisting of developing economies. REG allows us to distinguish between firms that
28
36 For example, compare firm B and C. Both have operations in 10 foreign countries. However, B’ssubsidiaries are all in European Union countries, while C has operations in 3 European Union countries, 4 LatinAmerican countries, one NAFTA country and two African countries. Thus the location of the foreign countries a firmoperates in captures an additional dimension of the firm’s degree of multinationality.
operate in the same number of foreign countries but have different degrees of geographic
concentration across geographic/economic regions around the world.36
If foreign operations across countries enhance the internal capital markets advantage, the
AD×NC variable should exert a positive and significant influence on the long-term leverage of the
firm. That is, a positive coefficient would also imply that the interplay between agency costs of debt
and geographic diversification are offset by the internal capital markets advantages. Alternatively,
if agency costs of debt increase with the firm’s international operations the coefficient of the
interactive term AD×NC should be negative. In addition, consistent with the predictions of the
internal capital markets hypothesis on firm leverage, the coefficient of REG variable should be
negative, indicating that a firm with greater operating geographic diversity would use its internal
capital markets for project financing to avoid costly external financing caused by the informational
asymmetries associated with geographic diversification. If, however, the coefficient of REG variable
is positive, that would be consistent with the alternative view of the internal capital markets
hypothesis which postulates that firms with increased internal capital markets would be less prone
to asymmetric information problems and hence they could sustain higher levels of debt.
Alternatively, a positive relation would be consistent with the notion that firms with internationally
dispersed operations make greater use of the external capital markets because of increased
liquidity, lower rates and currency-risk hedging considerations.
It is expected that firms with greater operating exposure in advanced regions will have
greater access to external capital markets in comparison to firms that do not. We also examine the
effect of the location of the foreign operations on firm leverage, using the following model:

29
37 Demirguc-Kunt and Maksimovic (1999) and Booth, Aivazian, Demirguc-Kunt and Maksimovic (2001)examine whether differences in institutional and legal environments across countries affect the leverage of firms.They find that the institutional and legal characteristics of developing countries influence the finance choices offirms in these countries.
LTD = *0 + *1AD + *2(AD*NC) + *3SEGNUM + *4INSIDE + *5INSIDE_SQ + *6OUTBLOCK + *7INSTIT + *8OPRISK
+ *9PROF + *10NDTS + *11SIZE + *12DIVPOR + *13ADVREG + *14DEVREG + G 2dINDUMd + , (6)
where, ADVREG and DEVREG measure the number of the firm’s foreign operations in advanced
and developing economic regions, respectively. The internal capital markets hypothesis predicts that
*13 and *14 will be negative. A positive *13, would imply that firms with greater operating exposure in
advanced economic regions use external financing due to greater access to developed and more
liquid capital markets. Finally, if *14 is found to be positive, it would suggest that external debt is likely
to be motivated by currency risk considerations. However, a negative *14 could also be attributed to
the legal and institutional characteristics of the host country. This, of course, assumes that MNCs
finance their operations by heavily relying on the host country’s capital markets. Since this is unlikely
to be the case, especially for MNCs operating in developing countries, a negative and significant *14,
is more likely to reflect the effects of internal capital markets on firm leverage.
Table 5 reports estimates of models (5) and (6). The interaction of the number of foreign
countries with the three alternative measures of agency costs of debt has a significant negative
coefficient in all regressions. This result is consistent with the evidence reported in Table 4 which
shows that the agency costs of debt problems are exacerbated by the foreign involvement of the firm,
resulting in lower leverage. Thus, these results provide additional support for the agency costs of
debt hypothesis, but not for the internal capital markets hypothesis. Moreover, the coefficient of REG
variable is positive, albeit insignificant in all regressions. When the REG variable is replaced by
ADVREG and DEVREG variables, the coefficients remain insignificant. This indicates that
geographic diversity does not have an impact on firms’ long term leverage.37 Furthermore, as the
30
coefficients of the DEVREG variable show, the view that external financing is related to firm’s
currency risk considerations is not corroborated by the evidence. Finally, the insignificance of these
two coefficients also suggests that legal and institutional differences across developed and
developing countries have no substantive effects on MNCs’ leverage. This could be mainly because
MNCs are less likely to depend on the capital resources of the host country and, especially, when
they operate in developing countries.
[Insert Table 5 About Here]
5. Conclusion
Specifically, we analyze the effects of the
agency costs of debt on the leverage of 6,951 firm-year observations for multinational and non-
multinational firms over the 1988-1994 period. Furthermore, we investigate the puzzle documented
in the leverage literature that multinational firms have less long-term debt but more short-term debt
than domestic firms.
Univariate tests show that MNCs have, on average, higher short-term debt and lower long-
term debt ratios than domestic firms. The regression models of corporate capital structure show that
alternative measures of the potential conflict between shareholders and debtholders have statistically
significant negative effects on firm leverage for both multinational and non-multinational corporations.
The results, however, also show that the negative effect of agency costs of debt on long-term
leverage is significantly greater for multinational than non-multinational firms, indicating that

multinational firms are subject to greater agency costs of debt than firms without foreign operations.
These results are consistent with the view that multinational corporations are prone to higher agency
costs than domestic firms because their greater geographic diversity renders active monitoring of
managerial decisions more difficult and expensive in comparison to domestic firms. Our results fail
to support the view that MNCs’ lower long-term debt ratios are due to the advantages that internal
capital markets create. We also document that the effects of the agency costs of debt on long-term
leverage are exacerbated by the firm’s degree of foreign involvement. This result is also confirmed
by using alternative measures of foreign involvement.

References
Agrawal, A., and C.R. Knoeber,1996, "Firm performance and mechanisms to control agencyproblems between managers and shareholders", Journal Financial and QuantitativeAnalysis, 31 (3), 377-397, .
Ang, J., J. Chua, and J. McConnell, 1982, The administrative costs of corporate bankruptcy: A note,Journal of Finance, 37 (March), 219-226.
Barclay, Michael J., and Clifford W. Smith, 1995, The maturity structure of corporate debt, Journalof Finance, 50 (2), 609-631.
Berger, Philip G., Eli Ofek, and David L. Yermack, 1997, Managerial entrenchment and capitalstructure decisions, Journal of Finance, 52(4), 1411-1438.
Bhushan, Ravi, 1989, Firm characteristics and analyst following, Journal of Accounting andEconomics, 11, 255-274.
Bodie, Zvi, and Robert A. Taggart, 1978, Future Investment Opportunities and the value of the CallProvision on a Bond, Journal of Finance, 33 (4), 1187-1200.
Bodnar, Gordon., and J.Weintrop,1997, The valuation of the foreign income of U.S. multinationalfirms: A growth opportunities perspective, Journal of Accounting and Economics,24, 69-98.
Booth, Laurence., Varouj Aivazian, Demirguc-Kunt, Asli, and Vojislav Maksimovic, 2001, Capitalstructures in developing countries, Journal of finance, 56,1, 87-130.
Burgman, Todd A., 1996 An empirical examination of multinational corporate capital structure, Journal of International Business Studies, 27 (3), 553-570.
Butler, Kirk C., 1999, Multinational Finance, 2nd edition, South-Western College Publishing,Cincinnati, OH.
Chung, Kee H., 1993, Asset characteristics and corporate debt policy: An empirical test, Journal ofBusiness Finance and Accounting, 20 (1), 83-97.
Comment, Robert, and Gregg A. Jarrell, 1995, Corporate focus and stock returns, Journal ofFinancial Economics, 37, 67-87.
Demirguc-Kunt, Asli, and Vojislav Maksimovic, 1999, Institutions, financial markets, and firm debtmaturity, Journal of Financial Economics, 54, 295-336.
Denis, David J., Diane K. Denis and Atulya Sarin, 1997, Agency problems, equity ownership, andcorporate diversification, Journal of Finance, 52,135-160.
Diamond, Douglas D., 1991, Debt maturity structure and liquidity risk, The Quarterly Journal ofEconomics, August, 105, 709-737.
Doukas, John.,1995, Overinvestment, Tobin’s q and gains from foreign acquisitions, Journal ofBanking & Finance, 19, 1285-1303.

Doukas, J., C. Kim, C. Pantzalis, 2000, Security Analysis, Agency Costs, and CompanyCharacteristcs, Financial Analysts Journal, 56(6),54-63.
Easterwood, John C., and Palani-Rajan Kadapakkam, 1994, Agency conflicts, issue costs, and debtmaturity, Quarterly Journal of Business and Economics, 33 (3), 69-80.
Fatemi, Ali M., 1988, The effect of international diversification on corporate financing policy, Journalof Business Research, 16, 17-30.
Gomi,Yugi, 1986, Guide to Japanese Taxes, Klweer law, The Netherlands.
Hermalin, Benjamin E., and Michael S. Weisbach, 1991, The effects of board composition and directincentives on firm performance, Financial Management, 20 (4), 101-112.
Holderness, Clifford, and Dennis P. Sheehan, 1988, The role of majority shareholders in publicly heldcorporations: an exploratory analysis, Journal of Financial Economics, 20, 317-346.
Houston, J., C. James, and David Markus,1996, Capital market frictions and the role of internal capital markets in banking, Working Paper, University of Florida.
Jensen, Michael C., 1986, Agency costs of free cash flow, corporate finance and takeovers, American Economic Review, 76, 323-329.
John, Kose, and Eli Ofek, 1995, Asset sales and increase in focus, Journal of Financial Economics, 37, 105-126.
Kedia, Simi, and Abon Mozumdar, 1999, Is foreign currency denominated debt a hedginginstrument?, Harvard University and Virginia Tech, Working Paper.
Kim, Wi Saeng, and Eric H. Sorensen, 1986, Evidence on the impact of the agency cost of debt ocorporate debt policy, Journal of Financial and Quantitative Analysis, 21 (2), 131-144.
Kole.S.R ,1994, Managerial ownership and firm performance: incentives or rewards, Working Paper, University of Rochester.
Lang, Larry H.P., Eli Ofek and Rene M. Stulz, 1996, Leverage, investment and firm growth, Journalof Financial Economics, 40, 3-29.
Lang, Larry H.P., and Rene M. Stulz, 1994, Tobin's q corporate diversification and firm performance, Journal of Political Economy, 102, 1248-1280.
Lamont, Owen, 1997, Cash flow and investment: evidence from internal capital markets, Journalof Finance,52, 83-109.
Lee, Kwang Chul and Chuck C.Y. Kwok, 1988, Multinational corporations vs. domestic corporations:International environmental factors and determinants of capital structure, Journal ofInternational Business Studies, 19 (2), 195-217.
Lewellen, Wilbur, 1971, A pure financial rationale for the conglomerate merger, Journal of Finance,26, 521-537.
Lins, K., and H. Servaes, 1999a, International evidence on the value of corporate diversification, Journal of Finance, 54, 2215-2239.
Lins, K., and H. Servaes, 1999b, Is corporate diversification beneficial in emerging markets?,Working Paper, University of North Carolina at Chapel Hill and London Business School.
Long, Michael S., and Ileen B. Malitz, 1985, Investment patterns and financial leverage, in B.Friedman (ed.), Corporate Capital Structure in the United States, Chicago: University of Chicago Press.
Matsusaka. J, and Vikram Nanda, 1997, Internal capital markets and corporate refocusing, WorkingPaper, University of Southern California.
McConnell, John, and Henri Servaes, 1990, Additional evidence on equity ownership and corporatevalue, Journal of Financial Economics, 27, 595-612.
McConnell, John, and Henri Servaes, 1995, Equity ownership and the two faces of debt, Journal ofFinancial Economics, 39, 131-157.
Modigliani, Franco and Merton H. Miller, 1958, The cost of capital, corporation finance, and the theory of investment, American Economic Review, 48, 261-297.
Morck, Randal, Andrei Shleifer, and Robert W. Vishny, 1988, Management ownership and marketvaluation: an empirical analysis, Journal of Financial Economics, 20, 293-316.
Moyer, R.C., R.E. Chatfield, and P.M. Sisneros, 1989, "Security analyst monitoring activity: agencycosts and information demands". Journal of Financial and Quantitative Analysis, 24 (4), 503-512.
Myers, Stewart, 1977, Determinants of Corporate Borrowing, Journal of Financial Economics, 5 (2),147-175.
Myers, Stewart, and Nicholas S. Majluf, 1984, Corporate financing and investment decisions whenfirms have information that investors do not have, Journal of Financial Economics, 13(2),321-333.
Novaes, Walter, and Luigi Zingales, 1995, Capital structure choice when managers are in control:Entrenchment versus efficiency, Unpublished working paper, University of Chicago.
O'Brien, P., and R. Bhushan, 1990, Analyst following and institutional ownership, Journal ofAccounting and Economics, 28 (Supplement), 55-76.
Phelps Katherine L., William T. Moore, and L. Roenfeld ,1991, Equity valuation effects of warrant-debt financing, Journal of Financial Research, 14(2), 93-103.
Pound, J., 1988, Proxy contests and the efficiency of shareholder oversight, Journal of Financial Economics, 20, 237-265.
Prowse, Stephen D., 1990, Institutional investment patterns and corporate financial behavior in the United States and Japan, Journal of Financial Economics, 27, 43-66.

Rajan, Raghuram, Henri Servaes, and Luigi Zingales, 2000, The cost of diversity: The diversificationdiscount and inefficient investment, Journal of Finance 55, 35-80..
Shin Hyun-Han, and Rene and Stulz, 1998, Are internal capital markets efficient?, Quarterly Journalof Economics 113, 531-552.
Shleifer, Andrei, and Robert Vishny, 1986, Large shareholders and corporate control, Journal of Political Economy, 94, 461-488.
Shleifer, Andrei, and Robert Vishny, 1992, Liquidation values and debt capacity: A market equilibriumapproach, Journal of Finance, 45, 379-396.
Scharfstein, David S, 1997, The dark side of internal capital market II, Working Paper, MIT.
Scharfstein, David S, and Jeremy C. Stein, 1997, The dark side of internal capital market: divisional rent seeking and inefficient investments, Working Paper, MIT.
Smith, C., 1977, Alternative methods of raising capital: rights versus underwritten offerings, Journalof Financial Economics, 5 (December), 273-307.
Smith, Clifford W., and Ross Watts, 1992, The investment opportunity set and corporate financing,dividend, and compensation policies, Journal of Financial Economics, 32, 263-292.
Stein, Jeremy C., 1997, Internal capital market and the competition for corporate resources, Journalof Finance, 52, 111-133.
Stulz, Rene M., 1988, Managerial control of voting rights: Financing policies and the market forcorporate control, Journal of Financial Economics, 20 (1/2), 25-54.
Stulz, Rene M., 1990, Managerial Discretion and Optimal Financing Policies, Journal of FinancialEconomics, 26 (1), 3-28.
Thomadakis, Stavros., and Nilufer Usmen,1991, Foreign project financing in segmented capitalmarkets: Equity versus debt, Financial Management, 20 (4), 42-53.
Titman, Sheridan, and Roberto Wessels, 1988, The determinants of capital structure choice, Journalof Finance, 43 (1), 1-19.
Warner, J., 1977, Bankruptcy costs: some evidence, Journal of Finance, 32 (May), 333-347.
White, H., 1980, A heteroscedacity-consistent covariance matrix estimator and a direct testfor heteroscedasticity, Econometrica, 48, 817-838.
Williamson, Oliver E., 1975, Markets and Hierarchies: analysis and antitrust implications, CollierMacMillan Publishers Inc., New York, N.Y.
Williamson, Oliver E., 1986, Economic Organization: Firms, markets and policy control, New YorkUniversity Press, New York, N.Y.
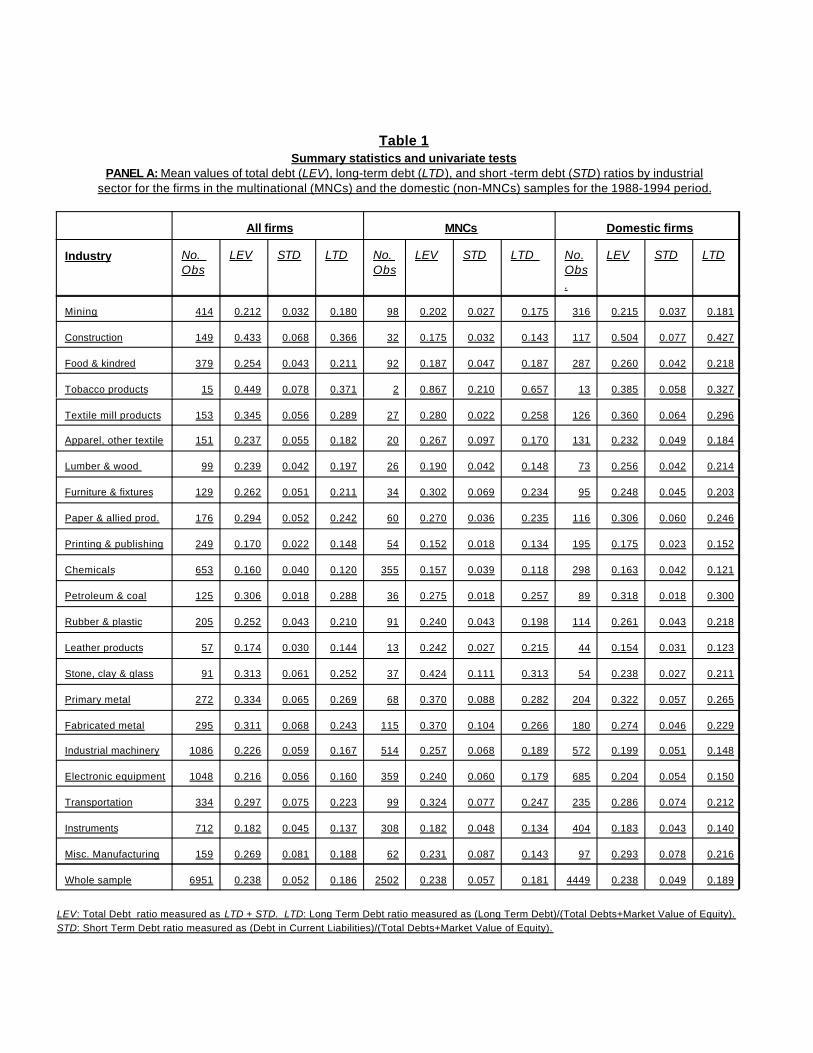
Table 1Summary statistics and univariate tests
PANEL A: Mean values of total debt (LEV), long-term debt (LTD), and short -term debt (STD) ratios by industrialsector for the firms in the multinational (MNCs) and the domestic (non-MNCs) samples for the 1988-1994 period.
All firms MNCs Domestic firms
Industry No. Obs
LEV STD LTD No. Obs
LEV STD LTD No.Obs.
LEV STD LTD
Mining 414 0.212 0.032 0.180 98 0.202 0.027 0.175 316 0.215 0.037 0.181
Construction 149 0.433 0.068 0.366 32 0.175 0.032 0.143 117 0.504 0.077 0.427
Food & kindred 379 0.254 0.043 0.211 92 0.187 0.047 0.187 287 0.260 0.042 0.218
Tobacco products 15 0.449 0.078 0.371 2 0.867 0.210 0.657 13 0.385 0.058 0.327
Textile mill products 153 0.345 0.056 0.289 27 0.280 0.022 0.258 126 0.360 0.064 0.296
Apparel, other textile 151 0.237 0.055 0.182 20 0.267 0.097 0.170 131 0.232 0.049 0.184
Lumber & wood 99 0.239 0.042 0.197 26 0.190 0.042 0.148 73 0.256 0.042 0.214
Furniture & fixtures 129 0.262 0.051 0.211 34 0.302 0.069 0.234 95 0.248 0.045 0.203
Paper & allied prod. 176 0.294 0.052 0.242 60 0.270 0.036 0.235 116 0.306 0.060 0.246
Printing & publishing 249 0.170 0.022 0.148 54 0.152 0.018 0.134 195 0.175 0.023 0.152
Chemicals 653 0.160 0.040 0.120 355 0.157 0.039 0.118 298 0.163 0.042 0.121
Petroleum & coal 125 0.306 0.018 0.288 36 0.275 0.018 0.257 89 0.318 0.018 0.300
Rubber & plastic 205 0.252 0.043 0.210 91 0.240 0.043 0.198 114 0.261 0.043 0.218
Leather products 57 0.174 0.030 0.144 13 0.242 0.027 0.215 44 0.154 0.031 0.123
Stone, clay & glass 91 0.313 0.061 0.252 37 0.424 0.111 0.313 54 0.238 0.027 0.211
Primary metal 272 0.334 0.065 0.269 68 0.370 0.088 0.282 204 0.322 0.057 0.265
Fabricated metal 295 0.311 0.068 0.243 115 0.370 0.104 0.266 180 0.274 0.046 0.229
Industrial machinery 1086 0.226 0.059 0.167 514 0.257 0.068 0.189 572 0.199 0.051 0.148
Electronic equipment 1048 0.216 0.056 0.160 359 0.240 0.060 0.179 685 0.204 0.054 0.150
Transportation 334 0.297 0.075 0.223 99 0.324 0.077 0.247 235 0.286 0.074 0.212
Instruments 712 0.182 0.045 0.137 308 0.182 0.048 0.134 404 0.183 0.043 0.140
Misc. Manufacturing 159 0.269 0.081 0.188 62 0.231 0.087 0.143 97 0.293 0.078 0.216
Whole sample 6951 0.238 0.052 0.186 2502 0.238 0.057 0.181 4449 0.238 0.049 0.189
LEV: Total Debt ratio measured as LTD + STD. LTD: Long Term Debt ratio measured as (Long Term Debt)/(Total Debts+Market Value of Equity).STD: Short Term Debt ratio measured as (Debt in Current Liabilities)/(Total Debts+Market Value of Equity).

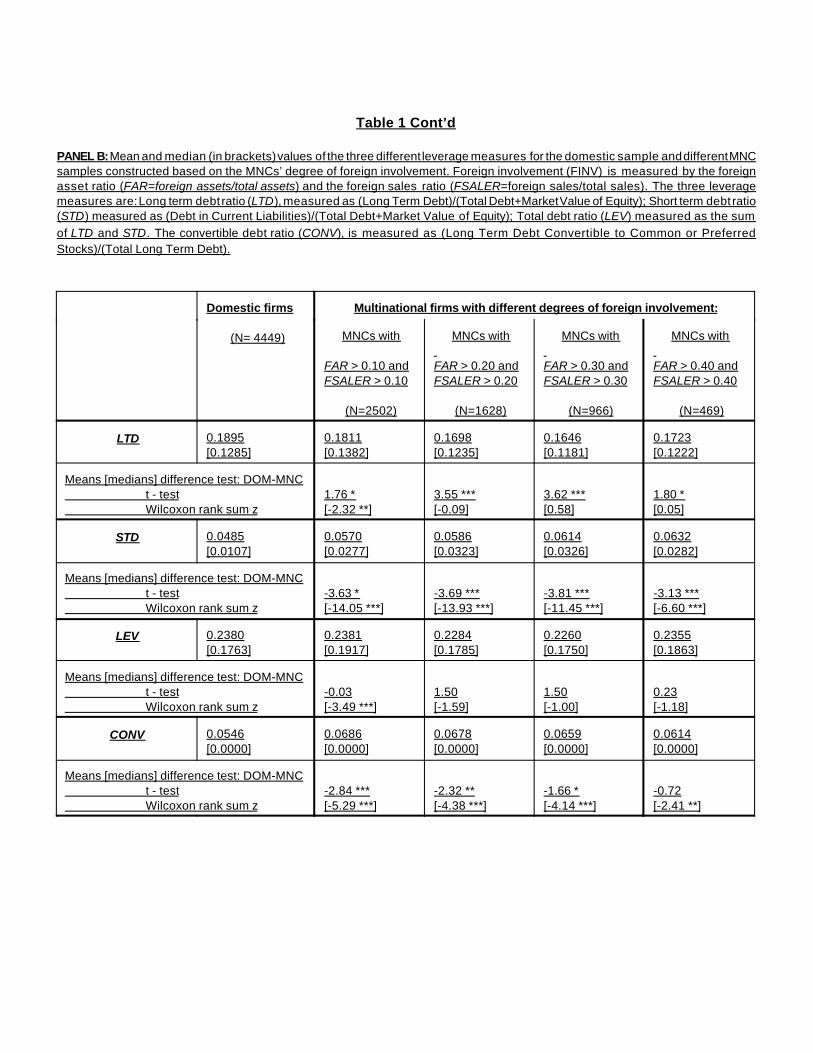
Table 1 Cont’d
PANEL B: Mean and median (in brackets) values of the three different leverage measures for the domestic sample and different MNCsamples constructed based on the MNCs’ degree of foreign involvement. Foreign involvement (FINV) is measured by the foreignasset ratio (FAR=foreign assets/total assets) and the foreign sales ratio (FSALER=foreign sales/total sales). The three leveragemeasures are: Long term debt ratio (LTD), measured as (Long Term Debt)/(Total Debt+Market Value of Equity); Short term debt ratio(STD) measured as (Debt in Current Liabilities)/(Total Debt+Market Value of Equity); Total debt ratio (LEV) measured as the sumof LTD and STD. The convertible debt ratio (CONV), is measured as (Long Term Debt Convertible to Common or PreferredStocks)/(Total Long Term Debt).
Domestic firms
(N= 4449)
Multinational firms with different degrees of foreign involvement:
MNCs with
FAR > 0.10 andFSALER > 0.10
(N=2502)
MNCs with FAR > 0.20 andFSALER > 0.20
(N=1628)
MNCs with FAR > 0.30 andFSALER > 0.30
(N=966)
MNCs with FAR > 0.40 andFSALER > 0.40
(N=469)
LTD 0.1895[0.1285]
0.1811[0.1382]
0.1698[0.1235]
0.1646[0.1181]
0.1723[0.1222]
Means [medians] difference test: DOM-MNC t - test Wilcoxon rank sum z
1.76 *[-2.32 **]
3.55 ***[-0.09]
3.62 ***[0.58]
1.80 *[0.05]
STD 0.0485[0.0107]
0.0570[0.0277]
0.0586[0.0323]
0.0614[0.0326]
0.0632[0.0282]
Means [medians] difference test: DOM-MNC t - test Wilcoxon rank sum z
-3.63 *[-14.05 ***]
-3.69 ***[-13.93 ***]
-3.81 ***[-11.45 ***]
-3.13 ***[-6.60 ***]
LEV 0.2380[0.1763]
0.2381[0.1917]
0.2284[0.1785]
0.2260[0.1750]
0.2355[0.1863]
Means [medians] difference test: DOM-MNC t - test Wilcoxon rank sum z
-0.03[-3.49 ***]
1.50[-1.59]
1.50[-1.00]
0.23[-1.18]
CONV 0.0546[0.0000]
0.0686[0.0000]
0.0678[0.0000]
0.0659[0.0000]
0.0614[0.0000]
Means [medians] difference test: DOM-MNC t - test Wilcoxon rank sum z
-2.84 ***[-5.29 ***]
-2.32 **[-4.38 ***]
-1.66 *[-4.14 ***]
-0.72[-2.41 **]
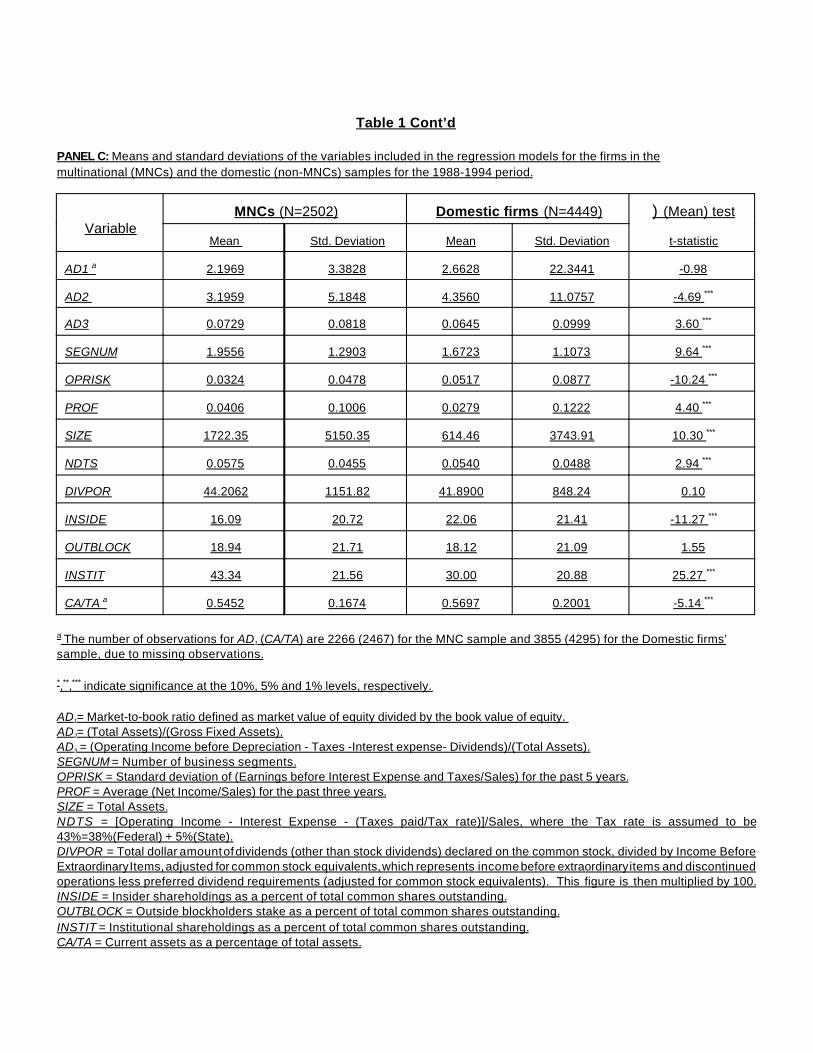
Table 1 Cont’d
PANEL C: Means and standard deviations of the variables included in the regression models for the firms in themultinational (MNCs) and the domestic (non-MNCs) samples for the 1988-1994 period.
VariableMNCs (N=2502) Domestic firms (N=4449) )(Mean) test
Mean Std. Deviation Mean Std. Deviation t-statistic
AD1 a 2.1969 3.3828 2.6628 22.3441 -0.98
AD2 3.1959 5.1848 4.3560 11.0757 -4.69 ***
AD3 0.0729 0.0818 0.0645 0.0999 3.60 ***
SEGNUM 1.9556 1.2903 1.6723 1.1073 9.64 ***
OPRISK 0.0324 0.0478 0.0517 0.0877 -10.24 ***
PROF 0.0406 0.1006 0.0279 0.1222 4.40 ***
SIZE 1722.35 5150.35 614.46 3743.91 10.30 ***
NDTS 0.0575 0.0455 0.0540 0.0488 2.94 ***
DIVPOR 44.2062 1151.82 41.8900 848.24 0.10
INSIDE 16.09 20.72 22.06 21.41 -11.27 ***
OUTBLOCK 18.94 21.71 18.12 21.09 1.55
INSTIT 43.34 21.56 30.00 20.88 25.27 ***
CA/TA a 0.5452 0.1674 0.5697 0.2001 -5.14 ***
a The number of observations for AD1 (CA/TA) are 2266 (2467) for the MNC sample and 3855 (4295) for the Domestic firms’sample, due to missing observations.
*,**,*** indicate significance at the 10%, 5% and 1% levels, respectively.
AD1= Market-to-book ratio defined as market value of equity divided by the book value of equity. AD2= (Total Assets)/(Gross Fixed Assets).AD3 = (Operating Income before Depreciation - Taxes -Interest expense- Dividends)/(Total Assets).SEGNUM = Number of business segments.OPRISK = Standard deviation of (Earnings before Interest Expense and Taxes/Sales) for the past 5 years.PROF = Average (Net Income/Sales) for the past three years.SIZE = Total Assets.NDTS = [Operating Income - Interest Expense - (Taxes paid/Tax rate)]/Sales, where the Tax rate is assumed to be43%=38%(Federal) + 5%(State).DIVPOR = Total dollar amount of dividends (other than stock dividends) declared on the common stock, divided by Income BeforeExtraordinary Items, adjusted for common stock equivalents, which represents income before extraordinary items and discontinuedoperations less preferred dividend requirements (adjusted for common stock equivalents). This figure is then multiplied by 100.INSIDE = Insider shareholdings as a percent of total common shares outstanding.OUTBLOCK = Outside blockholders stake as a percent of total common shares outstanding.INSTIT = Institutional shareholdings as a percent of total common shares outstanding.CA/TA = Current assets as a percentage of total assets.
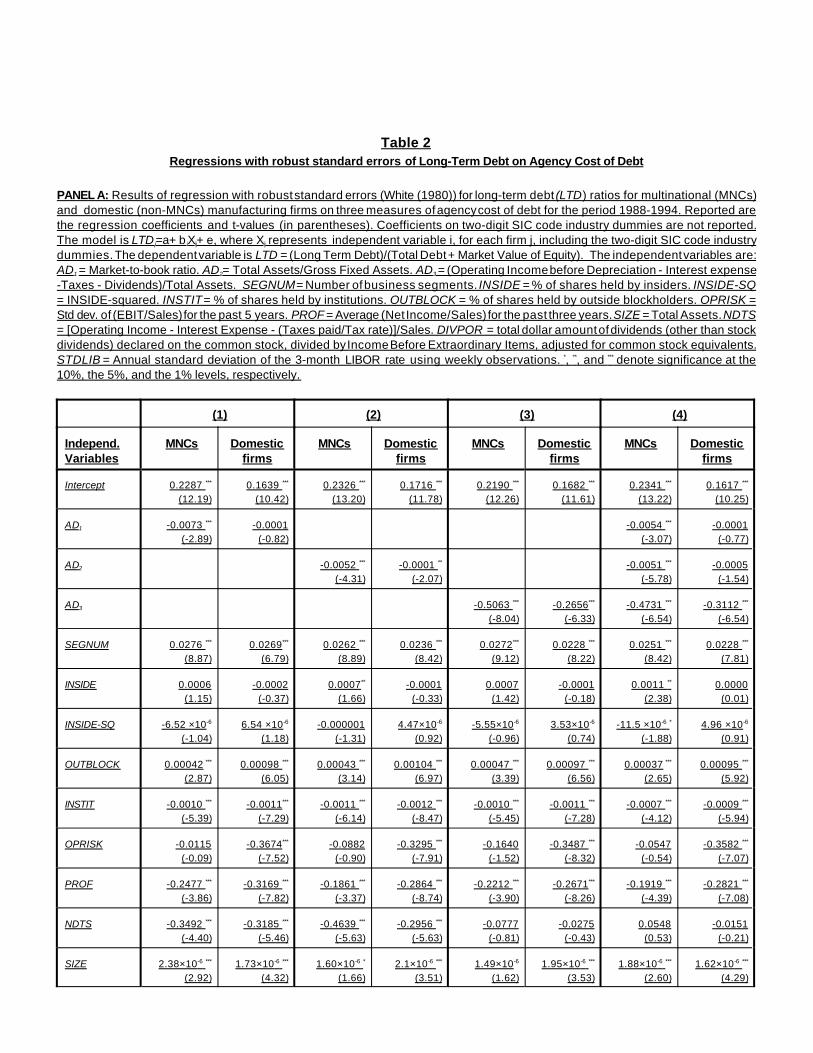
Table 2Regressions with robust standard errors of Long-Term Debt on Agency Cost of Debt
PANEL A: Results of regression with robust standard errors (White (1980)) for long-term debt (LTD) ratios for multinational (MNCs)and domestic (non-MNCs) manufacturing firms on three measures of agency cost of debt for the period 1988-1994. Reported arethe regression coefficients and t-values (in parentheses). Coefficients on two-digit SIC code industry dummies are not reported.The model is LTD j=a+ b iXij+ e, where Xij represents independent variable i, for each firm j, including the two-digit SIC code industrydummies. The dependent variable is LTD = (Long Term Debt)/(Total Debt + Market Value of Equity). The independent variables are:AD1 = Market-to-book ratio. AD2= Total Assets/Gross Fixed Assets. AD3 = (Operating Income before Depreciation - Interest expense-Taxes - Dividends)/Total Assets. SEGNUM = Number of business segments. INSIDE = % of shares held by insiders. INSIDE-SQ= INSIDE-squared. INSTIT = % of shares held by institutions. OUTBLOCK = % of shares held by outside blockholders. OPRISK =Std dev. of (EBIT/Sales) for the past 5 years. PROF = Average (Net Income/Sales) for the past three years. SIZE = Total Assets. NDTS= [Operating Income - Interest Expense - (Taxes paid/Tax rate)]/Sales. DIVPOR = total dollar amount of dividends (other than stockdividends) declared on the common stock, divided by Income Before Extraordinary Items, adjusted for common stock equivalents.STDLIB = Annual standard deviation of the 3-month LIBOR rate using weekly observations. *, **, and *** denote significance at the10%, the 5%, and the 1% levels, respectively.
(1) (2) (3) (4)
Independ.Variables
MNCs Domesticfirms
MNCs Domesticfirms
MNCs Domesticfirms
MNCs Domesticfirms
Intercept 0.2287 ***
(12.19)0.1639 ***
(10.42)0.2326 ***
(13.20)0.1716 ***
(11.78)0.2190 ***
(12.26)0.1682 ***
(11.61)0.2341 ***
(13.22)0.1617 ***
(10.25)
AD1 -0.0073 ***
(-2.89)-0.0001
(-0.82)-0.0054 ***
(-3.07)-0.0001
(-0.77)
AD2 -0.0052 ***
(-4.31)-0.0001 **
(-2.07)-0.0051 ***
(-5.78)-0.0005
(-1.54)
AD3 -0.5063 ***
(-8.04)-0.2656***
(-6.33)-0.4731 ***
(-6.54)-0.3112 ***
(-6.54)
SEGNUM 0.0276 ***
(8.87)0.0269***
(6.79)0.0262 ***
(8.89)0.0236 ***
(8.42)0.0272***
(9.12)0.0228 ***
(8.22)0.0251 ***
(8.42)0.0228 ***
(7.81)
INSIDE 0.0006(1.15)
-0.0002(-0.37)
0.0007**
(1.66)-0.0001
(-0.33)0.0007
(1.42)-0.0001
(-0.18)0.0011 **
(2.38)0.0000
(0.01)
INSIDE-SQ -6.52 ×10⁻⁶
(-1.04)6.54 ×10⁻⁶
(1.18)-0.000001
(-1.31)4.47×10⁻⁶
(0.92)-5.55×10⁻⁶
(-0.96)3.53×10⁻⁶
(0.74)-11.5 ×10⁻⁶ *
(-1.88)4.96 ×10⁻⁶
(0.91)
OUTBLOCK 0.00042 ***
(2.87)0.00098 ***
(6.05)0.00043 ***
(3.14)0.00104 ***
(6.97)0.00047 ***
(3.39)0.00097 ***
(6.56)0.00037 ***
(2.65)0.00095 ***
(5.92)
INSTIT -0.0010 ***
(-5.39)-0.0011***
(-7.29)-0.0011 ***
(-6.14)-0.0012 ***
(-8.47)-0.0010 ***
(-5.45)-0.0011 ***
(-7.28)-0.0007 ***
(-4.12)-0.0009 ***
(-5.94)
OPRISK -0.0115(-0.09)
-0.3674***
(-7.52)-0.0882
(-0.90)-0.3295 ***
(-7.91)-0.1640
(-1.52)-0.3487 ***
(-8.32)-0.0547
(-0.54)-0.3582 ***
(-7.07)
PROF -0.2477 ***
(-3.86)-0.3169 ***
(-7.82)-0.1861 ***
(-3.37)-0.2864 ***
(-8.74)-0.2212 ***
(-3.90)-0.2671***
(-8.26)-0.1919 ***
(-4.39)-0.2821 ***
(-7.08)
NDTS -0.3492 ***
(-4.40)-0.3185 ***
(-5.46)-0.4639 ***
(-5.63)-0.2956 ***
(-5.63)-0.0777
(-0.81)-0.0275
(-0.43)0.0548
(0.53)-0.0151
(-0.21)
SIZE 2.38×10⁻⁶ ***
(2.92)1.73×10⁻⁶ ***
(4.32)1.60×10-6 *
(1.66)2.1×10⁻⁶ ***
(3.51)1.49×10⁻⁶
(1.62)1.95×10⁻⁶ ***
(3.53)1.88×10⁻⁶ ***
(2.60)1.62×10⁻⁶ ***
(4.29)

DIVPOR 8.87×10⁻⁶ ***
(3.73)2.11×10⁻⁶
(0.66)8.89×10⁻⁶ ***
(3.48)1.65×10⁻⁶
(0.53)2.44×10-6 *
(1.87)0.56×10⁻⁶
(0.18)2.95×10⁻⁶ **
(2.16)0.74×10⁻⁶
(0.22)
STDLIB -0.0207 **
(-2.00)0.0020
(0.21)-0.0171 *
(-1.74)0.0011
(0.13)-0.0124
(-1.26)0.0039
(0.45)-0.0159
(-1.58)0.0034
(0.37)
Industrydummies
YES YES YES YES YES YES YES YES
Adjusted R2
F-valueN
0.224416.342266
0.165320.273855
0.223217.482502
0.171525.464449
0.225022.732502
0.183327.344449
0.277422.952266
0.182522.503855
Table 2 Cont’d
PANEL B: Results of regression with robust standard errors (White (1980)) for long-term debt (LTD) ratios for multinational (MNCs)and domestic (non-MNCs) manufacturing firms on three measures of agency cost of debt, and on the common equity ownershipstructure variables for the period 1988-1994 using a multinationality dummy (D) to allow MNC and non-MNC coefficients on eachvariable to differ. Reported are the direct estimates of the difference between the non-MNC and MNC coefficients on eachindependent variable. t-values are reported in parentheses. Coefficients on the non-MNC independent variables, the two-digit SICcode industry dummies, and the intercept term are not reported. The model is LTD j=anon-MNC+a Dj+biXij+bi DjXij +e, where Xij
represents independent variable I, for each firm j, including the two-digit SIC code industry dummies. The dependent variable is LTD= (Long Term Debt)/(Total Debt + Market Value of Equity). The independent variables are: AD1 =Market-to-book ratio. AD2= TotalAssets/Gross Fixed Assets. AD3 = (Operating Income before Depreciation - Interest expense -Taxes - Dividends)/Total Assets.SEGNUM = Number of business segments. INSIDE = % of shares held by insiders. INSIDE-SQ = INSIDE-squared. INSTIT = %of shares held by institutions. OUTBLOCK = % of shares held by outside blockholders. OPRISK = Std dev. of (EBIT/Sales) for thepast 5 years. PROF = Average (Net Income/Sales) for the past three years. SIZE = Total Assets. NDTS = [Operating Income - InterestExpense - (Taxes paid/Tax rate)]/Sales. DIVPOR = total dollar amount of dividends (other than stock dividends) declared on thecommon stock, divided by Income Before Extraordinary Items, adjusted for common stock equivalents. STDLIB = Annual standarddeviation of the 3-month LIBOR rate using weekly observations. *, **, *** denote significance at the 10%, 5%, and 1% levels ,respectively.
IndependentVariables
(1) (2) (3) (4)
AD1×D -0.0072 ***
(-2.85)-0.0053 ***
(-3.00)
AD2×D -0.0051 ***
(-4.21)-0.0046 ***
(-4.90)
AD3×D -0.2406 ***
(-3.18)-0.1619 *
(-1.87)
SEGNUM×D -0.0033(-0.63)
0.0026(0.64)
0.0044(1.07)
-0.0033(-0.63)
INSIDE×D 0.0008(1.11)
0.0008(1.36)
0.0007(1.20)
0.0011 *
(1.76)
INSIDE-SQ×D -13.1×10⁻⁶
(-1.55)-0.000012
(-1.60)-0.000009
(-1.21)-16.4×10⁻⁶ **
(-2.01)
OUTBLOCK×D -0.00057 **
(-2.61)-0.00061 ***
(-2.98)-0.00050 **
(-2.48)-0.00058 **
(-2.72)
INSTIT×D 0.0001(0.33)
0.0001(0.57)
0.0001(0.31)
0.0002(0.67)
OPRISK×D 0.3559 ***
(2.69)0.2413 **
(1.98)0.1847(1.60)
0.3035 ***
(2.31)
PROF×D 0.0692(0.91)
0.1004(1.56)
0.0459(0.70)
0.0902(1.52)

NDTS×D -0.0307(-0.31)
-0.1683 *
(-1.72)0.1052(0.91)
0.0699(0.55)
SIZE×D 0.65×10⁻⁶
(0.72)-4.73×10⁻⁶
(-0.42)-4.56×10⁻⁶
(-0.42)0.26×10⁻⁶
(0.31)
DIVPOR×D -6.76×10⁻⁶ *
(-1.70)7.24×10-6 *
(1.80)1.88×10⁻⁶
(0.54)2.20×10⁻⁶
(0.61)
STDLIB×D -0.0227(-1.63)
-0.0182(-1.38)
-0.0163(-1.24)
-0.0194(-1.42)
Adjusted R 2
F-valueN
0.183618.096121
0.187121.216951
0.196024.776951
0.211922.47612
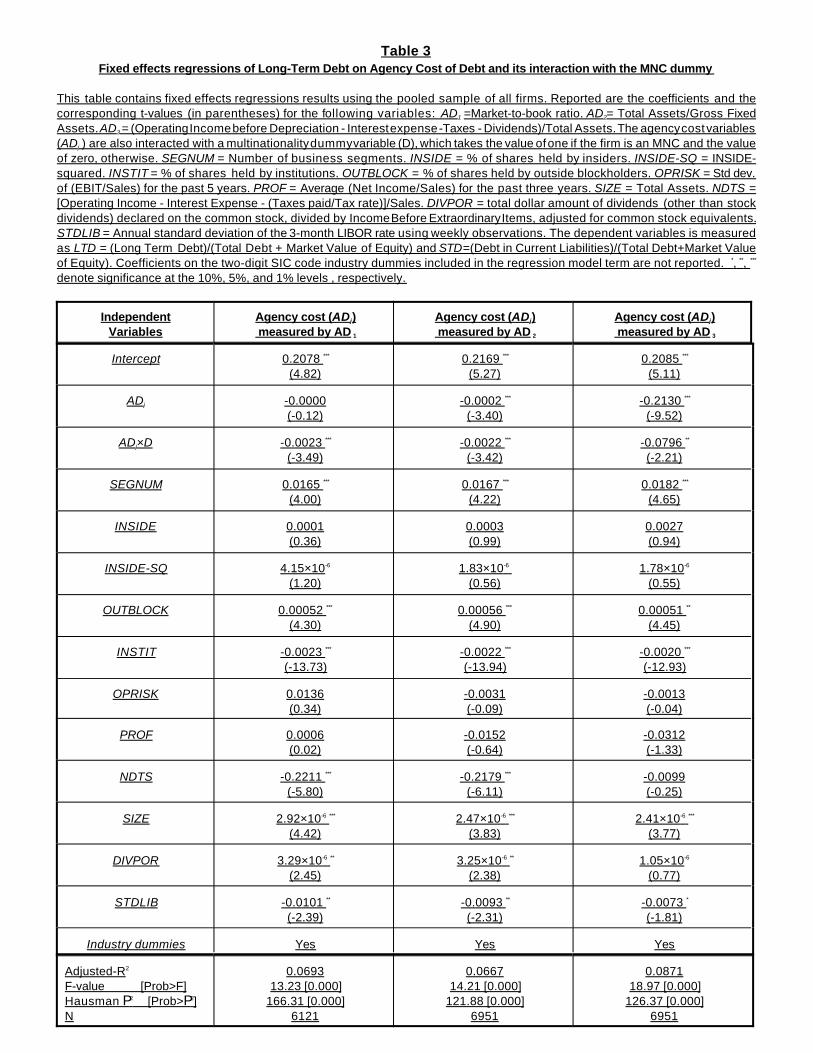
Table 3Fixed effects regressions of Long-Term Debt on Agency Cost of Debt and its interaction with the MNC dummy
This table contains fixed effects regressions results using the pooled sample of all firms. Reported are the coefficients and thecorresponding t-values (in parentheses) for the following variables: AD1 =Market-to-book ratio. AD2= Total Assets/Gross FixedAssets. AD3 = (Operating Income before Depreciation - Interest expense -Taxes - Dividends)/Total Assets. The agency cost variables(ADj ) are also interacted with a multinationality dummy variable (D), which takes the value of one if the firm is an MNC and the valueof zero, otherwise. SEGNUM = Number of business segments. INSIDE = % of shares held by insiders. INSIDE-SQ = INSIDE-squared. INSTIT = % of shares held by institutions. OUTBLOCK = % of shares held by outside blockholders. OPRISK = Std dev.of (EBIT/Sales) for the past 5 years. PROF = Average (Net Income/Sales) for the past three years. SIZE = Total Assets. NDTS =[Operating Income - Interest Expense - (Taxes paid/Tax rate)]/Sales. DIVPOR = total dollar amount of dividends (other than stockdividends) declared on the common stock, divided by Income Before Extraordinary Items, adjusted for common stock equivalents.STDLIB = Annual standard deviation of the 3-month LIBOR rate using weekly observations. The dependent variables is measuredas LTD = (Long Term Debt)/(Total Debt + Market Value of Equity) and STD=(Debt in Current Liabilities)/(Total Debt+Market Valueof Equity). Coefficients on the two-digit SIC code industry dummies included in the regression model term are not reported. *, **, ***
denote significance at the 10%, 5%, and 1% levels , respectively.
IndependentVariables
Agency cost (ADj) measured by AD 1
Agency cost (ADj) measured by AD 2
Agency cost (ADj) measured by AD 3
Intercept 0.2078 ***
(4.82)0.2169 ***
(5.27)0.2085 ***
(5.11)
ADj -0.0000(-0.12)
-0.0002 ***
(-3.40)-0.2130 ***
(-9.52)
ADj×D -0.0023 ***
(-3.49)-0.0022 ***
(-3.42)-0.0796 **
(-2.21)
SEGNUM 0.0165 ***
(4.00)0.0167 ***
(4.22)0.0182 ***
(4.65)
INSIDE 0.0001(0.36)
0.0003(0.99)
0.0027(0.94)
INSIDE-SQ 4.15×10⁻⁶
(1.20)1.83×10⁻⁶
(0.56)1.78×10⁻⁶
(0.55)
OUTBLOCK 0.00052 ***
(4.30)0.00056 ***
(4.90)0.00051 **
(4.45)
INSTIT -0.0023 ***
(-13.73)-0.0022 ***
(-13.94)-0.0020 ***
(-12.93)
OPRISK 0.0136(0.34)
-0.0031(-0.09)
-0.0013(-0.04)
PROF 0.0006(0.02)
-0.0152(-0.64)
-0.0312(-1.33)
NDTS -0.2211 ***
(-5.80)-0.2179 ***
(-6.11)-0.0099(-0.25)
SIZE 2.92×10⁻⁶ ***
(4.42)2.47×10⁻⁶ ***
(3.83)2.41×10⁻⁶ ***
(3.77)
DIVPOR 3.29×10⁻⁶ **
(2.45)3.25×10⁻⁶ **
(2.38)1.05×10⁻⁶
(0.77)
STDLIB -0.0101 **
(-2.39)-0.0093 **
(-2.31)-0.0073 *
(-1.81)
Industry dummies Yes Yes Yes
Adjusted-R2
F-value [Prob>F]Hausman P2 [Prob>P2]N
0.069313.23 [0.000]
166.31 [0.000]6121
0.066714.21 [0.000]
121.88 [0.000]6951
0.087118.97 [0.000]
126.37 [0.000]6951

Table 4Fixed effects regressions of Long-Term and Short-Term Debt on Agency Cost of Debt measures and their
interaction with the degree of foreign involvement
This table contains fixed effects regressions results using the pooled sample of all firms. Reported are the coefficients and thecorresponding t-values (in parentheses) for the following variables: AD1 =Market-to-book ratio. AD2= Total Assets/Gross FixedAssets. AD3 = (Operating Income before Depreciation - Interest expense -Taxes - Dividends)/Total Assets. The agency cost variables(ADj ) are also interacted with the degree of foreign involvement (FINV) which is measured by the ratio of foreign assets over totalassets. SEGNUM = Number of business segments. INSIDE = % of shares held by insiders. INSIDE-SQ = INSIDE-squared. INSTIT= % of shares held by institutions. OUTBLOCK = % of shares held by outside blockholders. OPRISK = Std dev. of (EBIT/Sales) forthe past 5 years. PROF = Average (Net Income/Sales) for the past three years. SIZE = Total Assets. NDTS = [Operating Income -Interest Expense - (Taxes paid/Tax rate)]/Sales. DIVPOR = total dollar amount of dividends (other than stock dividends) declaredon the common stock, divided by Income Before Extraordinary Items - Adjusted For Common Stock Equivalents. STDLIB = Annualstandard deviation of the 3-month LIBOR rate using weekly observations. The dependent variables is measured as LTD = (LongTerm Debt)/(Total Debt + Market Value of Equity) and STD=(Debt in Current Liabilities)/(Total Debt+Market Value of Equity).Coefficients on the two-digit SIC code industry dummies included in the regression model term are not reported. *, **, *** denotesignificance at the 10%, 5%, and 1% levels , respectively.
IndependentVariable
Agency cost (ADi) measured by AD 1
Agency cost (ADi)measured by AD 2
Agency cost (ADi) measured by AD 3
Dependent variable Dependent variable Dependent variable
LTD STD LTD STD LTD STD
Intercept 0.2059 ***
(4.78)0.1038 ***
(3.29)0.2170 ***
(5.27)0.0915***
(3.23)0.2089 ***
(5.12)0.0885 ***
(3.14)
ADi -0.0000(-0.11)
-0.0001*
(-1.67)-0.0002 ***
(-3.38)-0.00003(-1.03)
-0.2087 ***
(-9.69)-0.1031***
(-6.94)
ADi×FINV -0.0068***
(-4.19)0.0022 *
(1.83)-0.0101***
(-5.04)0.0019(1.38)
-0.2856 ***
(-3.27)0.0227(0.38)
SEGNUM 0.0170 ***
(4.14)0.0048(1.60)
0.0168 ***
(4.24)0.0042(1.54)
0.0180 ***
(4.59)0.0049 *
(1.80)
INSIDE 0.00013(0.43)
-0.0003(-0.19)
0.00028(0.98)
-0.00024(-1.19)
0.00027(0.94)
-0.00025(-1.30)
INSIDE-SQ 3.94×10⁻⁶
(1.14)2.72×10⁻⁶ (1.07)
1.92×10⁻⁶ (0.59)
2.19×10⁻⁶ (0.97)
1.78×10⁻⁶ (0.55)
2.31×10⁻⁶ (1.04)
OUTBLOCK 0.0005 ***
(4.35)-0.0000(-0.45)
0.0006 ***
(4.94)-0.0000(-0.44)
0.0005 ***
(4.48)-0.0001(-0.73)
INSTIT -0.0023***
(-13.59)-0.0012 ***
(-9.96)-0.0022 ***
(-13.82)-0.0011***
(-9.98)-0.0020 ***
(-12.94)-0.0010 ***
(-9.08)
OPRISK 0.0141(0.36)
0.0835 ***
(2.92)-0.0019(-0.05)
0.0713 ***
(2.91)-0.0044(-0.12)
0.0705 ***
(2.89)
PROF 0.0011(0.04)
0.1086 ***
(5.60)-0.0174(-0.73)
0.0853 ***
(5.24)-0.0353(-1.50)
0.0786 ***
(4.83)
NDTS -0.2195***
(-5.76)-0.1661***
(-5.95)-0.2147 ***
(-6.03)-0.1437***
(-5.88)-0.0058(-0.15)
-0.0560 **
(-2.06)
SIZE 2.76×10⁻⁶ ***
(4.22)1.40×10⁻⁶ ***
(2.93)2.44×10⁻⁶ ***
(3.78)1.46×10⁻⁶ ***
(3.31)2.37×10⁻⁶ ***
(3.72)1.43×10⁻⁶ ***
(3.24)
DIVPOR 3.29×10⁻⁶ **
(2.44)-0.38×10⁻⁶ (-0.39)
3.24×10⁻⁶ **
(2.38)-0.40×10⁻⁶ (-0.43)
0.96×10⁻⁶
(0.71)-1.18×10⁻⁶ (-1.26)
STDLIB -0.0100 **
(-2.38)-0.0073 **
(-2.35)-0.0092 **
(-2.28)-0.0065 **
(-2.34)-0.0072 *
(-1.80)-0.0057 **
(-2.06)
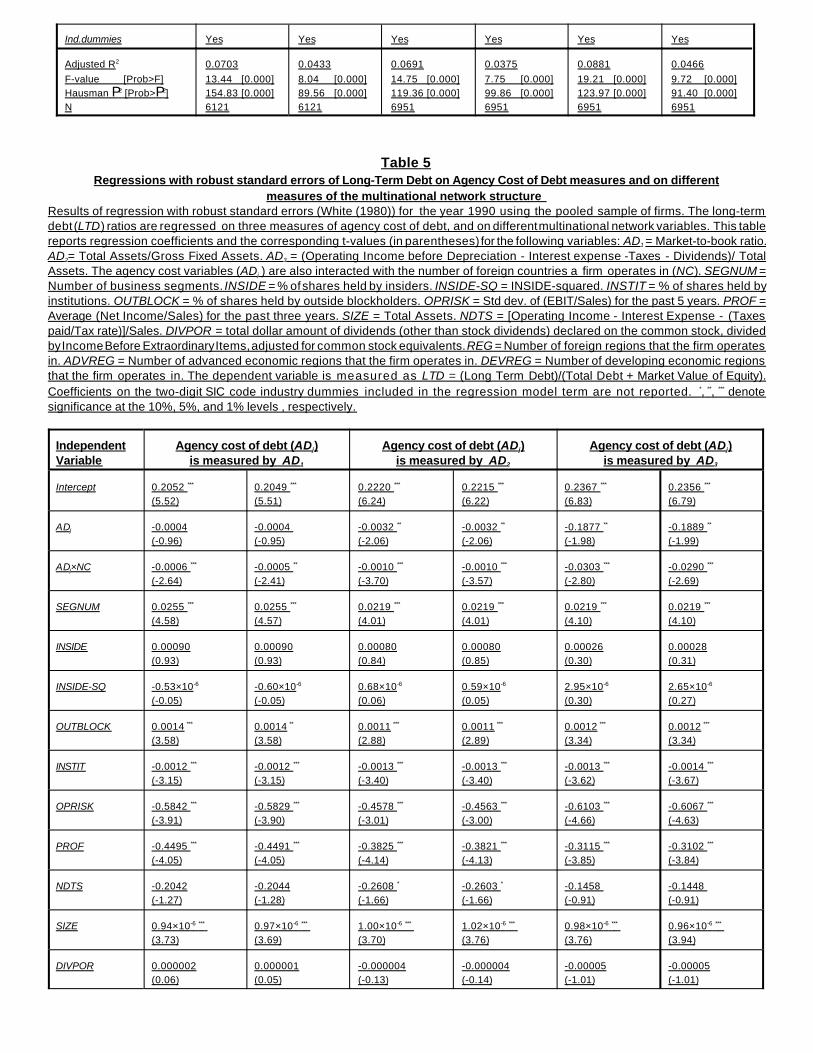
Ind.dummies Yes Yes Yes Yes Yes Yes
Adjusted R2
F-value [Prob>F]Hausman P2 [Prob>P2]N
0.070313.44 [0.000]154.83 [0.000]6121
0.04338.04 [0.000]89.56 [0.000]6121
0.069114.75 [0.000]119.36 [0.000]6951
0.03757.75 [0.000]99.86 [0.000]6951
0.088119.21 [0.000]123.97 [0.000]6951
0.04669.72 [0.000]91.40 [0.000]6951
Table 5Regressions with robust standard errors of Long-Term Debt on Agency Cost of Debt measures and on different
measures of the multinational network structure Results of regression with robust standard errors (White (1980)) for the year 1990 using the pooled sample of firms. The long-termdebt (LTD) ratios are regressed on three measures of agency cost of debt, and on different multinational network variables. This tablereports regression coefficients and the corresponding t-values (in parentheses) for the following variables: AD1 = Market-to-book ratio.AD2= Total Assets/Gross Fixed Assets. AD3 = (Operating Income before Depreciation - Interest expense -Taxes - Dividends)/ TotalAssets. The agency cost variables (ADj ) are also interacted with the number of foreign countries a firm operates in (NC). SEGNUM =Number of business segments. INSIDE = % of shares held by insiders. INSIDE-SQ = INSIDE-squared. INSTIT = % of shares held byinstitutions. OUTBLOCK = % of shares held by outside blockholders. OPRISK = Std dev. of (EBIT/Sales) for the past 5 years. PROF =Average (Net Income/Sales) for the past three years. SIZE = Total Assets. NDTS = [Operating Income - Interest Expense - (Taxespaid/Tax rate)]/Sales. DIVPOR = total dollar amount of dividends (other than stock dividends) declared on the common stock, dividedby Income Before Extraordinary Items, adjusted for common stock equivalents. REG = Number of foreign regions that the firm operatesin. ADVREG = Number of advanced economic regions that the firm operates in. DEVREG = Number of developing economic regionsthat the firm operates in. The dependent variable is measured as LTD = (Long Term Debt)/(Total Debt + Market Value of Equity).Coefficients on the two-digit SIC code industry dummies included in the regression model term are not reported. *, **, *** denotesignificance at the 10%, 5%, and 1% levels , respectively.
IndependentVariable
Agency cost of debt (ADj)is measured by AD1
Agency cost of debt (ADj)is measured by AD2
Agency cost of debt (ADj)is measured by AD3
Intercept 0.2052 ***
(5.52)0.2049 ***
(5.51)0.2220 ***
(6.24)0.2215 ***
(6.22)0.2367 ***
(6.83)0.2356 ***
(6.79)
ADj -0.0004(-0.96)
-0.0004 (-0.95)
-0.0032 **
(-2.06)-0.0032 **
(-2.06)-0.1877 **
(-1.98)-0.1889 **
(-1.99)
ADj×NC -0.0006 ***
(-2.64)-0.0005 **
(-2.41)-0.0010 ***
(-3.70)-0.0010 ***
(-3.57)-0.0303 ***
(-2.80)-0.0290 ***
(-2.69)
SEGNUM 0.0255 ***
(4.58)0.0255 ***
(4.57)0.0219 ***
(4.01)0.0219 ***
(4.01)0.0219 ***
(4.10)0.0219 ***
(4.10)
INSIDE 0.00090(0.93)
0.00090(0.93)
0.00080(0.84)
0.00080(0.85)
0.00026(0.30)
0.00028(0.31)
INSIDE-SQ -0.53×10⁻⁶
(-0.05)-0.60×10⁻⁶
(-0.05)0.68×10⁻⁶
(0.06)0.59×10⁻⁶
(0.05)2.95×10⁻⁶
(0.30)2.65×10⁻⁶
(0.27)
OUTBLOCK 0.0014 ***
(3.58)0.0014 **
(3.58)0.0011 ***
(2.88)0.0011 ***
(2.89)0.0012 ***
(3.34)0.0012 ***
(3.34)
INSTIT -0.0012 ***
(-3.15)-0.0012 ***
(-3.15)-0.0013 ***
(-3.40)-0.0013 ***
(-3.40)-0.0013 ***
(-3.62)-0.0014 ***
(-3.67)
OPRISK -0.5842 ***
(-3.91)-0.5829 ***
(-3.90)-0.4578 ***
(-3.01)-0.4563 ***
(-3.00)-0.6103 ***
(-4.66)-0.6067 ***
(-4.63)
PROF -0.4495 ***
(-4.05)-0.4491 ***
(-4.05)-0.3825 ***
(-4.14)-0.3821 ***
(-4.13)-0.3115 ***
(-3.85)-0.3102 ***
(-3.84)
NDTS -0.2042(-1.27)
-0.2044(-1.28)
-0.2608 *
(-1.66)-0.2603 *
(-1.66)-0.1458 (-0.91)
-0.1448 (-0.91)
SIZE 0.94×10⁻⁶ *** (3.73)
0.97×10⁻⁶ *** (3.69)
1.00×10⁻⁶ *** (3.70)
1.02×10⁻⁶ *** (3.76)
0.98×10⁻⁶ *** (3.76)
0.96×10⁻⁶ *** (3.94)
DIVPOR 0.000002(0.06)
0.000001(0.05)
-0.000004(-0.13)
-0.000004(-0.14)
-0.00005(-1.01)
-0.00005(-1.01)

REG 0.0028(0.63)
0.0066(1.42)
0.0044(0.94)
ADVREG 0.0038(0.63)
0.0077(1.27)
0.0071(1.13)
DEVREG 0.0005(0.05)
0.0041(0.41)
-0.0017(-0.17)
Ind. dummies Yes Yes Yes Yes Yes Yes
NAdj.-R2
F-value
8660.16576.86
8660.16576.69
9720.17167.45
9720.17177.23
9720.17558.80
9720.17558.80