Embed Size (px)
Citation preview

MMRC-F-11
Total Factor Productivity in Japanese Information Service Industries: Firm-Level Analysis
Kiyohiko G. Nishimura
Faculty of Economics, University of Tokyo and Executive Research Fellow, Economic and Social Research Institute,
Cabinet Office, Government of Japan Futoshi Kurokawa
Graduate School of Economics, University of Tokyo
June 2004


21COE, University of Tokyo MMRC Discussion Paper No. 11
1
Total Factor Productivity in Japanese Information Service Industries: Firm-Level
Analysis
Kiyohiko G. Nishimura
Faculty of Economics, University of Tokyo and Executive Research
Fellow, Economic and Social Research Institute, Cabinet
Office, Government of Japan
Futoshi Kurokawa
Graduate School of Economics, University of Tokyo
June・2004
Abstract We examine factors determining productivity of firms’ information service activities,
using most comprehensive data of information service industries in Japan. We
focus on the degree of modularization and resulting outsourcing,
economies/diseconomies of scale in software development, and firms’ organizational
changes. Outsourcing has persistent negative effects on total factor productivity,
suggesting not only productivity-enhancing modularization is not fully utilized but
also productivity-hindering remnants of traditional main-contractor-subcontractor

Kiyohiko G. Nishimura・Futoshi Kurokawa
2
relations still prevail in information service industries. We also find diseconomies of
scale in software development, suggesting less efficient communication among
development team members. Finally, we find a substantial cost on firms’
organizational changes on productivity.
JEL classification
L23 - Organization of Production
L25 - Firm Size and Performance
L86 - Information and Internet Services; Computer Software
O33 - Technological Change: Choices and Consequences

Total Factor Productivity in Japanese Information Service Industries: Firm-Level Analysis
3
1. Introduction Japan has been suffering from the most severe economic stagnation since 1990. Among possible
causes of this prolonged recession, a sharp decline in productivity has attracted much attention of
both economists and policy makers in the past decade.i。In particular, Nishimura et al. (2002)
examine and compare US experience (reported in Jorgenson et al. (2001)) and Japanese experience
(reported in Nishimura and Shirai (2002)). They find a sharp contrast between
productivity-improving manufacturing sectors (though there is a wide variety among them) and
productivity-stagnating non-manufacturing sectors in Japan. In contrast, no comparable difference
of this magnitude is found in the United States though there is a wide sectoral difference. Japanese
ICT hardware-producing industries are as productive as US counterpartsii but Japanese ICT using
industries (finance and insurance, trade, and other services) show markedly inferior performance
compared with US counterparts.
In another piece of evidence, Ark et al. (2002) report that in the latter half of the 90s, IT-using
industries (mostly service industries in a broad sense) show a robust 5.4% increase in the United
States, while the Japanese counterparts exhibit disappointing 0.0%. Especially, a sharp contrast is
notable in Wholesale and Retail Trade industries between Japan and the United States.iii The White
Paper (2001) of the Cabinet Office on the State of the Economy argues that the TFP growth in
Japanese non-manufacturing declines sharply whereas the decline of TFP growth in manufacturing
sectors is not so pronounced. Thus, disappointing TFP growth in non-manufacturing sectors
aggravate, if not cause, Japan’s economic stagnation of the 1990s.iv。
Although their importance is apparent in their large share of GDP and the above-mentioned
disappointing performance, non-manufacturing industries have not been a major subject of
large-scale firm-level empirical studies. This is a sharp contrast with manufacturing industries in
which large-scale firm-level as well as plant-level studies are commonly undertaken. This scarcity
of research is partly due to data availability.v
In this paper, we fill this huge gap between practical importance and scarcity of firm-level research in
non-manufacturing industries. Among a variety of non-manufacturing industries, we take up
information service industries as our target industries for the following three reasons.
Firstly, information service industries include the software industry that is an integral part of

Kiyohiko G. Nishimura・Futoshi Kurokawa
4
so-called “IT (information technology) Revolution” alongside with the hardware industry. Because of
a prominent role of IT on recent economic development, in-depth analysis of information service
industries is urgently needed. We should remind ourselves that the software industry is among
non-manufacturing industries while the hardware industry is by definition among manufacturing
industries.vi
Secondly, both the Government and business communities consider information service industries as
“strategic” industries. The Japanese government launched an initiative called “e-Japan Strategy II”
in 2003, and clearly targeted information service industries. Some firms in electronic industries are
shifting their business emphasis from computer hardware to software and information services.vii
Thirdly, however, there is a seemingly high hurdle for the government and firms to achieve their
goals. There are several pieces of anecdotal evidence of low potential in Japanese information
service industries. For example, according to the so-called Capability Maturity Model (CMM), 23
Indian firms are in the top rank at the end of 2000, while no Japanese firm is ranked to this
category.viii Similarly, no Japanese firm is in the top 5 of OECD (2002)’s revenue ranking of
software licensing and service fees. Only one Japanese firm appears among the top 20. Thus, it is
of utmost importance to analyze factors determining productivity in Japanese information service
industries including the software industry and to discern possible impediments to improve efficiency.
Although there is a sizable literature on firm-level productivity in manufacturing industries, only a
few studies have been conducted on non-manufacturing industries and almost none on information
service industries even in the United States, where data are relatively easily available.ix Ehrlich et al.
(1994) examine international airline companies and find an increase in TFP growth after full
privatization. Gort and Sung (1999) show that increased competition due to deregulation raises TFP
growth in telephone companies in the United States. To our knowledge, there is no empirical study
investigating TFP growth of information service industries at the firm level in the United States.
Even case studies that examine productivity directly are scarce.
One notable exception is Cusmano et al. (2003), who investigate software-development productivity
based on case studies of 104 software development projects mostly in India, Japan, the United States
and the European Union. Their results indicate that India and Japan are higher development
productivity than the United States and the European Union. However, their productivity measure is
not TFP but several project-oriented measures of performance such as the number of lines of code per
programmer-month, and defects reported per 1000 lines of code in one year after delivery to
customers. To interpret their results, we should take account of “cultural difference,” as suggested by
these authors. They point out that US programmers tend to emphasize shorter or more innovative

Total Factor Productivity in Japanese Information Service Industries: Firm-Level Analysis
5
programs, and spend more time in optimizing code, which ultimately reduces the number of lines of
code, while simultaneously increasing programmer-months.
The research reported here is markedly different from previous researches about information service
industries in Japan and in other countries in two aspects. Firstly, this research is based on
large-scale Census-like survey data on all firms and establishments engaged in information services,
called the Survey on Selected Service Industries, Volume of Information Services. In contrast,
existing studies in this field are at most case studies (see, for example, Sano (2001)), and in some
cases they may be biased to successful firms (see, for example, Koyama and Takeda (2001)x).
These studies are informative, but insufficient for the purpose of capturing the overall picture of the
industry as a whole.
Secondly, we examine total factor (or multi-factor) productivity of firms. Previous studies using
large-scale data are often concerned only with labor productivity (see, for example, Shintani (1998)).
However, it might be misleading to base one’s argument on labor productivity only, in an industry
using sophisticated IT equipments like computers and servers. The necessity of TFP analysis is
obvious in information service industries.
This paper is organized as follows. In Section 2, we examine factors determining productivity in
information service industries, with special emphasis on the software industry. In section 3, we
clarify important characteristics of the Survey of Selected Service Industries, and explain data
construction in some details. Main empirical results are presented in Section 4. We then discuss
these results and examine what factors are behind these results. Concluding remarks are presented
in Section 5.
Kiyohiko G. Nishimura・Futoshi Kurokawa
6
2. Factors Determining Productivity of Information-Service Firms In this section, we examine possible determinants of productivity of information-service firms, which
will be the basis of empirical analysis of Section 4. Since software products are major outputs in
information service industries, we base our argument mostly on productivity determinants of
software development. xi In particular, we consider three possible determinants: the degree of
modularization, the scale of software development, and organizational structure, which have often
been considered as most influential determinants of software development productivity.
2.1. Modularization
Both in popular presses and academic writings, so-called Silicon Valley Model has attracted much
attention. It is often argued that in the Silicon Valley of the State of California, information
companies and engineers form a “community” and collaboration within the community is common
and productive.xii Based on such collaboration, outsourcing has been considered as one of the most
productivity- enhancing practices.
However, simple outsourcing is not always likely to be productivity enhancing. For example, if
new products come out with new production design, outsourcing may cause a serious production
problem when readjustment of production process is necessary and communication between
outsourcers and outsourcees are not so smooth. In order to facilitate such readjustment and
communication and to make outsourcing successful, “modularization” of parts has been considered
to play a vital role in the Silicon Valley.xiii
The concept of “modularization” stems from the development of IBM SYSTEM/360. Computers
before IBM SYSTM/360 had their own specifications with own parts, operating system, and
application software. There were few common parts (both hardware and software) between each
generation of computers. Computer manufacturers developed idiosyncratic parts and software
suitable for each generation of computers virtually from scratch.
The development of IBM SYSTEM/360 was revolutionary in the sense that its developers invented
the concept of “family” of computers: compatibility within a family was maintained as much as
possible, and in order to do so, “modularization” had been extensively utilized. The adoption of
modularized design and its wide-range application were considered to be one of the most dramatic

Total Factor Productivity in Japanese Information Service Industries: Firm-Level Analysis
7
driving forces behind the revolutionary speed of innovations in the computer industry (Baldwin and
Clark (1997)).
Modularization has far-reaching consequences. Modularization of product architecture allows firms
to modularize production process, which leads to modularization of organization. Thus when
modularization is “deepened”, firms can outsource a part of their business. Outsourcees, who are
sometimes spinouts of some outsourcer firms, are then able to get outsourcing contracts from various
companies to realize economies of scale and to slide down the learning curve quite rapidly, so that
they become competitive in prices. This in turn enables outsourcers to procure parts inexpensively.
It should be noted that software was an integral part of computers at the time of IBM SYSTEM/360.
Thus, it may not be far-fetched to assume the same productivity-enhancing effect of modularization
applies to software development.
The successful hardware modularization, however, may not be duplicated in software and
information service industries. Koyama and Takeda (2001) forcefully argue that production
innovation in the software industry is less frequent than the hardware industry, implying these two
industries are not so similar. Thus simple “transplanting” of modularization may not work well in
the software industry. For example, if OS suppliers do not open source codes of their OS,
modularization is far less complete than in the hardware industry. xiv Furthermore, human factors
are relatively important in the software industry, since implicit knowledge of engineers may not be
fully “coded” and reproducible.
In sum, there is no theoretically clear-cut conclusion about whether modularization and resulting
outsourcing are productivity enhancing in the software industry. Thus, whether modularization and
outsourcing are productivity improving or not is in essence an empirical question.
2.2. Scale of Development Organization
The second possible factor determining productivity of information service industries is the scale of
development organization. Here development organization includes the basic research and
development division and system software development division (including system integration).
Software development is a complex process involving intensive communication among development
team members. Thus, smooth communication among development team members is vital,
especially under continuously changing software development environment. Development
languages are changing quite rapidly, and suppliers have to cater for ever-changing demand of their

Kiyohiko G. Nishimura・Futoshi Kurokawa
8
customers.
This observation suggests diseconomies, rather than economies, of scale in software development.
In fact, Frederick P. Brooks Jr., who is often referred as the “father of IBM SYSTEM/360”, points out
these possible diseconomies of scale, and argues against large-scale development. He coins the idea
that inputs can be measured in man-months as a “myth” in his renowned book Mythical Man-months
(Brooks (1995)). He argues that the time of one programmer is not substitutable by the time of
another programmer, so that using one hour of 100 programmers cannot finish a project that can be
finished by using 100 hours of one programmer. Consequently, programmers’ labor inputs cannot
be measured by man-hours or man-months.xv
Thus, when communication is insufficient among development team members, an increase in the
number of development teams may have even negative effects on the productivity of software
development. This possible negative effect may be particularly keen when the development
schedule is suddenly shortened and engineers are added to the development team to compensate the
change.
In contrast, there is one important example of economies of scale in software development, which is
the success of the Linux system development. As is well known, the development of Linux is made
possible by participation of many engineers and programmers around the world, who form an
Internet virtual community. They enhance communications among them through various means of
Internet technology. The most important characteristics of the development of Linux is that codes are
open to their community and thus coding and debugging are efficiently undertaken in a rapid manner.
The success of Linux suggests that if communication among developers is smooth, there are notable
economies of scale in software development.
In sum, the scale of development may negatively affect productivity as in the case of the “mythical
man-month”, or may positively influence productivity as in the success of Linux development,
depending on the smoothness of communication among development team members. In the
empirical analysis, we see which factor dominates in the Japanese information service industries.
2.3. Organizational Development and Productivity
We have so far examined a crucial role of communication in software development. Comparing the
phenomenon described in the mythical man-month and the success of Linux, we understand
importance of development-team organization that enhances or hinders effective communication.

Total Factor Productivity in Japanese Information Service Industries: Firm-Level Analysis
9
In fact, effectiveness of communication is also closely related to modularization. If software
development is modularized in a way to enhance communication as in the Linux case, we can expect
a large productivity gains. If modularization is pursued by other motivations than communication,
we are likely to face inefficiency described in the mythical man-month. In a similar token, one may
argue that firm organization may be as important as development team organization.
Innovations in software development are often described as leap-frogging, not gradual, in which past
experiences have relatively less value than in other industries. This means that firm organization
should be sufficiently flexible to accommodate such leap-frogging innovations. In fact, information
service industries are known for a variety of employment contracts, ranging from standard long-term
contracts for regular employees called “Shain” to short-term ones for workers choosing more flexible
work styles.
One typical example is Elysium, a producer of 3D data transformation software called direct data
translator.xvi It was divested from Armonicos, which itself was founded by three spinouts of
YAMAHA as a software firm in 1984.xvii The packaged software division was divested in 1999 to
become Elysium. The custom software division remains in Armonicos. Thus, even though Elysium
and Armonicos are in the same 3D CAD software market, they decide to separate in order to seek
efficiency and to maximize their value-making potential.
In the empirical analysis of Section 4, we examine the effect of organizational changes on
productivity explicitly. In particular, we distinguish adjustment costs of firm organization from
those of employment adjustment.

Kiyohiko G. Nishimura・Futoshi Kurokawa
10
3. Data: Survey of Selected Service Industries: Volume of Information Service Industries In this section, we briefly review and explain our data source, the Survey of Selected Service
Industries, Volume of Information Service Industries. This survey is conducted by the Ministry of
Economy, Trade and Industry (METI). However, before explaining data source, it may be
worthwhile to briefly peruse Japanese information service industries.
3.1. Japanese Information Service Industries
Survey of Selected Service Industries, Volume of Information Service Industries is the most
comprehensive statistics about the Japanese information service industries. Here information
service industries include information processing service (including application service providers
(ASP))xviii, custom software, prepackaged software (business prepackaged software, software game,
basic software), system management and administration, data base service (online and offline),
research, and others.
In the empirical analysis we use panel data of firms between 1991 and 1998.xix However, we use
the most recent aggregate data (2001) here to review the current state of Japanese information service
industries. The total sales of information service industries are 13.9 trillion yen, a remarkable
18.2% increase from the previous year. Note that the Japanese economy was in the deflationary stage
in 2001, so that this increase in nominal terms is all the more impressive. Among all information
service industries, custom software development has the largest share, which is 49.4%, and the third
largest is prepackaged software development’s 10.8%. Thus software development including both
custom and prepackaged accounts for more than 60%. The second largest share is information
processing service’s 19.1%.
Prepackaged software’s growth of sales is an astounding 49.1%, which is the highest among
information service industries. This high rate of growth is the result of extremely high growth rates
of its subcategories, that is, 162.3% growth in software games and 112.6% growth in basic software.
System management and administration’s growth rate is 44.8%, which is the second highest. This
may be caused by a rapid growth in network systems in this field. Custom software has a decent
growth rate of 8.4%, though its rate pales before the extremely high growth rate of prepackaged

Total Factor Productivity in Japanese Information Service Industries: Firm-Level Analysis
11
software. Only one category exhibits negative growth, which is –10.5% of data base service. This
category includes some of Internet businesses, so that this decline may reflect hard time of Internet
businesses after the burst of so-called “Internet Bubble.”
Let us now turn to the demand side of information service industries. In the total contracted sales,
the share of manufacturing firms is 22.6% and that of finance and insurance firms is 17.5%, and these
two industries account for more than 40%. As for the growth rate, transportation and
communication have the highest, which grows at the rate of 41.5%. Wholesale and retail trade
industries are the second highest, and its growth rate is 30.6%.
3.2. Characteristics of The Survey of Selected Service Industries
The Survey of Selected Service Industries, Volume of Information Service Industries, is the most
comprehensive statistics about Japanese information service industries. This survey, conducted by
the Ministry of Economy, Trade and Industry (METI), is a Census-like one, in which all firms and
establishments engaged in information service industries are surveyed. Moreover, the coverage of
the survey is far wider in its scope of information service industries than even the Establishment and
Enterprise Census. The Survey collects information about establishments and firms that have some
business activities in information service, while the Census gathers information about establishments
and firms whose major business activities are in information service. This is particularly important
since information service industries are rapidly expanding ones with many entries from and exits to
other industries.
Table 1 shows the number of establishments as a whole and for each sub-categories based on firms’
organizational structure, according to aggregate figures published by the METI. In our sample
period of 1991-1998, the total number of establishments ranges between the smallest number 5,812
of 1995 and the largest 8248 of 1998. There are three sub-categories: single establishments
(without a branch office), headquarters (with branch offices), and branch offices. The category of
single establishments has the largest share of 50% on the average.
The purpose of our study is to investigate productivity at the firm level and we examine the effects of
firm-level characteristics such as firms’ organizational structure on firms’ productivity. Thus, our
basic units of investigation are firms, rather than establishments. Among all establishments listed in
Table 1, we examine single establishments and headquarters in our study.
The Survey of Selected Service Industries is particularly suited for firm-level analysis of information

Kiyohiko G. Nishimura・Futoshi Kurokawa
12
service industries in several respects. Firstly, the Survey meticulously distinguishes revenues, costs,
labor inputs and capital stocks in firms’ information service activities from their other activities.
This is important since some firms in our samples engage only partially in information service
activities. In our empirical analysis, we use these revenues, costs, labor inputs, and capital stocks
solely in their information service activities to construct value-added and other data necessary for
TFP calculation. That is, our value-added, labor input and capital stock data are solely of firms’
information service activities, and thus they are not “contaminated” by other activities.xx
A notable characteristic of capital investment data in this data set is many zeros and blanks found in
the category of “acquisition of structure and buildings” and “acquisition of machines and
equipments”, on the one hand, and relatively large payments of computer-time lease and other rental
payments that are supposedly building rents. This implies that in some cases a traditional perpetual
inventory method may not be appropriate, especially in the case of capital service inputs of
computers, where capitalization is more appropriate. Thus, in the following analysis, we use the
perpetual inventory method as much as possible, but when it is not appropriate, we resort to other
procedures to get capital service inputs.
Finally, there is no intangible asset data in the Survey. In particular, there is no data of software
assets that firms have. It is inconceivable that firms engaging information service activities have no
software assets. Consequently, we should take this fact in mind and take measures to correct
possible biases stemming from the lack of software asset information.
3.3. Framework of TFP Growth Measurement
We follow standard neoclassical growth accounting framework. In particular, we assume constant
returns to scale and flexible factors of production.
3.3.1. Output: Real Value-Addedxxi
Value added of each firm is calculated by the following formula, which follows the definition of the
value-added in the Survey itself.
Real value-added (index) =
(Sales – Operating Expenses + Total Compensation + Rents) / Price Index
Here, as a deflator, we use the Corporate Service Price Index (CSPI) of Information Service Industry, compiled

Total Factor Productivity in Japanese Information Service Industries: Firm-Level Analysis
13
by the Bank of Japan.
We exclude firms having negative value-added in a particular year from our samples of that year.
However, the number of these firms is very small, accounting only 0.88% of total firm-years, so that
this does not cause any significant bias.
3.3.2. Inputs
As for factor inputs, we have labor hoursxxii, equipment stock services, and building and structure
capital services. (As usual, we assume services are proportional to the amount of stocks throughout
this paper.)
We use perpetual inventory methods as much as possible to construct capital stocks data. For
depreciation rates we rely mostly on Fraumeni (1997)’s rates. For deflators, we construct deflator
data based on data supplied by P. Shcreyer of OECD, which are harmonized price indexes of capital
stocks. We construct our depreciation rates and deflators using weights suitable for Japanese
information industriesxxiii.
A distinctive characteristic of information service industries is an importance of computer (and
computer time) lease. Fortunately, the Survey has data about computer and computer-time lease.
We capitalize these lease costs to get a computer stock data. (This conversion is necessary for
consistency since we use stock data as inputs assuming service flows are proportional to stock
values.)
One note should be due for buildings and structure. We encounter many zeros in building and
structure investment. This means many small information service firms do not own buildings and
structure but simply rent them. Since we have information about building rents, we utilize this
information to estimate building and structure capital stocks.xxiv
3.3.3. User Cost
To estimate user costs, we use the following standard formula:
ititt
ittit q
uzu
UCC )(1
1δρ +
−−
=
Here itUCC is the t -th period user cost of the i-th capital stocks, tρ is the t -th period dividend

Kiyohiko G. Nishimura・Futoshi Kurokawa
14
yields of the First Division of the Tokyo Stock Exchanges,xxv iδ is the depreciation rate of the
i -th stocks, tu is the effective marginal corporate tax rate of the t-th period, and itz is the capital
consumption allowance of the i -th capital stocks,xxvi and itq is the price of i th capital stocks.
3.3.4. TFP Growth
Using data described so far, we calculate TFP growth in the following formula.
{ } ( ) { }5
1 , 1 , , 1 ,1
1ln ln ln ln2t t i t i t i t i t
i
TFPGrowth V V s s F F+ + +=
= − − + ⋅ −∑,
where V is real value-added, iF is the i-th inputs and is is their cost share. In particular, we consider as inputs (a) labor hours, (b) equipment capital stocks, (c) imputed computer capital stocks
by capitalizing lease payments, (d) building and structure stocks estimated by the perpetual inventory
method, and (e) imputed building and structure stocks by capitalizing building rents.
3.4. “Firms with Well-Established Information Service Activities”
It is not possible to compute TFP growth of all firms because very high turnovers. For this reason, we
restrict our attention on firms whose information service activities are well established. We set the
following two criteria, and firms satisfying all these criteria are put in the following empirical
analysis.
In the first step, if firms whose information service activities yield negative value-added and/ or hire
no worker in a particular year, we exclude these firms from our sample of the particular year. If
these firms show positive value-added after that year, they are included in our sample thereafter. As
reported earlier, actual occurrence of negative value-added is rather rare, accounting less than 1% of
our total firm-years.
In the second step, if firms do not have five consecutive years of information service-related
equipment investment, we excluded from our sample. This is necessary since we use the five-year
average investment growth rate to estimate benchmark-year capital stocks.xxvii By doing this, we
restrict our attention virtually on firms with well-established information service activities.
Through this procedure, we get 1,106 firms with well-established information service activities.

Total Factor Productivity in Japanese Information Service Industries: Firm-Level Analysis
15
Our sample period is 1991-1998, and our sample is an unbalanced panel.
To discern the characteristics of our samples, “firms with well-established information service
activities”, we compare the whole samples and our truncated samples in the following tables.
Table 2-1 reports the summary statistics of the whole samples after excluding firms with negative
information-service value-added and/or no information-service worker, while Table 2-2 shows that of
our samples. Here major variables are the ratio of information-service outsourcing to
information-service sales, the number of SE (system engineers)xxviii, the ratio of SE to the total
information-service work force, and the ratio of information-service profits to information service
operating expenses, which we consider later as determinants of TFP growth.
Comparing Table 2-1 and 2-2, we find that quite a similar picture between the total samples
(excluding abnormal ones) and our “firms with established information services”, except for the
number of SE’s and the number of information service workers. For example, the ratio of
outsourcing to information service sales, the total samples’ average is 0.1378, while 0.1482 in firms
with established information activities. Similarly, the ratio of SE’s is 0.2839 in the total sample,
while 0.3789 in our target of investigation. However, the number of information service workers
and SE’s is substantially higher in firms with established information service activities, so that our
target is slanted to larger firms. In order to interpret our results, these characteristics of our target of
investigation should be kept in mind. xxix
Let us now turn to the issue of firms’ organizational dynamics and its effects on TFP growth in our
samples. In order to discern the effects of firm dynamics, we disaggregate our samples further into
four segments.xxx These four segments are:
Group 1 (Single-Establishment Firms): firms that remain single establishments throughout the sample period. Group 2 (Multiple-Establishment Firms): firms with the headquarters and branch offices throughout the sample
period. Group 3 (Expanded-to-Multi Firms): firms that start as single establishments and become multi-establishment
firms by the end of the sample period. Group 4 (Shrunk-to-Single Firms): firms that start as multi-establishment firms and become single
establishments by the end of the sample period.
Table 3 reports the average of major variables for each segment. As for the estimated TFP growth,
Group 2 (Multi-Establishment Firms) has the highest TFP growth rate (2.61%), while Group 4
(Shrunk to-Single Firms) exhibits the lowest (0.51%). We will consider determinants of the TFP
behind these figures. Group 2 (Multi-Establishment Firms) has the highest outsourcing to sales
ratio (17.69%), while Group 1 (Single-Establishment Firms) shows the lowest (13.09%).

Kiyohiko G. Nishimura・Futoshi Kurokawa
16
4. Models, Estimation Results and Discussion
4.1. Choice of Variables
4.1.1. Modularization and Outsourcing
In Section 2, we have examined possible effects of modularization on information service
productivity. There we have pointed out that modularization enables firms to outsource parts of their
products in an efficient way. If this is the case, the degree of outsourcing may measure the degree of
modularization, although the degree of modularization itself is not observable. Consequently, in our
empirical analysis, we use the degree of outsourcing, which is the ratio of outsourcing to total sales in
information service activities, as a variable representing modularization and resulting outsourcing.
According to Fujimoto (2002), there are three kinds of modularization: (a) modularization of product
architecture (modularization in development process), (b) modularization of production process, and
(c) modularization of supplier relations. Outsourcing is a result of (3), which is based on (b) and (a).
However, outsourcing may not solely be motivated by modularization, and other factors may prompt
firms to outsource their business activities. We will explicitly consider the latter possibility in our
later interpretation of empirical results obtained in this paper.
4.1.2. Scale of Development Organization and the Number of SE’s
The second determinant we have examined in Section 2 is the scale of software development.
Ideally, if a measure of the average quality-adjusted scale of software development in a firm is
available, this is the variable we should use in our empirical analysis. However, since the average
scale of software development is not directly observable, we need a proxy for this variable.
Software development is skilled-labor intensive, and thus the scale of development is likely to be
highly correlated with the size of skilled work force. In the context of information service
industries and especially the software industry, skilled work force include SE’s (system engineers),
programmers, and research scientists, about which we have data in the Survey of Selected Service
Industries, Volume of Information Service Industries. Among them, SE’s have a pivotal role in
software development, especially in custom software one, which dominates Japanese software
development.

Total Factor Productivity in Japanese Information Service Industries: Firm-Level Analysis
17
In custom software development, to tailor software to the demand of customers is of utmost
importance. SE’s in the worker classification of the Survey are those who responsible to listen
customers’ needs and to interpret them into schemes which are programmable. They are also
responsible to select most suitable development languages and to organize programmers to get the
best out of them. Taking account of SE’s importance in Japanese software development, we use their
number as a proxy of the scale of software development.xxxi
4.1.3. Other Possible Determinants
(1) Unobservable Software Capital Stocks and the SE ratio.
As explained before, there is no information about non-tangible software capital stocks in the Survey.
However, it is inconceivable that there is no software capital stock in information service firms. To
ignore this unobservable capital stock may lead to overestimation of TFP. Thus, we need to control
these unobservable software capital stocks using a proxy variable.
Presumably the more a firm is technology-oriented, the more its unobserved software capital stocks
are. In this sense, the ratio of the number SE’s in the total number of information service workers,
representing the firm’s technological orientation, is likely to be a good measure of unobserved
software capital stocks.
(2) “Profit-driven R&D Investment” Hypothesis and the Profit-to-Sales Ratio.
It has often been argued that the higher a firm’s profits are, the higher the level of research and
development activities is, leading to a higher TFP. This “profit-driven R&D investment” may be
relevant in information service industries in Japan since relatively small firms in our samples may be
liquidity-constrained in our sample period of 1991-1998. To control this possibility, we consider the
ratio of gross profits of information service activities to their operation costs as one determinant of
TFP.
(3) Employment Adjustment Costs
In Section 2, we have pointed out a possibility that changes in firm organization affect TFP such as
transformation from a single-establishment firm to a multi-establishment-firm. In our empirical
analysis, we consider the effects of firms’ organizational dynamics on TFP by disaggregating our
samples in four groups explained in Section 2.
Beside these “adjustment costs” of organizational changes, there are other important adjustment costs
in Japan, which are employment adjustment costs. Although information service industries are
relatively new industries and that we find rather flexible labor contracts in these industries compared

Kiyohiko G. Nishimura・Futoshi Kurokawa
18
with other industries, there remains a sizable cost of employment adjustment in information service
industries like other Japanese industries. Such adjustment costs may lower overall productivity of a
firm, leading to a lower TFP.
To take account of these employment adjustment costs, we consider the squared rate of change in the
number of information service workers in the following empirical analysis.
4.2. Models and Estimation
Taking account of arguments in previous sections, we formalize that the level of TFP in information
service industries is determined in the following way:
(1) , 0 1 , , ,
1 1
lnJ T
i t i j ij t k k t i tj k t
TFP t x dα α β γ ε= = +
= + + + +∑ ∑ Ii L,1= ; Tt L,1=
Here i denotes the i-th firm and t denotes the year. Equation (1) implies that the total factor
productivity of the i-th firm’s information service activities in year t, itTFP , is determined by a
constant 0α , a time trend tt1α , microeconomic variables t,ijx discussed in the previous sections,
time dummy t,kd representing macroeconomic conditions, which is 1 if t k= otherwise 0, and
disturbances t,iε . In this formulation, the time trend is constant but it varies across firms
representing firm heterogeneity.
As for microeconomic determinants t,ijx , we consider the followings.xxxii
1) OUT: the outsourcing-to-sales ratio in information service activities, which is used as an index of
modularization.
2) SE: the number of SE’s, which is used as an index of the scale of development organization.
3) SE-RATIO: the ratio of the number of SE’s to the total information service workers, which is used
to take account for unobservable software capital stocks.
4) PROFIT: the ratio of gross profits to operating expenses in information service activities.
In some cases, we consider the effects of employment adjustment costs on TFP. There we will add

Total Factor Productivity in Japanese Information Service Industries: Firm-Level Analysis
19
the following variable.
5) ADJUST: the squared rate of employment change.
We use a standard growth accounting procedure to get firms’ TFP growth, so that we base our
analysis in the following “growth” or first-difference formulation (2).xxxiii.
(2) , 1, , , ,
1 1ln
J T
i t j j ij t k k t i tj k t
TFP x d eα β γ= = +
∆ = + ∆ + ∆ +∑ ∑,
where 1t t tY Y Y+∆ = − andxxxiv
, , 1 ,i t i t i te ε ε+= −
In addition, we assume that the time trend, 1,iα , is the sum of a constant and an unobservable
individual specific effect:
1, 1i iuα α= + ,
where 1α denotes the constant and iu denotes the unobservable individual specific effect. Then
the equation (2) can be written as ordinary one-way error component regression model with time
dummy (3). xxxv
(3) , 1 , , ,
1 1ln
J T
i t j ij t k k t i i tj k t
TFP x d u eα β γ= = +
∆ = + ∆ + ∆ + +∑ ∑,
It is well known that to apply standard procedures such as OLS causes problems if variables are
non-stationary.xxxvi However, to apply tests of stationarity, we should take into account our
samples’ characteristics of large cross-sectional but small time dimensions (at most nine years) and a
unbalanced panel. To check stationarity of variables in our panel, we carry unit root testsxxxvii
developed by Breitung and Meyer (1994) [BM] and Bond et al. (2002) [OLS1, OLS2 (t-test based on
OLS estimation)] for panels with large cross-sectional dimensions but small time dimensions such as
ours. xxxviii The results of these tests are reported in Table 4. The unit root hypothesis is soundly
rejected in all unit root tests for the first differenced variables.
It is uncertain that whether , , 1 ,i t i t i te ε ε+= − satisfies standard liner regression model assumptions
about disturbances.xxxix Consequently, we estimate (3) for cases of (a) error terms without

Kiyohiko G. Nishimura・Futoshi Kurokawa
20
autocorrelation, and (b) error terms with autocorrelation. For simplicity, we consider AR (1) in the
case of autocorrelation.
Furthermore, there is a good possibility that error terms of each individual firm may have
heteroscedastic structure. To take a proper account of this possibility, we also estimate (3) by FGLS
(Feasible General Least Squares) for the case that error terms in regressions are autocorrelated and
heteroscedasticity is present across firms and years, where autocorrelation coefficients are not
identical across panels.
So, we consider three estimation procedures to take account of them and to check robustness.
Panel OLS: (random-effects model/fixed-effects model).
Panel AR1 (random-effects model/fixed-effects model): assuming error terms are first-order
autoregressive.
FGLS (Feasible General Least Squares): assuming error terms are AR (1), where first-order
autocorrelation coefficients are heterogeneous and heteroscedasticity is present across firms and
years.
4.3. Results and Discussion
4.3.1. A Brief Summary
The results of estimation is reported Table 5 through Table 10. Table 5 is the results of Panel OLSxl,
Table 6 is those of Panel AR(1), and Table 7 is those of FGLS. Cases with employment adjustment
costs are shown in Table 8 (Panel OLS), Table 9 (Panel AR(1)), and Table 10 (FLGS). In addition,
each table shows the difference among firms with different organizational dynamics over time. We
show the results of all firms in our samples (“firms with well-established information service
activities”) in the column of “All”. The results of Group 1 (single-establishment firms), Group 2
(multiple-establishment firms), Group 3 (expanded from single to multiple), and Group 4 (shrunk
from multi to single) are shown respectively in these tables. xli
The Sample period is 1991-1998 for Table 5 through Table 7, and 1991-1997 for Table 8 through
Table 10.xlii Although the number of firms varies among tables, roughly 1,100 firms are in our
samples.
As shown in Tables 5 and 7, the null hypothesis of no autocorrelation in error terms is rejected in all
cases (see All, Groups 1, 2, 3 and 4) at the 1% significance level, we hereafter concentrate our
discussion mostly on Tables 6 and 9 (Panel AR(1)) and Tables 7 and 10 (FGLS), with some reference

Total Factor Productivity in Japanese Information Service Industries: Firm-Level Analysis
21
to Tables 5 and 7 to check robustness.
Let us consider estimation results of all firms, which are reported in the column “All” of Tables 5
through 10. In all these tables, we have fairly consistent and significant results: the coefficient of
the d-OUT, d-SE, d-SE-RATIO and d-PROFIT is significant at the 1% level, where “d-“ means the
first difference. The sign of d-OUT and d-SE is negative, while that of d-SE-RATIO and d-PROFIT
is positive. Period dummies are all significant at the 1% level when employment adjustment costs are
not incorporated in Tables 5 through 7. However, their effects are substantially reduced when
employment adjustment costs are explicitly considered in Tables 8 through 10.
4.3.2. Outsourcing and Remnants of Traditional Relationship
A remarkable result in these tables is that the outsourcing-to-sales ratio (OUT) has a significant
negative effect on TFP. This result is quite robust in all specifications. This robust negative effect of
outsourcing is striking. As in the Section 2, modularization behind outsourcing should improve
productivity, rather than reduce productivity. Thus, a robust negative result of outsourcing on TFP
suggests that outsourcing in Japanese information service industries has a different origin from
modularization, which hinders productivity.
In fact, in-depth analysis of industrial structure of the Japanese software industry suggests that the
negative effect of outsourcing stems from a remnant of traditional subcontracting practices found in
this industry. In the traditional relationship, there are main contractors on the one side that get
contracts from customers being often large corporations and/or central as well as local governments.
On the other side of the relationship, there are sub-contractors that depend mostly on main
contractors to allocate business to them.
Main contractors outsource their business not to promote the efficiency in software development but
to make sub-contractors as “buffers” of economic fluctuations to reduce costs of adjustment
necessitated by such fluctuations. It is sometimes argued that this cost consideration of main
contractors leads to “over-outsourcing” to sub-contractors in the sense that programming expertise is
not properly retained in these main contractors. If so, they violate the dictum of “do not outsource the
core of your competence.”
For sub-contractors, their poor financial positions make them unable to take advantage of such
outsourcing. Outsourced sub-contractors have little human-capital investment as well as little
physical-capital investment.
This inefficient subcontracting system, however, cannot survive if new efficient firms enter the

Kiyohiko G. Nishimura・Futoshi Kurokawa
22
market. Unfortunately, strong preferences of buyers (consisting of local and central governments
and large corporations) to “established vendors” make entry of new, especially small, firms very hard
and thus this industrial structure is sustained for a long time.
4.3.3. Mythical Man-Month and Communication Problems
In Section 2, we have argued that the scale of development may affect productivity positively in
some cases and negatively in others, depending on the smoothness of communication between
customers and development team members and among development team members themselves.
The results of our study strongly suggest diseconomies of scale in software development: the scale of
development organization affects firms’ productivity negatively.
Thus, the phenomenon of mythical man-month dominates Japanese information service industries.
Effective communication to reduce costs between SE’s and their customers and among SE’s
themselves is lacking, and this is likely to be one of major obstacles of Japanese firms to improve
their efficiency in information service provision.
In this respect, central and local governments should play an important role to reverse this tendency.
Central and local governments are major customers of information service firms. However, these
governments are often pointed out to be rather incompetent to articulate their real needs when they
place orders to information service firms. Because of this lack of articulation, communications
between these governments as customers and SE’s in supplier firms are not smooth and in some cases
this leads to last-minute specification changes that are very costly in software development.
To test the magnitude of this “incompetent government” effect, we put a dummy variable
representing a particular firm’s dependency on government contracts as one explanatory variable in
the FGLS estimation of Table 7. Table 12 shows the results for the case in which the government
dummy is 1 when the ratio of government contracts to the total information service contracts exceeds
30%, 40% and 50%, respectively. In all cases, the dummy of firms’ dependency on government
contracts is statistically significant and has a negative sign. Clearly, governments themselves should
act to rectify this problem.
4.3.4. Other Determinants
As for other determinants, we have statistically significant positive effects of the SE-RATIO as
expected, which is the proxy of unobservable software capital stocks in firms. We also get
statistically significant positive effects of the PROFIT. This suggests many of information service
firms may be liquidity constrained. However, there may be other possible explanations of these

Total Factor Productivity in Japanese Information Service Industries: Firm-Level Analysis
23
positive effects of profits on productivity, and thus the results should be considered at most as
suggestive.
4.3.5. Strong Effects of Employment Adjustment
Let us now turn to the issue of employment adjustment costs. Tables 8, 9 and 10 report the results.
For all firms (see “All” category), we see a substantial downward effect of employment adjustment
on productivity. This result is pretty robust across estimation methods we take, and consistent with
the commonly held view of high employment adjustment costs in Japan.
However, more in-depth analysis of data shows variation across firms’ organizational changes. In
particular, while we have a strong negative effect of employment adjustment for firms of
multiple-establishment firms (Group 2) and expanded firms from single to multiple (Group 3), we
obtain no significant effect for single establishment firms (Group 1) and a significantly positive and
large effect for firms shrunk from multiple to a single establishment (Group 4).
This last finding may be particularly interesting. This shows that when a firm takes a drastic
measure to restructure itself to trim out all subsidiaries to become a single establishment, the more
thoroughly its accompanying employment adjustment (that is, employment reduction) is, the higher
its productivity is.
4.3.6. Effects of Firms’ Organizational Changes (Group1--4)
We now examine the effects of firms’ organizational changes on firms’ productivity. The basic
econometric picture of all subcategories (Groups 1 through 4) is qualitatively the same as “All”: In
the OLS Panel, the Hausman test leads to random-effect models, and there is serial correlation in
error terms so that we use AR(1) and FGLS results mostly in our discussionxliii.
Group-wise estimation results are similar among these Groups. OUT, SE, SE-RATIO and PROFIT
have mostly statistically significant coefficients at either 1% or 5% level and the same sign as in the
case of “All”. However, the magnitude of their effects varies among these Groups, suggesting a
strong effect of firms’ organizational changes on productivity.
As for the negative effect of outsourcing, Table 6 (Panel AR(1)) shows the following order of
magnitude:
Group 1 (single) < Group 4 (shrunk) < Group 2 (multi) <Group 3 (expanded)
Similarly, Table 7 (FGLS) has comparatively smaller effects and shows the following order of
magnitude

Kiyohiko G. Nishimura・Futoshi Kurokawa
24
Group 1 (single) < Group 2 (Multi) < Group 4 (shrunk) < Group 3 (expanded).
Thus in both tables, the negative effect of outsourcing is the smallest in single establishments and the
largest in firms expanded from a single establishment to multiple establishments.
A particularly interesting result is that the negative effect of outsourcing is far less
pronounced in single establishments (Group 1) than multiple establishment (Group 2). This result is a
piece of supporting evidence for the hypothesis we developed in Section 4.3.2. There we have
argued that traditional relationship between large main contractors and small subcontractors leads to
inefficiency in outsourcing. This argument is more relevant to large firms in Group 2, than small
firms in Group 1, so that this observed sharp difference strengthens our argument. However, negative
effects remain in Group 1 though their magnitude is far smaller than in Group 2. This may reflect
small-scale traditional subcontracting systems even in Group 1.
Negative effects of outsourcing are the largest in expanded firms (Group 3). When organization is
expanding, there exists larger demand for outsourcing not from efficiency consideration but from
keeping up increasing demand. Since outsourcing here is not from modularization, resulting effects
of outsourcing are rather negative. This shows the existence of organizational adjustment costs
distinct from employment adjustment costs.
Let us now turn to the issue of diseconomies of scale in software development. Table 6 shows the
following ranking in the order of magnitude:
Group 3 (Expanded) < Group 1 (Single) < Group 2 (Multi) < Group 4 (Shrunk),
while Table 7 reveals
Group 3 (Expanded) < Group 1 (Single) < Group 2 (Multi) < Group 4 (Shrunk).
Thus, a consistent picture emerges.
A remarkable result is that negative effects diseconomies of scale in development organization are far
less pronounced in single establishments (Group 1). (Group 3, which are expanded from single
establishments, are likely to have much in common with single establishments with respect to
software development organization.) Since single establishments have the simplest organization
structure that facilitate relatively smooth and efficient communication both inside and outside, this
result suggests our communication argument about the cause of diseconomies of scale is in a right
track. Moreover, we find that negative effects of outsourcing are the largest in expanding
organization (Group 3), where smooth communication is rather difficult. In sum, our results
strongly suggest smooth communication is very important to achieve higher productivity.

Total Factor Productivity in Japanese Information Service Industries: Firm-Level Analysis
25
5. Concluding Remarks In this paper, we have examined factors determining productivity of information service activities of
firms, using most comprehensive data of information service industries in Japan. Among possible
determinants, we have focused on (1) the degree of modularization and resulting outsourcing, (2)
economies/diseconomies of scale in software development, and (3) firms’ organizational changes.
We have found somewhat disturbing results for Japanese government officials promoting “e-Japan
Strategy II” initiatives to revitalize the Japanese economy. Firstly, we have shown that outsourcing
has persistent negative effects on total factor productivity, suggesting not only
productivity-enhancing modularization is not fully utilized but also productivity-hindering remnants
of traditional main-contractor-subcontractor relations still prevail in information service industries.
This shows that to increase in productivity is not a simple task to be achieved by introducing
productivity-enhancing modularization into information service industries. A fundamental
restructuring of business practices is necessary to transform traditional main-contractor-subcontractor
relations into modularized, horizontal as well as vertical, mutually supportive community-like
relations. To achieve this goal, governments as buyers should play a crucial role.
Secondly, we have found diseconomies of scale in software development, suggesting less efficient
communication among development team members. Communication gaps are also pointed out
between information service providers (particularly system engineers who are in charge of
coordinating development) and their customers. Among these customers, central and local
governments are most important, and our preliminary empirical study shows that these governments
hinder information service firms’ productivity, rather than enhance it, contrary to the presumption of
“e-Japan Strategy II” proponents. Lack of information service expertise on the side of central and
local governments is the cause of these problems, and these governments should rectify their own
problems when they promote productivity-enhancing practices in the industries at the same time.
Although these tasks seem formidable, these governments have no other choice than transforming
themselves into informationally and technologically advanced customers of information service firms,
to promote true modularization and efficient communication between customers and information
service providers.

Kiyohiko G. Nishimura・Futoshi Kurokawa
26
References
Ahn, S., “Firm Dynamics and Productivity Growth: A Review of Micro Evidence for the OECD
Countries,” OECD, OECD Economics Department Working Paper no. 297 (2001).
Aoki, M and H. Ando (written and Eds.), Modularization (Tokyo: TOYO KEIZAI Inc., 2000). (in
Japanese).
Aoki, M. and M. Okuno, Comparative Institutional Analysis of Economic Systems (Tokyo:
University of Tokyo Press, 1996). (in Japanese).
Baily, M. N. “Productivity Growth and Materials Use in U.S. Manufacturing,” Quarterly Journal of
Economics 101 (1986), 185-95.
Baldwin, C. Y. and Kim B. Clark, “Managing in an Age of Modularity,” Harvard Business Review
Sep./Oct. (1997), 99-120.
Baltagi, B. H., Econometric Analysis of Panel Data (New York: John Wiley & Sons, 1995).
Baltagi, B. H. and P. X. Wu, “Unequally spaced Panel Data Regressions with AR(1) Disturbances,”
Econometric Theory 15 (1999), 814-823.
Bartelsman, E. J. and M. Doms, “Understanding Productivity: Lessons from Longitudinal
Micro-data,” Journal of Economic Literature 38:3 (2000), 569-594.
Bartelsman, E. J. and W. Gray, “The NBER Manufacturing Productivity Database,” NBER, NBER
Technical Working Paper No. 205 (1996).
Basu, S., J. G. Fernald, N. Oulton and S. Srinivasan, “The Case of the Missing Productivity Growth:
Or, Does information technology explain why productivity accelerated in the United States
but not the United Kingdom?,” Federal Reserve Bank of Chicago, FRBC Working Paper No.
03-08 (2003).
Bond, S., C. Nauges and F. Windmeijer, “Unit Roots and Identification in Autoregressive Panel Data
Models: A Comparison of Alternative Tests,” No C5-4 in 10th International Conference on
Panel Data, Berlin, July 5-6, 2002 from International Conferences on Panel Data (2002).
Bosworth, B. P. and J. E. Triplett, “Services Productivity in the United States: Griliches’s Services
Volume Revisited,” prepared paper for NBER CRIW Conference in Memory of Zvi Griliches
(2003).
Breitung, J. and W. Meyer, “Testing for Unit Roots in Panel Data: Are Wages on Different Bargaining
Levels Cointegrated ?,” Applied Economics 26 (1994), 353-361.

Total Factor Productivity in Japanese Information Service Industries: Firm-Level Analysis
27
Brooks, Frederick P., Jr., The Mythical Man-Month: Essays on Software Engineering Anniversary
edition (New York: Addison-Wesley Publishing Company, 1995).
Cabinet Office, Annual Report on Economy and Finance (Tokyo: Government Printing Office, 2001).
(in Japanese).
Colecchia, A. and P. Schreyer, “ICT Investment and Economic Growth in the 1990s: Is the United
States a Unique Case? A Comparative Study of Nine OECD Countries,” OECD, OECD STI
Working Papers 2001/7 (2001).
Conference for Improving Software Development and Procurement Processes, “Toward Establishing
Evaluation Indexes of Software Development and Procurement Processes in Japan (Tentative
Version),” (2001). (in Japanese)
Cusumano, M., A. MacCormack, C. K. Kemerer and W. Crandall, “A Global Survey of Software
Development Practices,” MIT, MIT ebusiness Working Paper no. 178 (2003).
Ehrlich, I., G. Gallais-Hamonno, Z. Liu and R. Lutter, “Productivity Growth and Firm Ownership: an
analytical and empirical investigation,” Journal of Political Economy 102:5 (1994),
1006-1038.
Fraumeni, B. M., “The Measurement of Depreciation in the U.S. National Income and Product
Accounts,” Survey of Current Business July (1997), 7-23.
Fujimoto, T., “Japanese-Style Supplier Systems and Modularization – A Case of the Automobile
Industry,” in Aoki, M and H. Ando (Eds.), Modularization (Tokyo: Toyo Keizai, 2002). (in
Japanese).
Fukao, K., and H. U. Kwon,”Productivity and Economic Growth in Japan: Industry-Level and
Firm-Level Empirical Analysis,” Economic and Social Research Institute, Cabinet Office,
Government of Japan, ESRI Discussion Paper Series No. 66 (2003). (in Japanese).
Fukao, K., T. Miyagawa, H. Kawai, T. Inui, X. Yue, Y. Okumoto, K. Nakamura, M. Hayashida, K.
Nakata, T. Hashikawa, N. Okumura, Y. Murakami, S. Hamagata, Y. Yoshizawa, T. Maruyama,
and S. Yamauchi, “Industry-wise Productivity and Economic Growth: 1970-1998,”
Economic and Social Research Institute, Cabinet Office, Government of Japan, Economic
Analysis 170 (2003). (in Japanese).
Gort, M. and N. Sung, “Competition and Productivity Growth: the case of the US telephone
industry,” Economic Inquiry 37:4 (1999), 678-691.
Hall, R. E., “Invariance Properties of Solow’s Productivity Residual,” in P, Diamond (Ed), Growth /
Productivity / Unemployment (MIT Press, 1990).

Kiyohiko G. Nishimura・Futoshi Kurokawa
28
Hayashi, F., and E. Prescott, “The 1990s in Japan: A Lost Decade,” Review of Economic Dynamics 5
(2002), 206-235.
Honma, M., N. Atoda, F. Hayashi and K. Hata, “Equipment Investment and Corporate Tax Systems,”
Economic Planning Agency, Institute of Economic Studies, Research Series 41 (1984). (in
Japanese)
Hulten, C. R., “Introduction” in Hulten, C. R. (Eds), New Development in Productivity Analysis
(Chicago: The University of Chicago Press, 2001).
Im, K., H. Pesaran and Y. Shin, “Testing for Unit Roots in Heterogeneous Panels,” Journal of
Econometrics 115 (2003), 53-74.
Jorgenson, D. W., “Information Technology and the U.S. Economy,” American Economic Review
91:1 (2001), 1-31.
Koyama, Y., and Y. Takeda, “Process Structure of Computer Software Development: Its
Characteristics and Problems,” in Fujimoto, T., A. Takeishi and Y. Aoshima (Eds), Business
Architecture (Tokyo: Yuuhikaku, 2001). (in Japanese).
Levin, A., and C. F. Lin, “Unit root tests in Panel Data: Asymptotic and Finite-sample Properties,”
University of California, San Diego, Unpublished manuscript (1993).
Maddala, G. S., Introduction to Econometrics (New York: John Wiley & Sons Inc., 2001).
Maddala, G. S. and S. Wu, “A Comparative Study of Unit Root Tests with Panel Data and a New
Simple Test: Evidence From Simulations and the Bootstrap,” Oxford Bulletin of Economics
and Statistics 61 (1999), 631-652.
Ministry of International Trade and Economy, Industrial Policy Bureau, Research and Statistical
Division, Survey of Selected Service Industries, Information Service Industry Volume
(1991-1999).
Nakajima, T., Productivity Analysis of the Japanese Economy (Tokyo: Nihon Keizai Shinbunsha,
2001).
Nishimura, K. G., K. Minetaki, M. Shirai, and F. Kurokawa, “Industry Transformation: Is “New
Economy” Present in Japan?,” in Okuno-Fujiwara, M., A. Takemura and J. Shintaku (Eds.),
Electronic Society and Market Economy (Tokyo: Shinseisha, 2002). (in Japanese).
Nishimura, K. G., and M. Shirai, “Can Information and Communication Technology Solve Japan's
Productivity-Slowdown Problem?,” Asian Economic Papers 2:1 (2003), 85-139.
Nishimura, K. G., T. Nakajima and K. Kiyota, “Does Natural Selection Mechanism Still Work in
Severe Recessions? – Examination of the Japanese Economy in the 1990s –,” University of
Tokyo and Keio University, mimeo (2003), a revised version will appear in Journal of

Total Factor Productivity in Japanese Information Service Industries: Firm-Level Analysis
29
Economic Behavior and Organization.
OECD, “The Software Sector: Growth, Structure and Policy Issues,” OECD, DSTI/ICCP/IE(2002)/8,
(2002).
Sano, Y., “Outsourcing and the Role of ‘SHAIN (Regular Full-time Workers)’ in Information Service
Industries,” in H. Sato (Ed.), Employment Systems in Information-Technology Age (Tokyo:
Nihon Hyoron Sha, 2001), 93-116. (in Japanese).
Shintani, M., “Quantitative Analysis of Information Service Industries Based on Micro Data,”
available at http://www.seinan-gu.ac.jp/~shintani/b1.htm, (1998). (in Japanese).
Van Ark, B., Inklaar R. and R. H. McGuckin, “Changing Gear, Productivity, ICT and Service
Industries: Europe and the United States,” Groningen Growth and Development Center,
Research Memorandum GD-60 (2002).

Kiyohiko G. Nishimura・Futoshi Kurokawa
30
i There has been a sizable literature on productivity growth or technological progress. Hayashi and Prescott (2002) examine the movement of the TFP (total factor productivity) growth relying on neoclassical framework and argue that declined supply of labor coupled with declined TFP growth is one of the culprits of disappointing economic growth of Japan. Fukao et al. (2003), based on detailed industry-wise data as well as macro data, reveal a sharp decline in the TFP growth rate in aggregates and in many industries.
ii In the same token, Ark et al. (2002) show that the labor-productivity growth in Japanese IT-producing industries in the late 90s is 19.5%, which is roughly in line with 23.7% in the United States and 13.8% in EU.
iii In fact, US wholesale and retail trade sectors contribute greatly to overall productivity. Basu et al. (2003) claim that almost 70% of the overall TFP growth of the United States can be explained by the TFP growth of the wholesale and retail trade sectors.
iv However, Fukao and Kwon (2003) report that when they adjust quality of labor inputs and utilization of capital stocks in the traditional growth accounting framework, TFP growth rates in manufacturing sectors are rather low compared with rather high TFP growth rates in service sectors. They attribute rather good performance to deregulation in service industries. However, their procedure of “adjustment” seems inconsistent with basic assumptions of the growth accounting framework, notably perfect utilization, so that their result should be evaluated cautiously.
v Ahn (2001) touches service industries briefly in his survey of empirical results in productivity based on firm dynamics. He points out several problems in productivity analysis of service industries such as appropriate measurement of outputs, although importance of service industries is obvious in viewing its large share in GDP.
vi The JSIC (Japanese Standard Industry Classification) System was revised substantially in March 2002 (called 11th Revision). Before this revision, information service industries were classified to service industries, but after the revision, they now belong to a new 1-digit industry classification called “Information and Communication Industries”.
vii Most prominent is IBM. IBM’s divisional revenues now reveal that revenues from software and information service divisions exceed those from hardware divisions. IBM’s move prompts several Japanese firms to follow it.
viii CMM evaluates maturity or capability of software development in five levels. See Conference for Improving Software Development and Procurement Processes (2001).
ix Ahn (2001) and Bartelsman and Doms (2000) survey firm-level empirical analyses. Ahn examines non-manufacturing industries extensively.
x Sano (2001) examined the effect of outsourcing on information service industries based on case studies. Koyama and Takeda (2001) investigated software-development productivity, with special emphasis on modularization, referring to various cases in the industry.
xi In 1999 the share of custom software and prepackaged software is more than 60% of the total value-added of information service industries.
xii See Aoki and Okuno (1996) for an example of Japanese academic writing emphasizing this collaboration positively.
xiii Here “modularization” is to design complex products and processes consisting of small-scale subsystems that are independently designed (see Baldwin and Clark (1997)). The “small subsystems independently designed” are “modules”. So long as the “integrability” is maintained, each subsystem can be designed independently.
xiv API (application programming interface) is a part of OS that is used in application software development. Since Microsoft does not make source codes open for its WINDOWS OS, developers of WINDOWS application software cannot develop their software independently, which implies insufficient modularization. Such problems do not exist in computer hardware.
xv This is a clear warning against common practices that estimate the value of software products by wage times man-hours of programmers and system engineers who engage in developing these software products.
xvi See http://www.elysiuminc.com/. xvii See http://www.armonicos.co.jp/english/. xviii ASP is included if they develop software themselves. xix This is based on the data set supplied by the Statistics Bureau for our empirical study. xx There are other notable characteristics. First, the Survey asks the headquarters of firms to report the
total fixed capital stocks and the total operating expenses (and their breakdowns) of information service

Total Factor Productivity in Japanese Information Service Industries: Firm-Level Analysis
31
activities of the firms as a whole. This is very convenient in our constructing firm-level information-service activities’ value-added and capital stocks. However, categorized information-service activities’ labor input data (such as the number of system engineers) are available only at the establishment level. Thus, it is necessary to construct firm-level data of information-service activities’ labor input data from establishment data.
xxi One might argue, as Baily (1986) and Bartelsman and Gray (1996) do, that outputs of firms should be gross outputs rather than value-added. However, gross outputs seem not so appropriate in information service industries including the software industry, because outsourcing is prevalent in these indusries. Outsourcing is not usual inputs in production process and whether to outsource some of their business or not is a strategic decision rather than a technological constraint. In this case, the framework of gross production treating outsourcing as usual inputs may lead to misrepresentation of production function. See Hulten (2001) on this issue.
xxii Labor hours are estimated by multiplying the number of workers by the average work hours in information service industries, using the Monthly Labor Survey.
xxiii As for weights, we use those in the 1995 Input-Output Tables’ fixed-investment matrix data. xxiv Unfortunately however, we do not have an individual firm’s building and structure rent data directly.
We only have information about the percentage of building and structure rents in the total cost on the average. We construct imputed building rents relying on this average figure assuming individual building rents are not different from the average.
xxv Here we follow Hall (1990). xxvi The effective tax rates and the discounted value of future depreciation are calculated by using
information contained in the Annual Report of Incorporated Enterprise Statistics, the Annual Report on Finance of Local Governments, and the Survey on Incorporated Enterprises. We follow here the procedure of Homma et al. (1984).
xxvii Here we follow the method of the White Paper of the Cabinet Office. However, this five-year criterion might be too restrictive, so that we plan to relax this assumption in the future.
xxviii Although we have information about SE’s in establishments, we cannot aggregate them to get firm-level SE’s since the Survey does not collect information about what firm a particular establishment belongs to. Consequently, we are obliged to assume that the ratio of SE’s to the total work force at the headquarters is on the average its ratio for the firm as a whole. In particular, the firm-level number of SE’s in our study is calculated by multiplying the firm’s total number of information service workers by the ratio of SE’s to the information-service work force at the headquarters. The firm-level ratio of SE’s to the total information-service workers is calculated by using this figure.
xxix In addition, we show in Tables 2-3, Table 2-4 and Table 2-5 differences in averages for subcategories of our samples (custom software, prepackaged software, system management and administration, online database service) for different thresholds. To make comparison comparable, we results about single establishments in these tables.
xxx Firms that do not conform to any of four types are excluded from segment-wise estimations in the following empirical analysis.
xxxi We tried the number of programmers and that of research scientists in our preliminary analysis, but they did not have any significant effects on TFP. Thus, we excluded them in the present analysis.
xxxii See footnotes in Section 3.4 for the way these variables are constructed. xxxiii In firm-level panel cases, we can estimate the TFP level using Caves et al (1982) or Good et al
(1997) approach of estimating productivity differentials across the panel. Nishimura et al. (2003) estimate the TFP level and examine entry-exit dynamics of Japanese manufacturing firms by using a firm-level panel data based on the Basic Survey of Business Structure and Activities. However, we start here with first differences for analytic simplicity.
xxxiv In this way, we implicitly assume that TFP levels are non-stationary, which are likely since TFP changes are in many cases permanent technological changes. However, even if TFP-levels are stationary, OLS estimators of equation (2) (or (3)) remain consistent. See Maddala (2001).
xxxv There might be a possibility that lagged ijx may influence TFP in (1) (or (2), (3)). We estimate
correlation matrices of dependent variables and independent variables including lags to check this point. Estimated correlation matrices, however, suggest that TFP at t is correlated mostly with independent
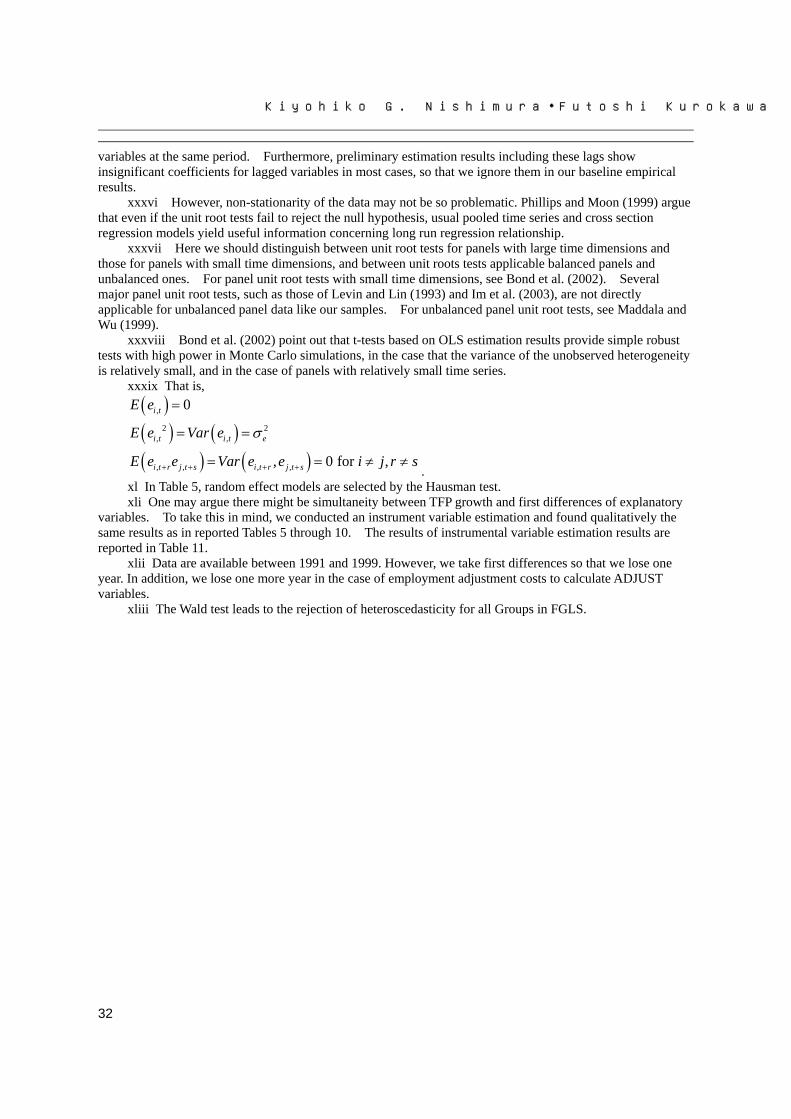
Kiyohiko G. Nishimura・Futoshi Kurokawa
32
variables at the same period. Furthermore, preliminary estimation results including these lags show insignificant coefficients for lagged variables in most cases, so that we ignore them in our baseline empirical results.
xxxvi However, non-stationarity of the data may not be so problematic. Phillips and Moon (1999) argue that even if the unit root tests fail to reject the null hypothesis, usual pooled time series and cross section regression models yield useful information concerning long run regression relationship.
xxxvii Here we should distinguish between unit root tests for panels with large time dimensions and those for panels with small time dimensions, and between unit roots tests applicable balanced panels and unbalanced ones. For panel unit root tests with small time dimensions, see Bond et al. (2002). Several major panel unit root tests, such as those of Levin and Lin (1993) and Im et al. (2003), are not directly applicable for unbalanced panel data like our samples. For unbalanced panel unit root tests, see Maddala and Wu (1999).
xxxviii Bond et al. (2002) point out that t-tests based on OLS estimation results provide simple robust tests with high power in Monte Carlo simulations, in the case that the variance of the unobserved heterogeneity is relatively small, and in the case of panels with relatively small time series.
xxxix That is, ( )( ) ( )( ) ( )
,
2 2, ,
, , , ,
0
, 0 for ,
i t
i t i t e
i t r j t s i t r j t s
E e
E e Var e
E e e Var e e i j r s
σ
+ + + +
=
= =
= = ≠ ≠.
xl In Table 5, random effect models are selected by the Hausman test. xli One may argue there might be simultaneity between TFP growth and first differences of explanatory
variables. To take this in mind, we conducted an instrument variable estimation and found qualitatively the same results as in reported Tables 5 through 10. The results of instrumental variable estimation results are reported in Table 11.
xlii Data are available between 1991 and 1999. However, we take first differences so that we lose one year. In addition, we lose one more year in the case of employment adjustment costs to calculate ADJUST variables.
xliii The Wald test leads to the rejection of heteroscedasticity for all Groups in FGLS.

Total Factor Productivity in Japanese Information Service Industries: Firm-Level Analysis
33
Table 1 The Numbers of Establishments in Information Service Industries (Survey of Selected Service Industries )
1991 1992 1993 1994 1995 1996 1997 1998Single 3563 3205 3041 2902 2822 3289 3186 4361
Headquarters 1702 1883 1708 1538 1496 1379 1338 1687Branch Offices 1831 1889 1683 1542 1494 1629 1568 2200
Total 7096 6977 6432 5982 5812 6297 6092 8248

Kiyohiko G. Nishimura・Futoshi Kurokawa
34
Table 2-1 Total Samples Excluding Negative Value-Added and Zero Workers: 1991-1998 Summary Statistics of Major Variables: Following variables are those of information service activities of firms.
Average Min. Max. # of Firms # of Firm-Year's
Labor Productivity Growth 0.0311 -8.0988 8.4861 7610 32060(0.4931)
Outsourcing to Sales Ratio 0.1378 0.0000 1.0000 10866 38746(0.1577)
Number of SE 31.7126 0.0000 9425.2220 10866 38746(142.3801)
SE to Total Work Force Ratio 0.2839 0.0000 1.0000 10866 38746(0.2567)
Profit to Operating Cost Rati 0.2827 -0.9608 161.0000 10846 38715(1.7481)
# of Workers 96.2852 1.0000 23668 10866 38746(324.0208)
Notes:
Standard deviations in parenthesis. "# of firms" column reports the number of firms with sufficient informationenabling the calculation.

Total Factor Productivity in Japanese Information Service Industries: Firm-Level Analysis
35
Table 2-2 Firms with Well-Established Information Service Activities: 1991-1998 Summary Statistics of Major Variables: Following variables are those of information service activities of firms.
Average Min. Max. # of Firms # of Firm-Year's
Labor Productivity Growth 0.0417 -4.1931 4.2479 1106 6117(0.3516)
Outsourcing to Sales Ratio 0.1482 0.0000 0.8898 1106 6117(0.1442)
Number of SE's 79.3533 0.0471 ######## 1106 6117(231.8276)
SE to Total Work Force Ratio 0.3789 0.0031 1.0000 1106 6117(0.2247)
Profit to Operating Cost Rati 0.2332 -0.6533 89.5953 1106 6117(1.3172)
# of Workers 193.2424 1.0000 9430 1106 6117(479.3581)
Notes:
Standard deviations in parenthesis.

Kiyohiko G. Nishimura・Futoshi Kurokawa
36
Table 2-3 Differences in Averages among Subcategories in Single Establishments: Case of 90% CriterionFirms whose particular segment's sales share exceeds more than 90% of their total information service sales
TFP growth 0.0341 0.0644 -0.1051 -0.0545(0.3962) (0.5534) (1.1670) (0.2027)
Labor Productivity Growth 0.0457 0.0471 0.1365 0.0638(0.3177) (0.4748) (1.0241) (0.1124)
Outsourcing to Sales Ratio 0.1626 0.0725 0.0546 0.0635(0.1502) (0.1071) (0.0760) (0.0492)
Number of SE's 42.4845 9.9575 10.2602 3.0500(140.5637) (25.1370) (20.3217) (2.4582)
SE to Total Work Force Rati 0.4912 0.3918 0.3546 0.1921(0.2160) (0.2428) (0.2009) (0.0637)
Profit to Operating Cost Rat 0.1473 0.4267 0.4897 0.0075(0.4017) (0.6632) (0.6779) (0.1306)
# of Workers 69.3514 24.7377 21.4444 16.9000(170.7314) (38.2829) (32.3246) (14.8208)
# of Firms 363 52 6 4# of Firm-Year's 1255 122 9 10
Notes:
The table shows breakdowns of firms with well-established information service activities. Standard deviations are inparenthesis.
Sales Share > 90%
Variable CustomSoftware
PrepackagedSoftware
SystemManagement
and
Online DataBase Service

Total Factor Productivity in Japanese Information Service Industries: Firm-Level Analysis
37
Table 2-4 Differences in Averages among Subcategories in Single Establishments: Case of 70% CriterionFirms whose particular segment's sales share exceeds more than 70% of their total information service sales
TFP growth 0.0281 0.0436 -0.0592 0.0612(0.3987) (0.5782) (0.6637) (0.4613)
Labor Productivity Growth 0.0464 0.0265 0.0980 0.0398(0.3182) (0.4522) (0.5967) (0.2270)
Outsourcing to Sales Ratio 0.1620 0.0805 0.1127 0.0509(0.1575) (0.1126) (0.1472) (0.0517)
Number of SE's 37.3376 12.1866 21.0377 3.0213(124.3926) (30.0798) (44.3199) (2.2421)
SE to Total Work Force Rati 0.4687 0.3836 0.2948 0.1685(0.2164) (0.2385) (0.2249) (0.0710)
Profit to Operating Cost Rati 0.1774 0.4620 0.2234 0.2670(0.5150) (0.7313) (0.4262) (0.8301)
# of Workers 64.4387 27.0452 100.7742 19.3889(153.3472) (40.2962) (136.4685) (13.3907)
# of Firms 458 74 18 10# of Firm-Year's 1680 177 31 18
Sales Share > 70%
Variable CustomSoftware
PrepackagedSoftware
SystemManagement
and
Online DataBase Service

Kiyohiko G. Nishimura・Futoshi Kurokawa
38
Table 2-5 Differences in Averages among Subcategories in Single Establishments: Case of 50% CriterionFirms whose particular segment's sales share exceeds more than 50% of their total information service sales
TFP growth 0.0250 0.0362 0.0810 -0.0010(0.4040) (0.5632) (0.7895) (0.4833)
Labor Productivity Growth 0.0425 0.0264 0.0765 0.0541(0.3202) (0.4457) (0.4346) (0.2134)
Outsourcing to Sales Ratio 0.1542 0.0894 0.1266 0.0487(0.1500) (0.1219) (0.1243) (0.0553)
Number of SE's 35.8617 9.9708 19.5121 3.0284(115.4218) (24.8576) (35.1353) (2.2996)
SE to Total Work Force Rati 0.4532 0.3440 0.2686 0.1723(0.2154) (0.2243) (0.2179) (0.1109)
Profit to Operating Cost Rat 0.1834 0.3748 0.2191 0.4587(0.5186) (0.6261) (0.5663) (1.5229)
# of Workers 64.9219 25.4161 103.2206 19.8184(144.3840) (35.6407) (133.3655) (12.6948)
# of Firms 527 113 35 13# of Firm-Year's 2010 274 68 27
Note:
The table shows breakdowns of firms with well-established information service activities. Standard deviations are inparenthesis.
Sales Share > 50%
Variable CustomSoftware
PrepackagedSoftware
SystemManagement
and
Online DataBase Service

Total Factor Productivity in Japanese Information Service Industries: Firm-Level Analysis
39
Table 3 Differences in Averages Among Different Organizational Changes: 1991-1998
All Group 1(Single) Group 2(Multi) Group 3(Expanded) Group 4(Shrunk)
TFP growth 0.0197 0.0179 0.0261 0.0239 0.0051(0.4631) (0.4164) (0.4139) (0.5017) (0.5198)
Labor Productivity Growth 0.0417 0.0403 0.0433 0.0510 0.0189(0.3516) (0.2972) (0.3079) (0.4273) (0.3943)
Outsourcing to Sales Ratio 0.1482 0.1309 0.1769 0.1549 0.1325(0.1442) (1.4703) (0.1508) (0.1465) (0.1276)
Number of SE's 79.3533 19.7731 174.3493 112.1807 34.6971######## (38.2180) ######## (308.3249) (81.3331)
SE to Total Work Force Ra 0.3789 0.3848 0.3699 0.3713 0.3639(0.2247) (0.2268) (0.2160) (0.2314) (0.2170)
Profit to Operating Cost R 0.2332 0.2048 0.2215 0.3755 0.2095(1.3172) (0.6716) (0.6480) (3.0485) (0.6760)
# of Workers 193.2424 50.0860 445.6522 258.7119 94.4569######## (69.6813) ######## (584.3632) (160.6008)
# of Firm-Year's 6117 1732 1294 899 788
Notes:The table shows breakdowns of firms with well-established information service activities. Standarddeviations are in parenthesis.All: all in our samples, Group 1: firms that remain single establishments throughout the sample period,Group 2: firms that have headquarters and branch offices throughout the sample period, Group 3:firms that start as single establishments and become multi-e4stablishment firms by the end of thesample period, Group 4: firms that start as multi-establishment firms and become singleestablishments by the end of the sample period.Because our samples are an unbalanced panel, the number of firms each year is not equal.
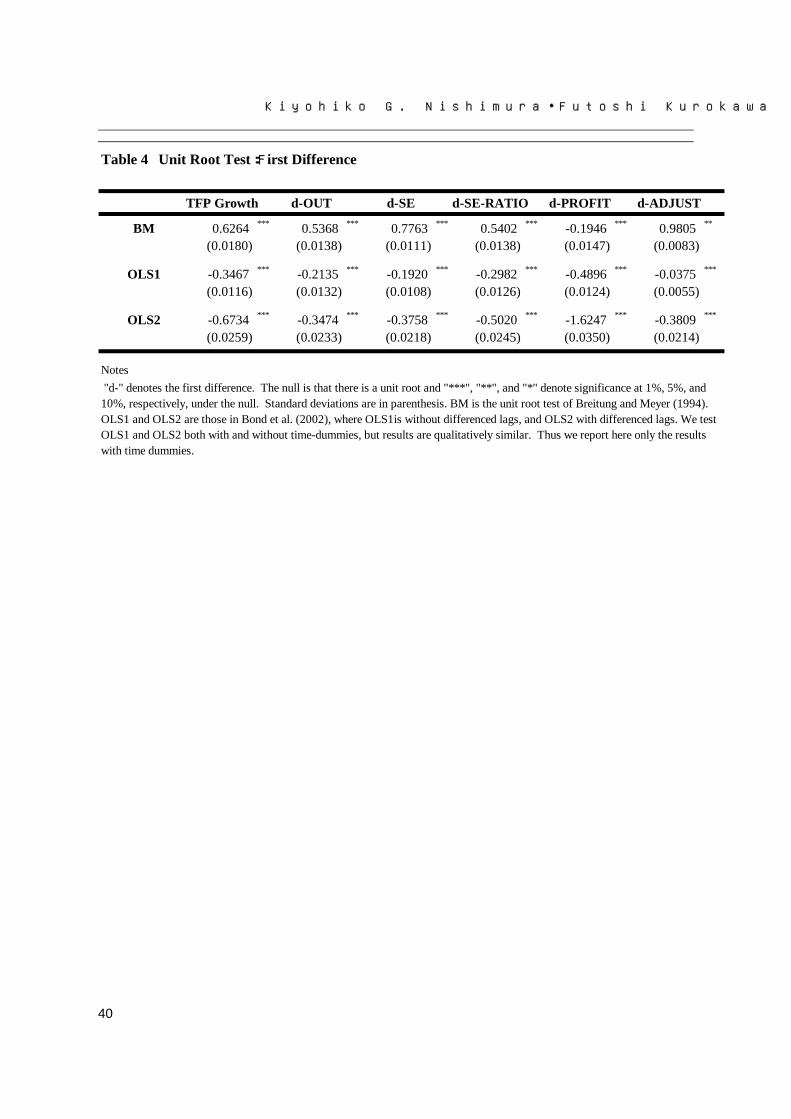
Kiyohiko G. Nishimura・Futoshi Kurokawa
40
Table 4 Unit Root Test:First Difference
TFP Growth d-OUT d-SE d-SE-RATIO d-PROFIT d-ADJUST
BM 0.6264 *** 0.5368 *** 0.7763 *** 0.5402 *** -0.1946 *** 0.9805 **
(0.0180) (0.0138) (0.0111) (0.0138) (0.0147) (0.0083)
OLS1 -0.3467 *** -0.2135 *** -0.1920 *** -0.2982 *** -0.4896 *** -0.0375 ***
(0.0116) (0.0132) (0.0108) (0.0126) (0.0124) (0.0055)
OLS2 -0.6734 *** -0.3474 *** -0.3758 *** -0.5020 *** -1.6247 *** -0.3809 ***
(0.0259) (0.0233) (0.0218) (0.0245) (0.0350) (0.0214)
Notes "d-" denotes the first difference. The null is that there is a unit root and "***", "**", and "*" denote significance at 1%, 5%, and10%, respectively, under the null. Standard deviations are in parenthesis. BM is the unit root test of Breitung and Meyer (1994).OLS1 and OLS2 are those in Bond et al. (2002), where OLS1is without differenced lags, and OLS2 with differenced lags. We testOLS1 and OLS2 both with and without time-dummies, but results are qualitatively similar. Thus we report here only the resultswith time dummies.

Total Factor Productivity in Japanese Information Service Industries: Firm-Level Analysis
41
Table 5 Estimation Results (PANEL OLS): 1991-1998
dependent variable: TFP growthAll Group 1(Single) Group 2(Multi)Group 3(Expanded)Group 4(Shrunk)
d-OUT -0.8310 *** -0.2803 ** -0.6004 *** -1.2221 *** -0.4295 **
(0.0670) (0.1223) (0.1351) (0.1807) (0.1846)
d-SE -0.1008 *** -0.0727 *** -0.1685 *** -0.0809 *** -0.2527 ***
(0.0129) (0.0274) (0.0298) (0.0305) (0.0344)
d-SE-RATIO 0.2838 *** 0.3445 *** 0.2181 * 0.2939 ** 0.6840 ***
(0.0547) (0.0974) (0.1157) (0.1378) (0.1577)
d-PROFIT 0.0753 *** 0.1998 *** 0.1417 *** 0.0494 *** 0.1704 ***
(0.0030) (0.0121) (0.0139) (0.0035) (0.0139)
d-D1992 0.1325 *** 0.0003 0.1902 *** 0.2909 *** -0.3861 ***
(0.0320) (0.0553) (0.0663) (0.0805) (0.0887)
d-D1993 0.0989 ** 0.0102 0.0914 0.2179 *** -0.2886 ***
(0.0313) (0.0540) (0.0640) (0.0785) (0.0902)
d-D1994 0.0402 -0.0652 0.0789 0.1341 * -0.2836 ***
(0.0294) (0.0505) (0.0593) (0.0741) (0.0873)
d-D1995 0.0745 *** 0.0318 0.0844 0.1305 * -0.2235 ***
(0.0267) (0.0455) (0.0534) (0.0682) (0.0796)
d-D1996 0.0869 *** 0.0593 0.0668 0.1047 * -0.1343 *
(0.0235) (0.0396) (0.0466) (0.0604) (0.0704)
d-D1997 0.0630 *** 0.0483 0.0512 0.1620 *** -0.1386 **
(0.0196) (0.0327) (0.0384) (0.0514) (0.0582)
d-D1998 0.0396 *** 0.0216 0.0537 * 0.0976 *** -0.0317(0.0142) (0.0234) (0.0277) (0.0378) (0.0417)
Constant 0.0380 *** 0.0227 ** 0.0512 *** 0.0611 *** -0.0531 ***
(0.0067) (0.0115) (0.0134) (0.0176) (0.0193)
Hausman Test 15.7500 9.3400 12.6300 1.9000 6.2800p-value 0.1508 0.5905 0.3185 0.9988 0.8543
fixed or random random random random random randomLM ####### *** ####### *** 66.9396 *** ####### *** 70.3953 ***
# of Firms 1106 318 231 156 143# of Firm-Year' 6117 1732 1294 899 788
Notes:"d-" denotes the first difference. D-year is a year dummy."***", "**", and "*" denote significance at 1%, 5%, and 10%, respectively.The table shows breakdowns of firms with well-established information service activities. Standard deviations are inparenthesis.All: all in our samples, Group 1: firms that remain single establishments throughout the sample period, Group 2: firmsthat have headquarters and branch offices throughout the sample period, Group 3: firms that start as singleestablishments and become multi-e4stablishment firms by the end of the sample period, Group 4: firms that start asmulti-establishment firms and become single establishments by the end of the sample period.Because our samples are an unbalanced panel, the number of firms each year is not equal.LM is joint LM test for serial correlation and random effects. See Baltagi (1995).

Kiyohiko G. Nishimura・Futoshi Kurokawa
42
Table 6 Estimation Results (PANEL-Random effects with AR1): 1991-1998
dependent variable: TFP growthAll Group 1(Single) Group 2(Multi)Group 3(Expanded)Group 4(Shrunk)
d-OUT -0.8499 *** -0.2765 ** -0.6086 *** -1.2614 *** -0.4255 **
(0.0679) (0.1232) (0.1359) (0.1826) (0.1850)
d-SE -0.1162 *** -0.0894 *** -0.1919 *** -0.0784 ** -0.2686 ***
(0.0132) (0.0278) (0.0306) (0.0311) (0.0348)
d-SE-RATIO 0.3221 *** 0.3841 *** 0.2611 ** 0.2946 ** 0.7199 ***
(0.0553) (0.0982) (0.1167) (0.1389) (0.1580)
d-PROFIT 0.0740 *** 0.2006 *** 0.1464 *** 0.0495 *** 0.1726 ***
(0.0030) (0.0119) (0.0141) (0.0034) (0.0139)
d-D1992 -0.1849 *** -0.0035 -0.2999 *** -0.3672 *** 0.4848 ***
(0.0409) (0.0702) (0.0837) (0.1023) (0.1118)
d-D1993 -0.2090 *** -0.0871 -0.2135 ** -0.3777 *** 0.3929 ***
(0.0412) (0.0702) (0.0851) (0.1039) (0.1123)
d-D1994 -0.1132 *** 0.0883 -0.1926 ** -0.3011 *** 0.4519 ***
(0.0407) (0.0690) (0.0841) (0.1016) (0.1118)
d-D1995 -0.1376 *** 0.0162 -0.2173 *** -0.3195 *** 0.4785 ***
(0.0402) (0.0680) (0.0832) (0.1013) (0.1097)
d-D1996 -0.1730 *** -0.0225 -0.2155 *** -0.2383 *** 0.3863 ***
(0.0402) (0.0680) (0.0832) (0.1003) (0.1114)
d-D1997 -0.1736 *** -0.0391 -0.1972 ** -0.3595 *** 0.4972 ***
(0.0404) (0.0686) (0.0833) (0.1011) (0.1116)
d-D1998 -0.1891 *** -0.0330 -0.2536 *** -0.3908 *** 0.4202 ***
(0.0405) (0.0685) (0.0835) (0.1010) (0.1117)
cosntant 0.1875***
0.0345 0.2513***
0.3557***
-0.4434***
(0.0377) (0.0642) (0.0783) (0.0940) (0.1020)
AR1 Coefficent -0.1273 -0.0991 -0.1454 -0.1107 -0.0869
# of Firms 1106 318 231 156 143# of Firm-Year' 6117 1732 1294 899 788Notes:d- denotes the first difference. D-year is a year dummy.
"***", "**", and "*" denote significance at 1%, 5%, and 10%, respectively.The table shows breakdowns of firms with well-established information service activities. Standard deviations are inparenthesis.All: all in our samples, Group 1: firms that remain single establishments throughout the sample period, Group 2: firmsthat have headquarters and branch offices throughout the sample period, Group 3: firms that start as singleestablishments and become multi-e4stablishment firms by the end of the sample period, Group 4: firms that start asmulti-establishment firms and become single establishments by the end of the sample period.Because our samples are an unbalanced panel, the number of firms each year is not equal.Assuming that the disturbances follow an AR(1) process

Total Factor Productivity in Japanese Information Service Industries: Firm-Level Analysis
43
Table 7 Estimation Results (FGLS): 1991-1998
dependent variable: TFP growthAll Group 1(Single) Group 2(Multi)Group 3(Expanded)Group 4(Shrunk)
d-OUT -0.6283 *** -0.2063 *** -0.3336 *** -1.0684 *** -0.4127 ***
(0.0197) (0.0344) (0.0640) (0.0613) (0.0496)
d-SE -0.0762 *** -0.0880 *** -0.1156 *** -0.0691 *** -0.1877 ***
(0.0050) (0.0104) (0.0132) (0.0158) (0.0191)
d-SE-RATIO 0.2405 *** 0.4207 *** 0.2165 *** 0.2622 *** 0.5558 ***
(0.0153) (0.0371) (0.0436) (0.0579) (0.0637)
d-PROFIT 0.1049 *** 0.2153 *** 0.2058 *** 0.0595 *** 0.2083 ***
(0.0031) (0.0052) (0.0113) (0.0065) (0.0099)
d-D1992 0.0811 *** 0.0239 0.1478 *** 0.1759 *** -0.2940 ***
(0.0113) (0.0294) (0.0120) (0.0411) (0.0441)
d-D1993 0.0512 *** 0.0274 0.0844 *** 0.1122 *** -0.2227 ***
(0.0101) (0.0271) (0.0125) (0.0365) (0.0424)
d-D1994 0.0193 ** -0.0350 0.0624 *** 0.0555 * -0.2289 ***
(0.0092) (0.0237) (0.0118) (0.0308) (0.0365)
d-D1995 0.0601 *** 0.0583 *** 0.0705 *** 0.0682 *** -0.1795 ***
(0.0077) (0.0191) (0.0104) (0.0260) (0.0308)
d-D1996 0.0715 *** 0.0805 *** 0.0471 *** 0.0735 *** -0.1035 ***
(0.0065) (0.0150) (0.0092) (0.0207) (0.0237)
d-D1997 0.0552 *** 0.0543 *** 0.0307 *** 0.1144 *** -0.1186 ***
(0.0050) (0.0118) (0.0055) (0.0163) (0.0184)
d-D1998 0.0302 *** 0.0143 0.0236 *** 0.0725 *** -0.0236 *
(0.0038) (0.0093) (0.0066) (0.0136) (0.0131)
constant 0.0285 *** 0.0237 *** 0.0439 *** 0.0480 *** -0.0387 ***
(0.0020) (0.0050) (0.0026) (0.0076) (0.0075)
Log likelihood ####### ####### ####### 23.4631 #######Wald Test : p-val 0.0000 0.0000 0.0000 0.0000 0.0000
# of Firms 1086 315 226 154 139
# of Firm-Year's 6097 1729 1289 897 784
Note:d- denotes the first difference. D-year is a year dummy.
"***", "**", and "*" denote significance at 1%, 5%, and 10%, respectively.The table shows breakdowns of firms with well-established information service activities. Standard deviations are inparenthesis.All: all in our samples, Group 1: firms that remain single establishments throughout the sample period, Group 2: firms thathave headquarters and branch offices throughout the sample period, Group 3: firms that start as single establishments andbecome multi-e4stablishment firms by the end of the sample period, Group 4: firms that start as multi-establishment firmsand become single establishments by the end of the sample period.Because our samples are an unbalanced panel, the number of firms each year is not equal.Wald Test is the test statistic asymptotically distributed as chi-square(k) under the null of heteroscedasticity where k

Kiyohiko G. Nishimura・Futoshi Kurokawa
44
Table 8 Estimation Results with ADJUST (PANEL): 1991-1997
dependent variable: TFP growthAll Group 1(Single) Group 2(Multi)Group 3(Expanded)Group 4(Shrunk)
d-OUT -0.7918 *** -0.2750 ** -0.4778 *** -1.2134 *** -0.3968 **
(0.0737) (0.1374) (0.1469) (0.1941) (0.1873)
d-SE -0.1049 *** -0.0637 ** -0.1891 *** -0.1540 *** -0.3505 ***
(0.0141) (0.0299) (0.0333) (0.0427) (0.0402)
d-SE-RATIO 0.2686 *** 0.3284 *** 0.2789 ** 0.4825 *** 0.9846 ***
(0.0597) (0.1062) (0.1279) (0.1634) (0.1672)
d-PROFIT 0.0714 *** 0.1877 *** 0.1992 *** 0.0451 *** 0.2760 ***
(0.0032) (0.0128) (0.0181) (0.0035) (0.0191)d-ADJUST -0.0231 *** 0.0060 -0.0482 ** -0.0274 ** 0.0827 ***
(0.0063) (0.0204) (0.0236) (0.0113) (0.0191)
d-D1992 0.0628 * 0.0010 0.0761 0.2403 *** -0.2182 **
(0.0358) (0.0626) (0.0814) (0.0810) (0.0915)
d-D1993 0.0329 0.0048 0.0008 0.1584 ** -0.1657 *
(0.0335) (0.0584) (0.0733) (0.0770) (0.0883)
d-D1994 -0.0215 -0.0744 -0.0027 0.0670 -0.1660 **
(0.0301) (0.0520) (0.0648) (0.0705) (0.0812)
d-D1995 0.0166 0.0178 0.0061 0.0604 -0.1428 **
(0.0258) (0.0442) (0.0548) (0.0625) (0.0698)
d-D1996 0.0363 * 0.0422 0.0011 0.0359 -0.0762(0.0209) (0.0354) (0.0431) (0.0520) (0.0572)
d-D1997 0.0181 0.0314 -0.0088 0.0909 ** -0.1000 **
(0.0148) (0.0247) (0.0295) (0.0383) (0.0407)
constant 0.0343 *** 0.0267 * 0.0436 ** 0.0694 *** -0.0314(0.0080) (0.0139) (0.0171) (0.0194) (0.0213)
Hausman Test 9.8200 5.3000 9.6000 4.5900 2.0900p-value 0.5469 0.9157 0.5665 0.9493 0.9982
fixed or random random random random random randomLM ####### *** 78.7613 *** 31.3115 *** 63.4210 *** 18.5245 ***
# of Firms 1096 318 228 155 140# of Firm-Year' 5103 1439 1085 752 656
Note:"d-" denotes the first difference. D-year is a year dummy. ADJUST is the squared rate of change in employment."***", "**", and "*" denote significance at 1%, 5%, and 10%, respectively.The table shows breakdowns of firms with well-established information service activities. Standard deviations are inparenthesis.All: all in our samples, Group 1: firms that remain single establishments throughout the sample period, Group 2: firmsthat have headquarters and branch offices throughout the sample period, Group 3: firms that start as singleestablishments and become multi-e4stablishment firms by the end of the sample period, Group 4: firms that start asmulti-establishment firms and become single establishments by the end of the sample period.Because our samples are an unbalanced panel, the number of firms each year is not equal.LM is joint LM test for serial correlation and random effects. See Baltagi (1995).

Total Factor Productivity in Japanese Information Service Industries: Firm-Level Analysis
45
Table 9 Estimation Results with ADJUST (PANEL-Random Effects with AR1): 1991-1997
dependent variable: TFP growthAll Group 1(Single) Group 2(Multi)Group 3(Expanded)Group 4(Shrunk)
d-OUT -0.8119 *** -0.2701 * -0.4910 *** -1.2519 *** -0.4050 **
(0.0747) (0.1385) (0.1477) (0.1983) (0.1888)
d-SE -0.1184 *** -0.0817 *** -0.2045 *** -0.1423 *** -0.3724 ***
(0.0144) (0.0305) (0.0340) (0.0431) (0.0410)
d-SE-RATIO 0.3009 *** 0.3723 *** 0.3022 ** 0.4573 *** 1.0293 ***
(0.0604) (0.1074) (0.1290) (0.1646) (0.1685)
d-PROFIT 0.0707 *** 0.1879 *** 0.2058 *** 0.0459 *** 0.2708 ***
(0.0031) (0.0127) (0.0184) (0.0035) (0.0188)d-ADJUST -0.0245 *** 0.0069 -0.0508 ** -0.0246 ** 0.0840 ***
(0.0065) (0.0208) (0.0243) (0.0115) (0.0197)
d-D1992 -0.1057 ** -0.0126 -0.1519 -0.3291 *** 0.2730 **
(0.0459) (0.0797) (0.1030) (0.1050) (0.1172)
d-D1993 -0.1294 *** -0.0935 -0.0798 -0.3384 *** 0.2179 *
(0.0461) (0.0799) (0.1020) (0.1071) (0.1188)
d-D1994 -0.0338 0.0813 -0.0663 -0.2593 ** 0.2536 **
(0.0457) (0.0788) (0.1016) (0.1052) (0.1184)
d-D1995 -0.0551 0.0103 -0.0806 -0.2726 *** 0.2894 **
(0.0454) (0.0780) (0.1017) (0.1050) (0.1161)
d-D1996 -0.0914 ** -0.0245 -0.0857 -0.1936 * 0.2013 *
(0.0454) (0.0783) (0.1015) (0.1043) (0.1166)
d-D1997 -0.0927 ** -0.0464 -0.0675 -0.3415 *** 0.3253 ***
(0.0456) (0.0784) (0.1018) (0.1054) (0.1181)
constant 0.1085 ** 0.0413 0.1196 0.3176 *** -0.2548 *
(0.0430) (0.0744) (0.0974) (0.0975) (0.1092)
AR1 Coefficient -0.1263 -0.1083 -0.1082 -0.1525 -0.1230
# of Firms 1096 318 228 155 140
# of Firm-Year' 5103 1439 1085 752 656
Note:"d-" denotes the first difference. D-year is a year dummy. ADJUST is the squared rate of change in employment."***", "**", and "*" denote significance at 1%, 5%, and 10%, respectively.The table shows breakdowns of firms with well-established information service activities. Standard deviations are inparenthesis.All: all in our samples, Group 1: firms that remain single establishments throughout the sample period, Group 2: firmsthat have headquarters and branch offices throughout the sample period, Group 3: firms that start as singleestablishments and become multi-e4stablishment firms by the end of the sample period, Group 4: firms that start asmulti-establishment firms and become single establishments by the end of the sample period.Because our samples are an unbalanced panel, the number of firms each year is not equal.

Kiyohiko G. Nishimura・Futoshi Kurokawa
46
Table 10 Estimation Results with ADJUST (FGLS): 1991-1998
dependent variable: TFP growthAll Group 1(Single) Group 2(Multi)Group 3(Expanded)Group 4(Shrunk)
d-OUT -0.6106 *** -0.3067 *** -0.2908 *** -1.0146 *** -0.2881 ***
(0.0170) (0.0382) (0.0490) (0.0507) (0.0519)
d-SE -0.0951 *** -0.0708 *** -0.1661 *** -0.1667 *** -0.3081 ***
(0.0030) (0.0099) (0.0145) (0.0209) (0.0151)
d-SE-RATIO 0.2669 *** 0.3764 *** 0.2980 *** 0.5281 *** 0.9632 ***
(0.0137) (0.0255) (0.0474) (0.0475) (0.0446)
d-PROFIT 0.0852 *** 0.2146 *** 0.2943 *** 0.0464 *** 0.3653 ***
(0.0025) (0.0079) (0.0173) (0.0057) (0.0162)d-ADJUST -0.0281 *** 0.0160 -0.0499 *** -0.0393 *** 0.1108 ***
(0.0023) (0.0112) (0.0088) (0.0061) (0.0127)
d-D1992 0.0101 0.0331 0.0487 *** 0.0967 *** -0.1802 ***
(0.0106) (0.0305) (0.0181) (0.0361) (0.0343)
d-D1993 -0.0144 0.0340 0.0085 0.0366 -0.1118 ***
(0.0090) (0.0268) (0.0166) (0.0325) (0.0340)
d-D1994 -0.0465 *** -0.0391 * 0.0009 -0.0262 -0.1091 ***
(0.0074) (0.0220) (0.0149) (0.0269) (0.0294)
d-D1995 -0.0014 0.0419 ** 0.0163 -0.0168 -0.0919 ***
(0.0058) (0.0170) (0.0127) (0.0204) (0.0219)
d-D1996 0.0259 *** 0.0657 *** 0.0010 -0.0070 -0.0388 **
(0.0039) (0.0118) (0.0093) (0.0144) (0.0153)
d-D1997 0.0091 *** 0.0467 *** -0.0086 0.0572 *** -0.0763 ***
(0.0028) (0.0079) (0.0072) (0.0101) (0.0110)
constant 0.0281 *** 0.0303 *** 0.0396 *** 0.0494 *** -0.0252 ***
(0.0019) (0.0053) (0.0038) (0.0075) (0.0070)
Log likelihood ####### ####### ####### 67.5614 91.2821Wald Test: p-valu 0.0000 0.0000 0.0000 0.0000 0.0000
# of Firms 1066 310 220 151 137# of Firm-Year's 5073 1431 1077 748 653
Note:"d-" denotes the first difference. D-year is a year dummy. ADJUST is the squared rate of change in employment."***", "**", and "*" denote significance at 1%, 5%, and 10%, respectively.The table shows breakdowns of firms with well-established information service activities. Standard deviations are inparenthesis.All: all in our samples, Group 1: firms that remain single establishments throughout the sample period, Group 2: firms thathave headquarters and branch offices throughout the sample period, Group 3: firms that start as single establishments andbecome multi-e4stablishment firms by the end of the sample period, Group 4: firms that start as multi-establishment firmsand become single establishments by the end of the sample period.Because our samples are an unbalanced panel, the number of firms each year is not equal.Wald Test is the test statistic asymptotically distributed as chi-square(k) under the null of heteroscedasticity, where k

Total Factor Productivity in Japanese Information Service Industries: Firm-Level Analysis
47
Table 11 Estimation Results (IV Method, Random Effects Model): 1992-1998
dependent variable: TFP growthAll Group 1(Single) Group 2(Multi)Group 3(Expanded)Group 4(Shrunk)
d-OUT -1.3809 *** 0.3045 -1.2141 ** -2.4283 ** -0.9453(0.3041) (0.7727) (0.4942) (1.1603) (0.9589)
d-SE -0.8234 *** -1.4139 *** -1.0901 *** -0.0282 -1.6316 ***
(0.1059) (0.3643) (0.2339) (0.3808) (0.3120)
d-SE-RATIO 2.0495 *** 3.8917 *** 2.2545 *** 0.2646 4.0471 ***
(0.3161) (1.0640) (0.6611) (1.1460) (0.9808)
d-PROFIT 0.0404 *** 0.2062 *** 0.1083 *** 0.0404 *** 0.2163 ***
(0.0074) (0.0436) (0.0347) (0.0138) (0.0742)
d-D1993 -0.0910 ** -0.1432 ** -0.0723 -0.0477 -0.1925 *
(0.0289) (0.0641) (0.0665) (0.0556) (0.1087)
d-D1994 -0.1632 -0.2358 *** -0.1497 ** -0.1085 -0.2985 **
(0.0312) (0.0688) (0.0688) (0.0716) (0.1322)
d-D1995 -0.1100 *** -0.1467 ** -0.1380 ** -0.0626 -0.2435 **
(0.0301) (0.0676) (0.0662) (0.0744) (0.1192)
d-D1996 -0.0700 *** -0.1170 * -0.1153 ** -0.0487 -0.2050 *
(0.0268) (0.0615) (0.0580) (0.0750) (0.1105)
d-D1997 -0.0255 -0.0191 -0.0521 0.0534 -0.1296(0.0211) (0.0423) (0.0444) (0.0592) (0.0863)
d-D1998 -0.0079 -0.0320 0.0130 0.0590 0.0186(0.0151) (0.0314) (0.0308) (0.0411) (0.0607)
Constant 0.0218 ** 0.0288 * 0.0263 0.0159 -0.0154(0.0089) (0.0157) (0.0342) (0.0197) (0.0341)
# of Firms 1086 315 226 153 139# of Firm-Year' 5346 1535 1108 786 700
Notes:"d-" denotes the first difference. D-year is a year dummy."***", "**", and "*" denote significance at 1%, 5%, and 10%, respectively.The table shows breakdowns of firms with well-established information service activities. Standard deviations are inparenthesis.All: all in our samples, Group 1: firms that remain single establishments throughout the sample period, Group 2:firms that have headquarters and branch offices throughout the sample period, Group 3: firms that start as singleestablishments and become multi-e4stablishment firms by the end of the sample period, Group 4: firms that start asmulti-establishment firms and become single establishments by the end of the sample period.Because our samples are an unbalanced panel, the number of firms each year is not equal.Instruments are the first lags of explanately variables.

Kiyohiko G. Nishimura・Futoshi Kurokawa
48
Table 12 The Government-Dependency Dummy (FGLS): 1991-1998
dependent variable: TFP growth
d-OUT -0.6113 *** -0.6011 *** -0.6072 *** -0.5986 ***
(0.0201) (0.0208) (0.0202) (0.0210)d-SE -0.0780 *** -0.0789 *** -0.0784 *** -0.0787 ***
(0.0050) (0.0050) (0.0050) (0.0050)d-SE-RATIO 0.2481 *** 0.2494 *** 0.2484 *** 0.2497 ***
(0.0154) (0.0155) (0.0154) (0.0155)d-PROFIT 0.1067 *** 0.1075 *** 0.1071 *** 0.1077 ***
(0.0032) (0.0032) (0.0032) (0.0032)d-D1992 0.0828 *** 0.0836 *** 0.0839 *** 0.0831 ***
(0.0113) (0.0113) (0.0114) (0.0114)d-D1993 0.0517 *** 0.0526 *** 0.0528 *** 0.0523 ***
(0.0101) (0.0101) (0.0101) (0.0101)d-D1994 0.0203 ** 0.0210 ** 0.0211 ** 0.0207 **
(0.0092) (0.0091) (0.0092) (0.0092)d-D1995 0.0580 *** 0.0578 *** 0.0584 *** 0.0575 ***
(0.0077) (0.0077) (0.0077) (0.0077)d-D1996 0.0678 *** 0.0673 *** 0.0680 *** 0.0674 ***
(0.0065) (0.0065) (0.0065) (0.0065)d-D1997 0.0510 *** 0.0499 *** 0.0508 *** 0.0497 ***
(0.0051) (0.0052) (0.0051) (0.0052)d-D1998 0.0269 *** 0.0263 *** 0.0268 *** 0.0261 ***
(0.0039) (0.0039) (0.0039) (0.0039)Gov Dummy -0.0174 *** -0.0191 *** -0.0216 *** -0.0141 **
(0.0039) (0.0048) (0.0040) (0.0056)Constant 0.0304 *** 0.0306 *** 0.0302 *** 0.0299 ***
(0.0020) (0.0020) (0.0020) (0.0020)
Log likelihood 610.1253 609.8844 612.0432 610.3230Wald Test: p-valu 0.0000 0.0000 0.0000 0.0000# of Firms withGov_Dummy = 1 111 78 60 44
# of Firms 1086 1086 1086 1086# of Firm-Year's 6097 6097 6097 6097Note:"d-" denotes the first difference. D-year is a year dummy. Gov_Dummy is a dummy that indicates large share of salesto government."***", "**", and "*" denote significance at 1%, 5%, and 10%, respectively.The table shows breakdowns of firms with well-established information service activities. Standard deviations are inparenthesis.All: all in our samples, Group 1: firms that remain single establishments throughout the sample period, Group 2: firmsthat have headquarters and branch offices throughout the sample period, Group 3: firms that start as singleestablishments and become multi-e4stablishment firms by the end of the sample period, Group 4: firms that start asmulti-establishment firms and become single establishments by the end of the sample period.Because our samples are an unbalanced panel, the number of firms each year is not equal.Wald Test is the test statistic asymptotically distributed as chi-square(k) under the null of heteroscedasticity, where kdenotes the number of firms.
Gov_Dummy = 1If Gov
Share>20%
Gov_Dummy = 1If Gov
Share>30%
Gov_Dummy = 1If Gov Share >
40%
Gov_Dummy = 1If Gov Share >
50%

Total Factor Productivity in Japanese Information Service Industries: Firm-Level Analysis
49