Embed Size (px)
Citation preview

Mixotrophic Cultivation Of The Microalga Scenedesmusobliquus With Reused Municipal Wastewater
Item Type text; Electronic Thesis
Authors Liao, Yang
Publisher The University of Arizona.
Rights Copyright © is held by the author. Digital access to this materialis made possible by the University Libraries, University of Arizona.Further transmission, reproduction or presentation (such aspublic display or performance) of protected items is prohibitedexcept with permission of the author.
Download date 16/06/2018 11:13:34
Link to Item http://hdl.handle.net/10150/332836

MIXOTROPHIC CULTIVATION OF THE MICROALGA
Scenedesmus obliquus WITH REUSED MUNICIPAL WASTEWATER
by
Yang Liao
____________________________
A Thesis Submitted to the Faculty of the
DEPARTMENT OF AGRICULTURAL AND BIOSYSTEMS ENGINEERING
In Partial Fulfillment of the Requirements
For the Degree of
MASTER OF SCIENCE
In the Graduate College
THE UNIVERSITY OF ARIZONA
2014

2
STATEMENT BY AUTHOR
This thesis has been submitted in partial fulfillment of requirements for an advanced degree at
the University of Arizona and is deposited in the University Library to be made available to
borrowers under rules of the Library.
Brief quotations from this thesis are allowable without special permission, provided that
an accurate acknowledgement of the source is made. Requests for permission for extended
quotation from or reproduction of this manuscript in whole or in part may be granted by the head
of the major department or the Dean of the Graduate College when in his or her judgment the
proposed use of the material is in the interests of scholarship. In all other instances, however,
permission must be obtained from the author.
SIGNED: Yang Liao
APPROVAL BY THESIS DIRECTOR
This thesis has been approved by the data shown below:
08/07/2014
Dr. Joel L. Cuello Date

3
Table of Contents
LIST OF TABLES .......................................................................................................................... 6
LIST OF FIGURES ........................................................................................................................ 8
ABSTRACT .................................................................................................................................. 10
1. Introduction ............................................................................................................................... 11
2. Background ............................................................................................................................... 14
2.1 Microalgae ........................................................................................................................... 14
2.2 Scenedesmus obliquus ......................................................................................................... 15
2.3 Carbon, Nitrogen, and Phosphorus sources for algae cultivation ....................................... 16
2.4 Photoautotrophic, Heterotrophic and Mixotrophic of algae cultivation ............................. 18
2.5 Municipal wastewater treatment using algae ...................................................................... 19
2.6 Algae grown in imitation wastewater.................................................................................. 21
3. Materials and Methods .............................................................................................................. 22
3.1 Microorganism .................................................................................................................... 22
3.2 Algae cultivation apparatus ................................................................................................. 23
3.2.1 The aeration system ...................................................................................................... 24
3.2.2 The mechanical mixing system .................................................................................... 25
3.2.3 The lighting system ...................................................................................................... 26
3.3 Culture medium ................................................................................................................... 26
3.4 Experimental setup .............................................................................................................. 28

4
3.5 Analytical methods .............................................................................................................. 29
3.6 Statistical method ................................................................................................................ 32
4 Results and discussion ............................................................................................................... 33
4.1 Cultivation in basic wastewater (bww) ............................................................................... 33
4.2 Cause for limited algae growth in basic wastewater cultivation (bww) ............................. 35
4.2.1 Cultivation in nutrient-enriched wastewater................................................................. 35
4.2.2 Cultivation in wastewater with added Tris buffer (bww+Tris) .................................... 37
4.2.3 Effect of CO2 aeration on medium pH ......................................................................... 40
4.3 Cause of pH drop in wastewater medium ........................................................................... 42
4.3.1 Cultivation using Alternate C and N sources ............................................................... 42
4.3.2 Cultivation in Alternative N source MF medium (ANMF) .......................................... 51
4.4 Maintaining the pH and improving biomass productivity .................................................. 54
4.4.1 Cultivation in wastewater with Tris and acetic acid added (bww+Tris+Ac) ............... 54
4.4.2 Cultivation in wastewater with Tris and sodium acetate added (bww+Tris+NaOAc) . 58
4.5 Investigation into nutrient deficiency of the wastewater medium ...................................... 61
4.5.1 Cultivation in nutrient-enriched wastewater with Tris and acetic acid added .............. 61
4.6 Heterotrophic cultivation of wastewater medium and morphology analysis ...................... 76
4.6.1 Heterotrophic cultivation in basic wastewater with added Tris buffer ......................... 76
4.6.2 Heterotrophic cultivation in alternative N source wastewater medium ....................... 83
5 Conclusions ................................................................................................................................ 90

5
5.1 Basic wastewater cultivation ............................................................................................... 90
5.2 pH drop during the culture and its mechanism ................................................................... 90
5.3 Methods to maintain pH of the wastewater culture............................................................. 91
5.4 Investigation for nutrients deficiency .................................................................................. 92
5.5 Heterotrophic cultivation and the morphology difference .................................................. 92
5.6 Summary ............................................................................................................................. 94
5.7 Future work ......................................................................................................................... 96

6
LIST OF TABLES
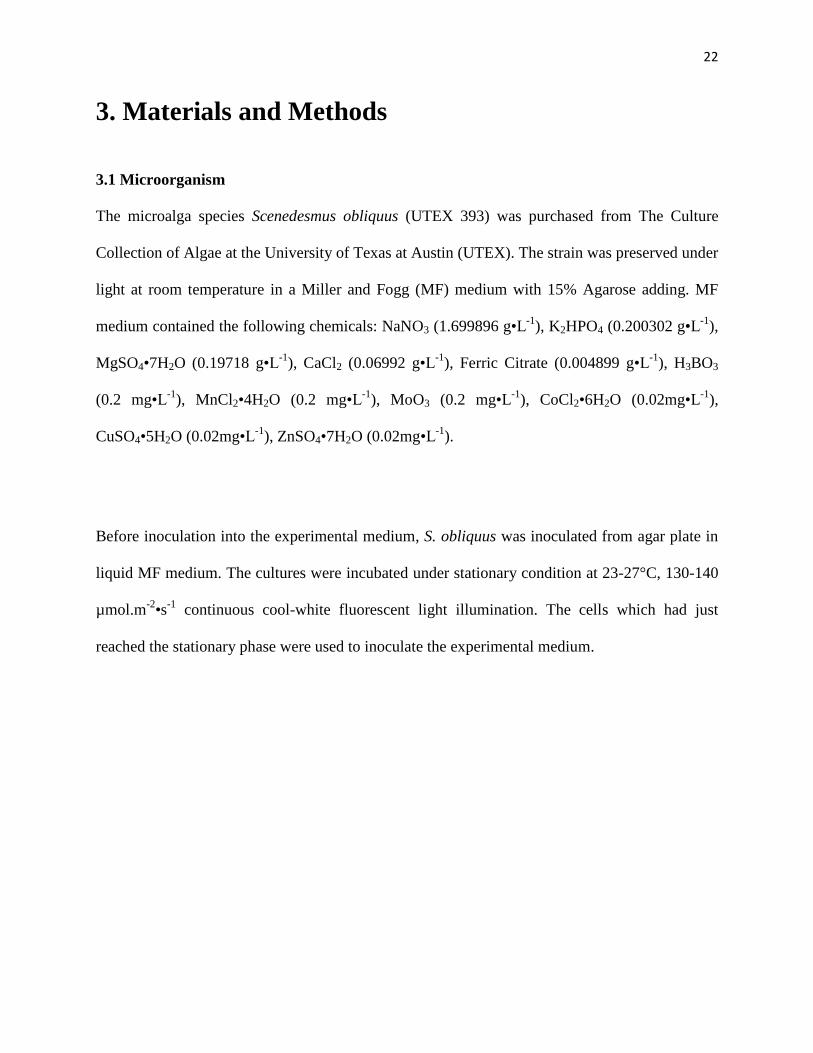
Table 1. Chemical compositions of Miller - Fogg medium and imitation wastewater medium. . 27
Table 2. Comparison of the parameters of imitation wastewater medium and real world
wastewater..................................................................................................................................... 28
Table 3. Comparison of Carbon, Nitrogen, Phosphorus sources and buffer in MF medium and
basic imitation wastewater (bww) medium. ................................................................................. 33
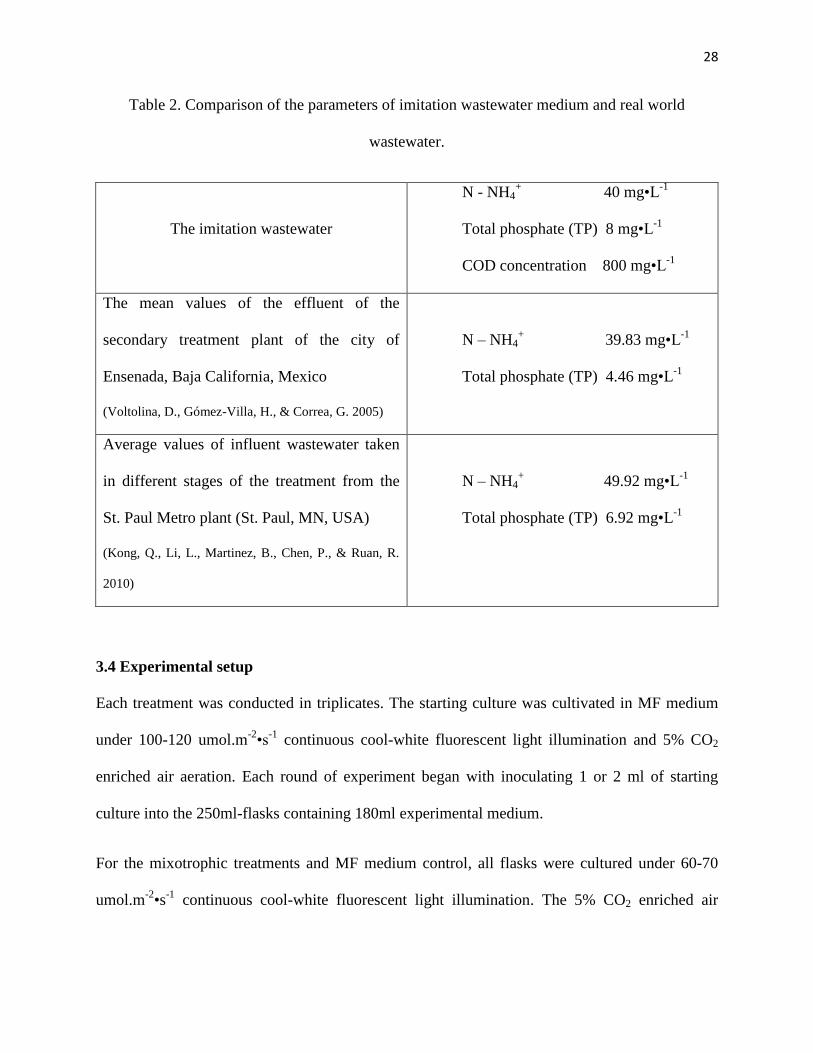
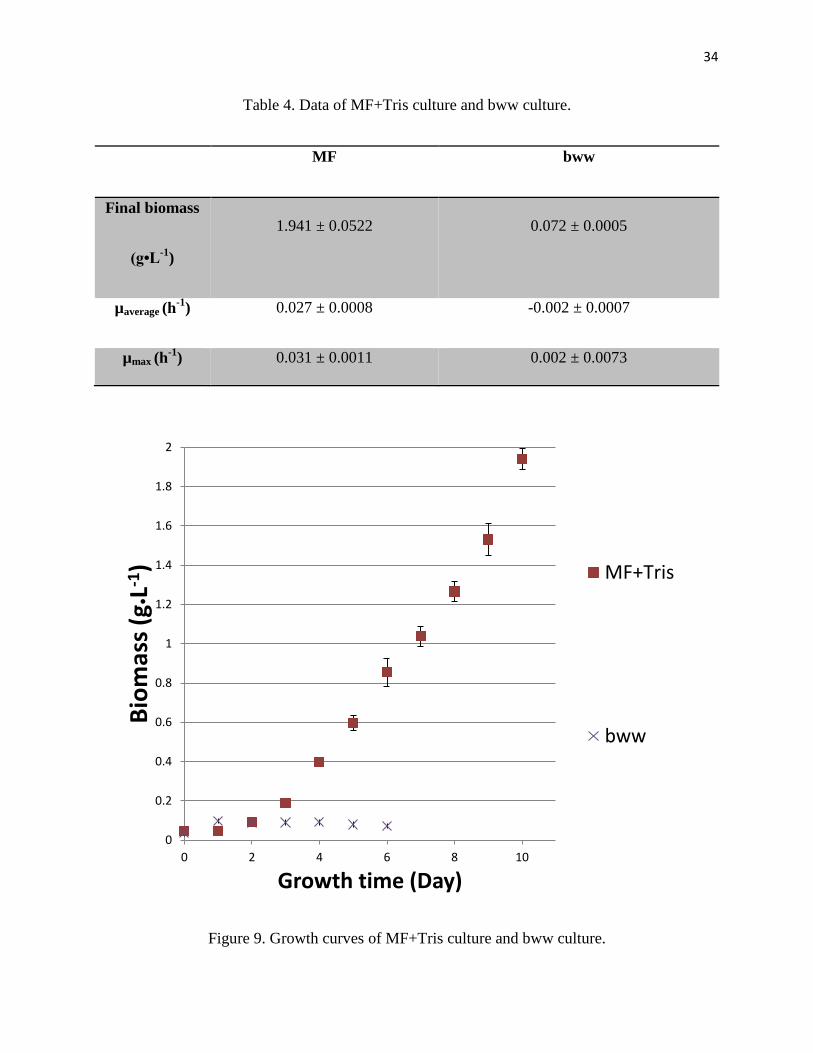
Table 4. Data of MF+Tris culture and bww culture. .................................................................... 34
Table 5. Comparison of MF, bww, bww+N, bww+P and bww+N+P medium. .......................... 35
Table 6. Data of MF, bww, bww+N, bww+P and bww+N+P culture. ........................................ 36
Table 7. Comparison of MF, bww and bww+Tris medium. ......................................................... 37
Table 8. Data of MF, bww and bww+Tris culture. ....................................................................... 38
Table 9. Final pH values of MF, bww+Tris, bww with no cells and bww+Tris with no cells. .... 40
Table 10. Comparison of MF, ACww and bww medium with Tris addition. .............................. 43
Table 11. Data of MF, bww+Tris and ACww+Tris culture. ........................................................ 44
Table 12. Comparison of MF, ANww and bww medium with Tris addition. .............................. 45
Table 13. Data of MF, ANww and bww culture with Tris addition. ............................................ 46
Table 14. Comparison of MF, ANCww and bww medium with Tris addition. ........................... 47
Table 15. Data of MF, ANCww and bww culture with Tris addition. ......................................... 48
Table 16. Comparison of MF and ANMF medium. ..................................................................... 51
Table 17. Data of MF, ANMF and bww+Tris culture. ................................................................. 52
Table 18. Comparison of MF, bww+Tris+Ac and bww+Tris medium. ....................................... 55
Table 19. Data of MF, bww+Tris+Ac and bww+Tris culture. ..................................................... 56
Table 20. Comparison of MF, bww+Tris+NaOAc and bww+Tris medium. ............................... 58

7
Table 21. Data of MF, bww+Tris+NaOAc and bww+Tris culture. ............................................. 59
Table 22. Comparison of MF, and bww+Tris+Ac with extra nutrients addition medium. .......... 62
Table 23. Data of MF, and bww+Tris+Ac with extra nutrients addition culture. ........................ 63
Table 24. Comparison of ratios of Biomass productivity to nutrient input. ................................. 66
Table 25. Comparison of nutrients enriched basic wastewater and nutrients enriched basic
wastewater with Tris and acetic acid addition. ............................................................................. 75
Table 26. Comparison of Mixotrophic and Heterotrophic culture of bww+Tris. ......................... 76
Table 27. Data of Mixotrophic and Heterotrophic culture of bww+Tris. ..................................... 77
Table 28. Comparison of Mixotrophic and Heterotrophic culture of ANww+Tris. ..................... 83
Table 29. Data of Mixotrophic and Heterotrophic culture of ANww+Tris. ................................. 84

8
LIST OF FIGURES
Figure 1. Micrographs of S. obliquus cells under microscope with 1000 × magnification. ......... 16
Figure 2. Overview of the algae cultivation apparatus showing components. ............................. 23
Figure 3. Schematic diagram of gas flow of the aeration system. ................................................ 24
Figure 4. Schematic diagram of electric circuit of the stir system................................................ 25
Figure 5. Image of 120mm Fan with magnets attached. ............................................................... 25
Figure 6. Image of stir system showing how fans and potentiometers were connected with wire.
....................................................................................................................................................... 26
Figure 7. Linear curve fit of dry biomass and optical density (750nm). ...................................... 30
Figure 8. Diagram of the data collection process. ........................................................................ 31
Figure 9. Growth curves of MF+Tris culture and bww culture. ................................................... 34
Figure 10. Growth curves of MF+tris, bww, bww+N, bww+P and bww+N+P culture. .............. 36
Figure 11. Growth curves of MF, bww and bww+Tris culture. ................................................... 38
Figure 12. pH changes in MF+Tris and bww+Tris media. ........................................................... 39
Figure 13. pH changes of MF+tris, bww+Tris bww with no cells and bww+Tris with no cells. 41
Figure 14. Growth curves of MF, ACww and bww culture with Tris addition. ........................... 44
Figure 15. Growth curves of MF, ANww and bww culture with Tris addition. .......................... 46
Figure 16. Growth curves of MF, ANCww and bww culture with Tris addition. ........................ 48
Figure 17. Growth curves of MF, ANww, ACww, ANCww and bww culture with Tris addition.
....................................................................................................................................................... 49
Figure 18. pH changes of ANww, ACww, ANCww and bww culture with Tris addition. ......... 50
Figure 19. Growth curves of MF, ANMF and bww+Tris culture. ............................................... 52
Figure 20. pH changes of MF, ANMF and bww+Tris culture. .................................................... 53

9
Figure 21. Growth curves of MF, bww+Tris+Ac and bww+Tris culture..................................... 56
Figure 22. pH changes of bww+Tris and bww+Tris+Ac culture. ................................................ 57
Figure 23. Growth curves of MF, bww+Tris+NaOAc and bww+Tris culture. ............................ 59
Figure 24. pH changes of bww+Tris and bww+Tris+NaOAc culture. ......................................... 60
Figure 25. Growth curves of MF, and bww+Tris+Ac with extra nutrients addition culture. ....... 64
Figure 26. Growth curves of MF, and bww+Tris+Ac with extra nutrients addition culture
(enlarged). ..................................................................................................................................... 65
Figure 27. pH changes of MF, and bww+Tris+Ac with extra nutrients addition culture. ............ 67
Figure 28. pH changes of MF, and bww+tris+Ac with extra nutrients addition culture (enlarged).
....................................................................................................................................................... 68
Figure 29. Photos of experiment flasks of bww+Tris+Ac+P, bww+Tris+Ac+N and
bww+Tris+Ac+NP (left to right) from day 4 to day 7. ................................................................. 70
Figure 30. Photos of experiment flasks of bww+Tris+Ac+P and bww+Tris+Ac+N (left to right)
from day 4 to day 7. ...................................................................................................................... 72
Figure 31. Ratio of OD680nm to OD750nm of time of bww+Tris+Ac+P, bww+Tris+Ac+N and
bww+Tris+Ac+NP. ....................................................................................................................... 74
Figure 32. Growth curves of Mixotrophic and Heterotrophic culture of bww+Tris. ................... 77
Figure 33. pH changes of Mixotrophic and Heterotrophic culture of bww+Tris. ........................ 78
Figure 34. Micrographs of cells from Mixotrophic and Heterotrophic culture of bww+Tris. ..... 81
Figure 35. Growth curves of Mixotrophic and Heterotrophic culture of ANww+Tris. ............... 84
Figure 36. pH changes of Mixotrophic and Heterotrophic culture of ANww+Tris. .................... 85
Figure 37. Micrographs of cells from Mixotrophic and Heterotrophic culture of ANww+Tris... 88

10
ABSTRACT
Scenedesmus obliquus is a freshwater microalga which has high lipid content and biomass
productivity. It is regarded as a promising species for production of biodiesel and other valuable
organic compounds. Given the high cost of using potable water and commercial fertilizers, the
use of municipal wastewater as algal growth medium is attractive in view of its constituent
organic carbon and inorganic nutrients, including nitrogen and phosphorus. Investigating the
mixotrophic cultivation of S. obliquus in an imitation municipal wastewater, the results of this
study showed that: (1) The unmodified imitation wastewater by itself as expected yielded poor S.
obliquus growth owing to its pH significantly decreasing to 3.5 as caused by the presence of
Ammonium Chloride in the wastewater, inhibiting cell growth; (2) Adding either Acetic Acid or
Sodium Acetate to the wastewater medium maintained its pH at 6.5 to 7.0, and its algae biomass
on day 6 increased significantly by 212% and 194%, respectively; (3) Adding either Acetic Acid
or Sodium Acetate to the wastewater medium maintained its pH at 6.5 to 7.0, and its algae
biomass during exponential phase (day 4) significantly exceeded that in the MF control by 220.6%
and 165.8%, respectively, while its algae biomass during saturation (day 6) significantly
exceeded that in the MF control by 60.8% and 51.5%, respectively; and (4) Addition of NaNO3
to the wastewater to match the level of N in the MF medium improved the algae biomass by 10%.
This study developed ways for how the successful mixotrophic cultivation of S. obliquus in
municipal wastewater could be achieved.
Key Words: Scenedesmus obliquus, wastewater medium, mixotrophic cultivation.

11
1. Introduction
Microalgae are considered as some of the most economically promising organisms in our world
(Pittman et al., 2011). They have drawn increased attention from researchers in recent years
because they provide lipids for biofuel production as well as numerous high-value bioproducts,
such as omega-3 fatty acids (Larsdotter, 2006).
Current major commercial products of microalgae include health food, carotenoids,
phycobiliproteins, fatty acids, stable isotopic biochemical and animal feed (Milledge, 2010;
Becker et al., 1988). The most commonly produced algae health food or dietary supplements are
Chlorella and Spirulina, with 2000 t and 3000 t dry weight (dw) annual production, respectively
(Spolaore et al., 2006). Carotenoids, like β-carotene and astaxanthin, were usually produced in
synthetic form. But it was reported that under certain conditions, Dunaliella and Haematococcus
could accumulate high concentrations of β-carotene and astaxanthin in the cell, respectively
(Singh et al., 2005). The annual global aquaculture market for astaxanthin in 2004 was estimated
to be around US$200 million, with an average price of US$2500 per kg (Milledge, 2010). Fatty
acids like DHA and EPA are essential to humans and animals since they lack the corresponding
enzymes to synthesize polyunsaturated fatty acids (PUFAs) of more than 18 carbon atoms; thus,
requires that the latter be obtained directly from food (Spolaore et al., 2006). Microalgae also act
as a source of isotopically labelled compounds due to their ability to incorporate stable isotopes
from relatively inexpensive inorganic molecules into high value isotopic organic chemicals (Raja
et al., 2008). The market for these chemicals is in excess of US$13 million (Spolaore et al.,
2006). With respect to animal feed, it was reported that more than 30% of the world algal

12
production is sold for animal feed and over 50% of the world production of Spirulina is used as
feed supplements (Spolaore et al., 2006).
Microalgae can utilize both inorganic and organic carbon sources, allowing them to grow
autotrophically or heterotrophically. This means that they are able to photosynthesize as well as
utilize organic materials (Zhang et al., 1999). Studies have shown that algae could achieve higher
growth rates when organic carbon, nitrogen and other nutrients sources were provided in the
growth medium (Liang et al., 2009). However, it is costly to add an organic carbon source, like
sugar, into the medium for commercial production (Larsdotter, 2006). Meanwhile municipal
wastewater contains organic carbon sources as well as many other nutrients, like nitrogen and
phosphorus, which the algae need for growth (Garcia et al., 2010). Thus utilization of wastewater
to culture algae can potentially reduce the cost of cultivation, with the added benefit of
significantly reducing the organic and inorganic matter in wastewater which needs to be removed
before discharge (Sophonsiri et al, 2004). Although it contains organic carbon source, municipal
wastewater usually contains lower concentrations of nitrogen and phosphorus as compared with
algae growth medium. (Kong et al., 2011)
Previous studies had already tested the possibility of microalgae cultivation using municipal
wastewater, using either actual wastewater or imitation wastewater (Kuwahara and Cuello, 2009;
Feng et al., 2011). The earlier studies showed certain growth inhibitions for microalgae growth
in wastewater compared with those in the control or conventional growth media. Although using
different algae species and cultivation conditions, both studies by Kuwahara and Cuello (2009)
and Feng et al. (2011) reported a pH drop during the cultivation. The pH was maintained around
7 to 7.5 by adding KOH every day, but the reason for the pH drop was not investigated. Nutrient
deficiency was also reported (Kuwahara and Cuello, 2009).

13
In this experiment, the characteristics of biomass production of S. obliquus were investigated
using a variety of modified imitation wastewater media based on the basic imitation municipal
wastewater medium for optimal growth and productivity (Feng et al., 2011). During initial
growth experiments it was observed that using the basic wastewater medium to grow S. obliquus
can result in a significant pH drop. In order to stabilize the pH within the optimal pH range for
cell growth two methods were examined: addition of acetic acid or sodium acetate. Extra
nitrogen and phosphorus were added in an attempt to stimulate growth and increase cell
concentration. Finally, the difference between mixotrophic cultivation and heterotrophic
cultivation using imitation wastewater medium was evaluated. Cell morphology change under
heterotrophic and mixotrophic cultivation was observed.
The objectives of this study were as follows:
(1) To investigate the cultivation of the microalga S. obliquus in an imitation municipal
wastewater medium;
(2) To devise practical ways to overcome any negative effects the wastewater might have on
algae growth as well as optimize the growth rate and productivity of the algae; and,
(3) To grow the microalgae using wastewater though both mixotrophic and heterotrophic
cultivation.

14
2. Background
2.1 Microalgae
Microalgae are large and diverse groups of simple, typically phototrophic organisms, ranging
from unicellular to multicellular (Larsdotter, 2006). They are among the oldest life forms in the
world. Algae are used for many different purposes in research and industry because they are able
to produce and accumulate a variety of useful materials. In industry fields, algae are used as
protein feed additives, high-value precursors of antioxidants, cosmetics, natural dyes, and
polyunsaturated fatty acids (Rosenberg et al., 2008). In recent decades, attention has been turned
use of algae for biofuel production (Makarevičiené, 2012).
Microalgae are microscopic algae, which are typically found in freshwater and marine systems.
They are unicellular species which may exist individually, or in chains or groups. Depending on
the species, their sizes typically range from a few micrometers (µm) to a few hundred
micrometers. Unlike higher plants, microalgae do not have root, stem or leaf systems. However
most of microalgae are capable of performing photosynthesis. This is an important part of the
Carbon cycle on earth (Larsdotter, 2006). Microalgae produce approximately half of the
atmospheric oxygen and subsequently use greenhouse gases such as carbon dioxide to grow
(Becker et al., 1988).
The biodiversity of microalgae is expansive and they are largely an untapped resource. It has
been estimated that about 200,000-800,000 different species exist, of which only about 50,000
species have been described. Over 15,000 novel compounds originating from algal biomass have
been chemically determined (Starckx et al., 2012). Most of these microalgae species produce

15
unique products like carotenoids, antioxidants, fatty acids, enzymes, polymers, peptides, toxins
and sterols. (Cardozo et al., 2006)
The green unicellular microalgae have long been held as a potential renewable fuel source
(Benemann et al., 1977; Oswald and Golueke, 1960). Microalgae have the potential to generate
large amounts of biomass and oil which could be converted into biodiesel. Microalgae have been
estimated to have much higher biomass productivity than higher plant crops in terms of land area
required for cultivation. At the same time they are predicted to have lower cost per biomass yield,
and have the potential to reduce greenhouse gas emissions through the replacement of fossil fuels
(Pittman et al., 2011).
2.2 Scenedesmus obliquus
Scenedesmus is a genus of algae, belonging to the family of Chlorophyceae. They are colonial
and non-motile. S. obliquus is a freshwater microalga which has good adaptation ability. They
are very versatile microalgae as a raw material for biofuels production (Miranda et al., 2012).
They are also considered to be one of the best candidates for biodiesel production among the
microalgae species (Gouveia and Oliveira, 2009), with a lipid content ranging between 18.8 and
29.3 % dry weight (dw) for a nutrient-replete medium and up to 42 % dw for a nutrient-deficient
medium (Ruiz et al., 2013). Moreover, the optimum temperature range for the S. obliquus growth
is relatively wider, since its growth rates change little between 14 and 30 °C (Xu et al., 2012).
This finding is especially relevant for the outdoor cultivation of this microalga, as temperature is
one of the major environmental factors limiting the microalgae productivity (Martinez et al.,
1999; Voltolina et al., 2005), which normally varies among hot or cold weather and day or night-
time temperatures.

16
Figure 1. Micrographs of S. obliquus cells under microscope with 1000 × magnification.
2.3 Carbon, Nitrogen, and Phosphorus sources for algae cultivation
Many nutrient sources were tested for optimal microalgae cultivation. The most common
inorganic carbon source is carbonate, typically supplied in the form of CO2 gas. There are many
kinds of organic carbon that can be used by algae as a nutrient source. Organic carbon such as
sugar allows for a much faster growth rate compared to inorganic carbon. Glucose, sucrose,
glycerin, sodium bicarbonate, sodium acetate and others were tested as carbon sources for
different strains of microalgae (Kong et al., 2011). Many papers suggested that glucose is the
most optimal for most kinds of microalgae. Usually for some microalgae organic carbon would
10 µm
10 µm

17
be better than inorganic carbon in terms of growth rate and biomass productivity (Kong et al.,
2011). Further different carbon sources have different optimal concentrations. For promoting
algae growth, Kong et al. (2011) suggested that the optimal glucose concentration for Chlorella
vulgaris is between 10 g•L-1
and 20 g•L-1
.
The impact of nitrogen sources on the growth and lipid accumulation of microalgae has been
extensively investigated over recent decades. It has been proven that nitrogen deficiency in the
culture medium could lead to higher lipid content in the microalgae cell. This is an important
reason why microalgae are quite promising in biodiesel production. Various nitrogen sources
like nitrate, nitrite, urea and ammonia as well as organic nitrogen sources like peptone and beef
extract have been tested. Usually inorganic nitrogen sources could provide higher growth rate
because of the complexity of organic nitrogen sources. Some researchers have suggested that
ammonia could be utilized more easily for microalgae cells. When microalgae are using nitrate
or nitrite as nitrogen source, they have to reduce them into the ammonia form first (Flynn et al,
1991). When the cells have to use nitrate or nitrite, they need to reduce them into ammonia first
which costs extra energy. But Eustance et al. (2013) suggested that nitrate is the better N source
for most microalgae. From the perspective of metabolism, it appears that the uptake of nitrogen
source especially ammonia may influence the CO2 fixing and respiration metabolism (Losada,
1980; Syrett, 1981).
Phosphorus is another important macro-element for algae growth. It is the main source for
synthesis of cell membrane and pigment. The optimal concentrations of phosphorus in algae
growth media are usually relatively less than nitrogen. Phosphorus is often added in the growth
medium in Hydrogen phosphate or Dihydrogen phosphate forms as nutrients. Both can be
effectively utilized by microalgae.

18
2.4 Photoautotrophic, Heterotrophic and Mixotrophic of algae cultivation
Environmental conditions have significant impacts on growth characteristics and chemical
composition of algal cells (Liang et al., 2009). Most algae are cultivated photoautotrophically,
which means organic compounds of algae cells are produced only during the photosynthesis
process using inorganic carbon source such as CO2, Na2CO3, NaHCO3 (Flynn et al., 1991).
Results of several studies have shown that higher biomass, cell density, and lipid production of
algae can be achieved by cultivating algae under heterotrophic and mixotrophic conditions,
compared to the autotrophic mode of growth (Garcia et al., 2011; Kong et al., 2011).
Heterotrophic growth means that algae utilize organic carbon sources such as glucose, glycerol,
acetate or organic carbon compounds in wastewater, etc. Aside from the carbon source, cellular
production needs to be in the dark. Under mixotrophic conditions algae can uptake inorganic and
organic carbon for photosynthesis and other metabolic pathways. Growing under either condition,
algae cells synthesize proteins, carbohydrates, and lipids. Mixotrophic cultivation has been
shown to result in higher growth rates and biomass productivities (Xin et al., 2010). Many
factors, such as temperature, nitrogen concentration, organic carbon source, carbon dioxide
aeration rate and salinity may effect lipid accumulation in algae cells (Brennan and Owende,
2010). Under optimal growing condition, algae produce fatty acids for esterification into
membrane lipids, the majority of which are glycosylglycerides. Under stressed cultivation
condition such as nitrogen starvation, etc., many algae synthesize and accumulate neutral lipids,
mostly triglycerides (TG) (Hu et al., 2008)

19
2.5 Municipal wastewater treatment using algae
Conventional municipal wastewater treatment process consists of three phases. Primary
treatment phase is for the sedimentation and screening of solid materials. Secondary treatment
phase suspends, dissolves and removes organic materials. Usually liquid goes to aerobic
treatment. Solids often are digested anaerobically. Tertiary treatment phase is the final treatment
of the water that is performed prior to discharge into the environment (Sophonsiri et al., 2004).
A major requirement of wastewater treatment is the need to remove high concentrations of
nutrients in particular N and P, which otherwise would lead to risks of eutrophication if these
nutrients accumulate in rivers and lakes.
More than 60 years ago, Caldwell (1946) suggested that the use of microalgae for wastewater
treatment and bioremediation is possible. And it has long been recognized that they are highly
effective in reducing biological oxygen demand (BOD) and dissolved phosphorus and nitrogen,
in urban and agricultural wastewater (Larsdotter, 2006).
Many species of microalgae are able to effectively grow in municipal wastewater because they
are able to utilize both organic carbon and inorganic components like nitrogen and phosphorus in
the wastewater. The use of microalgae in wastewater treatment has been long promoted (Oswald
et al., 1957). Even though the application of microalgae in the industry scale wastewater
treatment is still limited, researchers have been using algae to treat wastewater on a relatively
minor scale in the past decades.
Microalgal growth on wastewater could allow for biomass production as well as nutrient removal.
Considering that microalgae use nitrogen and phosphorus compounds as nutrients, such as
organic carbon, NH3+
and PO43-
which are usually contained in municipal wastewater and liquid

20
waste could be used simultaneously for treatment of wastewater, along with the production of
algae biomass and lipid. Besides carbon, nitrogen and phosphorus, which algae extract from
wastewater effectively, are essential elements for algae growth (Makarevičienė et al., 2011).
Algae are also characterized as being able to remove some organic pollutants and dissolve
volatile solids from wastewater (Prathima et al., 2012). And moreover, algae are capable of bio-
fixing carbon dioxide though photosynthesis, and this feature can be applied to the reduction of
air pollutants with in the atmosphere (removal of carbon dioxide from industrial flue gases),
helping to slowdown climate change.
Efficient growth of microalgae in wastewater depends on several factors. As with any growth
medium, critical variables include the pH and temperature of the growth medium, the
concentration of essential nutrients, including N, P and organic carbon and the ratios of these
constituents, and the growth environment such as light, O2 and CO2.
A major difference between municipal wastewater and conventional algae growth media is that
the concentrations of nutrients in wastewater, such as N and P, are more dilute. At the same time,
much of the nitrogen in the wastewater is often in the form of ammonia which at a high
concentration may inhibit algal growth. These variables differ from one wastewater treatment
site to another depending on the wastewater type. (Larsdotter, 2006).

21
2.6 Algae grown in imitation wastewater
Studies have examined algal growth characteristics using artificial or imitation wastewater
(Aslan and Kapdan, 2006; Lee and Lee, 2001; Voltolina et al., 1999; Feng et al., 2011). Using
imitation media to investigate algal growth characteristics of microalgae has various benefits.
They are easy to make and store, the composition of the imitation wastewater is fixed. But for
real world wastewater, its composition may be greatly varied from one wastewater treatment site
to another. Samples of wastewater from one site may differ from each other depending on the
collection time. Lastly, imitation wastewater allows for a simplified analysis of the major
components in the medium, eliminating complications brought about by unknown variables such
as biotic components. Also, its colorless characteristic makes it possible to estimate the biomass
concentration by measuring the optical density absorbance of the culture using a
spectrophotometer. All these advantages make imitation wastewater a good alternative for initial
laboratory testing and studies.
22
3. Materials and Methods
3.1 Microorganism
The microalga species Scenedesmus obliquus (UTEX 393) was purchased from The Culture
Collection of Algae at the University of Texas at Austin (UTEX). The strain was preserved under
light at room temperature in a Miller and Fogg (MF) medium with 15% Agarose adding. MF
medium contained the following chemicals: NaNO3 (1.699896 g•L-1
), K2HPO4 (0.200302 g•L-1
),
MgSO4•7H2O (0.19718 g•L-1
), CaCl2 (0.06992 g•L-1
), Ferric Citrate (0.004899 g•L-1
), H3BO3
(0.2 mg•L-1
), MnCl2•4H2O (0.2 mg•L-1
), MoO3 (0.2 mg•L-1
), CoCl2•6H2O (0.02mg•L-1
),
CuSO4•5H2O (0.02mg•L-1
), ZnSO4•7H2O (0.02mg•L-1
).
Before inoculation into the experimental medium, S. obliquus was inoculated from agar plate in
liquid MF medium. The cultures were incubated under stationary condition at 23-27°C, 130-140
µmol.m-2
•s-1
continuous cool-white fluorescent light illumination. The cells which had just
reached the stationary phase were used to inoculate the experimental medium.

23
3.2 Algae cultivation apparatus
The algae cultivation shelf that was used to grow the algae treatments was designed by the
Biosystems Engineering Laboratory at the University of Arizona. The shelf consisted of three
independent parts: the aeration system, the lighting system and the mechanical mixing system
(Figure 2).
Flowmeter Fan &
Magnets
Acrylic
plate
Potentiometer Fluorescent
lamp
Aeration
needle valve
Figure 2. Overview of the algae cultivation apparatus showing components.

24
3.2.1 The aeration system
Gas originated from the tank and flowed through the diffuser that was immersed in water to
humidify the air (Figure 3). The flowmeter controlled the speed of the gas flow.
Compressed
Gas tank
Regulator Humidifier Flowmeter Needle
valve
Nylon
membrane
0.2 um
filter
Culture
flask
Gas pipe
and air
flow
Figure 3. Schematic diagram of gas flow of the aeration system.

25
3.2.2 The mechanical mixing system
Power supply Potentiometer 120mm fan Switch
Figure 4. Schematic diagram of electric circuit of the stir system.
The fans were connected with adapters, switches, resistors and potentiometers to build the
electric circuit (Figure 4). Two rare earth magnets were attached to the 120mm computer fan,
which spins the magnet stir bar in the flask (Figure 5; Figure 6). The potentiometer controlled the
speed of the fans, which was also the speed of the stir bars.
Figure 5. Image of 120mm Fan with magnets attached.
Fan Fan Fan Fan Fan Fan

26
Figure 6. Image of stir system showing how fans and potentiometers were connected with wire.
3.2.3 The lighting system
Light was provided by fluorescent lamps. There were two sets of light fixtures; each one
contained two fluorescent lamps. Each set could be turn on and off independently to control the
light intensity and photoperiod.
3.3 Culture medium
Miller and Fogg’s medium was chosen as the control medium for the growth of S. obliquus
(Miller et al., 1958). The imitation wastewater medium is the experiment medium. Their
chemical compositions are listed in Table 1.

27
Table 1. Chemical compositions of Miller - Fogg medium and imitation wastewater medium.
Miller and Fogg’s medium(MF) Imitation wastewater medium
• NaNO3 (1.700 g•L-1
)
• K2HPO4 (0.200 g•L-1
)
• MgSO4•7H2O (0.197 g•L-1
)
• CaCl2 (0.070 g•L-1
)
• Ferric Citrate (0.005 g•L-1
)
• H3BO3 (0.200 mg•L-1
)
• MnCl2•4H2O (0.200 mg•L-1
)
• MoO3 (0.200 mg•L-1
)
• CoCl2•6H2O (0.020 mg•L-1
)
• CuSO4•5H2O (0.020 mg•L-1
)
• ZnSO4•7H2O (0.020 mg•L-1
)
• Glucose (0.825 g•L-1
)
• NH4Cl (0.156 g•L-1
)
• KH2PO4(0.036 g•L-1
)
• MgSO4•7H2O (0.026 g•L-1
)
• CaCl2•2H2O (0.086 g•L-1
)
• FeSO4•7H2O (0.010 g•L-1
)
• A5 + Co solution (1 ml•L-1
)
InitialN-NH4+ 40mg•L-1
Total phosphate (TP) 8mg•L-1
COD concentration 800mg•L-1
The recipe for the imitation municipal wastewater was taken from a previous study (Feng, Y., Li,
C., & Zhang, D. 2011), which had been used for semi-continuous cultivation of C. vulgaris.
General parameters such as chemical oxygen demand (COD), total phosphorus (TP) and total
nitrogen (TN) of the imitation wastewater were quite similar to the actual wastewater as shown
in Table 2.
28
Table 2. Comparison of the parameters of imitation wastewater medium and real world
wastewater.
The imitation wastewater
N - NH4+
40 mg•L-1
Total phosphate (TP) 8 mg•L-1
COD concentration 800 mg•L-1
The mean values of the effluent of the
secondary treatment plant of the city of
Ensenada, Baja California, Mexico
(Voltolina, D., Gómez-Villa, H., & Correa, G. 2005)
N – NH4+
39.83 mg•L-1
Total phosphate (TP) 4.46 mg•L-1
Average values of influent wastewater taken
in different stages of the treatment from the
St. Paul Metro plant (St. Paul, MN, USA)
(Kong, Q., Li, L., Martinez, B., Chen, P., & Ruan, R.
2010)
N – NH4+ 49.92 mg•L
-1
Total phosphate (TP) 6.92 mg•L-1
3.4 Experimental setup
Each treatment was conducted in triplicates. The starting culture was cultivated in MF medium
under 100-120 umol.m-2
•s-1
continuous cool-white fluorescent light illumination and 5% CO2
enriched air aeration. Each round of experiment began with inoculating 1 or 2 ml of starting
culture into the 250ml-flasks containing 180ml experimental medium.
For the mixotrophic treatments and MF medium control, all flasks were cultured under 60-70
umol.m-2
•s-1
continuous cool-white fluorescent light illumination. The 5% CO2 enriched air

29
aeration is 0.05 L•min-1
for each flask. The temperature outside the flasks was maintained at (25
± 2)°C.
For heterotrophic treatments, a layer of foil was applied to cover the entire flask to keep the algae
in the dark. Aeration with air was approximately 0.05 L•min-1
for each flask. The temperature
outside the flasks was maintained at 25°C.
All treatments were cultured under mixotrophic condition except those marked as heterotrophic
treatments.
Culture samples were checked every day under the microscope to ensure that there was no
contamination. Pictures were taken under 1000 × magnification.
3.5 Analytical methods
Optical density (OD) was measured at 750nm using Ocean Optic USB 4000 spectrophotometer.
To measure the OD for each flask, two independent 1-ml samples were taken daily. The samples
were centrifuged and rinsed with deionized (DI) water. Then three OD recordings were taken for
each sample. The average of all the six records of OD was calculated for each flask. For each
group the average and standard deviation (SD) of all three flasks were calculated.
The biomass was estimated by fitting the OD750nm values to the built linear model between dry
weight and OD750nm values of S. obliquus cultured in Miller and Fogg medium (Figure 7).

30
Biomass (g•10ml-1
) = 0.0059*OD750nm
(R2=0.9798)
Figure 7. Linear curve fit of dry biomass and optical density (750nm).
To measure the dry weight of the biomass, 10ml or 5ml samples were taken from the culture then
centrifuged at 3000G for 10 min. The liquid fraction was discarded and the precipitate was
resuspended in DI water. It was then filtered through a Fisherbrand glass fiber filter circles G6.
The dry weight was measured using a GeneMate balance after drying at 72▫C for 24 hours.
The content of chlorophyll was approximately estimated by calculating the value of
OD680nm/OD750nm.
The pH of the culture solution was measured with the Accumet Model20 pH meter.
y = 0.0059x R² = 0.9798
0
0.005
0.01
0.015
0.02
0.025
0.03
0 0.5 1 1.5 2 2.5 3 3.5 4 4.5
Bio
mas
s (g•1
0ml-1
)
OD750nm
Biomass vs OD750nm

31
Figure 8 shows how the experimental data were collected for each treatment at a given time point.
Same process
Same process
Take Average
pH data B
OD Data B
OD Data A
pH Data A
OD Data C
pH Data C
Replica A
Replica B
Replica C
OD
Data 1
OD
Data 2
OD
Data 3
OD
Data 1
OD
Data 2
OD
Data 3
1ml 1ml 3ml
Average values of Optical Density and pH of 3 replicas
And the Corresponding Standard Deviations
Of this Treatment Group at this Time Point
Figure 8. Diagram of the data collection process.

32
The the definition of specific growth rate µ is,
In this experiment, exponential phases were usually observed from 24h to 120h. Thus, the
average specific growth rate of the exponential phase in this experiment was defined as
µmax is defined as the largest µ in a 24h period observed from 24h to 120h.
3.6 Statistical method
The Wilcoxon Rank Sign Test was used to check the significant difference (α = 0.05) between
two treatments due to the non-normal distribution of the data structure.

33
4 Results and discussion
4.1 Cultivation in basic wastewater (bww)
The types and concentrations of carbon, nitrogen and phosphorus sources in the MF and basic
wastewater media are listed in Table 3.
S. obliquus grew well in MF medium (Table 4, Figure 9), but it hardly grew in the wastewater
medium. The highest biomass reached in the wastewater medium was around 0.1 g•L-1
at day 2,
which was significantly lower. Its growth rate on day 1 was higher than that in the MF medium;
however the algae subsequently stopped growing and appeared to die after several days.
Table 3. Comparison of Carbon, Nitrogen, Phosphorus sources and buffer in MF medium and
basic imitation wastewater (bww) medium.
MF bww
C source (g•L-1
) CO2 CO2 and glucose (0.825)
N source (g•L-1
) NaNO3 (1.700) NH4Cl (0.156)
P source (g•L-1
) K2HPO4 (0.200) KH2PO4 (0.036)
Buffer Tris No
*bww is basic wastewater medium.
34
Table 4. Data of MF+Tris culture and bww culture.
MF bww
Final biomass
(g•L-1
)
1.941 ± 0.0522
0.072 ± 0.0005
µaverage (h-1
) 0.027 ± 0.0008 -0.002 ± 0.0007
µmax (h-1
) 0.031 ± 0.0011 0.002 ± 0.0073
Figure 9. Growth curves of MF+Tris culture and bww culture.
0
0.2
0.4
0.6
0.8
1
1.2
1.4
1.6
1.8
2
0 2 4 6 8 10
Bio
mas
s (g
•L-1
)
Growth time (Day)
MF+Tris
bww

35
4.2 Cause for limited algae growth in basic wastewater cultivation (bww)
4.2.1 Cultivation in nutrient-enriched wastewater
Since the concentrations of nutrients were extremely dilute in the basic wastewater medium, it
was suspected that the low growth could have been caused by nutrient deficiency in the medium.
Extra nitrogen (NaNO3) and phosphorus (K2HPO4) were added to the media as shown in the
Table 5.
The added nutrients allowed the algae to grow but the final biomass levels remained significantly
low compared to that in the MF medium (Table 6, Figure 10). The treatment in where both N and
P were added yielded the highest biomass compared with the treatments with only N or P
addition.
The results indicated that while there was some nutrient limitation, nutrient deficiency was not
the leading cause of the reduced growth.
Table 5. Comparison of MF, bww, bww+N, bww+P and bww+N+P medium.
MF bww+N bww+P bww+N & P bww
C source
(g•L-1
)
CO2 CO2
glucose(0.825)
CO2
glucose(0.825)
CO2
glucose(0.825)
CO2
glucose(0.825)
N source
(g•L-1
)
NaNO3
(1.700)
NH4Cl(0.156)
NaNO3(1.700)
NH4Cl(0.156) NH4Cl(0.156)
NaNO3(1.700)
NH4Cl(0.156)
P source
(g•L-1
)
K2HPO4
(0.200)
KH2PO4(0.036) KH2PO4(0.036)
K2HPO4(0.200)
KH2PO4(0.036)
K2HPO4(0.200)
KH2PO4(0.036)
Buffer Tris No No No No

36
Table 6. Data of MF, bww, bww+N, bww+P and bww+N+P culture.
MF bww+N bww+P bww+N&P bww
Final
biomass
(g•L-1
)
1.941
± 0.0522
0.182
± 0.0109
0.159
± 0.0121
0.313
± 0.0368
0.072
± 0.0005
µaverage
(h-1
)
0.027
± 0.0008
0.011
± 0.0006
0.006
± 0.0008
0.014
± 0.0016
-0.002
± 0.0007
µmax
(h-1
)
0.031
± 0.0011
0.023
± 0.0017
0.019
± 0.0017
0.024
± 0.0024
0.002
± 0.0073
Figure 10. Growth curves of MF+tris, bww, bww+N, bww+P and bww+N+P culture.
0
0.2
0.4
0.6
0.8
1
1.2
1.4
1.6
1.8
2
0 2 4 6 8 10
Bio
mas
s (g
•L-1
)
Growth time (Day)
MF+Tris
bww
bww+NP
bww+N
bww+P

37
4.2.2 Cultivation in wastewater with added Tris buffer (bww+Tris)
To check if change in pH might have resulted in the poor growth, the wastewater medium
buffered with Tris was tested. Tris buffer is a medium pH buffer whose components cannot be
used by microalgae as nutrients, with a buffer range of around 7 to 9.
Table 7 shows the levels of carbon, nitrogen and phosphorus for the media treatments tested.
Table 8 and Figure 11 show that adding Tris buffer to the wastewater medium significantly
improved the growth of S. obliquus during the first 3 days. However after day 3, the algae
stopped growing and saturated. Figure 12 shows that the pH dropped significantly after
inoculation and reached a minimum of 3.5 on day 3 even with the presence of Tris buffer.
Table 7. Comparison of MF, bww and bww+Tris medium.
MF bww+Tris bww
C source (g•L-1
) CO2 CO2
glucose (0.825)
CO2
glucose (0.825)
N source (g•L-1
) NaNO3 (1.700) NH4Cl (0.156) NH4Cl (0.156)
P source (g•L-1
) K2HPO4 (0.200) KH2PO4 (0.036) KH2PO4 (0.036)
Buffer Tris Tris No

38
Table 8. Data of MF, bww and bww+Tris culture.
MF bww+Tris
Final
biomass
1.941 ± 0.0522
(g•L-1
)
0.440 ± 0.0496
(g•L-1
)
Final pH 7.28 ± 0.036 3.44 ± 0.07
µaverage
(h-1
)
0.027
± 0.0008
0.021
± 0.0013
µmax (h-1
) 0.031
± 0.0011
0.044
± 0.0041
Figure 11. Growth curves of MF, bww and bww+Tris culture.
0
0.2
0.4
0.6
0.8
1
1.2
1.4
1.6
1.8
2
0 2 4 6 8 10
Bio
mas
s (g
•L-1
)
Growth time (Day)
MF+Tris
bww
bww+Tris

39
Figure 12. pH changes in MF+Tris and bww+Tris media.
Thus, it could be inferred that the pH drop led to growth inhibition. Adding Tris buffer could
slow down the pH drop, but eventually it still dropped to as low as 3.5, which was not optimal
for algae growth.
0
1
2
3
4
5
6
7
8
0 2 4 6 8 10
pH
Growth time (Day)
MF+tris
bww+tris

40
4.2.3 Effect of CO2 aeration on medium pH
The extent in pH drop caused by the added 5% CO2 through aeration was tested using the media
treatments described in Table 9, and without any algae cells.
Table 9. Final pH values of MF, bww+Tris, bww with no cells and bww+Tris with no cells.
MF bww+Tris
(no cells)
bww
(no cells)
bww+Tris
Final pH 7.28 ± 0.036 6.4 ± 0.026
5.34 ± 0.042
3.44 ± 0.07
Figure 13 shows that the pH of the basic wastewater medium without cells (bww no cell) aerated
with 5% CO2 dropped to a low of 5.3. The pH of basic wastewater + Tris medium (bww+Tris no
cell) aerated with 5% CO2 dropped to as low as 6.4. Both of these pH values were still
significantly higher than that of the bww+Tris culture whose pH was around 3.5.
Thus, it was clear that the pH drop in the preceding bww+Tris culture was not mainly caused by
the 5% CO2 aeration.

41
Figure 13. pH changes of MF+tris, bww+Tris bww with no cells and bww+Tris with no cells.
0
1
2
3
4
5
6
7
8
0 2 4 6 8 10
pH
Growth time (Day)
MF+tris
bww+tris
bww(no cell)
bww+tris(no cell)

42
4.3 Cause of pH drop in wastewater medium
4.3.1 Cultivation using Alternate C and N sources
Using pure wastewater turned out to be unsuitable for optimal growth of S. obliquus since the pH
dropped to a very low level. Adding Tris buffer slowed down the pH drop, but eventually it still
dropped to around 3.5.
Since that pH drop was not caused mainly by CO2 aeration, the next step was to determine what
was the connection between the medium composition and the pH.
To investigate what specific component in the medium caused pH drop, experimental factors
were separated. Carbon and nitrogen sources are the major and most important components of
the media. Some studies reported that different C and N sources could lead to different C and N
metabolism and change the pH values of the media (Ho et al, 2010). Thus alternative sources of
C and N were used in the wastewater medium to investigate their effects on pH and growth.

43
4.3.1.1 Cultivation in Alternative C source wastewater medium (ACww)
Alternative carbon source wastewater (ACww) uses sodium acetate as C source to replace the
glucose of the original imitation wastewater (Table 10).
The growth curves are shown in Figure 14. When sodium acetate was used as a carbon source,
the pH did not drop. Instead the pH value remained stable around 7.2 (shown on the pH data). As
a result, the growth rate is much higher and the cell continued growing. At day 6 the biomass
reached a high 1.15 g•L-1
.
Table 10. Comparison of MF, ACww and bww medium with Tris addition.
MF ACww+Tris bww+Tris
C source (g•L-1
) CO2 CO2
NaOAc (1.128)
CO2
glucose (0.825)
N source (g•L-1
) NaNO3 (1.700) NH4Cl (0.156) NH4Cl (0.156)
P source (g•L-1
) K2HPO4 (0.200) KH2PO4 (0.036) KH2PO4 (0.036)
Buffer Tris Tris Tris
*bww is basic wastewater medium.
*ACww is alternative carbon source wastewater medium.

44
Table 11. Data of MF, bww+Tris and ACww+Tris culture.
MF ACww+Tris bww+Tris
Biomass at Day6
(g•L-1
)
0.855 ± 0.0703 1.139 ± 0.0807
0.440 ± 0.0496
Final pH 7.28 ± 0.036 7.27 ± 0.021
3.44 ± 0.07
µaverage (h-1
) 0.027
± 0.0008
0.032
± 0.0006
0.021
± 0.0013
µmax (h-1
) 0.031
± 0.0011
0.068
± 0.0028
0.044
± 0.0041
Figure 14. Growth curves of MF, ACww and bww culture with Tris addition.
0
0.2
0.4
0.6
0.8
1
1.2
1.4
1.6
1.8
2
0 2 4 6 8 10
Bio
mas
s (g
•L-1
)
Growth time (Day)
MF+Tris
bww+Tris
ACww+Tris

45
4.3.1.2 Cultivation in Alternative N source wastewater medium (ANww)
The alternative nitrogen source wastewater (ANww) uses sodium nitrate as N source to replace
the ammonia chloride of the original imitation wastewater (Table 12).
Table 12. Comparison of MF, ANww and bww medium with Tris addition.
MF ANww+Tris bww+Tris
C source (g•L-1
) CO2 CO2
glucose (0.825)
CO2
glucose (0.825)
N source (g•L-1
) NaNO3 (1.700) NaNO3 (0.248) NH4Cl (0.156)
P source (g•L-1
) K2HPO4 (0.200) KH2PO4 (0.036) KH2PO4 (0.036)
Buffer Tris Tris Tris
*bww is basic wastewater.
*ANww is alternative nitrogen source wastewater medium.
The growth data is shown in Table 13 and Figure 15. When sodium nitrate was used as nitrogen
source, the pH did not drop. Instead the pH value remained stable around 6.8 (shown on the pH
records). As a result, the growth rate is much higher and the cell continued growing. At day 6 the
biomass reached a 1.25 g•L-1
. At day 7 the biomass exceeded 1.4 g•L-1
.

46
Table 13. Data of MF, ANww and bww culture with Tris addition.
MF ANww+Tris bww+Tris
Biomass at Day6
(g•L-1
)
0.855
± 0.0703
1.238
± 0.0592
0.440
± 0.0496
Final pH 7.28
± 0.036
6.80
± 0.005
3.44
± 0.07
µaverage (h-1
) 0.027
± 0.0008
0.033
± 0.0008
0.021
± 0.0013
µmax (h-1
) 0.031
± 0.0011
0.054
± 0.0001
0.044
± 0.0041
Figure 15. Growth curves of MF, ANww and bww culture with Tris addition.
0
0.2
0.4
0.6
0.8
1
1.2
1.4
1.6
1.8
2
0 2 4 6 8 10
Bio
mas
s (g
•L-1
)
Growth time (Day)
MF+Tris
bww+Tris
ANww+Tris
47
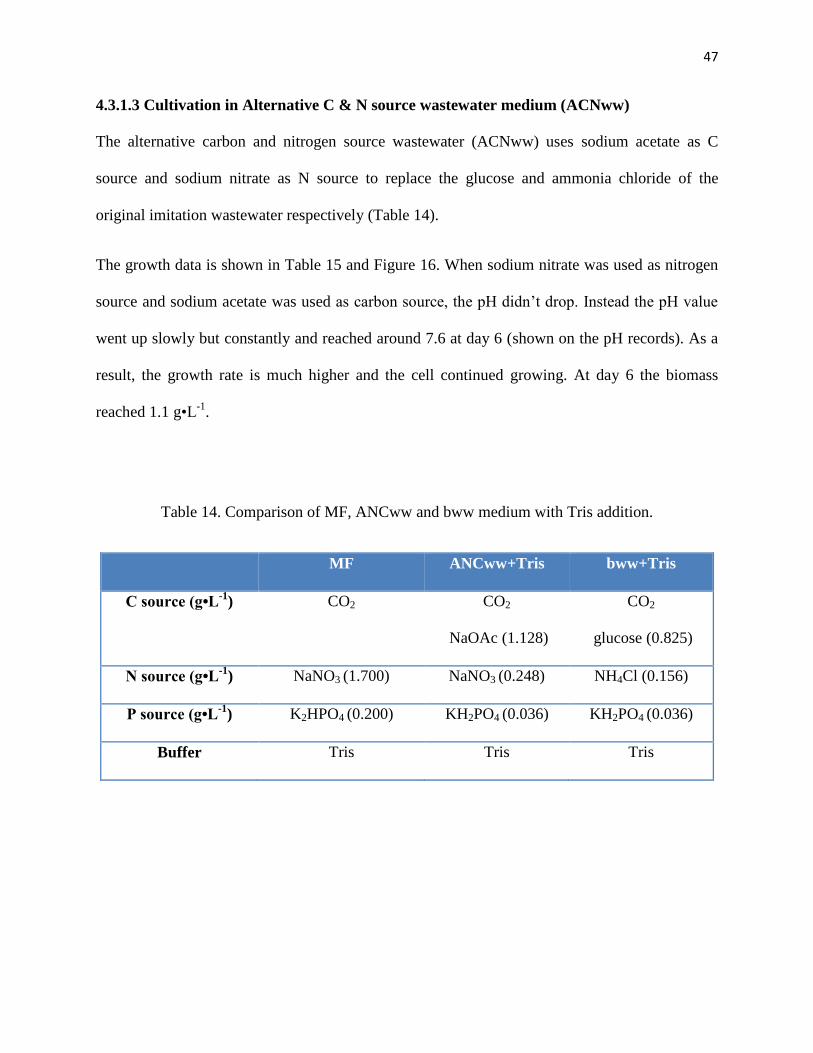
4.3.1.3 Cultivation in Alternative C & N source wastewater medium (ACNww)
The alternative carbon and nitrogen source wastewater (ACNww) uses sodium acetate as C
source and sodium nitrate as N source to replace the glucose and ammonia chloride of the
original imitation wastewater respectively (Table 14).
The growth data is shown in Table 15 and Figure 16. When sodium nitrate was used as nitrogen
source and sodium acetate was used as carbon source, the pH didn’t drop. Instead the pH value
went up slowly but constantly and reached around 7.6 at day 6 (shown on the pH records). As a
result, the growth rate is much higher and the cell continued growing. At day 6 the biomass
reached 1.1 g•L-1
.
Table 14. Comparison of MF, ANCww and bww medium with Tris addition.
MF ANCww+Tris bww+Tris
C source (g•L-1
) CO2 CO2
NaOAc (1.128)
CO2
glucose (0.825)
N source (g•L-1
) NaNO3 (1.700) NaNO3 (0.248) NH4Cl (0.156)
P source (g•L-1
) K2HPO4 (0.200) KH2PO4 (0.036) KH2PO4 (0.036)
Buffer Tris Tris Tris

48
Table 15. Data of MF, ANCww and bww culture with Tris addition.
MF ANCww+Tris bww+Tris
Biomass at Day6
(g•L-1
)
0.855 ± 0.0703 1.072 ± 0.1154
0.440 ± 0.0496
Final pH 7.28 ± 0.036 7.52 ± 0.012
3.44 ± 0.07
µaverage (h-1
) 0.027
± 0.0008
0.031
± 0.0003
0.021
± 0.0013
µmax (h-1
) 0.031
± 0.0011
0.057
± 0.0054
0.044
± 0.0041
*ANCww is alternative carbon and nitrogen wastewater medium.
Figure 16. Growth curves of MF, ANCww and bww culture with Tris addition.
0
0.2
0.4
0.6
0.8
1
1.2
1.4
1.6
1.8
2
0 2 4 6 8 10
Bio
mas
s (g
•L-1
)
Growth time (Day)
MF+Tris
bww+Tris
ANCww+Tris

49
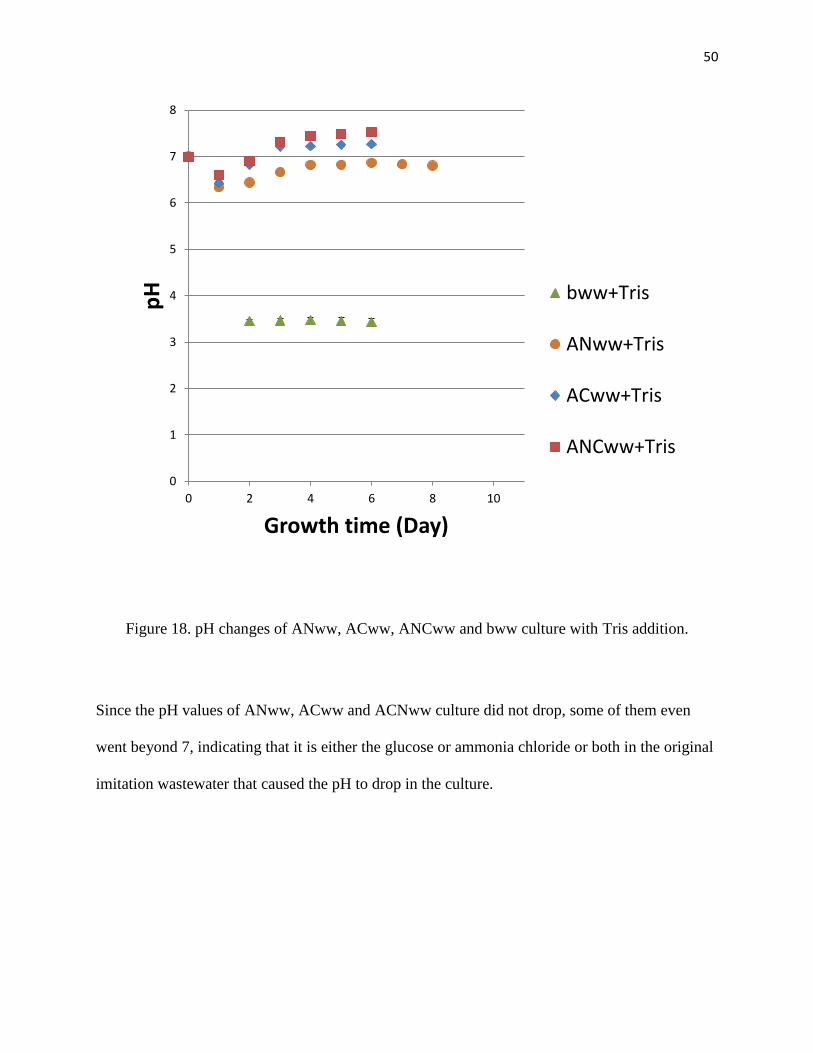
4.3.1.4 Combined growth curves and pH changes of ANww, ACww and ANCww
The combined growth curves and pH changes of ANww, ACww and ANCww are shown below
in Figure 17 and Figure 18.
Figure 17. Growth curves of MF, ANww, ACww, ANCww and bww culture with Tris addition.
0
0.2
0.4
0.6
0.8
1
1.2
1.4
1.6
1.8
2
0 2 4 6 8 10
Bio
mas
s (g
•L-1
)
Growth time (Day)
MF+Tris
bww+Tris
ACww+Tris
ANww+Tris
ANCww+Tris
50
Figure 18. pH changes of ANww, ACww, ANCww and bww culture with Tris addition.
Since the pH values of ANww, ACww and ACNww culture did not drop, some of them even
went beyond 7, indicating that it is either the glucose or ammonia chloride or both in the original
imitation wastewater that caused the pH to drop in the culture.
0
1
2
3
4
5
6
7
8
0 2 4 6 8 10
pH
Growth time (Day)
bww+Tris
ANww+Tris
ACww+Tris
ANCww+Tris

51
4.3.2 Cultivation in Alternative N source MF medium (ANMF)
Alternative N source MF medium (ANMF) is the MF medium with 50% molar of its nitrogen
source, sodium nitrate, replaced by ammonia chloride. The compositions are listed above in
Table 16.
Table 16. Comparison of MF and ANMF medium.
MF ANMF
C source (g•L-1
) CO2 CO2
N source (g•L-1
) NaNO3 (1.700) NaNO3 (0.850)
NH4Cl (0.535)
P source (g•L-1
) K2HPO4 (0.200) K2HPO4 (0.200)
*ANMF is the MF medium with 50% molar of its nitrogen source, sodium nitrate, replaced by ammonia
chloride.
The growth data are shown in Table17 and Figure 19. The pH changes are shown in Figure 20.

52
Table 17. Data of MF, ANMF and bww+Tris culture.
MF ANMF bww+Tris
Final Biomass
(g•L-1
)
1.941 ± 0.0522 0.276 ± 0.0333 0.440 ± 0.0496
Final pH 7.28 ± 0.036 3.87 ± 0.038 3.44 ± 0.07
µaverage (h-1
) 0.027
± 0.0008
0.020
± 0.0006
0.021
± 0.0013
µmax (h-1
) 0.031
± 0.0011
0.033
± 0.0080
0.044
± 0.0041
Figure 19. Growth curves of MF, ANMF and bww+Tris culture.
0
0.2
0.4
0.6
0.8
1
1.2
1.4
1.6
1.8
2
0 2 4 6 8 10
Bio
mas
s (g
•L-1
)
Growth time (Day)
MF+Tris
ANMF
bww+Tris

53
Figure 20. pH changes of MF, ANMF and bww+Tris culture.
According to Figure 19, the growth curve of ANMF shows poor growth compared to the control
of S. obliquus. During the first 72h, its growth rate was almost as the same as the original MF
culture. But after 72h its growth rate slowed down while the original MF culture transitioned into
exponential phase. The pH change of ANMF during the initial 72h was severe resulting in a
steady pH of 3.6 to 4.0 for remainder of the experiment. Meanwhile the pH of original MF
culture remained steady around 6.5 to 7. This explains why the ANMF culture did not grow as
0
1
2
3
4
5
6
7
8
0 2 4 6 8 10
pH
Growth time (Day)
MF+Tris
ANMF
bww+Tris

54
well as the MF culture even though they had same molar of N source. It can now be concluded
that the Ammonia Chloride in the basic imitation wastewater medium (bww) was the most likely
cause of pH drop.
It has been shown that the imitation wastewater does not serve as a good medium for optimal
growth of S. obliqqus since the pH drop inhibits growth. Adding Tris buffer can slow down the
pH decline but eventually the pH drops to around 3.5. The main reason for that pH drop is
because of the consumption of the ammonia chloride in the imitation wastewater medium.
As the consequence, the next step is to investigate how to use the imitation wastewater to
cultivate S. obliquus effectively by stabilizing the pH during the culture period. This would
provide valuable information when faced with real world ammonia-rich wastewater, which
would be the most common situation for the actual municipal wastewater.
In order to improve algae growth in imitation wastewater different components were added in an
attempt to stabilize pH and improve growth rate and biomass productivity.
4.4 Maintaining the pH and improving biomass productivity
4.4.1 Cultivation in wastewater with Tris and acetic acid added (bww+Tris+Ac)
In the next step, the objective was to maintain the pH value during cultivation and make it
possible to use the imitation wastewater medium to grow S. obliquus.
The first chemical tested was Acetic Acid (Table 18).
According to previous research, acetic acid can act as a carbon source for the growth of
microalgae. It is also be used in the common TAP medium. When consumed, the pH of the

55
medium would increase. In order to maintain the pH of the media in tolerable range for algae 0.5%
acetic acid (0.00175 mol•L-1
) was added.
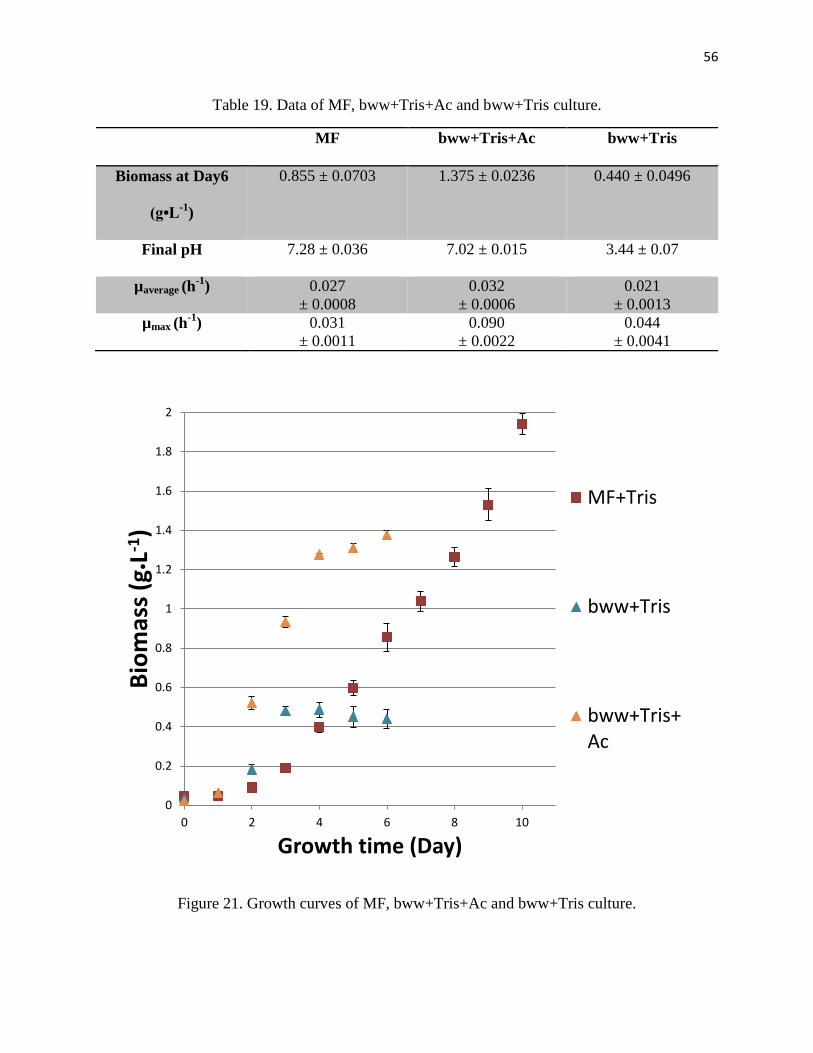
The growth data is shown in Table 19 and Figure 21. As shown the growth rate and final
biomass productivity have improved significantly by adding acetic acid into the wastewater
medium. By day 4 the biomass was about 1.3 g•L-1
, which was more than 3 times higher than
that of the MF medium. One reason for the improved growth could be the utilization of the acetic
acid as an organic carbon source. However due to the small amount added, it is more likely that
the improved growth was due to the pH being stabilized at neutral 7. However, after day 4, the
growth rate slowed down, which may be caused by nutrients deficiency. Maximum density was
reached at day 6, with a value around 1.4 g•L-1
.
Adding acetic acid to bww improved the biomass at day 6 by 212.5%. Its biomass at day 6 is
also 60.8% higher compared to MF control. At day 4, which is before saturation, the biomass of
Acetic Acid addition is higher by 220.6% with respect to MF control.
Table 18. Comparison of MF, bww+Tris+Ac and bww+Tris medium.
MF bww+Tris+Ac bww+Tris
C source (g•L-1
) CO2 CO2 glucose(0.825)
Acetic Acid
(1.75*10-3
mol•L-1
)
CO2
glucose (0.825)
N source (g•L-1
) NaNO3 (1.700) NH4Cl (0.156) NH4Cl (0.156)
P source (g•L-1
) K2HPO4 (0.200) KH2PO4 (0.036) KH2PO4 (0.036)
Buffer Tris Tris Tris
*bww+Tris+Ac is the basic wastewater medium with Tris buffer and acetic acid addition.
56
Table 19. Data of MF, bww+Tris+Ac and bww+Tris culture.
MF bww+Tris+Ac bww+Tris
Biomass at Day6
(g•L-1
)
0.855 ± 0.0703 1.375 ± 0.0236 0.440 ± 0.0496
Final pH 7.28 ± 0.036 7.02 ± 0.015 3.44 ± 0.07
µaverage (h-1
) 0.027
± 0.0008
0.032
± 0.0006
0.021
± 0.0013
µmax (h-1
) 0.031
± 0.0011
0.090
± 0.0022
0.044
± 0.0041
Figure 21. Growth curves of MF, bww+Tris+Ac and bww+Tris culture.
0
0.2
0.4
0.6
0.8
1
1.2
1.4
1.6
1.8
2
0 2 4 6 8 10
Bio
mas
s (g
•L-1
)
Growth time (Day)
MF+Tris
bww+Tris
bww+Tris+Ac

57
Figure 22. pH changes of bww+Tris and bww+Tris+Ac culture.
0
1
2
3
4
5
6
7
8
0 2 4 6 8 10
pH
Growth time (Day)
MF+Tris
bww+Tris
bww+Tris+Ac

58
4.4.2 Cultivation in wastewater with Tris and sodium acetate added (bww+Tris+NaOAc)
The second chemical tested was Sodium Acetate (Table 20).
Sodium acetate also can be used as a carbon source for the cultivation of microalgae. Sodium
acetate is a basic salt. When the acetate is consumed, the solution would tend to be alkaline
making a good candidate for stabilizing the pH of the media.
Table 20. Comparison of MF, bww+Tris+NaOAc and bww+Tris medium.
MF bww+Tris+NaOAc bww+Tris
C source (g•L-1
) CO2 CO2 glucose(0.825)
Sodium Acetate
(1.75*10-3
mol•L-1
)
CO2
glucose (0.825)
N source (g•L-1
) NaNO3 (1.700) NH4Cl (0.156) NH4Cl (0.156)
P source (g•L-1
) K2HPO4 (0.200) KH2PO4 (0.036) KH2PO4 (0.036)
Buffer Tris Tris Tris
*bww+Tris+NaOAc is the basic wastewater medium with Tris buffer and sodium acetate addition.

59
Table 21. Data of MF, bww+Tris+NaOAc and bww+Tris culture.
MF bww+Tris+NaOAc bww+Tris
Biomass at Day6
(g•L-1
)
0.855 ± 0.0703 1.295 ± 0.0637 0.440 ± 0.0496
Final pH 7.28 ± 0.036 6.48 ± 0.025 3.44 ± 0.07
µaverage (h-1
) 0.027
± 0.0008
0.026
± 0.0003
0.021
± 0.0013
µmax (h-1
) 0.031
± 0.0011
0.082
± 0.0037
0.044
± 0.0041
Figure 23. Growth curves of MF, bww+Tris+NaOAc and bww+Tris culture.
0
0.2
0.4
0.6
0.8
1
1.2
1.4
1.6
1.8
2
0 2 4 6 8 10
Bio
mas
s (g
•L-1
)
Growth time (Day)
MF+Tris
bww+Tris
bww+Tris+NaOAc

60
The growth data is shown in Table 21 and Figure 23. As shown in the growth rate and final
biomass productivity improved a lot by simply adding a very small amount of sodium acetate
(0.00175mol•L-1
) into the wastewater medium. But compared with adding acetic acid, the growth
rate and final biomass productivity of adding sodium acetate both are relatively lower. At day 6
the biomass was around 1.3 g•L-1
. The pH was stable around 6.5, which is about 0.5 lower than
pH of adding acetic acid.
Adding sodium acetate to bww improved the biomass at day 6 by 194.3%. Its biomass at day 6 is
also 51.5% higher compared to MF. At day 4 its biomass is 165.8% higher than MF control.
Figure 24. pH changes of bww+Tris and bww+Tris+NaOAc culture.
0
1
2
3
4
5
6
7
8
0 2 4 6 8 10
pH
Growth time (Day)
MF+Tris
bww+Tris
bww+Tris+NaOAc

61
Addition of either acetic acid or sodium acetate into the wastewater culture helped to maintain
the pH value in the range of 6.5 – 7, resulting in improved growth.
But after some time the growth rate slows down, implying that there is nutrient limiting.
Considering that the treatments have the same amount of CO2 aeration as MF medium, therefore
carbon should not be a limiting factor. Since the Nitrogen and Phosphorus in the wastewater
medium are relatively scarce, and it has been noted that the Nitrogen and Phosphorus
concentrations in the wastewater was causing minor growth inhibition. Therefore to further
improve growth in the wastewater with acetic acid, Nitrogen and Phosphorus were added in an
attempt to increase growth.
4.5 Investigation into nutrient deficiency of the wastewater medium
4.5.1 Cultivation in nutrient-enriched wastewater with Tris and acetic acid added
As mentioned above, extra N and P was added to the wastewater medium with 5% acetic acid to
test which element was the most needed and how it could improve the productivity. Sodium
Nitrate was added to the medium so that the concentration and form of nitrogen source would
equivalent to that of MF medium. K2HPO4 was added for the same purpose (Table 22).
The growth data is shown in Table 23 and Figure 25.

62
Table 22. Comparison of MF, and bww+Tris+Ac with extra nutrients addition medium.
MF bww+Tris+Ac
+N
bww+Tris+Ac
+P
bww+Tris+Ac
+N & P
bww+Tris+Ac
C source
(g•L-1
)
CO2 CO2
glucose(0.825)
Acetic Acid
(1.75*10-3
mol•L-1
)
CO2
glucose(0.825)
Acetic Acid
(1.75*10-3
mol•L-1
)
CO2
glucose(0.825)
Acetic Acid
(1.75*10-3
mol•L-1
)
CO2
glucose(0.825)
Acetic Acid
(1.75*10-3
mol•L-1
)
N source
(g•L-1
)
NaNO3
(1.700)
NH4Cl(0.156)
NaNO3(1.700)
NH4Cl(0.156) NH4Cl(0.156)
NaNO3(1.700)
NH4Cl(0.156)
P source
(g•L-1
)
K2HPO4
(0.200)
KH2PO4(0.036) KH2PO4(0.036)
K2HPO4(0.200)
KH2PO4(0.036)
K2HPO4(0.200)
KH2PO4(0.036)
Buffer Tris Tris Tris Tris Tris
*bww+Tris+Ac is the basic wastewater medium with Tris buffer and acetic acid addition.

63
Table 23. Data of MF, and bww+Tris+Ac with extra nutrients addition culture.
MF bww+Tris+Ac
+N
bww+Tris+Ac
+P
bww+Tris+Ac
+N & P
bww+Tris+Ac
Biomass
at Day6
(g•L-1
)
0.855
± 0.0703
1.503
± 0.0020
1.387
± 0.0124
1.502
± 0.0555
1.375
± 0.0236
Final pH 7.28
± 0.036
7.25
± 0.006
7.05
± 0.032
7.31
± 0.025
7.02
± 0.015
µaverage
(h-1
)
0.027
± 0.0008
0.028
± 0.0007
0.028
± 0.0017
0.029
± 0.0012
0.032
± 0.0006
µmax
(h-1
)
0.031
± 0.0011
0.084
± 0.0040
0.083
± 0.0068
0.084
± 0.0051
0.090
± 0.0022

64
Figure 25. Growth curves of MF, and bww+Tris+Ac with extra nutrients addition culture.
0
0.2
0.4
0.6
0.8
1
1.2
1.4
1.6
1.8
2
0 2 4 6 8 10
Bio
mas
s (g
•L-1
)
Growth time (Day)
MF+Tris
bww+Tris
bww+Tris+Ac
bww+Tris+Ac+P
bww+Tris+Ac+N
bww+Tris+Ac+NP

65
Figure 26. Growth curves of MF, and bww+Tris+Ac with extra nutrients addition culture
(enlarged).
According to the growth curves shown in Figure 25 (Figure 26 is partially enlarged one), adding
extra N and P did not improve the growth rate or biomass productivity obviously. There is no
statistically significant difference between Phosphorus fortified group (bww+Tris+Ac+P) and the
group with no nutrient addition (bww+Tris+Ac). This means for the cultivation of S. obliquus,
phosphorus is not the limiting nutrient in the wastewater. A maximum cell density about
1.45g•L-1
was reached after 7 days.
0
0.2
0.4
0.6
0.8
1
1.2
1.4
1.6
0 2 4 6 8
Bio
mas
s (g
•L-1
)
Growth time (Day)
bww+Tris+Ac
bww+Tris+Ac+P
bww+Tris+Ac+N
bww+Tris+Ac+NP

66
There is no statistically significant difference between Nitrogen fortified group
(bww+Tris+Ac+N) and N and P fortified group (bww+Tris+Ac+N&P). This suggests that
adding extra N can improve the biomass productivity to about 1.6 g•L-1
by day 7. It also provides
supporting evidence that adding P does not improve the growth.
According to the growth curves, adding NaNO3 to the concentration of MF medium slightly
improves the biomass productivity by 10%. Considering the small difference and the cost of
nutrients (the comparison shown below in Table 24), it is not economically feasible for the large
scale production.
Table 24. Comparison of ratios of Biomass productivity to nutrient input.
MF bww+Ac bww+Ac+P bww+Ac+N bww+Ac+N&P
Average Biomass
at Day 6
(g•L-1
)
0.855
1.375
1.387
1.503
1.502
Total Nutrient
Input
(g•L-1
)
2.173
0.105
0.305
1.805
2.005
0.393 13.095 4.548 0.833 0.749
*bww means basic wastewater.
*Assuming bww is free here.

67
For all groups the pH values were maintained in a reasonable range of 6.4 to 7.4 as shown above.
(Figure 28 is the partially enlarged one of Figure 27)
Figure 27. pH changes of MF, and bww+Tris+Ac with extra nutrients addition culture.
0
1
2
3
4
5
6
7
8
0 2 4 6 8 10
pH
Growth time (Day)
bww+Tris
bww+Tris+Ac
bww+Tris+Ac+P
bww+Tris+Ac+N

68
Figure 28. pH changes of MF, and bww+tris+Ac with extra nutrients addition culture (enlarged).
However, even though adding extra N and P did not improve the biomass productivity
significantly, difference in culture color was observed.
During this experiment a significant change in color was observed in the P fortified group
(bww+Tris+Ac+P). Images are shown in Figure 29 (from day 4 to day 7).
6.2
6.4
6.6
6.8
7
7.2
7.4
0 2 4 6 8
pH
Growth time (Day)
bww+Tris+Ac
bww+Tris+Ac+Pbww+Tris+Ac+Nbww+Tris+Ac+NP

69
The photos of experiment flasks from day 4 to day 7
From left to right, bww+Tris+Ac+P, bww+Tris+Ac+N, bww+Tris+Ac+NP
Day 4
Day 5
bww+Tris+Ac+P bww+Tris+Ac+N bww+Tris+Ac+NP
Figure 29 (1). Photos of flasks of bww+Tris+Ac+P, bww+Tris+Ac+N and
bww+Tris+Ac+NP (left to right) from day 4 to day 7.

70
Day 6
Day 7
Figure 29 (2). Photos of experiment flasks of bww+Tris+Ac+P, bww+Tris+Ac+N and
bww+Tris+Ac+NP (left to right) from day 4 to day 7.

71
The photos of experiment flasks from day 4 to day 7
left is bww+Tris+Ac+P group, right is bww+Tris+Ac+N group
Day 4
Day 5
bww+Tris+Ac+P bww+Tris+Ac+N
Figure 30 (1). Photos of flasks of bww+Tris+Ac+P and bww+Tris+Ac+N (left to right) from
day 4 to day 7.

72
Day 6
Day 7
Figure 30 (2). Photos of experiment flasks of bww+Tris+Ac+P and bww+Tris+Ac+N
(left to right) from day 4 to day 7.

73
From the images above a color difference between N-deficient group and N-enriched group can
be seen.
The spectrophotometer was used to check the absorbance of the culture. The peak at the wave
length of 680nm was observed because most of the green light would be reflected by the
chlorophyll in the algae cell. Based on that, the ratio of OD680nm compared to OD750nm can be
used to indicate the ratio of chlorophyll to biomass in the culture. By plotting the ratio of
OD680nm to OD750nm vs time, the ratio of chlorophyll to biomass can be observed over the
length of the experiment.
Figure 31 shows the OD680nm to OD750nm ratio for the +N and +NP groups. All
measurements were taken at 8 × dilution. The trend shows that the ratio went up after
inoculation. After 4 days the ratios began to drop because the culture density became increased
causing cell shading. The synthesis of chlorophyll slowed down, while the biomass kept
increasing. Therefore the value of OD680nm / OD750nm started to drop.
However the ratio of +P group kept dropping throughout the experiment with the largest
decrease was observed in the first 92 hours after inoculation.
As previously noted the +P group had much less N source in the medium. Many published
papers mentioned that for most species of microalgae, N-deficiency condition may slow down
the protein and chlorophyll synthesis but can maximize the lipid accumulation inside the cell. As
a result, the color of the culture may turn from green to light green and yellow.

74
Figure 31. Ratio of OD680nm to OD750nm of time of bww+Tris+Ac+P, bww+Tris+Ac+N and
bww+Tris+Ac+NP.
1
1.1
1.2
1.3
1.4
1.5
1.6
0 1 2 3 4 5 6 7 8
OD
68
0n
m /
OD
75
0n
m
Time (Day)
bww+Tris+Ac+P
bww+Tris+Ac+N
bww+Tris+Ac+NP

75
Lastly, the comparison of nutrients enriched basic wastewater and nutrients enriched basic
wastewater with Tris and acetic acid addition was listed below in Table 25.
Table 25. Comparison of nutrients enriched basic wastewater and nutrients enriched basic
wastewater with Tris and acetic acid addition.
Treatment with
Nitrogen addition
Treatment with
Phosphorus addition
Treatment with
Both N & P addition
bww
+N
bww+Tris+Ac
+N
bww
+P
bww+Tris+Ac
+P
bww
+NP
bww+Tris+Ac
+NP
Biomass
at Day6
(g•L-1
)
0.182
± 0.0109
1.503
± 0.0020
0.159
± 0.0121
1.387
± 0.0124
0.313
± 0.0368
1.502
± 0.0555
µaverage
(h-1
)
0.011
± 0.0006
0.028
± 0.0007
0.006
± 0.0008
0.028
± 0.0017
0.014
± 0.0016
0.029
± 0.0012
µmax
(h-1
)
0.023
± 0.0017
0.084
± 0.0040
0.019
± 0.0017
0.083
± 0.0068
0.024
± 0.0024
0.084
± 0.0051

76
4.6 Heterotrophic cultivation of wastewater medium and morphology analysis
4.6.1 Heterotrophic cultivation in basic wastewater with added Tris buffer
For heterotrophic cultivation, light was not provided. Therefore no photosynthesis should occur.
The lack of light and availability of organic carbon may lead to the use of other metabolic
pathways. The objective was to test if it would be possible to grow S. obliquus in the wastewater
medium heterotrophically and to observe comparable differences with mixotrophic cultivation
conducted previously.
The medium, buffer and culture condition are listed below in Table 26. The growth data and pH
change is shown in Table 27, Figure 32 and Figure 33 respectively.
Table 26. Comparison of Mixotrophic and Heterotrophic culture of bww+Tris.
Mixotrophic culture bww+Tris Heterotrophic culture bww+Tris
Aeration 5% CO2 enriched air Air
Lighting Yes No
C source(g•L-1
) CO2 Glucose (0.825) Glucose (0.825)
N source(g•L-1
) NH4Cl (0.156) NH4Cl (0.156)
P source(g•L-1
) KH2PO4 (0.036) KH2PO4 (0.036)
Buffer Tris Tris
*bww means basic wastewater.

77
Table 27. Data of Mixotrophic and Heterotrophic culture of bww+Tris.
Mixotrophic culture bww+Tris Heterotrophic culture bww+Tris
Final biomass
(g•L-1
)
0.440 ± 0.0496
0.385 ± 0.0211
µaverage (h-1
) 0.021 ± 0.0013 0.017 ± 0.0009
µmax (h-1
) 0.044 ± 0.0041 0.035 ± 0.0005
Figure 32. Growth curves of Mixotrophic and Heterotrophic culture of bww+Tris.
0
0.2
0.4
0.6
0.8
1
1.2
1.4
1.6
1.8
2
0 2 4 6 8 10
Bio
mas
s (g
•L-1
)
Growth time (Day)
MF+Tris
bww+Tris
bww+Tris(Hetero)
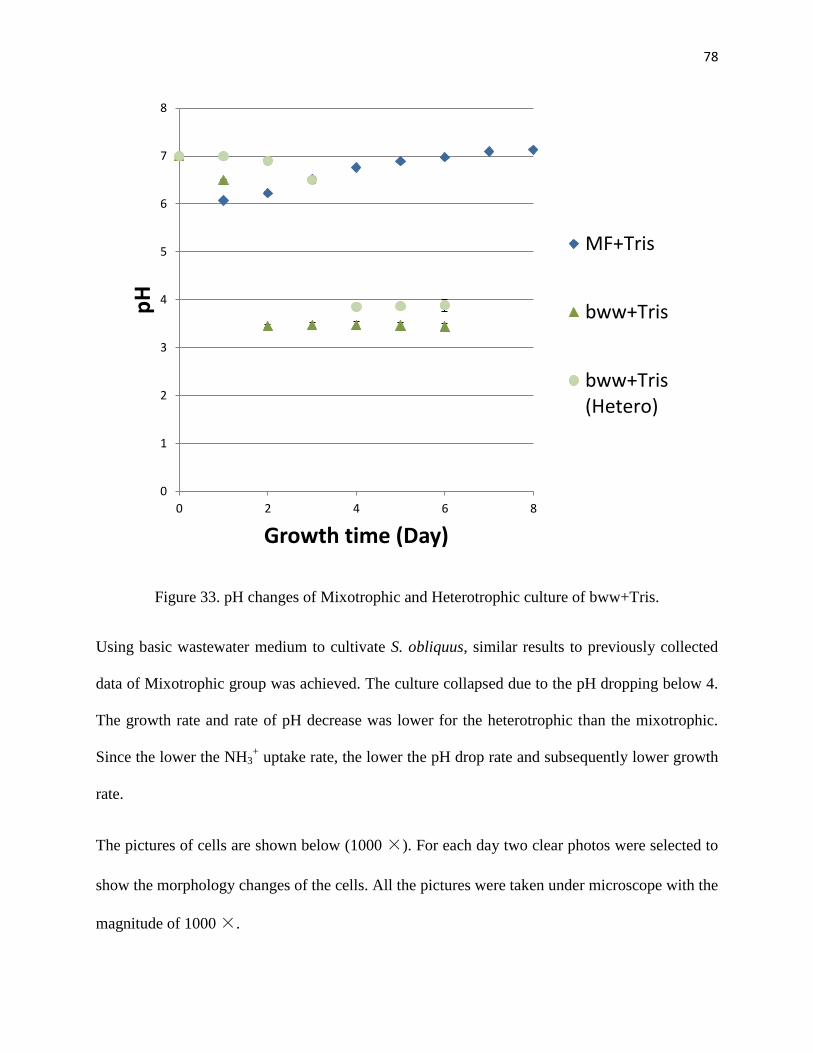
78
Figure 33. pH changes of Mixotrophic and Heterotrophic culture of bww+Tris.
Using basic wastewater medium to cultivate S. obliquus, similar results to previously collected
data of Mixotrophic group was achieved. The culture collapsed due to the pH dropping below 4.
The growth rate and rate of pH decrease was lower for the heterotrophic than the mixotrophic.
Since the lower the NH3+ uptake rate, the lower the pH drop rate and subsequently lower growth
rate.
The pictures of cells are shown below (1000 ×). For each day two clear photos were selected to
show the morphology changes of the cells. All the pictures were taken under microscope with the
magnitude of 1000 ×.
0
1
2
3
4
5
6
7
8
0 2 4 6 8
pH
Growth time (Day)
MF+Tris
bww+Tris
bww+Tris(Hetero)

79
Mixotrophic group Heterotrophic group
Day 1
Day 2
10 µm
10 µm
10 µm
10 µm
10 µm 10 µm
10 µm 10 µm
Figure 34 (1). Micrographs of cells from Mixotrophic and Heterotrophic culture of bww+Tris.

80
Mixotrophic group Heterotrophic group
Day 3
Day 4
10 µm 10 µm
10 µm 10 µm
10 µm 10 µm
10 µm 10 µm
Figure 34 (2). Micrographs of cells from Mixotrophic and Heterotrophic culture of bww+Tris.

81
Mixotrophic group Heterotrophic group
Day 5
Day 6
Figure 34 (3). Micrographs of cells from Mixotrophic and Heterotrophic culture of bww+Tris.
10 µm
10 µm
10 µm
10 µm
10 µm 10 µm
10 µm 10 µm

82
As shown there are obvious differences in cell shape and size. Normal control S. obliquus cells
under optimal cultivation condition should be the oblong spin-shaped and in the form of
quadruplex as the photos shown in the introduction parts.
But here, for Mixotrophic treatment, some of the cells became much larger compared to the
normal size of S. obliquus in 24 hours after inoculation. Day 2, almost all cells became the large
oval shaped. At the same time the quadruplex of S. obliquus started to form. Some round shaped
large cells were observed. On day 3 and day 4 the cells continued to form quadruplex. On day 5
more and more dead cells were observed in the culture. By day 6, more than half of the cells
have been killed duo to acidity.
For the Heterotrophic treatment, the cells became round and are much smaller compared to the
normal control cell of S. obliquus. Furthermore, no quadruplex were formed.

83
4.6.2 Heterotrophic cultivation in alternative N source wastewater medium
Since the cells did not grow well in the basic wastewater medium, therefore ANww, which has
the same C, N and P level as the original basic wastewater was used to test the difference
between heterotrophic and mixotrophic cultivation. According to the previous experiment results,
the pH values of ANww should not drop during the cultivation period.
The medium, buffer and culture condition are listed below in Table 28. The growth data and pH
change is shown in Table 29, Figure 35 and Figure 36 respectively.
Table 28. Comparison of Mixotrophic and Heterotrophic culture of ANww+Tris.
Mixotrophic culture ANww+Tris Heterotrophic culture ANww+Tris
Aeration 5% CO2 enriched air Air
Lighting Yes No
C source(g•L-1
) CO2 Glucose (0.825) Glucose (0.825)
N source(g•L-1
) NaNO3 (0.248) NaNO3 (0.248)
P source(g•L-1
) KH2PO4 (0.036) KH2PO4 (0.036)
Buffer Tris Tris
*ANww means alternative nitrogen wastewater.

84
Table 29. Data of Mixotrophic and Heterotrophic culture of ANww+Tris.
Mixotrophic culture ANww+Tris Heterotrophic culture ANww+Tris
Final biomass
(g•L-1
)
1.433 ± 0.0610
0.191 ± 0.0030
µaverage (h-1
) 0.033 ± 0.0008 0.014 ± 0.0009
µmax (h-1
) 0.054 ± 0.0001 0.025 ± 0.0008
Figure 35. Growth curves of Mixotrophic and Heterotrophic culture of ANww+Tris.
0
0.2
0.4
0.6
0.8
1
1.2
1.4
1.6
1.8
2
0 2 4 6 8 10
Bio
mas
s (g
•L-1
)
Growth time (Day)
MF+Tris
ANww+Tris
Anww+TrisHetero

85
Figure 36. pH changes of Mixotrophic and Heterotrophic culture of ANww+Tris.
As shown the growth curves from Figure 35, for ANww+Tris medium, the growth rate of
mixotrophic cultivation is significantly higher than that of heterotrophic cultivation. This may
because of deficiency in C in the latter and the need of algae cells for an adaptation period to
switch from Mixotrophic to Heterotrophic cultivation. Both treatments’ pH values were stable
around 7. For the heterotrophic cultivation treatment, the growth rate is even lower than the
growth rate of the first 4 days of the heterotrophic bww + Tris group.
0
1
2
3
4
5
6
7
8
0 2 4 6 8 10
pH
Growth time (Day)
MF+Tris
ANww+Tris
Anww+Tris(Hetero)

86
Mixotrophic group Heterotrophic group
Day 1
Day 2
10 µm 10 µm
10 µm 10 µm
10 µm 10 µm
10 µm 10 µm
Figure 37(1). Micrographs of cells from Mixotrophic and Heterotrophic culture of ANww+Tris.

87
Mixotrophic group Heterotrophic group
Day 3
Day 4
10 µm 10 µm
10 µm 10 µm
10 µm 10 µm
10 µm 10 µm
Figure 37(2). Micrographs of cells from Mixotrophic and Heterotrophic culture of ANww+Tris.

88
Mixotrophic group Heterotrophic group
Day 5
Day 6
Figure 37(3). Micrographs of cells from Mixotrophic and Heterotrophic culture of ANww+Tris.
10 µm
10 µm 10 µm
10 µm
10 µm 10 µm
10 µm 10 µm
89
As shown in the images, the cells of mixotrophic treatment are more similar to the control S.
obliquus cells from MF medium culture. They are in quadruplex forms and spin-shaped but not
as large as the cells from bww+Tris group.
For Heterotrophic group, the cells became round shaped and they are visually smaller compared
with the normal cell of S. obliquus. Again, no quadraplexes were formed.

90
5 Conclusions
5.1 Basic wastewater cultivation
As discussed in the results section, the unmodified imitation wastewater medium used in this
experiment by itself is a suboptimal medium for the cultivation of S. obliquus. The major reason
was that the pH of the culture dropped to about 3.5 which led to culture growth inhibition.
Adding Tris buffer into the medium could slow down the pH decrease but could not prevent it.
5.2 pH drop during the culture and its mechanism
Investigation into why the pH dropped suggests that the Ammonia Chloride in the imitation
wastewater medium was the cause of the pH drop during the culture.
Although the specific mechanism is unknown, some researchers suggested that for the freshwater
microalgae species, when they take NH3+ into cell membrane, they have to release a H
+ to the
environment so that the charge equilibrium could be maintain. Instead of H+, the seawater
species will release Na+ (Flynn et al, 1991). As we know, S. obliquus is a freshwater species. It
can be presumed that when the S. obliquus uptakes NH3+ in the medium as N source, they release
H+
into the environment to maintain the charge equilibrium. As a result the concentration of H+
in the culture rises and the pH goes down. This leads to culture growth inhibition.
Other supporting reasons for the above conclusion are the pH values of ANww, ACww and
ANCww which were maintained above 6.5. For ANww, there is no ammonia in the medium so
the pH is stable around 7. For ACww, Sodium Acetate was used, which itself is a basic salt, to
replace the glucose in the original imitation wastewater medium. When the OAc- and NH3
+ were

91
consumed as C and N source respectively, the charge equilibrium was still balanced. So the
concentration of H+ would not change and the pH could be maintained around 7.
If that were true then the pH value of ANCww should go up. According to the experiment result,
the pH value of ANCww indeed went up to about7.6, which is the highest of the ANww, ACww
and ANCww. Considering the Tris buffer is much more effective in the pH range from 7 to 9, the
pH values of ANCww culture did go up during the cultivation.
These results support the conclusion that it is the ammonia chloride that caused the pH drop due
to the release of H+ when the NH3
+ was transported into cell membranes.
5.3 Methods to maintain pH of the wastewater culture
Two different components were added to the culture to test their effects. Adding both
0.00175mol•L-1
Acetic Acid and Sodium Acetate the pH of the culture was maintained around 7
and 6.5 respectively. Adding either Acetic Acid or Sodium Acetate in basic wastewater
significantly increased the biomass at day 6 by 212.5% and 194.3%, respectively. The biomass at
day 6 of Acetic Acid and Sodium Acetate addition is higher by 60.8% and 51.5% with respect to
MF control.
When the wastewater medium was made with acetic acid, extra NaOH was added to adjust the
pH back to 7 before it was autoclaved. Therefore during the cultivation, the consumption of
acetic acid and the released H+ should also be neutralized.

92
The mechanism for adding sodium acetate is similar to that of ACww culture. The consumption
of acetate could maintain the charge equilibrium of the culture when ammonia was utilized as
nitrogen source. As a result the concentration of H+
in the culture would not change.
5.4 Investigation for nutrients deficiency
According to the growth curves, adding NaNO3 to the concentration of MF medium slightly
improves the biomass productivity by 10%. Considering the small difference and the cost of
nutrients, it is not economical.
Adding extra K2HPO4 to the level of MF medium did not improve the biomass productivity
compared with non-fortified medium. However under the N-deficiency condition the culture
became more light green and slightly yellowish than the N-enriched groups. The ratio of
OD680nm/OD750nm shows the chlorophyll content of the N-deficiency group was much less
than that of N-enriched groups. According to other published articles (Mandal et al, 2009;
Parkavi et al, 2011) this situation may indicate the large amount of lipid accumulation inside the
cell, which should happen when the microalgae was grown under N-deficiency condition. But
due to the time limitation the lipid content could not be measure in this experiment.
5.5 Heterotrophic cultivation and the morphology difference
When the basic wastewater medium + Tris buffer was used to cultivate S. obliquus, the same
results were achieved as what from the Mixotrophic group. The culture growth inhibition is due
to the acidity. Although the growth rate of Heterotrophic treatment is lower than that of

93
Mixotrophic treatment, the rate of pH drop was also lower. That is because of the lower the NH3+
uptake rate, the lower the pH drop rate and the lower growth rate.
When the nutrient concentration was held constant and the NH3Cl was replaced by NaNO3 in the
wastewater medium so that the pH could be maintained around 7, a significant difference
between Heterotrophic and Mixotrophic groups was observed. Mixotrophic group reached a
much higher growth rate and final biomass productivity than heterotrophic group. This is
because of deficiency in C in the latter and the need of algae cells for an adaptation period to
switch from Mixotrophic to Heterotrophic cultivation.
With respect to the morphology, cells cultured under heterotrophic condition became round
shaped and smaller compared to the control cells of S. obliquus. In addition, no quadruplexes
were formed. In mixotrophic cultivation of basic wastewater + Tris buffer (bww+tris), S.
obliquus cells appeared larger compared with those grown in the MF control. In mixotrophic
cultivation using wastewater with alternative N source + Tris buffer (ANww+tris), the cells
appeared similar in size as those as grown in the MF control.

94
5.6 Summary
(1) The unmodified imitation wastewater by itself as expected yielded poor S. obliquus growth
owing to its pH significantly decreasing to 3.5, which inhibited cell growth. The pH drop was
found to be caused by the presence of Ammonium Chloride in the wastewater medium.
(2) Adding either Acetic Acid or Sodium Acetate to the wastewater medium maintained its pH at
6.5 to 7.0, and its algae biomass on day 6 increased significantly by 212% and 194%,
respectively.
(3) Adding either Acetic Acid or Sodium Acetate to the wastewater medium maintained its pH at
6.5 to 7.0, and its algae biomass during exponential phase (day 4) significantly exceeded that in
the MF control by 220.6% and 165.8%, respectively, while its algae biomass during saturation
(day 6) significantly exceeded that in the MF control by 60.8% and 51.5%, respectively.
(4) Addition of NaNO3 to the wastewater to match the level of N in the MF medium improved
the algae biomass in the former (bww+Tris+Ac) by 10%.
(5) Adding extra K2HPO4 to the wastewater to match the level of P in the MF medium did not
statistically improve the biomass productivity in the former (bww+Tris+Ac). With a suboptimal
N level, the algae culture appeared lighter green than the MF control, and with a lower ratio of
chlorophyll to biomass, possibly indicating lipid accumulation in the cells.
(6) Heterotrophic cultivation in basic wastewater + Tris culture showed a similar significant
decline in pH within six days as in mixotrophic cultivation, leading to culture collapse. Using
wastewater with alternative N source, the mixotrophic treatment reached significantly higher
growth rate and biomass growth than did the heterotrophic treatment because of deficiency in C

95
in the latter as well as the need of algae cells for an adaptation period to switch from mixotrophic
to heterotrophic mode of growth.
(7) In heterotrophic cultivation, S. obliquus cells appeared round shaped and smaller compared
with those grown in the MF control. Further, no typical quadruplexes formed in the former. In
mixotrophic cultivation of basic wastewater + Tris buffer (bww+tris), S. obliquus cells appeared
larger compared with those grown in the MF control. In mixotrophic cultivation using
wastewater with alternative N source + Tris buffer (ANww+tris), the cells appeared similar in
size as those as grown in the MF control.
Since nitrogen exists generally in the form of ammonia in most actual municipal wastewater, the
results of this study can be practically applied. This study demonstrated why directly using
ammonia-rich municipal wastewater to grow microalgae was problematic. Several methods for
resolving these challenges were presented and, if applied, would allow successful algae biomass
production in ammonia-rich wastewater.

96
5.7 Future work
The future work pertinent to this study could focus on the following points.
(1) Test different buffer solutions.
Using Tris buffer slows down the process of pH drop but cannot stop it. Tris is a buffer
solution which could not be used as nutrients by microalgae. However, the preferential
pH range for Tris buffer is about from 7 to 9, which is to say Tris is more effective
against base, rather than acidity. Therefore, it is valuable if a buffer with preferential pH
range below 7, which also cannot be used as nutrients by microalgae, could be found and
tested to prevent the pH drop during cultivation using wastewater.
(2) Test actual wastewater and different wastewater streams.
This study used an imitation municipal wastewater. Although compared to actual
wastewater, imitation wastewater has advantages on experimental system, it lacks solid
organic materials and other potential toxins which may be present in actual wastewater
could affect the cultivation.
Different types of wastewater have varied composition. For example, food industry
wastewater may be particularly rich in organic carbon, while agriculture waste streams
may have high concentrations of nitrogen and phosphorus (Pittman et al., 2011). Thus,
different strategies of use are necessary and need to be investigated when different types
of wastewater are used as nutrient sources for microalgae cultivation.

97
(3) Test different microalgae species.
Scenedesmus obliquus was used in this study since it has advantages such as high growth
rate, high lipid content and good adaptability. Other species of microalgae should also be
tested. For instance, Chlorella sp. is well known for its high lipid content and ease of
lipid extraction. Haematococcus pluvialis is one of the important sources of Astaxanthin
(Spolaore, 2006). Cultivation of these algae using wastewater could bring high
commercial benefits.

98
Reference
1. Liang, Y., Sarkany, N., & Cui, Y. (2009). Biomass and lipid productivities of Chlorella
vulgaris under autotrophic, heterotrophic and mixotrophic growth conditions. Biotechnology
Letters, 31(7), 1043–1049. Retrieved from http://www.ncbi.nlm.nih.gov/pubmed/19322523
2. Zhang, Y., Su, H., Zhong, Y., Zhang, C., Shen, Z., Sang, W., … Zhou, X. (2012). The effect
of bacterial contamination on the heterotrophic cultivation of Chlorella pyrenoidosa in
wastewater from the production of soybean products. Water Research.
doi:10.1016/j.watres.2012.07.025
3. Perez-Garcia, O., De-Bashan, L. E., Hernandez, J.-P., & Bashan, Y. (2010). Efficiency of
growth and nutrient uptake from wastewater by heterotrophic, autotrophic, and mixotrophic
cultivation of Chlorella vulgaris immobilized with azospirillum brasilense1. Journal of
Phycology, 46(4), 800–812. doi:10.1111/j.1529-8817.2010.00862.x
4. Kong, W., Song, H., Cao, Y., Yang, H., Hua, S., & Xia, C. (2011). The characteristics of
biomass production , lipid accumulation and chlorophyll biosynthesis of Chlorella vulgaris
under mixotrophic cultivation. African Journal of Biotechnology, 10(55), 11620–11630.
doi:10.5897/AJB11.617
5. Feng, Y., Li, C., & Zhang, D. (2011). Lipid production of Chlorella vulgaris cultured in
artificial wastewater medium. Bioresource Technology, 102(1), 101–105. Retrieved from
http://www.ncbi.nlm.nih.gov/pubmed/20620053
6. Pittman, J. K., Dean, A. P., & Osundeko, O. (2011). The potential of sustainable algal biofuel
production using wastewater resources. BIORESOURCE TECHNOLOGY.
7. Makarevičiené, V., Skorupskaitè, V., & Andruleviciûté, V. (2012). Biomass and oil
production of green microalgae Scenedesmus sp . using different nutrients and growth.
Environmental Research Engineering and Management, 62(4), 5–13.
8. Voltolina, D., Gómez-Villa, H., & Correa, G. (2005). Nitrogen removal and recycling by
Scenedesmus obliquus in semicontinuous cultures using artificial wastewater and a
simulated light and temperature cycle. Bioresource Technology, 96(3), 359–362.
doi:10.1016/j.biortech.2004.04.004
9. Flynn, K. J. (1991). Algal carbon–nitrogen metabolism: a biochemical basis for modelling the
interactions between nitrate and ammonium uptake. Journal of Plankton Research, 13, 373–
387. Retrieved from http://plankt.oxfordjournals.org/cgi/doi/10.1093/plankt/13.2.373
10. Larsdotter, K. (2006). WasteWater treatment With microalgae – a literature revieW
avloppsrening med mikroalger – en litteraturstudie. Solar Energy, 62(1), 31–38. Retrieved
from http://tidskriftenvatten.se/mag/tidskriftenvatten.se/dircode/docs/48_article_2125.pdf

99
11. Sophonsiri, C., & Morgenroth, E. (2004). Chemical composition associated with different
particle size fractions in municipal, industrial, and agricultural wastewaters. Chemosphere,
55(5), 691–703. doi:10.1016/j.chemosphere.2003.11.032
12. Aslan, S., & Kapdan, I. K. (2006). Batch kinetics of nitrogen and phosphorus removal from
synthetic wastewater by algae. Ecological Engineering. doi:10.1016/j.ecoleng.2006.04.003
13. Catarino, J., Mendonça, E., Picado, A., Anselmo, A., Nobre da Costa, J., & Partidário, P.
(2007). Getting value from wastewater: by-products recovery in a potato chips industry.
Journal of Cleaner Production. doi:10.1016/j.jclepro.2005.12.003
14. Fuchs, W., Binder, H., Mavrias, G., & Braun, R. (2003). Anaerobic treatment of wastewater
with high organic content using a stirred tank reactor coupled with a membrane filtration
unit. Water Research, 37(4), 902–908. doi:10.1016/S0043-1354(02)00246-4
15. Kim, S., Park, J.-E., Cho, Y.-B., & Hwang, S.-J. (2013). Growth rate, organic carbon and
nutrient removal rates of Chlorella sorokiniana in autotrophic, heterotrophic and
mixotrophic conditions. Bioresource Technology, 144, 8–13.
doi:10.1016/j.biortech.2013.06.068
16. Thacker, Syrett, P. J.. (1972). The assimilation of nitrate and ammonium by chlamydomonas
reinhardi. New Phytol., 71, 423–433.
17. Lomas, M. W., Rumbley, C. J., & Glibert, P. M. (2000). Ammonium release by nitrogen
sufficient diatoms in response to rapid increases in irradiance. Journal of Plankton Research,
22(12), 2351 –2366. doi:10.1093/plankt/22.12.2351
18. Lürling, M (2003). Phenotypic plasticity in the green algae Desmodesmus and Scenedesmus
with special reference to the induction of defensive morphology. Ann. Limnol. - Int. J. Lim.
39 (2), 85-101
19. Shih-Hsin Ho, Wen-Ming Chen, Jo-Shu Chang (2010) Scenedesmus obliquus CNW-N as a
potential candidate for CO2 mitigation and biodiesel production. Bioresource Technology
101 (2010) 8725–8730
20. Qiang Lin, Junda Lin (2011) Effects of nitrogen source and concentration on biomass and oil
production of a Scenedesmus rubescens like microalga. Bioresource Technology 102 (2011)
1615–1621
21. C Combres, G. Laliberte, J, Sevrin Reyssac and J. de la Noue (1994) Effect of acetate on
growth and ammonium uptake in the microalga Scenedesmus obliquus. Physiologia
Plantarum 91: 729-734. 1994
22. Parkavi, K., & Mathumitha, B. (2011). Review of key research efforts to make algae fuels
sustainable. ASTM Special Technical Publication, 1477, 566–576.
100
23. Sophonsiri, C., & Morgenroth, E. (2004). Chemical composition associated with different
particle size fractions in municipal, industrial, and agricultural wastewaters. Chemosphere,
55(5), 691–703. doi:10.1016/j.chemosphere.2003.11.032
24. Mandal, S., & Mallick, N. (2009). Microalga Scenedesmus obliquus as a potential source for
biodiesel production. Applied Microbiology and Biotechnology, 84(2), 281–291.
doi:10.1007/s00253-009-1935-6
25. Nuñez, V. J., Voltolina, D., Nieves, M., Piña, P., Medina, A., & Guerrero, M. (2001).
Nitrogen budget in Scenedesmus obliquus cultures with artificial wastewater. Bioresource
Technology, 78(2), 161–164. doi:10.1016/S0960-8524(00)00183-8
26. Abreu, A. P., Fernandes, B., Vicente, A. A., Teixeira, J., & Dragone, G. (2012). Mixotrophic
cultivation of Chlorella vulgaris using industrial dairy waste as organic carbon source.
Bioresource Technology, 118, 61–6. doi:10.1016/j.biortech.2012.05.055
27. Kong, Q., Li, L., Martinez, B., Chen, P., & Ruan, R. (2010). Culture of microalgae
Chlamydomonas reinhardtii in wastewater for biomass feedstock production. Applied
Biochemistry and Biotechnology, 160(1), 9–18. doi:10.1007/s12010-009-8670-4
28. Starckx, Senne (2012). A place in the sun - Algae is the crop of the future. Geel Flanders
Today, Retrieved 8 December 2012
29. Cardozo, Karina H.-M.; Thais, Guaratini; Marcelo P., Barros; Vanessa R., Falcão; Angela P.,
Tonon; Norberto P., Lopes; Sara, Campos; Moacir A., Torres; Anderson O., Souza; Pio,
Colepicolo; Ernani, Pinto (2006).Metabolites from algae with economic
impact. Comparative Biochemistry and Physiology 146 (1-2): 60–78.
doi:10.1016/j.cbpc.2006.05.007. Retrieved 2013-12-15.
30. Miller, J.D.A., Fogg, G.E. (1958). Studies on the growth of Xanthophyceae in pure culture.
Mikrobiologie, Bd, 30, S. 1-16.
31. John J. Milledge (2010). Commercial application of microalgae other than as biofuels: a brief
review. Rev Environ Sci Biotechnol 10:31–41 DOI 10.1007/s11157-010-9214-7
32. Spolaore, P. Cassan, C. Duran, E. Isambert, A. (2006). Commercial Applications of
Microalgae. Journal of Bioscience and Bioengineering . Vol. 101, No. 2, 87–96. 2006 DOI:
10.1263/jbb.101.87
33. Raja R, Hemaiswarya S, Ashok Kumar N, Sridhar S, Rengasamy R (2008) A Perspective on
Biotechnological Potential of Microalgae. Crit Rev Microbiol 34:34–77
34. Becker, E.W. Borowitzka, M. A. Borowitzka, L. J. (1988). Micro-algae for human and
animal consumption, Micro-algal biotechnology. Cambridge University Press p. 222–256.

101
35. Kuwahara, Sara S., Cuello, Joel L. (2009) Investigation into the feasibility of reclaimed and
secondary wastetwater as alternative feedstocks for the growth of green algae for the
production of biofuels. ASABE Conference presentation.Bio-09.