Embed Size (px)
Citation preview
Mitsubishi UFJ Securities Holdings Business Strategy
June 2014
1
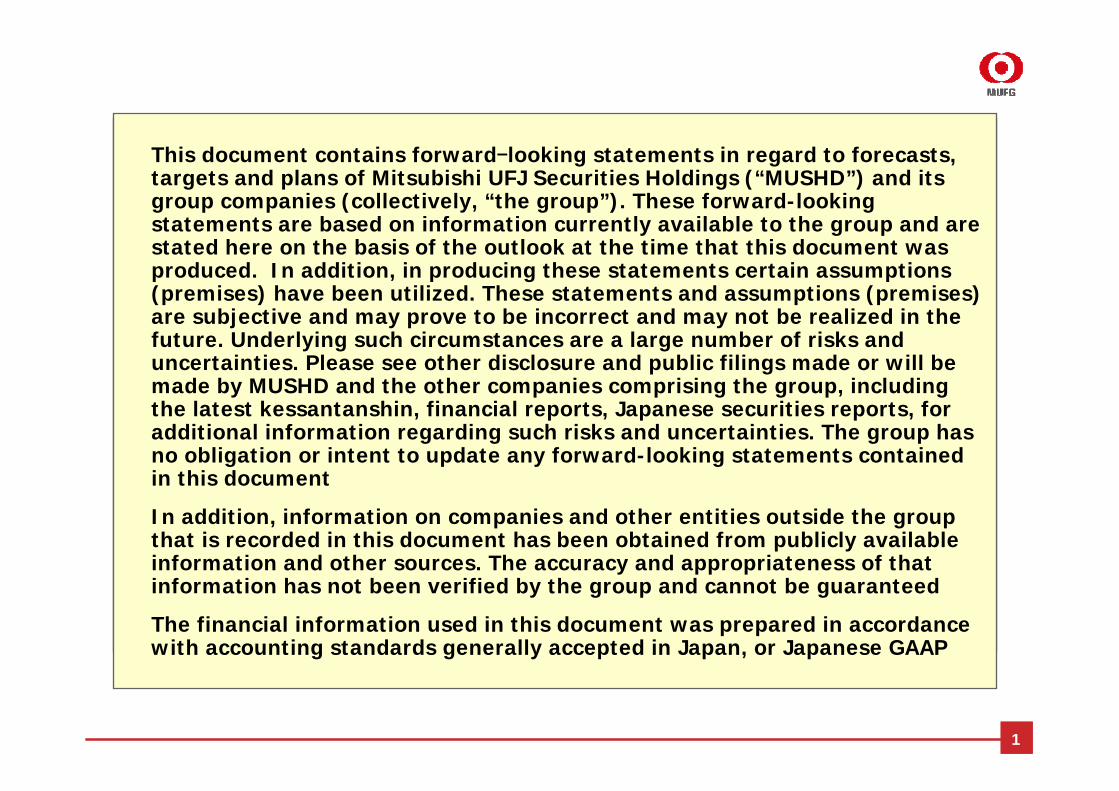
This document contains forward-looking statements in regard to forecasts, targets and plans of Mitsubishi UFJ Securities Holdings (“MUSHD”) and its group companies (collectively, “the group”). These forward-looking statements are based on information currently available to the group and are stated here on the basis of the outlook at the time that this document was produced. In addition, in producing these statements certain assumptions (premises) have been utilized. These statements and assumptions (premises) are subjective and may prove to be incorrect and may not be realized in the future. Underlying such circumstances are a large number of risks and uncertainties. Please see other disclosure and public filings made or will be made by MUSHD and the other companies comprising the group, including the latest kessantanshin, financial reports, Japanese securities reports, for additional information regarding such risks and uncertainties. The group has no obligation or intent to update any forward-looking statements contained in this document
In addition, information on companies and other entities outside the group that is recorded in this document has been obtained from publicly available information and other sources. The accuracy and appropriateness of that information has not been verified by the group and cannot be guaranteed
The financial information used in this document was prepared in accordance with accounting standards generally accepted in Japan, or Japanese GAAP

2
Results in MUSHD
OverviewOverview
Growth StrategyGrowth Strategy
Major SubsidiariesMajor Subsidiaries
19 202122
AppendixAppendix
Contents
Strategic framework of current medium-term business plan (FY12-14) Financial products intermediation business Private banking business Strengthening collaboration with Morgan Stanley
MUMSS- Earnings by business unit- Investment banking business unit- Global market business unit- Sales divisions
Overseas subsidiaries
Structure of group companies and scale of earnings Earnings Results comparison
910121416
25
4 56

3
Overview
4
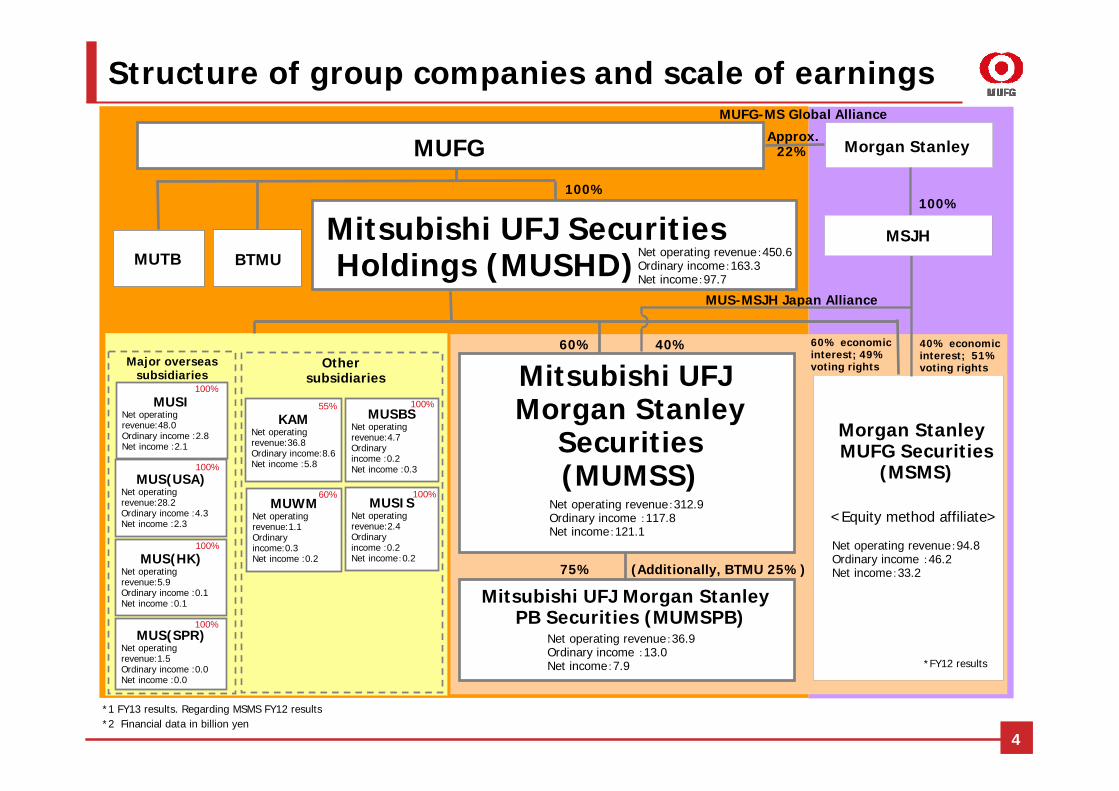
Structure of group companies and scale of earnings
Major overseas subsidiaries
Other subsidiaries
100%
Mitsubishi UFJ Securities Holdings (MUSHD)
40%
Morgan Stanley MUFG Securities
(MSMS)
100%
Morgan Stanley
MUS-MSJH Japan Alliance
MUFG-MS Global Alliance
KAMNet operating revenue:36.8Ordinary income:8.6Net income :5.8
MUFGApprox.
22%
Mitsubishi UFJMorgan Stanley
Securities(MUMSS)
MUTB BTMUMSJH
MUSBSNet operating revenue:4.7Ordinary income :0.2Net income :0.3
MUSISNet operating revenue:2.4Ordinary income :0.2Net income:0.2
MUSINet operating revenue:48.0Ordinary income :2.8Net income :2.1
MUS(USA)Net operating revenue:28.2Ordinary income :4.3Net income :2.3
MUS(HK)Net operating revenue:5.9Ordinary income :0.1Net income :0.1
MUS(SPR)Net operating revenue:1.5Ordinary income :0.0Net income :0.0
MUWMNet operating revenue:1.1Ordinary income:0.3Net income :0.2
Net operating revenue:312.9Ordinary income :117.8Net income:121.1
Net operating revenue:94.8Ordinary income :46.2Net income:33.2
Net operating revenue:450.6Ordinary income:163.3Net income:97.7
*1 FY13 results. Regarding MSMS FY12 results*2 Financial data in billion yen
55% 100%
100%
100%
100%
100%
100%
60%
60%
Mitsubishi UFJ Morgan Stanley PB Securities (MUMSPB)
Net operating revenue:36.9Ordinary income :13.0Net income:7.9
75% (Additionally, BTMU 25%)
60% economic interest; 49% voting rights
40% economic interest; 51% voting rights
<Equity method affiliate>
*FY12 results
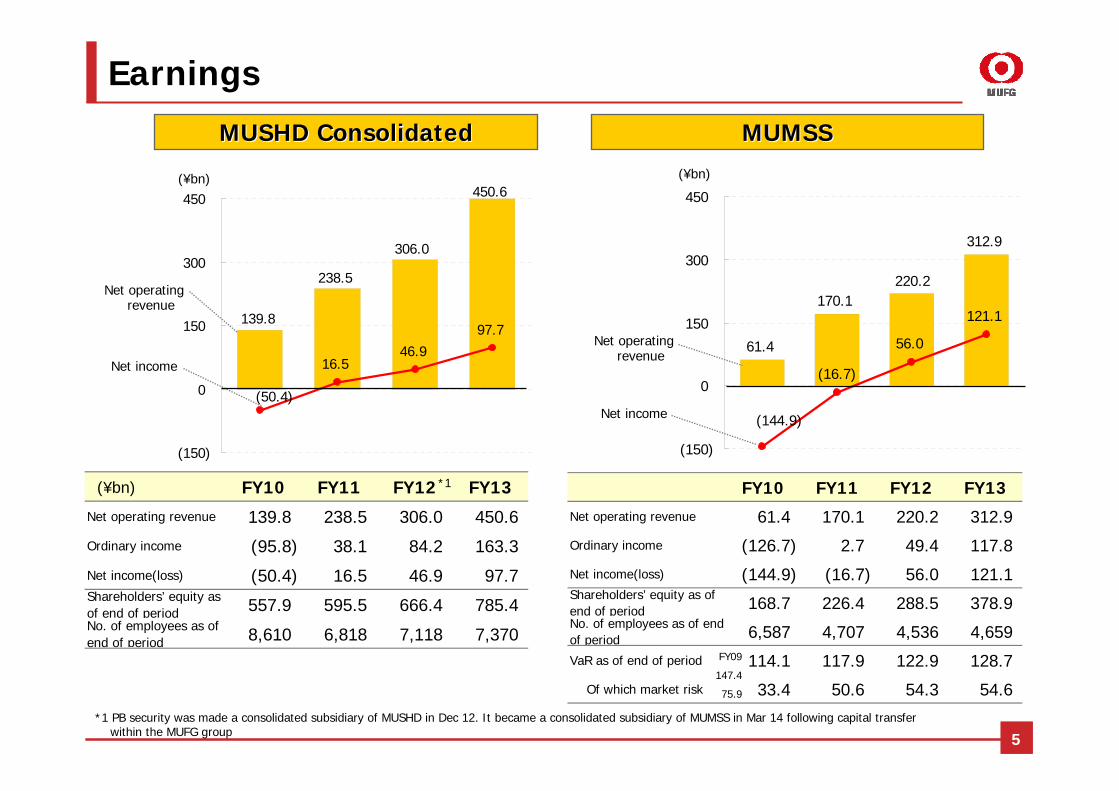
FY10 FY11 FY12 FY13
Net operating revenue 139.8 238.5 306.0 450.6
Ordinary income (95.8) 38.1 84.2 163.3
Net income(loss) (50.4) 16.5 46.9 97.7Shareholders’ equity asof end of period 557.9 595.5 666.4 785.4No. of employees as ofend of period 8,610 6,818 7,118 7,370
61.4
170.1
312.9
220.2
(16.7)
56.0
121.1
(144.9)
(150)
0
150
300
450
306.0
238.5
139.8
450.6
16.546.9
97.7
(50.4)
(150)
0
150
300
450
5
Earnings
*1 PB security was made a consolidated subsidiary of MUSHD in Dec 12. It became a consolidated subsidiary of MUMSS in Mar 14 following capital transfer within the MUFG group
(¥bn)
MUMSSMUMSSMUSHDMUSHD ConsolidatedConsolidated
Net operating revenue
Net income
(¥bn)
FY09
147.4
75.9
Net operating revenue
Net income
(¥bn) (¥bn)*1 FY10 FY11 FY12 FY13
Net operating revenue 61.4 170.1 220.2 312.9
Ordinary income (126.7) 2.7 49.4 117.8
Net income(loss) (144.9) (16.7) 56.0 121.1Shareholders’ equity as ofend of period 168.7 226.4 288.5 378.9No. of employees as of endof period 6,587 4,707 4,536 4,659
VaR as of end of period 114.1 117.9 122.9 128.7
Of which market risk 33.4 50.6 54.3 54.6

Change Change Change Change Change
350.5 487.7 +39% 2,079.9 1,831.8 (11)% 525.4 642.8 +22% 331.6 367.7 +10% 296.6 351.7 +18%
306.0 450.6 +47% 1,813.6 1,557.0 (14)% 417.3 541.9 +29% 257.2 323.1 +25% 274.7 327.9 +19%
171.9 242.5 +41% 562.4 733.1 +30% 229.5 301.9 +31% 142.7 209.7 +46% 143.1 190.3 +32%
22.6 44.9 +98% 176.4 284.6 +61% 48.8 89.6 +83% 39.9 68.2 +70% 19.2 45.7 +138%
29.2 43.2 +47% 28.9 54.4 +88% 26.6 29.6 +11% 26.1 37.6 +44% 18.3 34.5 +88%
47.4 62.9 +32% 182.7 189.9 +3% 46.6 55.9 +19% 28.8 41.0 +42% 66.3 65.4 (1)%
72.5 91.4 +26% 174.4 204.2 +17% 107.3 126.7 +18% 47.8 62.7 +31% 39.1 44.5 +13%
107.3 210.4 +96% 367.9 476.3 +29% 123.5 156.4 +26% 68.2 69.8 +2% 119.7 126.8 +5%
Stocks 8.5 64.6 +660% - - - 38.1 47.3 +24% 10.4 26.0 +150% 3.3 11.4 +245%
Bonds, exchanges, etc 98.8 145.7 +47% - - - 85.3 109.1 +27% 57.8 43.7 (24)% 116.4 115.4 +0%
(4.7) (1.0) - 8.0 11.3 +41% 16.5 17.4 +5% 1.4 3.8 +171% - - -
0.1 0.1 +0% 747.4 194.6 (73)% 62.5 58.9 (5)% - - - 10.0 10.8 +8%
31.4 (1.4) - 127.6 141.5 +10% 23.1 47.6 +106% 44.8 39.8 (11)% 9.6 7.7 (19)%
256.8 316.7 +23% 1,575.9 1,195.4 (24)% 333.4 357.3 +7% 227.1 282.6 +24% 200.2 227.8 +13%
49.2 133.9 +172% 237.7 361.6 +52% 83.8 184.5 +120% 30.0 40.5 +35% 74.4 100.1 +34%
35.0 29.3 (16)% - - - 11.3 12.4 +9% 2.3 2.6 +13% 1.2 1.9 +58%
84.2 163.3 +93% 237.7 361.6 +52% 95.1 197.0 +107% 32.4 43.1 +33% 75.7 102.1 +34%
1.6 5.5 +243% - - - (3.5) (1.4) - (7.3) (0.9) - (1.9) (0.4) -
46.9 97.7 +108% 107.2 213.5 +99% 72.9 169.4 +132% 28.6 51.2 +79% 45.7 64.6 +41%
7.4% 13.5% +6.0% 4.9% 8.9% +4.0% 8.6% 17.0% +8.4% 5.7% 8.5% +2.8% 9.4% 11.7% +2.3%
Net gain on private equity andother securities
Operating revenue
Net operarig revenue
Commision received
Net trading income
Comission to consignees
Net interest income
Others
Comission for underwriting,secondary distribution
Selling, general and administrativeexpenses
Net income(loss)
Operating income(loss)
Non-operating income
Ordinary income(loss)
Extraordinary income(loss)
FY12
Fee for offering,secondary distributuin
Other fee received
FY13FY12 FY12FY13 FY13 FY13
ROE(Net income/Net assets)
MUSHD Nomura Holdings Daiwa Securities GroupMizuho Securities
(consolidated)SMBC Nikko Securities
(consolidated)
FY12FY13 FY12
6
Results comparison 1 (Consolidated)
(Source) Calculated by MUSHD based on company disclosures
MUSHD led the competition in the growth rate of net operating revenue MUSHD ranked 3rd among the competition in the amount of net operating revenue, ordinary
income and net income
(¥bn)*1
*2
*1 Merged Mizuho Securities and Mizuho Investors Securities in Jan 13*2 ROE in “change” represents change band

<Ref>MUMSS
+MUMSPB(Simpletotal)
Change Change Change Change Change
230.4 321.8 +39% 662.4 816.2 +23% 303.2 399.8 +31% 221.1 279.0 +26% 280.5 333.4 +18% 358.8
220.2 312.9 +42% 587.6 749.3 +27% 282.2 380.3 +34% 189.0 252.7 +33% 267.9 318.5 +18% 349.9
110.1 165.4 +50% 362.8 481.8 +32% 151.6 206.1 +35% 101.6 148.1 +45% 138.7 184.0 +32% 182.5
19.0 42.6 +124% 78.6 156.7 +99% 35.8 70.8 +97% 21.2 43.1 +103% 18.5 43.9 +137% 43.2
11.1 20.7 +86% 26.0 44.0 +69% 23.1 25.1 +8% 18.8 24.4 +29% 18.3 34.5 +88% 20.7
42.4 51.2 +20% 157.7 162.3 +2% 44.5 53.9 +21% 28.5 37.1 +30% 66.3 64.9 (2)% 62.9
37.4 50.8 +35% 100.3 118.6 +18% 48.1 56.1 +16% 32.9 43.4 +31% 35.5 40.6 +14% 55.4
97.2 136.9 +40% 219.4 268.8 +22% 124.4 161.1 +29% 76.6 95.5 +24% 119.7 126.8 +5% 156.9
Stocks 19.5 48.2 +147% 32.3 101.4 +213% 34.6 50.1 +44% 10.0 25.8 +158% 3.3 11.4 +245% 49.8
Bonds, exchanges, etc 77.6 88.6 +14% 187.0 167.4 (10)% 89.8 111.0 +23% 66.5 69.7 +4% 116.4 115.4 +0% 107.0
12.7 10.4 (18)% 5.3 (1.3) - 6.1 13.0 +113% 12.9 7.0 (45)% 9.5 7.6 (20)% 10.3
172.4 196.6 +14% 448.5 497.0 +10% 211.7 226.1 +6% 155.5 202.7 +30% 195.2 221.8 +13% 220.3
47.8 116.3 +143% 139.0 252.3 +81% 70.4 154.1 +118% 33.5 49.9 +48% 72.7 96.6 +32% 129.5
1.6 1.4 (12)% (0.5) (0.3) - 1.5 1.3 (13)% 5.4 4.3 (20)% 0.7 0.5 (28)% 1.3
49.4 117.8 +138% 138.4 251.9 +82% 71.9 155.5 +116% 39.0 54.3 +39% 73.4 97.1 +32% 130.9
1.1 5.3 +381% 1.5 4.5 +200% (0.2) (1.0) - (11.0) (0.2) - (1.8) (0.5) -
50.6 123.1 +143% 140.0 256.4 +83% 71.7 154.4 +115% 28.0 54.0 +92% 71.5 96.6 +35%
56.0 121.1 +116% 88.1 158.7 +80% 65.9 144.3 +118% 31.3 60.1 +92% 44.9 61.4 +36%
21.8% 36.3% +14.5% 9.4% 15.9% +6.4% 12.5% 22.7% +10.2% 6.5% 10.5% +3.9% 9.3% 11.3% +2.0%
FY13 FY13FY12 FY12FY13
Net trading income
Comission to consigneesComission for underwriting,secondary distributionFee for offering,secondary distributuin
FY12 FY12FY13
Nomura Securities Daiwa SecuritiesMUMSS Mizuho Securities
Income before minority interests
Selling, general and administrative expenses
Ordinary income(loss)
Operating income(loss)
Extraordinary income(loss)
Non-operating income
Net interest income
FY13FY13FY12
ROE(Net income/Net assets)
SMBC Nikko Securities
Operating revenue
Net operarig revenue
Commision received
Other fee received
Net income(loss)
7
Results comparison 2 (Non-consolidated)
MUMSS led in growth rate of net operating revenue and ordinary income Together with subsidiary MUMSPB, MUMSS ranked 3rd in net operating revenue
(Source) Calculated by MUSHD based on company disclosures
(¥bn)
*1
*2
*1 Merged Mizuho Securities and Mizuho Investors Securities in Jan 13*2 ROE in “change” represents change band

8
Major Subsidiaries
(80)
(40)
0
40
80
FY10 FY11 FY12 FY13
9
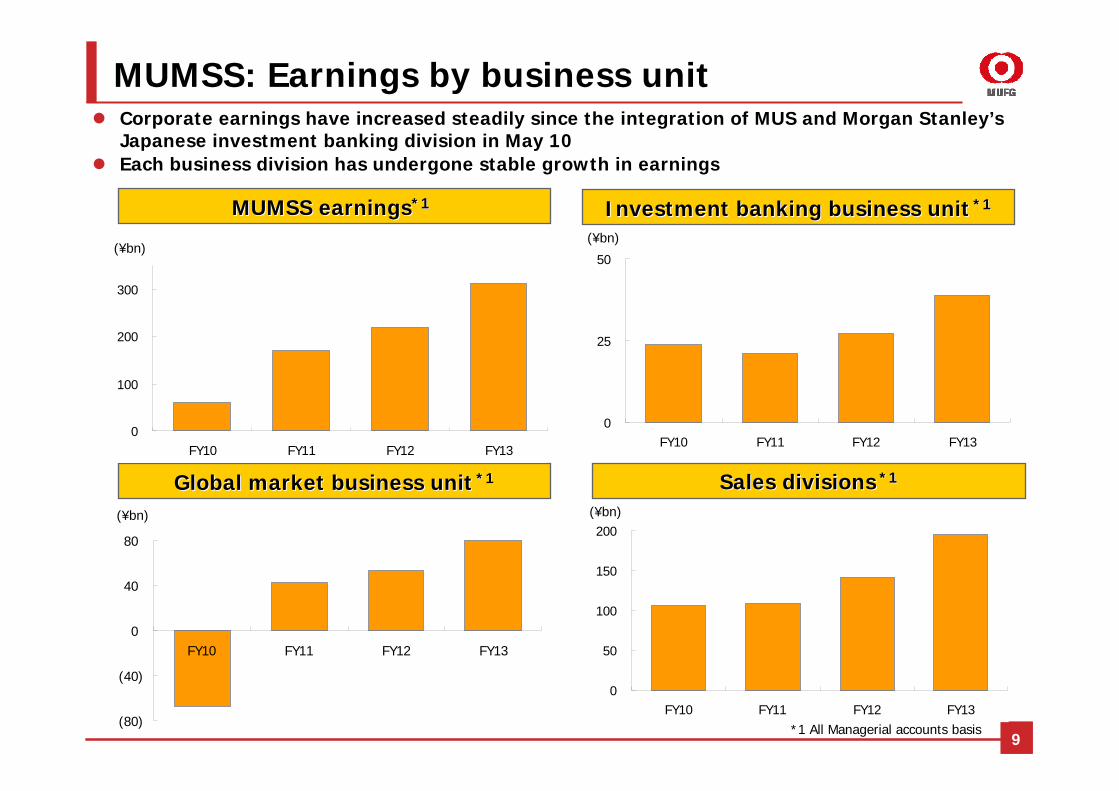
Corporate earnings have increased steadily since the integration of MUS and Morgan Stanley’s Japanese investment banking division in May 10
Each business division has undergone stable growth in earnings
MUMSS: Earnings by business unit
SSales divisionsales divisions *1*1
MUMSS earningsMUMSS earnings*1*1 Investment banking business unitInvestment banking business unit *1*1
*1 All Managerial accounts basis
Global market business unitGlobal market business unit *1*1
0
100
200
300
FY10 FY11 FY12 FY13
(¥bn)
0
50
100
150
200
FY10 FY11 FY12 FY13
(¥bn)
0
25
50
FY10 FY11 FY12 FY13
(¥bn)
(¥bn)

10
MUMSS: Investment banking business unit (league table)
(Source) Thomson Reuters (data compiled by Mitsubishi UFJ Morgan Stanley)*1 Includes Japanese Straight Bonds, Ex-FILP Agency Bonds ( incl. Expressway company's bonds ) and Municipal Bonds Related. Based on lead manager's credit*2 Mitsubishi UFJ Morgan Stanley includes domestic offerings of Japanese issuers underwritten by Morgan Stanley MUFG Securities as well as global offerings of Japanese issuers underwritten by Morgan Stanley. Based on underwriting amount*3 Any Japanese involvement announced including property acquisitions. Mitsubishi UFJ Morgan Stanley includes deals advised by Morgan Stanley
1st in the overall domestic league table for debt underwriting for the 4 consecutive years 2nd in equity underwriting after being mandated lead manager for many large-scale offerings 1st in M&A with a significant lead over second place and below
MUMSS Nomura MUMSS
2,478.4 bn yen 20.0% 1,429.3 bn yen 32.1% 5,180.1 bn yen 33.2%
Mizuho Securities MUMSS Nomura
2,278.8 bn yen 18.4% 756.6 bn yen 17.0% 2,603.7 bn yen 16.7%
Nomura Securities Sumitomo Mitsui FG Goldman Sachs & Co
2,205.3 bn yen 17.8% 661.3 bn yen 14.9% 2,572.6 bn yen 16.5%
SMBC Nikko Securities Mizuho FG Sumitomo Mitsui FG
2,005.9 bn yen 16.2% 476.1 bn yen 10.7% 2,340.5 bn yen 15.0%
Daiwa Securities Daiwa Securities Group Credit Suisse
1,993.4 bn yen 16.1% 456.5 bn yen 10.3% 2,228.7 bn yen 14.3%
MUMSS Daiwa Securities Group Mizuho FG2,793.4 bn yen 22.5% 700.1 bn yen 22.1% 4,982.9 bn yen 36.7%
Mizuho Securities Nomura Nomura2,618.2 bn yen 21.1% 638.7 bn yen 20.2% 4,564.3 bn yen 33.6%
Nomura Securities MUMSS MUMSS2,151.7 bn yen 17.3% 366.3 bn yen 11.6% 4,141.4 bn yen 30.5%
Daiwa Securities Mizuho FG JPMorgan1,846.7 bn yen 14.9% 356.9 bn yen 11.3% 2,716.1 bn yen 20.0%
SMBC Nikko Securities Sumitomo Mitsui FG Goldman Sachs & Co1,565. bn yen 12.6% 331.4 bn yen 10.5% 2,350.2 bn yen 17.3%
5th
4th
3rd
2nd
1st
M&A Advisory (based on rank value)*3Japanese Equity and Equity-linked*2
Apr 13 - Mar 14
Japanese Domestic Debt*1
Apr 12 - Mar 13
4th
5th
1st
2nd
3rd

MUMSS/MSas advisers
Rank Date Rank value(US$ mm)
Seller/target Buyer
1 2014/1/13 15,688
2 2013/9/24 6,987
3 2013/7/2 5,315
4 2013/9/26 3,960
5 2013/6/11 3,277
6 2013/5/10 2,934
7 2013/11/6 2,888
8 2013/9/9 2,122
9 2013/9/27 1,680
10 2013/11/29 1,550
MUMSS/MS Transactions*1 Excluding real estate transactions and share repurchase transactions in which shareholders are not identified
*2 As of May 21, 2014
(Source) Thomson Reuters
☑
☑
☑
☑
☑
☑
☑
☑
MUMSS: Investment banking business unit (M&A)
Advised 8 out of 10 largest Japanese M&A transactions announced in FY13
Suntory HoldingsBeam
Resona HoldingsDeposit Insurance Corporation of Japan
Mitsubishi Motors Corporation
Tokyo Electron Applied Materials
GROHE LIXIL
GlaxoSmithKline’s beverage businesses Suntory Beverage & Food
Hitachi’s thermal power generation systems business
MHI’s thermal power generation systems business
BTMUBank of Ayudhya
MHI/MC/BTMU
Panasonic Healthcare KKR
ThyssenKrupp Steel USA Nippon Steel & Sumitomo Metal, ArcelorMittal
11
MUMSS/MS as advisors in top 10 Japanese M&A transactionsMUMSS/MS as advisors in top 10 Japanese M&A transactions*1*1 in FY13in FY13*2*2

12
MUMSS: Global market business unit (earnings)
Trading income has increased successfully since 09 from the steady uptake of customer flows JGB auction ranking remain high and stable, and a top-class market presence has been
established
Trading income and lossTrading income and loss
(Source) Ministry of Finance press release
Market presenceMarket presence
<JGB auction results>
93.2
(35.9)
80.5
110.0
147.3
(50)
0
50
100
150
FY09 FY10 FY11 FY12 FY13
Bonds/Exchange, othersStocks
Net trading income + net interest income
(¥bn) Rank FY13 H1 FY13 H2
1 Nomura Securities Daiwa Securities
2 Daiwa Securities MUMSS
3 MUMSS Nomura Securities
4 Mizuho Securities Mizuho Securities
5 Merrill Lynch Japan Securities BTMU
Rank FY12 H1 FY12 H2
1 MUMSS Mizuho Securities
2 Nomura Securities Nomura Securities
3 Mizuho Securities MUMSS
4 Deutsche Securities BTMU
5 BTMU Daiwa Securities

MUMSS14.0%
13
MUMSS11.7%
MUMSS: Global market business unit (transactions share)
High market share has been secured by enhanced flow business from customers. Market share in equity securities has risen steadily
Change in market shareChange in market share
Pu
blic and Corporate B
ondsP
ublic and C
orporate Bonds
Equities
Equities (w
ith dom
estic institu
tions
(with dom
estic institution
s
Overall market volumeapprox. ¥1,564 tn
Transactions share(FY13)Transactions share(FY13)
(Excl. inter-dealer transaction)
(Source) Created by MUMSS based on data from JSDA
Overall TSE market volumeapprox. ¥64 tn
(Source) Created by MUSHD based on data from TSE
*1 Life and non-life insurance, city & regional banks, trust banks and investment trusts on TSE definition
*1

1,044.51,321.1 1,272.8
1,579.7
2,002.4
0
500
1,000
1,500
2,000
2,500
FY09 FY10 FY11 FY12 FY13
Own channelIntermediation channel 782.9
715.6
881.8
1,028.3
1,175.7
0
300
600
900
1,200
FY09 FY10 FY11 FY12 FY13Intermediation channel Own channel
22.4
21.2 21.2
22.8
24.3
20
21
22
23
24
25
FY09 FY10 FY11 FY12 FY13
0
300
600
900
1,200
FY09 FY10 FY11 FY12 FY1314
Sales of various products are on the rise. Sales of foreign bonds and stocks have increased in particular as a result of product line expansion
AUM is rising with contribution also from market appreciation
MUMSS: Sales divisions
Equity investment trusts salesEquity investment trusts sales Sales of foreign bonds (Retail)Sales of foreign bonds (Retail)
Sales of foreign stocksSales of foreign stocks*1 *1 (Retail)(Retail) AUMAUM
(¥bn)(¥bn)
(¥bn) (¥tn)*1 Total of over-the-counter and brokerage,excluding intermediation channel

15
Blank

10.9
3.8
(0.6)
5.67.6
(5)
0
5
10
15
FY09 FY10 FY11 FY12 FY13
Americas Europe Asia Total
16
Overseas subsidiaries: Earnings overview
Secured profit for 2 consecutive years, as a result of collaboration between banking and securities, despite continuation of unstable market condition
Europe :MUSI Secured profit with DCM and customer
derivatives trading driving gains, amid a lackluster market conditions
Americas :MUS(USA) Profit grew as a result of a major lead
manager mandate in underwriting and continued progress in collaboration between banking and securities
Asia :MUS(HK), MUS(SPR) Realized profit for the fiscal year by
expanding business as a spoke of MUSI and MUMSS
*2 Income (loss) before income taxes*3 ¥40.6 billion loss nine months ended Dec 13
(Reference) Income (loss) of overseas business operations
(Source) Nomura Holdings, Inc. Annual securities report, financial information by regionDaiwa Securities Group Inc. Earnings announcement, other domestic group companies and overseas operation
(¥bn)
*1 There is a three-month gap between the consolidated accounting period and the accounting period of overseas subsidiaries
Ordinary income (loss)Ordinary income (loss)(¥bn)
FY09 FY10 FY11 FY12 FY13
35.5 (55.5) (129.0) (79.4) N.A.*3
3.7 (21.5) (25.8) (10.5) (5.1)
Nomura HD*2
Daiwa Securities Group

17
Overseas subsidiaries: League table Maintained the top share among Japanese securities companies, mainly as a result of
collaboration between banking and securities
<Americas>
<Europe>
Corporate bondsCorporate bonds*1*1 bookrunnerbookrunner* Investment Grade
Changes in rankingChanges in ranking
(Source) Thomson Reuters
(Source) Thomson Reuters
Rank Bookrunner Amount (USD MM) Share(%)
1 JP Morgan 90,903 8.92 Bank of America Merrill Lynch 78,648 7.73 Morgan Stanley 75,208 7.44 Citi 73,982 7.35 Goldman Sachs & Co 67,567 6.66 Barclays 52,936 5.27 Deutsche Bank 38,834 3.88 Wells Fargo & Co 35,047 3.49 HSBC Holdings PLC 23,703 2.310 Credit Suisse 21,733 2.114 MUS(USA) 12,432 1.216 Mizuho Financial Group 10,171 1.026 Nomura 2,229 0.239 Sumitomo Mitsui Finl Grp Inc 982 0.1
Rank Bookrunner Amount (USD MM) Share(%)
1 BNP Paribas SA 25,613 8.52 Deutsche Bank 24,955 8.23 Societe Generale 20,517 6.84 HSBC Holdings PLC 17,100 5.65 JP Morgan 15,327 5.16 Barclays 15,265 5.07 RBS 15,160 5.08 UniCredit 15,067 5.09 Credit Agricole CIB 12,999 4.310 Citi 11,662 3.922 MUSI 4,120 1.424 Mizuho Financial Group 2,717 0.936 Nomura 1,195 0.439 Sumitomo Mitsui Finl Grp Inc 877 0.3
0
10
20
30
40
50
60
09 10 11 12 13(Rank)
MUSI Nomura Mizuho SMFG
1
0
10
20
30
40
50
60
70
09 10 11 12 13(Rank)
MUS(USA) Nomura DaiwaMizuho SMFG
1
(year)
(year)

18
Growth Strategy

19
Strategic framework of current medium-term business plan (FY12-14)
Rigorous use of MUFG’s
capabilities as a group
<Medium-term Business Plan Vision>
To respond to customers’ diverse needs as MUFG’s core securities group
by collaborating with MUFG group companies as a bank-affiliated securities firm,
and by leveraging our relationship with Morgan Stanley
Further strengthening of collaboration
with Morgan Stanley
Enhance equity-related operations
(in the primary and secondary markets)Strengthen customer oriented business
Enlarge flows to build an earnings base

20
Financial products intermediation business Earnings from the steadily growing financial products intermediation business have roughly
tripled in five years Sales of products such as foreign bonds and investment trusts have also doubled
Sales from financial products intermediationSales from financial products intermediationNet operating revenue from financial Net operating revenue from financial products intermediationproducts intermediation
0
10
20
30
40
FY09 FY10 FY11 FY12 FY13500
550
600
650
700
750
(No. of staff)
Net operating revenue(LHS)
Staff on assignment from MUMSS(RHS)
(¥bn)
424.3
523.0
579.0
772.7
919.6
200
400
600
800
1,000
FY09 FY10 FY11 FY12 FY13
Investment trusts
Foreign bonds
(¥bn)

21
Private banking business: MUMSPB Became a consolidated subsidiary of MUMSS and renamed, following the capital transfer on Mar 14 Accelerating collaboration with the group companies in MUSHD and MS Awarded “Best private banking services” in Japan for 2 consecutive years by Euromoney magazine
EarningsEarnings
AUM and sales of investment productsAUM and sales of investment products
Net operating revenueNet operating revenue
Structure of collaborationStructure of collaborationMUMSS Group
MUMSPB
MUMSSSales branches
MUMSSInstitutional clients, investment banking, products and markets, CC
Customer referrals
Equity and institutional tradingIPO and other needs
Assignment of personnel Supply of productsBusiness support
Systems infrastructure
MUTB BTMUMS Group
(MSMS/MSWM)
・Supply of trust banking functions
・Customer referrals (individuals, business owners)
・Personnel assignment・Supply of lending and other banking
functions
・Supply of wealth management know how such as research and training
・Supply of products0
1,000
2,000
3,000
FY09 FY10 FY11 FY12 FY130
200
400
600
800
1,000Direct business (LHS)
Business through BTMU (LHS)
Sales of investment products (RHS)
(¥bn)(¥bn)
Change
Net operating revenue 28.4 36.9 8.4
15.3 23.7 8.4
Referral fee to BTMU 2.3 7.9 5.6
Operating income 13.1 13.2 0.0
Ordinary income 13.3 13.0 (0.3)
Net income 8.2 7.9 (0.2)
FY12 FY13
G&A expense
(¥bn)
24.2 24.7 24.928.4
36.9
0
10
20
30
40
FY09 FY10 FY11 FY12 FY13
(¥bn)

22
Strengthening collaboration with Morgan Stanley Strengthening collaboration with Morgan Stanley, in addition to superior track record in
investment banking Utilize Morgan Stanley’s global product and solutions capabilities for the benefit of MUFG’s
wide-range customers
POWL (Public Offering Without Listing) HK Electric Investments
Corporate bonds Secondary distribution of Morgan Stanley’s Uridashi bonds
Investment trusts (developed as a product in collaboration with Morgan Stanley) KOKUSAI - MUGC TRUST Short-Term High Yield Corporate Bond Fund 2013-04 Monthly Dividend Type KOKUSAI - MUGC TRUST Short-Term High Yield Corporate Bond Fund 2013-04 JPY-denominated JPY
Appreciation Hedged and Depreciation Followed Type KOKUSAI - MUGC TRUST Short-Term High Yield Corporate Bond Fund 2013-04 Nikkei Stock Average
Appreciation Followed Type Kokusai North America Hard Asset Open
Utilize MS research product for MUMSS employees’ training
For MUMSPB to provideMS’s research product to customers and
employeesWealth management training programAdvisory know how
Recipient of Asiamoney magazine’s Best Investment Bank and Best M&A Advisor awards
Recipient of FinanceAsia magazine’s Best M&A House award
* Awarded as the securities joint venture of MUFG and Morgan Stanley in Japan (comprising MUMSS and MSMS)
Track record in investment bankingTrack record in investment banking Utilize global expertise for retail salesUtilize global expertise for retail sales
Expand Expand range of productsrange of products

23
Blank

24
Appendix
25
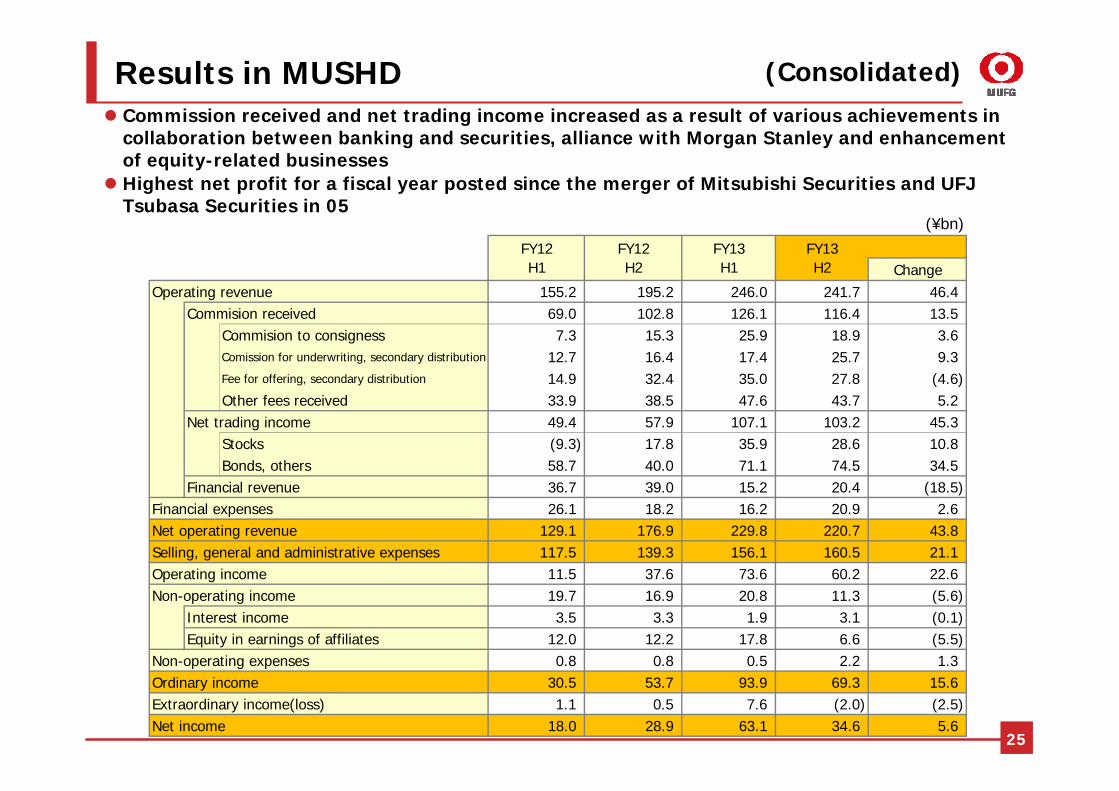
Results in MUSHD Commission received and net trading income increased as a result of various achievements in
collaboration between banking and securities, alliance with Morgan Stanley and enhancement of equity-related businesses
Highest net profit for a fiscal year posted since the merger of Mitsubishi Securities and UFJ Tsubasa Securities in 05
(Consolidated)
(¥bn)
ChangeOperating revenue 155.2 195.2 246.0 241.7 46.4
Commision received 69.0 102.8 126.1 116.4 13.5Commision to consigness 7.3 15.3 25.9 18.9 3.6Comission for underwriting, secondary distribution 12.7 16.4 17.4 25.7 9.3Fee for offering, secondary distribution 14.9 32.4 35.0 27.8 (4.6)Other fees received 33.9 38.5 47.6 43.7 5.2
Net trading income 49.4 57.9 107.1 103.2 45.3Stocks (9.3) 17.8 35.9 28.6 10.8Bonds, others 58.7 40.0 71.1 74.5 34.5
Financial revenue 36.7 39.0 15.2 20.4 (18.5)Financial expenses 26.1 18.2 16.2 20.9 2.6Net operating revenue 129.1 176.9 229.8 220.7 43.8Selling, general and administrative expenses 117.5 139.3 156.1 160.5 21.1Operating income 11.5 37.6 73.6 60.2 22.6Non-operating income 19.7 16.9 20.8 11.3 (5.6)
Interest income 3.5 3.3 1.9 3.1 (0.1)Equity in earnings of affiliates 12.0 12.2 17.8 6.6 (5.5)
Non-operating expenses 0.8 0.8 0.5 2.2 1.3Ordinary income 30.5 53.7 93.9 69.3 15.6Extraordinary income(loss) 1.1 0.5 7.6 (2.0) (2.5)Net income 18.0 28.9 63.1 34.6 5.6
FY12H1
FY13H2
FY12H2
FY13H1