Embed Size (px)
Citation preview

Gene 238 (1999) 211–230www.elsevier.com/locate/gene
Mitochondrial DNA variation in human evolution and disease
Douglas C. Wallace *, Michael D. Brown, Marie T. LottCenter for Molecular Medicine, Emory University School of Medicine, 1462 Clifton Rd., Atlanta, GA 30322, USA
Received 21 June 1999; accepted 6 July 1999
Abstract
Analysis of mitochondrial DNA (mtDNA) variation has permitted the reconstruction of the ancient migrations of women.This has provided evidence that our species arose in Africa about 150 000 years before present (YBP), migrated out of Africa intoAsia about 60 000 to 70 000 YBP and into Europe about 40 000 to 50 000 YBP, and migrated from Asia and possibly Europe tothe Americas about 20 000 to 30 000 YBP. Although much of the mtDNA variation that exists in modern populations may beselectively neutral, studies of the mildly deleterious mtDNA mutations causing Leber’s hereditary optic neuropathy (LHON) havedemonstrated that some continent-specific mtDNA lineages are more prone to manifest the clinical symptoms of LHON thanothers. Hence, all mtDNA lineages are not equal, which may provide insights into the extreme environments that were encounteredby our ancient ancestor, and which may be of great importance in understanding the pathophysiology of mitochondrial disease.© 1999 Elsevier Science B.V. All rights reserved.
Keywords: Leber’s hereditary optic neuropathy; Mitochondrial disease; Mitochondrial DNA; mtDNA mutation
1. Introduction mitochondrial ATP synthase to generate ATP for workor is short circuited (uncoupled) to generate heat forthermal regulation.The mitochondrial DNA (mtDNA) is a small circular
genome located within the mitochondria in the cyto- The mtDNA is strictly maternally inherited. This isbecause the cytoplasmic location of the mitochondriaplasm of the cell. The mitochondrion arose as a symbiont
of the proto-eukaryotic cell about 1.5 to 2 billion years and mtDNA dictates that the mitochondria andmtDNAs are transmitted from one generation to thebefore present (YBP), and subsequently gave up most
of its genes to the cell’s nucleus. Currently, mtDNA next through the oocyte cytoplasm. The sperm appearsto make no genetic contribution to the mtDNA.codes for only 13 polypeptides, all of which are essential
subunits for the mitochondrial energy-generating The mtDNAs also have a very high mutation rate.As a result, the human population currently harbors aenzymes of oxidative phosphorylation (OXPHOS).
Today, each human cell contains hundreds of mito- high level of population-specific mtDNA polymor-phisms. Analysis of the population-specific mtDNAchondria and thousands of mtDNAs. Thus, mito-
chondrial genetics is a population genetics, both at the polymorphism has permitted the reconstruction ofhuman pre-history. Moreover, deleterious mtDNA mut-level of the intracellular colony of symbionts and at
the level of human populations. ations arise frequently, and result in mitochondrialdisease. Hence, analysis of maternally inherited diseasesThe mitochondria provide much of the energetic
needs for our cells. Mitochondrial energy is generated has opened a new field of human genetics, and recentlydemonstrated that some mtDNA diseases show a strongby OXPHOS in which the hydrogen derived from the
carbohydrates and fats in our diets is oxidized by the continental bias. In one case, this is now understood asthe synergistic interaction between a pathogenic mtDNAoxygen we breathe to give water. The released energy is
stored as an electrochemical gradient across the mito- mutation and a specific European mtDNA lineage.Thus various mtDNA lineages are qualitativelychondrial inner membrane (Dy), which is utilized by the
different, and hence can be differentially acted on byselection. Analysis of this mtDNA variation may ulti-mately tell us something about the pathophysiology of* Corresponding author. Tel.: +1-404-727-5624;
fax: +1-404-727-3949. mtDNA disease.
0378-1119/99/$ – see front matter © 1999 Elsevier Science B.V. All rights reserved.PII: S0378-1119 ( 99 ) 00295-4

212 D.C. Wallace et al. / Gene 238 (1999) 211–230
2. Mitochondrial DNA structure and genetics (Michaels et al., 1982; Chen et al., 1995a). The spermmtDNAs are contributed to the zygote at fertilizationand will persist in inter-specific crosses (Gyllensten et al.,The mtDNA is a 16 569 nucleotide pair (np), closed
circular molecule that codes for a small (12S, MTRNR1) 1991), but are selectively eliminated in intra-specificcrosses ( Kaneda et al., 1995). This has recently beenand large (16S, MTRNR2) rRNA as well as 22 tRNAs.
These structural RNAs are used to translate the 13 correlated with the observation that the mitochondriain the sperm mid-piece is ubiquinated (Hopkin, 1999)polypeptides that are subunits of the OXPHOS enzyme
complexes, including: seven of the approximately 43 and hence may be labeled for immediate destructionwithin the oocyte cytoplasm.polypeptides of complex I (MTND1, 2, 3, 4L, 4, 5, and
6), one of the 11 polypeptides of complex III When a mutation arises in a cellular mtDNA, itcreates a mixed intracellular population of mutant and(MTCYTB), three polypeptides of complex IV
(MTCOI, COII, and COIII ), and two polypeptides of normal molecules known as heteroplasmy. When a celldivides, it is a matter of chance as to whether the mutantcomplex V (MTATP6 and 8) (Fig. 1).
The human mtDNA is strictly maternally inherited mtDNAs will be partitioned into one daughter cell oranother. Thus, over time, the percentage of mutant(Giles et al., 1980; Case and Wallace, 1981), due in large
measure to the fact that the mammalian egg contains mtDNAs in different cell lineages can drift toward eitherpure mutant or normal (homoplasmy), a process knownabout 100 000 mitochondria and mtDNAs, whereas the
sperm contains only in the order of 100 mtDNAs as replicative segregation ( Wallace, 1986).
Fig. 1. The human mtDNA map, showing the location of the genes and the ‘primary’ Leber’s hereditary optic neuropathy (LHON ) mutations.The human mtDNA is a 16 569 base pair circular molecule that codes for seven (ND1, 2, 3, 4L, 4, 5, and 6) of the 43 subunits of complex I,shown in pink; one (cytochrome b, cyt b) of the 11 subunits of complex III, shown in orange; three (COI, II, and III ) of the 13 subunits of complexIV, shown in purple; and two (ATPase 6 and 8) of 16 subunits of complex V, shown in yellow. It also codes for the small and large rRNAs, shownin green, and 22 tRNAs, shown in light yellow, with the adjacent letters indicating the cognate amino acids. The heavy (H )-strand origin ofreplication (OH) and the H-strand and light (L)-strand promoters, PH and PL, are indicated in the control region.

213D.C. Wallace et al. / Gene 238 (1999) 211–230
As the percentage of deleterious mutant mtDNAs the recognition sequence, but the polymorphic nucleo-tide may be different. For example, the HpaI np 3592increases, cellular energy output declines. Since different
tissues and organs rely on mitochondrial energy genera- site change is caused by a C-to-T transition at np 3594.In contrast to African mtDNAs, about 13% of Asianstion to different extents, this results in tissue-specific
symptoms for systemic genetic defects. The differential lacked an HpaI restriction site at np 12 406 (G to A atnp 12 406), which was present in all other mtDNAsorgan sensitivities to mitochondrial defects, in decreasing
order, are the central nervous system including the eye, (Denaro et al., 1981). A further survey of the mtDNAvariation detected using six highly informative restric-the heart and skeletal muscle, renal system, endocrine
system and liver ( Wallace, 1987, 1995; Wallace et al., tion enzymes (HpaI, BamHI, HaeII, MspI, and AvaII )and Southern blotting confirmed that mtDNA variation1988a, 1994; Shoffner et al., 1990).
The mtDNA has a very high sequence evolution was high and correlated strongly with the geographicorigin of the individual. It also showed that all mtDNAs(Brown et al., 1979), in the order of 10 to 17 times
faster than nuclear DNA genes of similar function were part of a single phylogenetic tree, that the greatestvariation was in Africa, and that the tree was about(Neckelmann et al., 1987; Wallace et al., 1987). This
has resulted in the accumulation of a broad spectrum 100 000 years old (Johnson et al., 1983). Extensivestudies by our group, as well as by others, ultimatelyof mtDNA sequence polymorphisms in human popula-
tions, but also may be a common source of mutations led to the characterization of 3065 mtDNAs from 62geographic samples using these six enzymes. Thiscausing mitochondrial disease.revealed 149 haplotypes and 81 polymorphic sites. Thisanalysis confirmed: (1) that the mtDNA polymorphismswithin each mtDNA were virtually in total linkage3. MtDNA variation in human populationsdisequilibrium, consistent with a low frequency ofrecombination; that mtDNA variation correlated highlyThe mtDNA sequence evolution rate is in the same
time frame as the origin and radiation of human conti- with the ethnic and geographic origin of the individual;(2) that there was a single mtDNA tree; (3) that thenental populations. As a result, mtDNA polymorphisms
have accumulated sequentially as women migrated west greatest variation and deepest root of the tree was inAfrica, consistent with an African origin of humans.of Africa and into the various continents. Generally, for
mtDNA variants to reach polymorphic frequencies, they The extent of mtDNA sequence differences betweencontinental populations was estimated from this dataneed to be selectively neutral or near neutral to avoid
being eliminated by selection and thus become prevalent by calculating the GST statistic. For the mtDNA, theGST was 0.35±0.025, implying that about 35% of thethrough genetic drift. In fact, the rapid shift in mtDNA
lineages that is observed between continent may have mtDNA variation was continent-specific. By contrast,the comparable nDNA value was 0.12. Hence, thebeen influenced by selection as well as by drift.mtDNA encompasses much greater continent-specificsequence diversity than the nDNA (Merriwether et al.,3.1. World mtDNA phylogeny and the origin of women1991).
A recent African origin of human mtDNAs was alsoBecause the mtDNA is strictly maternally inherited,the mtDNA sequence has evolved by the sequential demonstrated by the investigations of Cann et al. (1987).
These investigators purified the individual mtDNAsaccumulation of base substitutions along radiatingmaternal lineages. Thus, as women migrated out of from cells or tissues, digested the DNA with 12 restric-
tion endonucleases (Hpal, AvaII, FnuDII, HhaI, HpaII,Africa into the different continents about 150 000 YBPthey accumulated mtDNA mutations that today are Mbol, TaqI, Rsal, HinfI, HaeIII, AluI, and DdeI ), end-
labeled the fragments, and resolved the fragments usingseen as high frequency, continent-specific mtDNAsequence polymorphisms. These polymorphisms are polyacrylamide gels and autoradiography (Brown,
1980). A survey of 147 mtDNAs, including 34 Asians,associated with specific mtDNA haplotypes, and groupsof related haplotypes (haplogroups) (Torroni and 21 Australian aboriginals, 26 aboriginal New Guineans,
46 Caucasians, and 20 Africans (18 of whom were BlackWallace, 1994; Wallace, 1995).The first clear evidence that mtDNA variation corre- Americans), also revealed that there was a single
mtDNA tree, that the deepest root occurred in Africa,lated with the ethnic and geographic origin of theindividual came from our survey of HpaI RFLPs in and that Africa harbored the greatest sequence diversity.
Hence, Africa is the origin of Homo sapiens. Using anAfrican, Asian, and European–American mtDNAs. Thisrevealed that, in Africans, 96% of Pygmies, 93% of San estimated sequence evolution rate of 2–4% per million
years (MYR), the human mtDNA tree was calculatedBushman, and 71% of Bantus harbored an HpaI restric-tion site at np 3592 not seen in Asians or Europeans. to be about 200 000 years old (Cann et al., 1987).
This analysis was extended to include 62 JapaneseBy convention, all polymorphic restriction sites, includ-ing the HpaI np 3592 site, are defined by the 5∞ end of (Horai and Matsunaga, 1986) and 119 Papua New

214 D.C. Wallace et al. / Gene 238 (1999) 211–230
Guineans (Stoneking et al., 1990). The Papua New and became established by genetic drift, resulting incontinent-specific mtDNA variation. Today, these pop-Guineans were sampled from 25 localities, and signifi-
cant differences in mtDNA variation were found ulation-specific polymorphisms constitute the back-ground on which potentially pathogenic mtDNAbetween the highland and coastal populations.
Combining the Papua New Guinea data with the previ- mutations must be identified.ous European, Asian, and African data permitted calcu-lation of a global GST of 0.31 (Stoneking et al., 1990), 3.2. Cataloging continent-specific mtDNA variationa value similar to that found for the six-enzyme analysisdiscussed above. Although the above methods permitted elucidation
of the general features of human mtDNA evolution, aThe African origin of mtDNA variation was alsosupported through sequence analyses of the 1121 np more detailed analysis of mtDNA variation has been
necessary for clinical studies and for addressing addi-non-coding control region of the mtDNA. This regionhas a three- to four-fold greater sequence diversity than tional anthropological questions on the age and origin
of Africans, Europeans, Asians, and Native Americans.the coding region. Analysis of the control-regionsequences from 189 individuals, 121 of whom were To increase the sensitivity of our analyses, we developed
a new mtDNA analysis procedure — high resolutionnative African, once again confirmed that the greatestsequence diversity was in Africans, that the deepest root RFLP analysis — in which the mtDNAs from a variety
of human samples could be amplified by using PCR inwas between Africans, and that the coalescence time ofthe mtDNA tree (phylogeny) was between 166 000 and nine overlapping fragments. Each fragment was then
digested with 14 restriction endonucleases (AluI, AvaII,249 000 YBP (Vigilant et al., 1991). The African rootof this phylogeny was subsequently challenged on the BamHI, Ddel, HaeII, HhaI, HinfI, HincII, HpaI, Hpal,
MspI, Mbol, RsaI, and TaqI ), and the fragmentsbasis that multiple equally probable parsimony treescould be generated from the data (Templeton, 1992). resolved on agarose gels and detected by ethidium
bromide staining and UV fluorescence. This procedureHowever, other phylogenetic analysis procedures, suchas neighbor-joining trees, have reaffirmed the cohesive- surveys >20% of the mtDNA sequence, and the aggre-
gate of the restriction-site polymorphisms for eachness of the deepest African associations and thus supportthe African origin of the mtDNA phylogeny (Hedges mtDNA is used to define the mtDNA haplotype
(Ballinger et al., 1992; Torroni et al., 1992). The regionalet al., 1991).Analysis of the control-region sequence of 95 individ- PCR fragments can also be sequenced, permitting exten-
sion of the analysis to areas of interest such as theuals, including 61 Japanese, confirmed that the greatestdiversity and deepest root occurred in Africa and hypervariable control region (Torroni et al., 1993a,b).
The sequence differences between mtDNAs can then berevealed that ‘Mongoloid’ mtDNAs were subdividedinto two distinct groups (Horai and Hayasaka, 1990). compared by using various phylogenetic procedures
including parsimony, neighbor-joining, and unweightedAnalysis of 117 Caucasian mtDNAs confirmed thedistinctive nature of many European mtDNAs and pair-group analyses. These phylogenetic trees reveal the
relatedness of the mtDNAs, with the more similarrevealed that the various mtDNA lineages were widelydisseminated throughout Europe (Di Rienzo and mtDNAs clustering together. The extent of sequence
diversity within or between groups of related haplotypesWilson, 1991).Finally, comparison of the original European (haplogroup) can also be calculated (Tateno et al., 1982;
Nei and Tajima, 1983; Saitou and Nei, 1987; Swofford,mtDNA sequence (Anderson et al., 1981) with thatfrom an African, a Japanese, and four African apes 1993).(common and pygmy chimpanzees, gorilla, and orang-utan) revealed that the European and Japanese mtDNAs 3.3. African mtDNA variationwere most similar, that the African mtDNA was moredivergent, and that the nearest ape relatives, the chim- To characterize better African mtDNA variation, we
have surveyed, using high-resolution RFLP analysis, thepanzees, were 10 times more divergent from humansthan Africans are from Asians and Europeans. Using mtDNAs from 214 Africans: 101 from Senegal (60
Mandenkalu, 20 Wolof, 8 Pular, 13 others from eightthe orangutan–African ape divergence time of 13 millionYBP as reference, this study gave an age for human tribes); 22 Mbuti (Eastern) Pygmies from Zaire and 17
Biaka ( Western) Pygmies from Central AfricanmtDNA radiation of 143 000±18 000 YBP and a timefor European and Japanese radiation of 70 000±13 000 Republic; 74 South Africans, including 43 Kung and 31
Khwe (Chen et al., 1995b, 1999). This survey revealedYBP (Horai et al., 1995).All of these studies lead to the same conclusion. The 105 haplotypes defined by greater than 157 polymorphic
sites. Phylogenetic analysis revealed that 75 of thehuman mtDNA tree appears to have originated in Africaabout 150 000 YBP. As women migrated from Africa to haplotypes formed a single, coherent, African-specific
haplogroup designated ‘L’ (Fig. 2), which is defined bycolonize new lands, additional mtDNA mutations arose
215D.C. Wallace et al. / Gene 238 (1999) 211–230
Fig. 2. Phylogeny of African mtDNA haplotypes. This tree summarizes the results from 214 Africans, including 101 Senegalese, 22 Mbuti Pygmies,17 Biaka Pygmies, 43 Kung and 31 Khwe, encompassing 105 haplotypes. Each haplotype is positioned relative to the others based on number ofgenetic similarities or differences. The closer together two haplotypes are in the tree, the more similar is their sequence. MtDNA polymorphismsthat arose recently are present in only one or a few mtDNAs and define the terminal twigs of the tree. By contrast, polymorphisms that arose earlyin human mtDNA evolution are shared by larger groups of related mtDNAs and define major branches of the tree. These groups of related mtDNAhaplotypes are called haplogroups. To identify the oldest mtDNA haplogroups, the human mtDNA haplotypes are compared with that of a moredistantly related mtDNA, the outgroup, in this case chimpanzee mtDNA. This permits the ‘rooting’ of the tree. For African mtDNAs, one of theoldest and most significant polymorphisms is the HpaI site at np 3592. This site is African-specific with the oldest 2/3 of the tree having the HpaI3592 site (+3592 HpaI ) and being defined as macro-haplogroup L, with haplogroup subdivisions L1 and L2. The absence of this site is defined ashaplogroup L3. Haplogroup L3 forms the bridge between African mtDNAs and European and Asian mtDNAs. Within the L1, L2, and L3 divisionsare multiple haplogroups and sub-haplogroups, some of which correlate highly with the population sampled. Thus a core block of related haplotypesin L1a, designated a, are specific for the Kung; a second block in L1b2, labeled b, are specific for the Biaka Pygmies; a third block in L2a, designatedc, are specific for Mbuti Pygmies; a fourth block in L2c, labeled d, are specific for the Senegalese. This implies that these core haplotypes arosewith these populations. The fact that the a block of the Kung and the b block the Biaka Pygmies are closest to the root of the tree implies thatthese are among the oldest African populations. Although the deep branches of this tree are very robust, the most distal twigs are subject to greaterinterpretive fluctuation. Hence, this tree is one of the thousands that could be drawn in which the major branches are retained but the precisebranching order of the individual haplotypes can vary. This is standard. This tree is reproduced from Chen et al. (1999) with permission.

216 D.C. Wallace et al. / Gene 238 (1999) 211–230
the African-specific Hpal site at np 3592 together with haplogroup L2 and are delineated by a DdeI site loss atnp 13 065, and an RsaI site gain at np 11 776. Finally,the DdeI site at np 10 394 (A to G at np 10 398). This
lineage is subdivided into two sublineages, L1 and L2. the Bantu-derived Senegalese core haplotypes alsobelong to haplogroup L2 and are defined by an HaeIIIL1 encompasses 52% of the L haplotypes and 29% of
all African mtDNAs and is defined by an additional site loss at np 322, a DdeI site loss at np 679, and anHaeIII site loss at np 13 957. Calculation of the sequenceHinfI site at np 10 806 (T to C at np 10 810). L2
encompasses 48% of the L haplotypes and 34% of the divergence of the core haplotypes for each populationreveals that the Vasekela Kung a lineage and BiakaAfrican mtDNAs and is defined by an additional com-
bined HinfI site gain at np 16 389 and AvaII site loss at Pygmy b lineages are the oldest, whereas the MbutiPygmy and Senegalese lineages are much younger.np 16 390 (G to A at np 16 390). All HpaI np 3592
positive haplotypes are of African origin, with the only Hence, the Kung and Biaka Pygmies are more represen-tative of the proto-Africans and the Biaka and Mbutiexceptions occurring in populations known from histori-
cal evidence to have had Africa contact. Pygmies may have had independent origins.Calculation of the accumulated sequence diversity ofSeveral other features of haplogroup L are of interest.
Two length mutations have been observed in L1: a nine the African-specific haplogroup L and its subhaplo-groups L1 and L2 gave values of 0.356%, 0.328%, andnp COII/tRNALys deletion between nps 8272 and 8289
(Cann and Wilson, 1983; Wrischnik et al., 1987) found 0.171% respectively. The total African mtDNA sequencediversity was 0.364%. This means that haplogroup Lin two African haplotypes, AFR 60 (representing 27%
of Mbuti Pygmies) and AFR 61 (representing 24% of has the highest sequence diversity of any continent-specific haplogroup and that Africa encompasses theBiaka Pygmies); and a 10–12 bp insertion of cytosines
(Cs) between the tRNATyr and COI gene (nps 5895– greatest diversity of any continent. Using our estimateof the mtDNA sequence evolution rate of 2.2–5899) in Biaka Pygmies with the ARF66 haplotype
(Fig. 2). 2.9%/MYR (Torroni et al., 1994a), the L haplogroup isbetween 123 000 and 162 000 years old, and the totalThe remaining African mtDNAs form a hetero-
geneous array of four lineages, designated haplogroup African mtDNA lineage is between 126 000 and166 000 years old (Fig. 2).L3, each defined by specific restriction-site gains or
losses ( Watson et al., 1996). One of these lineages is Calculation of the intragroup and intergroupsequence variations of the various African groupsdefined by loss of the DdeI site at np 10 394. This lineage
represents only a few percent of the African mtDNAs, strengthen these observations. The Biaka Pygmies andthe Vakekela Kung had the greatest intragroup sequenceyet it appears to be the progenitor of roughly half of all
European, Asian, and Native American mtDNAs. variation: 0.342% and 0.320% respectively, comparableto that of Africa as a whole. This further supports theWithin this lineage are mtDNAs that also lack an HinfI
site at np 12 308. This mtDNA haplotype is closely conclusion that these are among the oldest populations.The Mbuti Pygmies and Senegalese have intragrouprelated to the European-specific haplogroup H.
Analysis of African mtDNA control region sequences sequence diversities in the range of 0.241 to 0.277,confirming that these populations are younger. A neigh-reveals many of the same population subdivisions.
However, in some cases the control region sequences bor-joining tree analysis clearly separates the BiakaPygmies from the Mbuti Pygmies, and places the Mbutisubdivide haplotypes, and in others the haplotype mark-
ers subdivide control region sequence groups (Chen Pygmies on the same side of the tree as the Bantu-derived populations. Hence, the Mbuti and Biaka pyg-et al., 1999).
Analyses of the population distribution of the African mies probably are distinct populations (Chen et al.,1999).haplotypes revealed that each of the four primary pop-
ulations studied (the Senegalese of West Africa, the Overall, the mtDNA data show that African mtDNAsare distinct, they are the oldest with the greatest diversityMbuti Pygmies, the Biaka Pygmies and the Vasikela
Kung) has a distinctive set of related core haplotypes and deepest root, that the Vasikela Kung and BiakaPygmies are among the original populations of Africa,that are specific for that population (Fig. 2). The core
haplotypes of the Vasikela Kung of South Africa, desig- and that the ‘Pygmy’ morphology arose two independenttimes in Africa.nated a, occur in haplogroup L1 and are defined by
MspI site losses at np 8112 and 8150, and AvaII sitegain at np 8249, and an HaeIII site loss at np 8250. 3.4. European mtDNA variationThis cluster of Vasikela Kung haplotypes is at thedeepest root of the African phylogeny, suggesting that European mtDNA sequence variation has been
defined by the analysis of 259 samples from individualsthe Kung are one of the oldest populations. The BiakaPygmy core haplotypes, designated b, also reside in of European ancestry living in the United States,
Canada, Finland, Italy, and Sweden (Torroni et al.,haplogroup L1 and are defined by an AluI site gain atnp 10 319. The Mbuti Pygmies, designated c, reside in 1994b, 1996a). Restriction analysis revealed 178 poly-

217D.C. Wallace et al. / Gene 238 (1999) 211–230
morphic sites that define in the order of 170 haplotypes at np 15 606 and accounts for 15.2% of EuropeanmtDNAs. Haplogroup U is defined by the presence of(Torroni et al., 1994b, 1996a). Phylogenetic analysis
showed that all European mtDNAs could be subdivided an HinfI site at np 12 308 and accounts for 14.7% ofEuropean mtDNAs. Haplogroup V is delineated by theinto two groups by the presence (1/4) or absence (3/4)
of the Ddel site at np 10 394 (Fig. 3). Thus, Europeans loss of an NlaIII site at np 4577 and is found in 4.8%of Europeans, whereas haplogroup X is, in part, definedexhibit a marked increase in the proportion of −10 394
DdeI mtDNAs over the 4% seen in Africans. by the loss of a DdeI site at np 1715 and is found inabout 6.9% of European mtDNAs. Of the haplotypesIn addition to the macro-subdivision of European
mtDNAs by the Ddel site at np 10 394, nine distinct that retain the DdeI site, haplogroup I is defined by theloss of the DdeI np 1715 site, and the gain of an AvaIIEuropean mtDNA haplogroups have also been
observed. Those lacking the DdeI site at np 10 394 are site at 8249 and an AluI site at np 10 028 and represents6.7% of European mtDNAs; haplogroup J is identifiedhaplogroups H, T, U, V, W, and X; those retaining the
DdeI np 10 394 site are I, J, and K (Fig. 3). by the loss of a BstNI site at np 13 708 and is found inabout 11.3% of European mtDNAs; and haplogroup KOf the haplogroups that lack the DdeI np 10 394 site,
haplogroup H also lacks an AluI site at np 7025 (C to is delineated by the loss of an HaeII site at np 9052 andthe gain of an HinfI site at np 12 308 and is found inT at np 7028). This haplogroup encompasses 40.5% of
European mtDNAs. Haplogroup T is defined by the 9.1% of Europeans (Fig. 3). The sequence diversity ofhaplogroup H is 0.065%, giving an age of this lineagepresence of a BamHI site at np 13 366 and an AluI siteof 22 000 to 30 000 YBP. However, the sequence diver-gence of haplogroup U, which is shared betweenEuropeans and African Bantu, is 0.148%, giving an ageof 51 000 to 67 000 YBP. Hence, haplogroup U mayrepresent one of the founder lineages of Europe (Torroniet al., 1996a). The overall sequence divergence betweenthe two major branches of the European phylogeny is0.113%, giving an age for the colonization of Europe ofbetween 39 000 and 51 000 YBP (Torroni et al., 1994b).
Analysis of the control regions of the EuropeanmtDNAs revealed additional continent-specific markers(Di Rienzo and Wilson, 1991). However, one control-region mutation in haplogroup I proved to be totallynovel, with potential implications for the evolution ofthe human mtDNAs. All haplogroup I mtDNAs werefound to have a homoplasmic insertion of two to six Cswithin a cluster of Cs in the sequence ACCCCCC (Box2), where the A is located at np 567. This germ-linemutation increases the homology between this sequenceand the nearby control-region sequence ACGCCCCC-TCCCCCGCT (Box 1), where the A is located at np302. Because of this homology, every individual whoinherits the Box 2 germ-line insertion mutation becomesprone to undergo a somatic mutation during develop-ment. In this somatic mutation, the region betweenBoxes 1 and 2 is duplicated as a 270 np direct repeat,possibly through slipped misreplication (Torroni et al.,1994b). The somatic 270 bp duplication duplicates the
Fig. 3. Phylogeny of European mtDNA haplotypes. This representa- H-strand promoter (nps 545–567), the L-strand pro-tive tree encompasses the analysis of 86 samples from individuals of moter (nps 392–445), the two intervening mitochondrialEuropean ancestry. The tree is bifurcated by the presence or absence
transcription factor binding sites (nps 418–445 and npsof an ancient polymorphism, the DdeI site at np 10 394. European523–550), CSBIII (nps 346–363), part of CSBII (npsmtDNAs lacking the 10 394 site fall into six distinct haplogroups: H,
T, U, V, W, and X; those retaining the site fall into three major 299–315), and the putative replication primer processinghaplogroups: I, J, and K. Each haplogroup is defined by distinctive site (nps 317–321) (Brockington et al., 1993; Torronipolymorphisms (see text). These nine European-specific haplogroups et al., 1994b). This raises the possibility that the dupli-account for over 98% of all mtDNAs found in Europe (Torroni et al.,
cated molecules are transcribed twice as frequently and1994a,b). As for all parsimony trees, there are many alternativemay be preferentially replicated, providing selectiveEuropean mtDNA phylogenies, but the central branches are quite
robust. advantage for this mutation. This may explain why the

218 D.C. Wallace et al. / Gene 238 (1999) 211–230
unstable Box 2 insertion has been maintained through- T ); and, for haplogroup D, variants at nps 16 362 (Tto C) and 16 223 (C to T) (Torroni et al., 1993a).out the 34 000 year history of haplogroup I (Torroni
et al., 1994b). Three other prominent Asia haplogroups are E, F,and G. Haplogroups E and G have the combined DdeIand AluI sites at nps 10 394 and 10 397, whereas haplo-3.5. Asian mtDNA variationgroup F lacks these sites. Haplogroup E is furtherdefined by an HpaI site loss at np 7598, haplogroup GTo define further the Asian mtDNA sequence varia-
tion, we have analyzed the mtDNAs from 153 Central by the presence of an HaeIII site at np 4830 and anHpaI site at np 4831; haplogroup F is delineated by theand Southeast Asians, including aboriginal Malays and
Orang Ash, aboriginal Borneans, Han Chinese, combined HpaI/HincII site loss at np 12 406, the firstAsian-specific polymorphism observed (Denaro et al.,Vietnamese, Koreans, and Malaysian Indians (Ballinger
et al., 1992) as well as 54 Tibetans (Torroni et al., 1981; Blanc et al., 1983). All of these haplogroupsshow marked frequency variation throughout Asia.1994c) and 758 Siberians from 11 aboriginal popula-
tions, including the Chukchi and Koryaks from Haplogroup F is prominent in southern Asian popula-tions, being found in 32% of Vietnamese mtDNAs andnortheastern-most Siberia (Torroni et al., 1993b;
Starikovskaya et al., 1998; Schurr et al., 1999). A 21% of Malay mtDNAs. It is present in about 15% ofKoreans and Tibetans, but is virtually absent in Siberia.representative Asian phylogenetic tree encompassing 42
Tibetan haplotypes, 106 Asian haplotypes, and 34 By contrast, haplogroups A, C, D, E, and G are absentin southern Asian populations, including Vietnamese,Siberian haplotypes is presented in Fig. 4. This phylog-
eny shows that all Asian mtDNAs can be subdivided Malays, Sabah, Malay aboriginals, and New Guineans,but these groups are found at significant frequencies ininto two macro-haplogroups defined by the presence or
absence of the polymorphic site at DdeI at np 10 394, Tibetans, Koreans, and Han Chinese. This north–southdistinction supports the dichotomization of Asians intowhich also bifurcates the European mtDNA lineages.
Moreover, every Asian mtDNA that harbors the Ddel the Sinodont (northern) and Sunodont (southern) Asianpopulations (Turner, 1983, 1987). Furthermore, haplo-site at np 10 394 also has an adjacent AluI site at np
10 397 (C to T at np 10 400). The macro-haplogroup groups A, C, and D extend into the Siberia populationsanalyzed, reaching maximum frequencies of 68%, 84%defined by the presence of the DdeI np 10 394 and the
AluI np 10 397 sites has been designated macro-haplo- and 28% respectively. Haplogroup A reaches its highestfrequencies in the Chukchi and Koryaks, the northeast-group M [or also as (+/+)]. The constant association
of the DdeI np 10 394 and AluI np 10 394 in Asians, but ern-most populations of Siberia and likely progenitorsof Native Americans. The haplogroup frequencies ofnot in Africans or Europeans, implies that the AluI np
10 397 mutation must have arisen on an mtDNA carry- the Koryaks are 5% A, 36% C, 1% D, and 42% G, 10%Y, and 6% other, whereas those of the Chukchi are 68%ing the DdeI np 10 394 mutation as women migrated
out of Africa and into Asia (Fig. 4). A, 11% C, 12% D, and 9% G (Torroni et al., 1993b;Starikovskaya et al., 1998; Schurr et al., 1999).In addition to this major bifurcation of Asian
mtDNAs, there are a number of distinctive sublineages Haplogroup B, defined by the 9 np COII-tRNALysdeletion, displays a markedly different distribution. It isof relevance to Asian and Native American prehistory.
Haplogroups A, B, C, and D have proved to be the common throughout central and southern Asia and isprominent in coastal Asian populations, approachingprogenitors of virtually all Native American mtDNAs.
Haplogroups A and B lack both the DdeI site at np fixation (100%) in certain Pacific island populations(Hertzberg et al., 1989; Stoneking et al., 1990; Ballinger10 394 and the AluI site at np 10 397, whereas haplo-
groups C and D have these sites. In addition, haplogroup et al., 1992). It is virtually absent from all nine Siberianpopulations analyzed, yet it reappears throughoutA is defined by an HaeIII site at np 663 (A to G at np
663), haplogroup B by an independent occurrence of North, Central, and South American Native Americanpopulations (Schurr et al., 1990; Torroni et al., 1993a,b).the 9 np deletion between the COII and tRNALys genes,
haplogroup C by the simultaneous HincII site loss at The high frequency of this haplogroup among coastalAsian and Pacific island populations, and its strikingnp 13 259 and an AluI site gain at np 13 262 (A to G at
np 13 262), and haplogroup D by the loss of an AluI absence in Siberians relative to Central Asians andNative Americans, raises the possibility that haplogroupsite at np 5176 (C to A at np 5178). These haplogroups
are further delineated in most Asians and Native B mtDNAs did not come to the Americas via a trans-Siberian migration, but rather may have crossed fromAmericans by specific control-region variants. For
haplogroup A, these include variants at nps 16 362 (T Asia to the Americas by migration along the Siberiancoast. This deduction has been questioned, however,to C ), 16 319 (G to A), 16 290 (C to T), and 16 223 (C
to T ); for haplogroup B, variants at nps 16 217 (T to based on mathematical analysis of control-regionsequence diversity (Forster et al., 1996).C) and 16 189 (T to C ); for haplogroup C, variants at
nps 16 327 (C to T ), 16 298 (T to C ), and 16 223 (C to The co-occurrence of the AluI site at np 10 397 and

219D.C. Wallace et al. / Gene 238 (1999) 211–230
Fig. 4. Phylogeny of Asian mtDNA Haplotypes. This representative tree is based on data from 153 Central and Southeast Asians, 54 Tibetans,and 758 aboriginal Siberians. The Asian mtDNA phylogeny is bifurcated into two macro-haplogroups. One macro-haplogroup lacks the DdeI siteat np 10 394, as well lacking an AluI site at np 10 397, and thus is designated (−/−), whereas the other macro-haplogroup has these restrictionsites and is thus designated (+/+). The later group is called macro-haplogroup ‘M’. Within these two major Asian mtDNA lineages are multipleimportant haplogroups. Haplogroup F is (−/−) and is found at high frequency in Southeast Asia, but declines toward Northeast Asia. HaplogroupsA and B are −/−, whereas haplogroups C and D are (+/+). These four mtDNA lineages are at a low frequency in Southern Asia, but rise tohigh frequencies in Northeast Asia, where they participated in the peopling of the Americas. This tree is reprinted from Torroni et al. (1994c) withpermission.
the DdeI site at np 10 394 in macro-haplogroup M Ethiopians. Either the haplogroup M mtDNA enteredEast Africa through relatively recent migrations frommtDNAs throughout Asia indicates that the AluI site
gain occurred at the beginning of Asian habitation. This Asia, or they originated in East Africa. If the latter istrue, this would place the origin of M at close to thehypothesis has been supported by the discovery of
macro-haplogroup M mtDNAs in East African time of the migration of proto-Asians out of Africa and

220 D.C. Wallace et al. / Gene 238 (1999) 211–230
into Asia (Passarino et al., 1996, 1998). Consequently, 10 394 and AluI np 10 397 site gains found in their Asianprogenitors (Schurr et al., 1990; Torroni et al., 1992,the sequence diversity that has accumulated in the DdeI
np 10 394+AluI np 10 397 lineage should be indicative 1994d) (Fig. 5). Each of the four primary NativeAmerican haplogroups traces back to a single nodalof the age of the Asian population. The overall sequence
diversity in this lineage is 0.161%. This gives an age for mtDNA haplotype that is shared by Asia and theAmericas and that initiated the mtDNA radiation in thethe Asian population of 56 000–73 000 YBP.Americas. However, none of the derived haplotypes isshared by Asians and Americans, as demonstrated by3.6. Native American mtDNA variationanalyzing haplogroup C and D mtDNAs from Siberiansand Native Americans (Torroni et al., 1993b). Hence,To learn more about the origin of Native Americans,
we analyzed 743 Native American mtDNAs. Multiple it appears that, primarily, these four mtDNA haplotypescrossed from Siberia into the Americas. All four of thesehypotheses have been put forward to explain the origin
and radiation of Native Americans. One hypotheses is haplogroups are distributed throughout the Paleo-Indians of North, Central, and South America, thoughbased on the classification of Native American languages
by Greenberg et al. (1986). These authors divided all individual tribes may have lost one or more of thehaplogroups through genetic drift. The broad distribu-Native American languages into three major groups:
Amerind, which encompasses the great diversity of tion of all four mtDNA haplogroups suggests that theyeither came together or were subsequently thoroughlylanguages spoken by the Paleo-Indian peoples occupying
most of North America and all of Central and South mixed.The calculation of the mtDNA sequence diversityAmerica; Na-Dene, which is spoken by the Athapaskans
of the northwestern United States, Canada, and Alaska, that has accumulated within each haplogroup revealedthat haplogroups A, C, and D had relatively similaras well as by the Navajo and Apache, who migrated
south through the great plains around 1000 AD; the values: A=0.075%, C=0.096%, and D=0.053%, witha mean value of 0.075%. By contrast, haplogroup B hadEskaleut languages, which are spoken by the Eskimos
and Aleuts of the Arctic region. Greenberg et al. (1986) a much lower value, 0.034%, suggesting that haplogroupB arrived in the Americas much more recently than A,hypothesized that each of these language groups corres-
ponded to a different migration, arising in a different C, and D (Schurr et al., 1999). This difference isconsistent with the absence of haplogroup B in Siberia,geographic homeland. Using glottochronology-dating
based on the divergence rate of languages, they estimated even though haplogroups A, C, and D are prevalent.These two results imply that the Paleo-Indians of thethat these migrations occurred at about 11 000 YBP,
9000 YBP, and 5000 YBP respectively. Amerind linguistic group may have been derived fromtwo migrations. The first migration moved up fromIn our first studies on Native American mtDNA
variation, we focused on the Pima and the Papago, central Asia through Siberia, during which it becameprogressively enriched for the founder haplotypes ofPaleo-Indians of the southwestern United States. Using
Southern blot analysis and our initial six informative haplogroups A, C, and D. Ultimately, only these haplo-types crossed the Bering land bridge to found the Paleo-restriction endonucleases, we discovered that about 40%
of these Native American mtDNAs lacked the HincII Indians. The second migration came much later, bearingthe founder haplotype of haplogroup B. This migrationsite at np 13 259 ( Wallace et al., 1985), whereas only
1.8% of central Asian mtDNAs lacked this site (Blanc bypassed Siberia, possibly moving along the Siberianand Alaskan coasts, and entered the Americas, where itet al., 1983). This led to the hypothesis that Native
American mtDNAs were derived from a limited number interspersed with the already present haplogroups A, C,and D (Schurr et al., 1990; Torroni et al., 1992, 1993a)of founding mtDNA haplotypes that crossed the Bering
land bridge in distinct migrations ( Wallace et al., 1985; (Fig. 5). An independent analysis of the number ofNative American migration based on mtDNA controlSchurr et al., 1990; Wallace and Torroni, 1992). This
hypothesis has subsequently been confirmed by our region sequence data concluded that all Paleo-Indians(Amerinds) were derived from a single migration. Thatmore extensive analysis encompassing 563 Paleo-Indians
from 24 tribes, 130 Na-Dene representing five tribes, is, B came with A, C, and D (Forster et al., 1996).To investigate further the Paleo-Indian tribalizationand 50 Eskimos (Torroni et al., 1992, 1993a, 1994a,d).
Our analysis of mtDNA variation in Paleo-Indians process, we examined the mtDNAs from an isolatedgroups of Aztec descendants in central Mexico: therevealed a dramatic result. Virtually all of the mtDNAs
fell into one of the four Asian haplogroups: A (HaeIII Mixtec of Alta and Baja, the Zapotecs, and the adjacentMixe. These tribes were compared with the Pima ofsite at np 663), B (9 np deletion between
COII/tRNALys), C (HincII site loss at np 13 259 and Arizona, the Maya of Yucatan, the Chibchan-speakersof Panama, the Bella Coola and the Nuu-Chah-NulthAluI site gain at np 13 262), and D (AluI site loss at np
5176), with haplogroups C and D also belonging to of North America, and the Yanomama and Wapishana ofSouth America. In aggregate, the Aztec-derived Mixtecmacro-haplogroup M and thus harboring the Ddel np
221D.C. Wallace et al. / Gene 238 (1999) 211–230
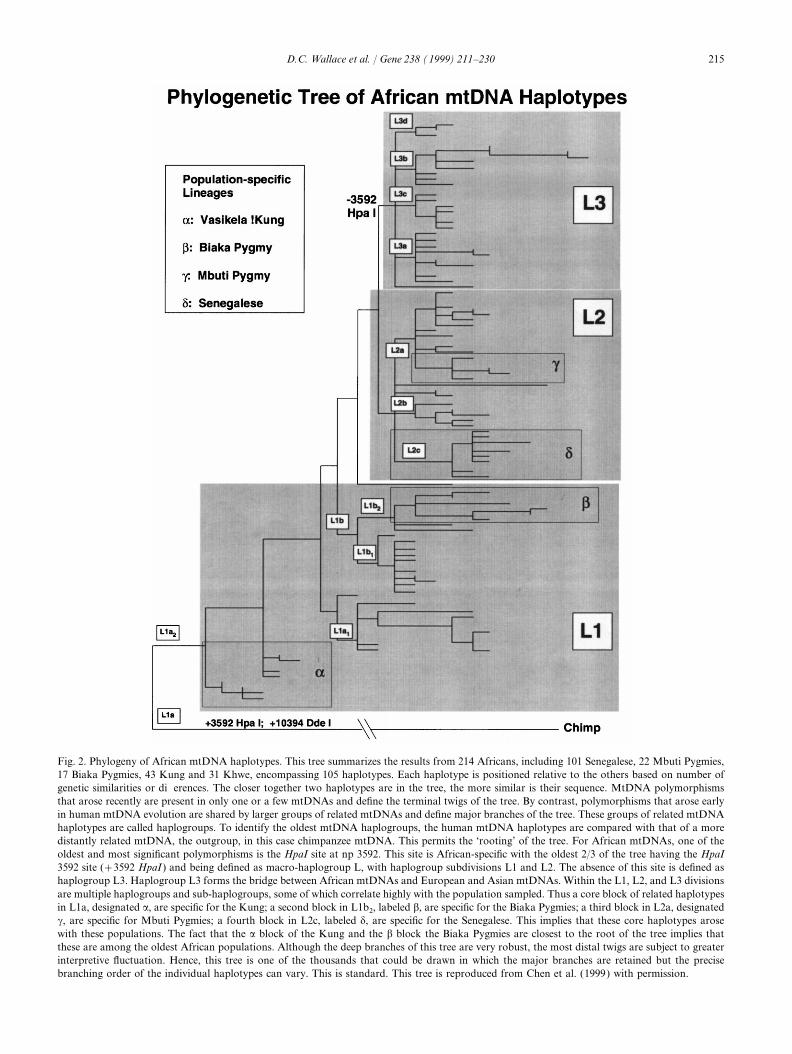
Fig. 5. Phylogeny of Native American mtDNAs. This representative tree was derived from the haplotype data obtained from approximately 563Paleo-Indians, 130 Na-Dene, and 50 Eskimos, and reveals a dramatic point: all Native American mtDNAs were derived from only five foundermtDNAs. These founders originated from haplogroups A, B, C, and D, found in Asia, and from haplogroup X, found only in Europe. TheAmerind-speaking Paleo-Indians of North, Central, and South America encompass haplogroups A, B, C, and D. The Paleo-Indians of NorthCentral, North America also encompass haplogroup X. The Na-Dene of the Pacific Northwest and Southwest (Apache and Navajo) are primarilyA with 1/3 having the Na-Dene-specific marker, an RsaI site loss at np 16 329. The Eskimos of the sub-Arctic are primarily haplogroups A andD. This phylogeny is derived from data reported by Wallace and coworkers (Wallace et al., 1985; Schurr et al., 1990, 1999; Torroni et al., 1992,1993a, 1994a,d; Torroni and Wallace, 1995; Brown et al., 1998; Starikovskaya et al., 1998).
and Zapotecs harbored three haplogroups: 66% A, 18% The prevalence of haplogroup A, B, C, and DmtDNAs in Native American populations has now beenB, and 16% C. The linguistically related Pima of Arizona
harbored the same haplogroups, as did the Mixe, sug- confirmed by multiple investigators ( Ward et al., 1991,1993; Horai et al., 1993; Santos and Barrantes, 1994).gesting a common ancestry. The Maya were more similar
to the North American Paleo-Indians, whereas the These same four haplogroups have also been found inthe Native American skeletons excavated from a pre-Chibchans and South American tribes differed from the
more northern tribes and from each other. These results Columbian burial site in Central North America (Stoneand Stoneking, 1993). Although some Native Americansuggest that the Maya and Aztecs may have been derived
from different populations (Torroni et al., 1994d). mtDNAs have been found not to exhibit one of the four

222 D.C. Wallace et al. / Gene 238 (1999) 211–230
primary mtDNA restriction site markers (Torroni et al., Analysis of northern Na-Dene, including Dogrib,Tlingit, and Haida, indicates that these people harbor1992, 1993a; Bailliet et al., 1994), most of these mtDNAs
can be shown to result from either recent genetic admix- mtDNAs from only one of the founding mtDNA haplo-groups, that of haplogroup A (Torroni et al., 1992,ture with European or African immigrants or the second-
ary gain or loss of informative restriction sites (Torroni 1993a). This is substantiated by the southern Na-Dene,including the Apache and Navajo, who are >60%and Wallace, 1995). The major exception to this is found
in the Native Americans of Central North America. haplogroup A. The remaining Apache and NavajomtDNAs are from haplogroups B, C, and D andThese populations have been discovered to harbor a
fifth ancient founding mtDNA lineage, designated probably represent recent admixture with adjacentPaleo-Indian tribes. The distinctive nature of thehaplogroup X (Fig. 5). Analysis of the mtDNA of 42
Ojibwa of the Great Lakes region revealed 11 (26%) Na-Dene mtDNAs is confirmed by the fact that abouta third of all Na-Dene haplogroup A mtDNAs carry athat were not from haplogroups A, B, C, or D. Similarly,
of the Nuu-Chah-Nulth and the Bella Coola of the novel variant, an RsaI site loss at np 16 329 (A to G at16 331). Interestingly, this variant is found in allPacific northwest, 13.3% and 4% respectively were non-
A–D. Extensive analysis of these mtDNAs revealed that Na-Dene except the Haida. This may suggest that theRsaI site loss occurred in the original Beringian popula-they had some features in common with the rare
European haplogroup X. The shared markers included tions that gave rise to the Na-Dene in the Americas.Analyses of the sequence diversity of the Na-Denerestriction site polymorphisms for an AvaII site at np
14 465, the absence of DdeI sites at np 1715 and at np haplogroup A mtDNAs gave a value of 0.021%. This issubstantially lower than the diversity of the Paleo-Indian10 394, and the presence of the HaeIII site at np 16 517.
Control-region sequence analysis further revealed that haplogroups A+C+D and also different from thePaleo-Indian haplogroup B. Hence, the Na-Dene doboth the Native American and European haplogroup X
mtDNAs shared additional nucleotide variants, located appear to have arrived as a single independent migration,which occurred more recently than the Paleo-Indiansat 16 189C, 16 223T, 16 278T, 73G, 153G, 195G, 225A,
and 263B. However, comparison of the European and migration (Torroni et al., 1992, 1993a). This conclusionhas been confirmed by analysis of control-regionNative American control-region sequences also revealed
clear differences, indicating that the last common ances- sequence data (Forster et al., 1996).Analysis of the mtDNA variation in Eskimos hastor of the European and Native American haplogroup
X mtDNAs lived long ago. Moreover, whereas the been more difficult, because of the limited availabilityof samples and their recent divergence from ancestralabove-mentioned survey of the pre-Columbian burial
site revealed mostly mtDNAs of haplogroups A, B, C, populations. However, a survey of 129 Siberian YupikEskimos, who represent Eskimo peoples inhabiting bothor D, two skeletons were found to be different and to
have the same control region sequence as a subset of sides of the Bering Strait, revealed only haplogroups Aand D. Hence, the Eskimos may also be distinct fromthe Ojibwa haplogroup X mtDNAs (Brown et al., 1998).
Hence, the Central North American haplogroup X the Na-Dene and Paleo-Indians, as predicted from lin-guistic associations (Torroni et al., 1993b; StarikovskayamtDNAs are not the result of recent European admix-
ture with Native Americans, but arrived in an ancient, et al., 1998).Times of the Native American migrations, as in thepre-Columbian, migration (Brown et al., 1998). A
survey of the distribution of haplogroup X throughout cases of the African, European, and Asian populations,were calculated using the haplogroup-specific mtDNAAsia, including 411 Siberians (Torroni et al., 1993b)
and 207 Asians (Ballinger et al., 1992; Torroni et al., sequence diversity and the mtDNA sequence evolutionrate of 2.2–2.9%/MYR. This rate was calculated using1994c), failed to reveal a single haplogroup X mtDNA.
This implies that the Native American haplogroup X the Chibcha-speaking peoples of Central America, whoare estimated from anthropological and nuclear geneticmay not be of Asian ancestry. This raises the possibility
that haplogroup X came to the Americas in a separate data to have originated about 8000–10 000 YBP.Analyzing the mtDNA variation of 110 Chibchansmigration originating in Europe. Analysis of the haplo-
group X restriction and control region sequence data representing five tribes revealed that all but one of theChibchan mtDNAs were from haplogroups A or B, thehas permitted us to estimate the divergence time of the
American and European haplogroup X mtDNAs, which exception being a single haplogroup D. Moreover, 62%of the Chibchan haplogroup A mtDNAs showed aproved to be in the range of 15 000 to 30 000 YBP.
Thus, haplogroup X must have come to the Americas distinctive private polymorphism, the loss of an MspIsite at np 104, the result of a small deletion in the 3∞with the original Native American migrations and repre-
sents a novel founder lineage of possibly European end of the D-loop hypervariable region II (Santos andBarrantes, 1994; Torroni et al., 1994a). Averaging theorigin (Brown et al., 1998).
Analysis of mtDNA variation of the Na-Dene has sequence diversity of the haplogroup A and B mtDNAsand dividing by the putative age of the population gaveconfirmed that they are distinct from the Paleo-Indians.

223D.C. Wallace et al. / Gene 238 (1999) 211–230
the sequence evolution rate of 2.2–2.9%/MYR (Torroni sion that gave rise to the Na-Dene and Eskimo popula-tions (Starikovskaya et al., 1998).et al., 1994a).
Analysis of the Koryaks and Itel’men of theUsing this Native American sequence evolution rate,Kamchatka peninsula revealed a very different haplo-we calculated that the first Paleo-Indian migration carry-group distribution. The Koryaks proved to be 5.2% A;ing haplogroups A, C, and D (sequence diversity of36.1% C, 1.3% D, 41.9% G, 9.7% Y, and 5.8% Z. The0.075%) arrived 26 000–34 000 YBP and that the secondItel’men were 6.4% A, 14.9% C, 68.1% G, 4.3% Y, andPaleo-Indian migration bringing haplogroup B (0.034%)6.4% Z. Thus, even though the Chukotka andarrived 12 000–15 000 YBP. The Na-Dene migrationKamchatka populations are proximate to each otherwith a sequence diversity of 0.021% was estimated toand the Chukchi and Koryaks have related languages,have arrived 7200–9000 YBP, a value strikingly similarthe mtDNAs of these are strikingly distinct. Indeed, into the 9500 YBP value estimated by glottochronologya neighbor-joining tree analysis, the Eskimos and(Torroni et al., 1994a) (Fig. 5).Chukchi were located at one end of the tree with theComparable estimates from control-region sequenceAmerinds and Na-Dene, whereas the Koryaks anddata have suggested an initial major expansion out ofItel’men were at the other end of the tree with the Ainu,northeastern Siberia into the Americas to generate theJapanese, Koreans, and other Siberians (Schurr et al.,Paleo-Indians (Amerind) occurring about 20 000 to1999).25 000 YBP, followed by a second rapid expansion out
The predominance of haplogroup C in the Paleo-of Beringia about 11 300 YBP giving rise to the Na-DeneIndians (Amerind) is most similar to the haplogroupand Eskimos (Forster et al., 1996).distribution seen in the central Siberian, where theEvenks and Udeguys are 84.3% C and 17.8% C respec-3.7. Siberian antecedents to Native American migrationstively. This raises the possibility that the progenitors ofthe Paleo-Indians may currently reside in central SiberiaWith the Siberian origin of Native Americans estab-(Starikovskaya et al., 1998; Schurr et al., 1999).lished, it was of interest to determine which Siberian
populations are the most likely progenitors of the vari-ous Native American migrations. To address this ques-
4. Leber’s hereditary optic neuropathy (LHON) and thetion, we have performed an extensive analysis of theinteraction between mtDNA disease mutations andmtDNAs of the Siberian Eskimos and Chukchi of thebackground mtDNA variationChukotka peninsula, and of the Koryaks and Itel’men
of the Kamchatka peninsula. The Chukotka peninsulaWhereas some germline mtDNA mutations are neut-is the region of northeastern Siberia closest to Alaska,
ral and become established in the human populationsand the Kamchatka peninsula extends south from theby genetic drift, many are deleterious and result in
Chukotcha peninsula forming the eastern border of the genetic disease. Deleterious mtDNA mutations varySea of Okhotsk. Analysis of 79 Siberian Eskimos widely in their severity, but the mildest mutations resultrevealed an mtDNA haplogroup distribution of 77.2% in an acute onset blindness syndrome known as LHON.A, 2.5% C, and 20.3% D. Similarly, the haplotype Extensive analysis of the mtDNAs of LHON patientsdistribution of the Chuckchi was 68.2% A, 10.6% C, has revealed that certain mtDNA haplotypes are prone12.1% D, and 9.1% G. Control-region sequence analysis to expression of LHON more than others. This indicatesof the Chukotka haplogroup A mtDNAs, and compari- that different population-specific mtDNA may be func-son with those of Native American Na-Dene and tionally different and hence might have been influencedNorthwestern Amerinds, revealed a 16 111 C to T trans- by selection.ition that appears to delineate an ‘American’ enclave of LHON classically manifests as acute-onset, bilateral,northeastern Siberian mtDNAs. Furthermore, deriva- central vision loss associated with the degeneration oftives of this sublineage were found to include some of the retinal ganglion cell layer and optic nerve. Typically,the progenitors of the coastal Amerinds, some bearing the onset and progression of blindness is relatively rapid,an additional 16 129A variant; the Haida and Bella with both eyes developing vision loss within a year ofCoola bear an additional 16 355T variant, and some each other and with blindness usually the only clinicalEskimos bear an additional 16 265G variant. The sign. However, in some LHON cases other more sever16 111T lineage of haplogroup A is further subdivided neurological abnormalities are also observed, the mostby the additional 16 192T variant. In addition to being common of which is early-onset dystonia associatedfound in Chuckotka, this 16 111T+16 192T lineage is with basal ganglia degeneration.the progenitor of the Na-Dene lineage, which bears the LHON is strictly maternally inherited, though thevariants 16 233G and 16 331G, the latter site generating penetrance is highly variable and there is an unexplainedthe characteristic Na-Dene RsaI site loss at np 16 329 predilection for males to be preferentially affected. A(16 331 A to G). Hence Chukotka seems to harbor typical pedigree for the most common mtDNA muta-
tion, MTND41LHON11778A, is shown in Fig. 6.some remnants of the progenitors of the Beringia expan-

224 D.C. Wallace et al. / Gene 238 (1999) 211–230
4.1. MtDNA mutations and LHON detected in a large number of control mtDNAs (Brownand Wallace, 1994a; Brown et al., 1995; Howell et al.,1995; Howell, 1997). In patients of European descent,A total of 23 mtDNA missense mutations have been
associated with LHON patients (Table 1). However, the MTND41LHON11778A mutation accounts forabout 50% of cases, whereas the MTND11LHON3460Adetailed genetic analysis has revealed that only a few
‘primary’ mutations contribute in a major way to the and MTND61LHON14484C mutations encompassroughly 15% each (Table 1). In Asia, the MTND41development of blindness. The remaining ‘secondary’
mutations may contribute to LHON by increasing the LHON11778A mutation accounts for 95% of patients(Mashima et al., 1993). Such continental differencesprobability of expressing the phenotype or may simply
be linked to other clinically important variants in the suggest that genetic backgrounds may affect the expres-sion of the different LHON mutations.same mtDNA haplotype.
The four ‘primary’ LHON mutations, listed in order The MTND61LDYT14459A mutation, while rela-tively rare, is the most severe of the primary LHONof decreasing severity, are MTND61LDYT14459A (Jun
et al., 1994; Shoffner et al., 1995), MTND41LHON mutations (Jun et al., 1994; Shoffner et al., 1995). Thismutation can be manifested in two very different pheno-11778A ( Wallace et al., 1988b), MTND11LHON3460A
(Howell et al., 1991; Huoponen et al., 1991, 1993), and types, LHON and/or generalized dystonia. TheMTND61LDYT14459A mutation converts the highlyMTND61LHON14484C (Johns et al., 1992a; Mackey
and Howell, 1992) (Table 1). The individual primary conserved alanine at codon 72 in the ND6 polypeptideto a valine, has been found to be heteroplasmic in atmutations represent strong risk factors for expression
of maternally inherited LHON, they have been observed least some family members in every pedigree studied(Table 1) (Jun et al., 1994; Shoffner et al., 1995). Thein a number of unrelated LHON families, they rarely
co-occur with each other, and they have not been optic atrophy associated with his mutation is similar to
Fig. 6. Maternally inherited pedigree of LHON due to the MTND41LHON11778A mutation. Affected individuals (filled symbols) experience acuteonset optic atrophy and central vision loss, generally as young adults. Even though the mutation is essentially homoplasmic, penetrance amongmaternal relatives is highly variable. Moreover, males are about three to four times more likely to lose their vision than females (Wallace et al.,1988b; Newman et al., 1991).

225D.C. Wallace et al. / Gene 238 (1999) 211–230
Table 1LHON disease mutations
No.a Mutation Classb Other Amino acidsc Approx. Controls Heteroplasmy Penetranced (%) Recoveryeneurol. European (%) (%)disease Cons Change patients (%) Relatives Males
1 MTND61LDYT14459A Primary +/− A72V M Rare 0 + 61 58 Low2 MTND41LHON11778A Primary +/− R340H H 50 0 +/− 33–60 82 43 MTND11LHON3460A Primary +/− A52T M 15 0 +/− 14–75 40–80 224 MTND61LHON14484C Primary − M64V L 15 0 +/− 27–80 68 37-505 MTND21LHON5244A Primary − G2595 H Rare 0 + NA NA UN6 MTND51LHON13730A Primary − G465E M Rare 0 + NA NA Yes7 MTCO31LHON9804A Primary? − A200T H 1.5 0 − UN UN UN8 MTND31LHON10663C Primary? − V65A L Rare 0 − 56 60 UN9 MTATP61LHON9101C Primary? − I192T L Rare 0 − NA NA UN10 MTND41LDYT11696G Primary? +/− V312I L Rare 0 − UN UN UN11 MTND61LHON14482G Primary? − M64I L Rare 0 − UN 89 UN12 MTND61LHON14498T Primary? − Y59C M Rare 0 + 31 50 UN13 MTND61LHON14568T Primary? − G36S L Rare 0 − NA NA UN14 MTND61LDYT14596A Primary? +/− I26M M Rare 0 + UN UN UN15 MTCYB1LHON15257A Intermediate − D171N H 9 0.4 − NA NA NA16 MTND51LHON13708A Secondary − A458T M 30 6 − NA NA NA17 MTND11LHON3394C Secondary − Y30H H Rare 0.9 − NA NA NA18 MTND11LHON4160C Secondary ++ L285P H Rare 0 − 76 54 019 MTND11LHON4216C Secondary − Y304H L ~40 13 − NA NA NA20 MTND21LHON4917G Secondary − D150N H 3 3 − NA NA NA21 MTCO11LHON7444A Secondary − Ter�K NA 5 1 − NA NA UN22 MTCO31LHON9438A Secondary − G78S H 2.5 4.6 − NA UN NA23 MTCYB1LHON15812A Secondary − V357M M 4 0.1 − NA NA NA
a The first 10 LHON-associated mtDNA mutations are listed in order of estimated severity (see text).b A question mark in classification indicates transient assignment pending more data.c H=high amino acid conservation; M=moderate; L=low; NA=not applicable; Ter=termination codon.d NA=not applicable; UN=unknown; penetrance estimate for the 10 663 mutation is from a single LHON family that does not harbor a common
primary LHON mutation by complete mtDNA sequence analysis.e Low=anecdotal low degree of vision recovery; UN=unknown; NA=not applicable.
that seen for other LHON mutations. By contrast, the et al., 1991; Brown and Wallace, 1994b). Furthermore,only about 4% of affected individuals experience visualdystonia caused by this mutation has a mean age of
onset of 4 years, with a range of 1.5 to 9 years. In these recovery. Hence, the MTND41LHON11778A mutationhas a slightly lower penetrance than the MTND61dystonia patients, the motor system was primarily
involved, resulting in gait disturbance and rigidity of LDYT14459A mutation, and a much greater biastowards males being affected.the lower extremities, which advances with age to include
the upper extremities. Patients also developed pseudo- Of the affected individuals, the mean age of onset is27.6 years, with a range of onset from 8 to 60 years.bulbar syndrome (swallowing and speech problems),
impaired intelligence, short stature and myopathic fea- About 58% of patients show additional ophthalmologi-cal features, including peripapillary telangiectasias,tures. These symptoms are often associated with bilateral
striatal necrosis (Novotny et al., 1986), the loss of cells microangiopathy, disk pseudo-edema, and vascular tor-tuosity. A total of 55% of patients have a simultaneousin the striatum, putamen and caudate. The penetrance
of the MTND61LDYT14459A mutation among mater- onset of vision loss in both eyes, and once vision lossbegins it can progress rapidly or slowly, with a meannal relatives is about 61%, with 58% of affected individ-
uals being male. There is no record of affected length of progression for 3.7 months and a range of 0to 24 months. In about 98% of cases, the final visualindividuals recovering (Table 1).
The MTND41LHON11778A mutation is the most acuity is 20/200 or worse, and only 2% are better than20/200 (Newman et al., 1991). Occasional individualscommon cause of LHON, and the second most severe
mutation. It converts the highly conserved ND4 codon also show additional neurological symptoms, reminis-cent of those of the MTND61LDYT14459A mutation340 from an arginine to a histidine ( Wallace et al.,
1988b). Among MTND41LHON11778A families, including ataxia, spastic paraparesis, extrapyramidalsigns, dystonic rigidity associated with bilateral basalabout 33–60% of maternal relatives are affected, with
82% of the affected individuals being male and 18% ganglia, and cerebellar and pontine atrophy, etc.(Larsson et al., 1991; Funakawa et al., 1995; Verganifemale. About 14% of cases are heteroplasmic (Newman
226 D.C. Wallace et al. / Gene 238 (1999) 211–230
et al., 1995). In LHON pedigrees with the The MTND61LHON14484C mutation is additionallynoteworthy in that fully 37–50% of patients report visualMTND41LHON11778A mutation, about 1–2% of
female patients also manifest a multiple-sclerosis-like improvement (Table 1) (Johns et al., 1993; Riordan-Evaet al., 1995). Thus, the MTND61LHON14484C muta-demyelination disease (Newman et al., 1991; Harding
et al., 1992; Flanigan and Johns, 1993; Hanefeld et al., tion has the lowest pathogenicity of the primary LHONmutations.1994; Kellar-Wood et al., 1994; Olsen et al., 1995).
Interestingly, in the Japanese there is no such association Analysis of the background mtDNA haplotypes inLHON families harboring the various primary mut-between the MTND41LHON11778A mutation and
multiple sclerosis (Nishimura et al., 1995), again sug- ations has shown that most families are new mutations.However, striking background haplotype associationsgesting that genetic background may be important in
disease expression. have been found in patients with the milder LHONmutations, suggesting an interaction between the recentThe MTND11LHON3460A mutation is the next
most severe. It changes a moderately conserved alanine mild pathogenic mutation and the ancient backgroundgenotype.at codon 52 in the ND1 gene to a threonine and has
been observed to be heteroplasmic in a number of The MTND61LDYT14459A mutation was first iden-tified in a large Hispanic family, which proved to harborfamilies (Howell et al., 1991; Huoponen et al., 1991,
1993; Brown and Wallace, 1994b). Generally, the clinical a Native American mtDNA from haplogroup D (Junet al., 1994, fig. 20). A second case was found in anmanifestations of this mutation are confined to LHON,
having features quite similar to MTND41 African–American family harboring an African haplo-group L mtDNA, and involved a mother and daughterLHON11778A. Only occasionally is the MTND11
LHON3460A mutation associated with other neurolog- with LHON in which the daughter also had unilateralstriatal degeneration. The third case involved aical signs (Table 1), though patients harboring this
mutation can manifest multiple sclerosis ( Kellar-Wood European child with generalized dystonia, who wasfound to harbor European haplogroup I mtDNA (Junet al., 1994; Nikoskelainen et al., 1995). The number of
affected maternal relatives has varied widely in different et al., 1994; Shoffner et al., 1995). Since mtDNA haplo-types of these three families encompass most of thestudies, but can approach 75% (Johns et al., 1992b;
Harding et al., 1995), with between 40% and 80% of all world’s mtDNA sequence diversity, the MTND61LDYT14459A mutations must have arisen recently andaffected individuals being male. In contrast to the
MTND41LHON11778A mutation, however, approxi- independently in each family (Jun et al., 1994; Shoffneret al., 1995). Whether the phenotype variation is in anymately 22% of affected individuals with the
MDND11LHON3460A have been reported to experi- way related to variation in haplotype could not bedetermined.ence visual recovery (Johns et al., 1993).
The MTND61LHON14484C mutation is the mildest A similar haplotype analysis has been performed on47 LHON patients of European descent harboring theof the common primary mutations. This mutation
changes the weakly conserved methionine at codon 64 three common ‘primary’ mutations: MTND41LHON11778A, MTND11LHON3460A, and MTND61in the ND6 protein to a valine. The pathogenicity of
the MTND61LHON14484C mutation is nicely con- LHON14484C (Fig. 7) (Brown et al., 1995). Thisrevealed that patients harboring the MTND41firmed by one of the rare LHON mutations:
MTND61LHON14482G. This mutation alters the same LHON11778A and MTND11LHON3460A mutationshad a variety of different mtDNA background haplo-codon as the MTND61LHON14484C mutation, but
converts the methione to an isoleucine, yet both mut- types dispersed throughout the European mtDNAhaplogroups. Thus, most, if not all, LHON familiesations are associated with LHON (Howell, 1998). The
MTND61LHON14482C mutation has only very rarely with these mutations are due to independent mutationalevents. By contrast, most patients harboring thebeen reported to be heteroplasmic (Table 1) (Johns
et al., 1992a; Mackey and Howell, 1992; Biousse et al., MTND61LHON14484C mutation clustered together ona single mtDNA lineage, haplogroup J (Fig. 7).1997), suggesting that the great majority of mtDNA
patients must be mutant to cause a sufficient biochemical However, the MTND61LHON14484C patients werestill dispersed among the haplogroup J controls, indicat-defect to result in optic atrophy. Clinically, this mutation
is almost exclusively confined to an LHON phenotype. ing that most, if not all, MTND61LHON14484C pedi-grees are new mutations (Brown et al., 1995). Still, theThe penetrance of LHON in MTND61LHON14484C
mutation maternal relatives is about 27–80%, and the association between the MTND61LHON14484C muta-tion and haplogroup J is striking. Haplogroup J ismale to female ratio of affected individuals is similarly
high compared with that for the MTND41 present in only about 9% of the general Europeanpopulation, but it was found in 37% of LHON patientsLHON11778A and MTND11LHON3460A mutations
(Johns et al., 1993; Harding et al., 1995; Riordan-Eva harboring the MTND41LHON11778A mutation and80% of LHON patients harboring the MTND61et al., 1995).

227D.C. Wallace et al. / Gene 238 (1999) 211–230
Fig. 7. Phylogenetic tree of Caucasian mtDNAs from 47 LHON patients (L1–L47, bold) and 175 Caucasian controls obtained from the UnitedStates and Canada. Haplotypes were determined by RFLP analysis using the entire mtDNA. For the patients, all mtDNA haplotypes are shownand the presence of a common primary mutation is indicated (see key). Additional mutations of interest are noted in parentheses. Multipleoccurrences of the three common primary LHON mutations are indicated by their presence in independent mtDNA lineages, and, when occurringwithin the same large mtDNA lineage, by the presence of intermediate haplotypes lacking LHON mutations. The numbers in large, bold characterson branches indicate mutations that define specific groups of mtDNAs, but they are not necessarily the mutational steps used to create thephylogeny. The horizontal branch lengths are proportional to the number of mutational events that separate haplotypes. From Brown et al. (1995)with permission.
LHON14484C mutation (Brown et al., 1997). Indeed, Why might haplogroup J augment the expression ofthe MTND61LHON14489C mutation? Haplogrouponly rarely have European patients with the
MTND61LHON14484C mutation been found to have J mtDNAs might harbor a number of important aminoacid substitution polymorphisms that augment thea non-haplogroup J mtDNA (Biousse et al., 1997), and
in only one case has the MTND61LHON14484C muta- expression of the MTND61LHON14484C mutation.The two variants that define the main haplogrouption been reported to be associated with the African
haplogroup L mtDNA (Torroni et al., 1996b). J lineage are MTND51LHON13708A and MTND11

228 D.C. Wallace et al. / Gene 238 (1999) 211–230
LHON4216C (Johns et al., 1992a, 1993; Obermaier- ulation? One possibility is that it was selected duringthe ice ages.Kusser et al., 1994; Oostra et al., 1994; Brown et al.,
1995; Howell et al., 1995; Riordan-Eva et al., 1995). It has been proposed that a major selective pressurethat acted on early European populations was theThe MTND51LHON13708A mutation converts a mod-
erately conserved alanine at codon 458 in the ND5 repeated periods of severe cold, associated with theadvance and retreat of the glaciers. In this context,protein to a threonine (Johns and Neufeld, 1991; Brown
et al., 1992a), whereas the MTND11LHON4216C muta- mitochondrial OXPHOS has two major functions: pro-viding energy for the cell in the form of ATP andtion converts a weakly conserved tyrosine at codon 304
in the ND1 protein to histidine (Johns and Neufeld, generating heat of thermal regulation. However, thegeneration of heat is accomplished at the expense of1991; Brown et al., 1992a). The sequencing of multiple
haplogroup J mtDNAs has failed to reveal any other ATP-generating capacity, since both processes competefor the potential energy stored in the electrochemicalobvious sequence variants that could account for this
mtDNA lineage’s predilection toward increased expres- gradient (Dy) maintained across the mitochondrial innermembrane. Therefore, during the ice ages in Europesion of LHON (Brown et al., 1992b).
One major sub-branch of haplogroup J is delineated there may have been strong selective advantage formtDNA mutations that partially uncoupled OXPHOS,by the MTCYB1LHON15257A variant. This variant
converts the highly conserved aspartate at codon 171 in biasing the use of calories toward increased heat pro-duction and better thermal regulation, at the expense ofthe cytochrome b gene to an asparagine (Brown et al.,
1992a), and is even more frequently associated with efficient ATP production. Although such mutationswould be relatively neutral in conditions of caloricLHON. Hence the MTCYB1LHON15257A mutation
might also contribute to the mitochondrial defect excess, and hence be maintained in the population atpolymorphic frequencies, they would have an increased(Fig. 7, Table 1). A second sub-branch of haplogroup
J is defined by the MTND11LHON3394C variant. This tendency for disease expression when combined with avery mild pathogenic mutation such as MTND61changes the highly conserved tyrosine at codon 30 in
the ND1 protein to histidine. The MTND11 LHON14484C. Hence, the presence of this mtDNAwould increase the expressivity of subsequent pathogenicLHON3394C variant is prevalent in French Canadians,
but is also unlikely to contribute to the disease (Fig. 7, mtDNA mutations.If this analysis is correct, then the population distribu-Table 1).
All haplogroup J mtDNAs harbor the MTND11 tions of the various population-specific mtDNA lineagesmight not simply reflect genetic drift. Further, selectionLHON4216C variant along with the MTND51LHON
13708A variant. However, MTND11LHON4216C can at various times in human history might have acted toincrease the prevalence of certain lineages over others.also be associated with MTND21LHON4917G. The
MTND21LHON4917G variant changes a highly con-served aspartate at codon 150 in the ND2 protein to anasparagine (Brown et al., 1995). The sharing of theMTND11LHON4216C between these two lineages
Referencesraises the possibility that the two lineages may be sub-branches of a common single larger haplogroup that
Anderson, S., Bankier, A.T., Barrell, B.G., de Bruijn, M.H., Coulson,predisposes individuals to LHON (Howell et al., 1995). A.R., Drouin, J., Eperon, I.C., Nierlich, D.P., Roe, B.A., Sanger,If so, then the mild MTND11LHON4216C variant F., Schreier, P.H., Smith, A.J., Staden, R., Young, I.G., 1981.
Nature 290, 457–465.might be relevant for diseases. Alternatively, theBailliet, G., Rothhammer, F., Carnese, F.R., Bravi, C.M., Bianchi,predisposition to LHON might be caused by the
N.O., 1994. American Journal of Human Genetics 55, 27–33.MTND51LHON13708A variant on one lineage andBallinger, S.W., Schurr, T.G., Torroni, A., Gan, Y.Y., Hodge, J.A.,
the MTND21LHON4917 variant on the other. Hassan, K., Chen, K.H., Wallace, D.C., 1992. Genetics 130,139–152.
Biousse, V., Brown, M.D., Newman, N.J., Allen, J.C., Rosenfeld, J.,4.2. Adaptation and the mtDNAMeola, G., Wallace, D.C., 1997. Neurology 49, 1136–1138.
Blanc, H., Chen, K.H., D’Amore, M.A., Wallace, D.C., 1983.Regardless of the actual polymorphisms that contrib-American Journal of Human Genetics 35, 167–176.
ute to the expressivity of the MTND61LHON14484C Brockington, M., Sweeney, M.G., Hammans, S.R., Morgan-Hughes,mutation, it is clear that haplogroup J mtDNAs are J.A., Harding, A.E., 1993. Nature Genetics 4, 67–71.
Brown, M.D., Wallace, D.C., 1994a. Clinical Neuroscience 2, 138–145.biochemically different from those of other population-Brown, M.D., Wallace, D.C., 1994b. Journal of Bioenergetics and Bio-specific mtDNA lineages. This clearly demonstrates that
membranes 26, 273–289.at least some of the population-specific polymorphismsBrown, M.D., Voljavec, A.S., Lott, M.T., Torroni, A., Yang, C.C.,
in the mtDNA can have adaptive significance. Wallace, D.C., 1992a. Genetics 130, 163–173.If haplogroup J is more deleterious, why has it Brown, M.D., Voljavec, A.S., Lott, M.T., MacDonald, I., Wallace,
D.C., 1992b. FASEB Journal 6, 2791–2799.reached polymorphic frequencies in the European pop-

229D.C. Wallace et al. / Gene 238 (1999) 211–230
Brown, M.D., Torroni, A., Reckord, C.L., Wallace, D.C., 1995. Howell, N., Kubacka, I., Halvorson, S., Howell, B., McCullough,D.A., Mackey, D., 1995. Genetics 140, 285–302.Human Mutation 6, 311–325.
Brown, M.D., Sun, F., Wallace, D.C., 1997. American Journal of Huoponen, K., Vilkki, J., Aula, P., Nikoskelainen, E.K., Savontaus,M.L., 1991. American Journal of Human Genetics 48, 1147–1153.Human Genetics 60, 381–387.
Brown, M.D., Hosseini, S.H., Torroni, A., Bandelt, H.J., Allen, J.C., Huoponen, K., Lamminen, T., Juvonen, V., Aula, P., Nikoskelainen,E., Savontaus, J.L., 1993. Human Genetics 92, 379–384.Schurr, T.G., Scozzari, R., Cruciani, F., Wallace, D.C., 1998.
American Journal of Human Genetics 63, 1852–1861. Johns, D.R., Neufeld, M.J., 1991. Biochemical and BiophysicalResearch Communications 181, 1358–1364.Brown, W.M., 1980. Proceedings of the National Academy of Sciences
of the United States of America 77, 3605–3609. Johns, D.R., Neufeld, M.J., Park, R.D., 1992a. Biochemical and Bio-physical Research Communications 187, 1551–1557.Brown, W.M., George, M., Wilson, A.C., 1979. Proceedings of the
National Academy of Sciences of the United States of America 76, Johns, D.R., Smith, K.H., Miller, N.R., 1992b. Archives of Ophthal-mology 110, 1577–1581.1967–1971.
Cann, R.L., Wilson, A.C., 1983. Genetics 104, 699–711. Johns, D.R., Heher, K.L., Miller, N.R., Smith, K.H., 1993. Archivesof Ophthalmology 111, 495–498.Cann, R.L., Stoneking, M., Wilson, A.C., 1987. Nature 325, 31–36.
Case, J.T., Wallace, D.C., 1981. Somatic Cell Genetics 7, 103–108. Johnson, M.J., Wallace, D.C., Ferris, S.D., Rattazzi, M.C., Cavalli-Sforza, L.L., 1983. Journal of Molecular Evolution 19, 255–271.Chen, X., Prosser, R., Simonetti, S., Sadlock, J., Jagiello, G., Schon,
E.A., 1995a. American Journal of Human Genetics 57, 239–247. Jun, A.S., Brown, M.D., Wallace, D.C., 1994. Proceedings of theNational Academy of Sciences of the United States of America 91,Chen, Y.S., Torroni, A., Excoffier, L., Santachiara-Benerecetti, A.S.,
Wallace, D.C., 1995b. American Journal of Human Genetics 57, 6206–6210.Kaneda, H., Hayashi, J., Takahama, S., Taya, C., Lindahl, K.F.,133–149.
Chen, Y.S., Schurr, T.G., Olckers, A., Kogelnik, A., Huoponen, K., Yonekawa, H., 1995. Proceedings of the National Academy of Sci-ences of the United States of America 92, 4542–4546.Wallace, D.C., 1999.
Denaro, M., Blanc, H., Johnson, M.J., Chen, K.H., Wilmsen, E., Kellar-Wood, H., Robertson, N., Govan, G.G., Compston, D.A.,Harding, A.E., 1994. Annals of Neurology 36, 109–112.Cavalli Sforza, L.L., Wallace, D.C., 1981. Proceedings of the
National Academy of Sciences of the United States of America 78, Larsson, N.G., Andersen, O., Holme, E., Oldfors, A., Wahlstrom, J.,1991. Annals of Neurology 30, 701–708.5768–5772.
Di Rienzo, A., Wilson, A.C., 1991. Proceedings of the National Acad- Mackey, D., Howell, N., 1992. American Journal of Human Genetics51, 1218–1228.emy of Sciences of the United States of America 88, 1597–1601.
Flanigan, K.M., Johns, D.R., 1993. Neurology 43, 2720–2722. Mashima, Y., Hiida, Y., Oguchi, Y., Kudoh, J., Shimizu, N., 1993.Human Genetics 92, 101–102.Forster, P., Harding, R., Torroni, A., Bandelt, H.J., 1996. American
Journal of Human Genetics 59, 935–945. Merriwether, D.A., Clark, A.G., Ballinger, S.W., Schurr, T.G.,Soodyall, H., Jenkins, T., Sherry, S.T., Wallace, D.C., 1991.Funakawa, I., Kato, H., Terao, A., Ichihashi, K., Kawashima, S.,
Hayashi, T., Mitani, K., Miyazaki, S., 1995. Journal of Neurology Journal of Molecular Evolution 33, 543–555.Michaels, G.S., Hauswirth, W.W., Laipis, P.J., 1982. Developmental242, 75–77.
Giles, R.E., Blanc, H., Cann, H.M., Wallace, D.C., 1980. Proceedings Biology 94, 246–251.Neckelmann, N., Li, K., Wade, R.P., Shuster, R., Wallace, D.C., 1987.of the National Academy of Sciences of the United States of
America 77, 6715–6719. Proceedings of the National Academy of Sciences of the UnitedStates of America 84, 7580–7584.Greenberg, J.H., Turner II, C.G., Zegura, S.L., 1986. Current Anthro-
pology 27, 477–497. Nei, M., Tajima, F., 1983. Genetics of South America 105, 207–217.Newman, N.J., Lott, M.T., Wallace, D.C., 1991. American Journal ofGyllensten, U., Wharton, D., Josefsson, A., Wilson, A.C., 1991.
Nature 352, 255–257. Ophthalmology 111, 750–762.Nikoskelainen, E.K., Marttila, R.J., Huoponen, K., Juvonen, V.,Hanefeld, F.A., Ernst, B.P., Wilichowski, E., Christen, H.J., 1994.
Neuropediatrics 25, 331. Lamminen, T., Sonninen, P., Savontaus, M.L., 1995. Journal ofNeurology, Neurosurgery and Psychiatry 59, 160–164.Harding, A.E., Sweeney, M.G., Miller, D.H., Mumford, C.J.,
Kellar-Wood, H., Menard, D., McDonald, W.I., Compston, D.A.S., Nishimura, M., Obayashi, H., Ohta, M., Uchiyama, T., Hao, Q.,Saida, T., 1995. Neurology 45, 1333–1334.1992. Brain 115, 979–989.
Harding, A.E., Sweeney, M.G., Govan, G.G., Riordan-Eva, P., 1995. Novotny, E.J., Singh, G., Wallace, D.C., Dorfman, L.J., Louis, A.,Sogg, R.L., Steinman, L., 1986. Neurology 36, 1053–1060.American Journal of Human Genetics 57, 77–86.
Hedges, S.B., Kumar, S., Tamura, K., 1991. Science 255, 737–739. Obermaier-Kusser, B., Lorenz, B., Schubring, S., Paprotta, A., Zerres,K., Meitinger, T., Meire, F., Cochaux, P., Blankenagel, A.,Hertzberg, M., Mickleson, K.N.P., Serjeantson, S.W., Prior, J.F.,
Trent, R.J., 1989. American Journal of Human Genetics 44, Kommerell, G., Jaksch, M., Gerbitz, K.D., 1994. AmericanJournal of Human Genetics 55, 1063–1066.504–510.
Hopkin, K., 1999. Scientific American 280, 21. Olsen, N.K., Hansen, A.W., Norby, S., Edal, A.L., Jorgensen, J.R.,Rosenberg, T., 1995. Acta Neurologica Scandinavica 91, 326–329.Horai, S., Matsunaga, E., 1986. Human Genetics 72, 105–117.
Horai, S., Hayasaka, K., 1990. American Journal of Human Genetics Oostra, R.J., Bolhuis, P.A., Wijburg, F.A., Zorn-Ende, G., Bleeker-Wagemakers, E.M., 1994. Journal of Medical Genetics 31, 280–286.46, 828–842.
Horai, S., Kondo, R., Nakagawa-Hattori, Y., Hayashi, S., Sonoda, Passarino, G., Semino, O., Bernini, L.F., Santachiara-Benerecetti,A.S., 1996. American Journal of Human Genetics 59, 927–934.S., Tajima, K., 1993. Molecular Biology and Evolution 10, 23–47.
Horai, S., Hayasaka, K., Kondo, R., Tsugane, K., Takahata, N., 1995. Passarino, G., Semino, O., Quintana-Murci, L., Excoffier, L.,Hammer, M., Santachiara-Benerecetti, A.S., 1998. American Jour-Proceedings of the National Academy of Sciences of the United
States of America 92, 532–536. nal of Human Genetics 62, 420–434.Riordan-Eva, P., Sanders, M.D., Govan, G.G., Sweeney, M.G.,Howell, N., 1997. Journal of Bioenergetics and Biomembranes 29,
165–173. DaCosta, J., Harding, A.E., 1995. Brain 118, 319–337.Saitou, N., Nei, M., 1987. Molecular Biology and Evolution 4,Howell, N., 1998. Vision Research 38, 1495–1504.
Howell, N., Bindoff, L.A., McCullough, D.A., Kubacka, I., Poulton, 406–425.Santos, M., Barrantes, R., 1994. American Journal of Human GeneticsJ., Mackey, D., Taylor, L., Turnbull, D.M., 1991. American Jour-
nal of Human Genetics 49, 939–950. 55, 413–414.

230 D.C. Wallace et al. / Gene 238 (1999) 211–230
Schurr, T.G., Ballinger, S.W., Gan, Y.Y., Hodge, J.A., Merriwether, Scott, C.R., Lott, M.T., Winter, M., Wallace, D.C., 1994d.American Journal of Human Genetics 54, 303–318.D.A., Lawrence, D.N., Knowler, W.C., Weiss, K.M., Wallace,
Torroni, A., Huoponen, K., Francalacci, P., Petrozzi, M., Morelli, L.,D.C., 1990. American Journal of Human Genetics 46, 613–623.Scozzari, R., Obinu, D., Savontaus, M.L., Wallace, D.C., 1996a.Schurr, T.G., Sukernik, R.I., Starikovskaya, Y.B., Wallace, D.C.,Genetics 144, 1835–1850.1999. American Journal of Physical Anthropology 108, 1–39.
Torroni, A., Carelli, V., Petrozzi, M., Terracina, M., Barboni, P.,Shoffner, J.M., Lott, M.T., Lezza, A.M., Seibel, P., Ballinger, S.W.,Malpassi, P., Wallace, D.C., Scozzari, R., 1996b. AmericanWallace, D.C., 1990. Cell 61, 931–937.Journal of Human Genetics 59, 248–252.Shoffner, J.M., Brown, M.D., Stugard, C., Jun, A.S., Pollok, S., Haas,
Turner II, C.G., 1983. In: Shutler Jr, R. (Ed.), Early Man in the NewR.H., Kaufman, A., Koontz, D., Kim, Y., Graham, J., Smith, E., World. Sage, Beverly Hills, CA, pp. 147–157.Dixon, J., Wallace, D.C., 1995. Annals of Neurology 38, 163–169. Turner II, C.G., 1987. American Journal of Physical Anthropology
Starikovskaya, E.B., Sukernik, R.I., Schurr, T.G., Kogelnik, A.M., 73, 305–321.Wallace, D.C., 1998. American Journal of Human Genetics 63, Vergani, L., Martinuzzi, A., Carelli, V., Cortelli, P., Montagna, P.,1473–1491. Schievano, G., Carrozzo, R., Angelini, C., Lugaresi, E., 1995. Bio-
Stone, A.C., Stoneking, M., 1993. American Journal of Physical chemical and Biophysical Research Communications 210, 880–888.Anthropology 92, 463–471. Vigilant, L., Stoneking, M., Harpending, H., Hawkes, K., Wilson,
A.C., 1991. Science 253, 1503–1507.Stoneking, M., Jorde, L.B., Bhatia, K., Wilson, A.C., 1990. GeneticsWallace, D.C., 1986. Somatic Cell and Molecular Genetics 12, 41–49.124, 717–733.Wallace, D.C., 1987. In: McKusick, V.A., Roderick, T.H., Mori, J.,Swofford, D.L., 1993. University of Illinois, Champaign.
Paul, M.W. (Eds.), Medical and Experimental Mammalian Genet-Tateno, Y., Nei, M., Tajima, F., 1982. Journal of Molecular Evolutionics: A Perspective vol. 23. A.R. Liss, New York, pp. 137–190.18, 387–404.
Wallace, D.C., 1995. American Journal of Human Genetics 57,Templeton, A.R., 1992. Science 255, 737201–223.Torroni, A., Wallace, D.C., 1994. Journal of Bioenergetics and Bio-
Wallace, D.C., Torroni, A., 1992. Human Biology 64, 403–416.membranes 26, 261–271. Wallace, D.C., Garrison, K., Knowler, W.C., 1985. American Journal
Torroni, A., Wallace, D.C., 1995. American Journal of Human Genet- of Physical Anthropology 68, 149–155.ics 56, 1234–1236. Wallace, D.C., Ye, J.H., Neckelmann, S.N., Singh, G., Webster, K.A.,
Torroni, A., Schurr, T.G., Yang, C.C., Szathmary, E.J., Williams, Greenberg, B.D., 1987. Current Genetics 12, 81–90.R.C., Schanfield, M.S., Troup, G.A., Knowler, W.C., Lawrence, Wallace, D.C., Zheng, X., Lott, M.T., Shoffner, J.M., Hodge, J.A.,D.N., Weiss, K.M., 1992. Genetics 130, 153–162. Kelley, R.I., Epstein, C.M., Hopkins, L.C., 1988a. Cell 55,
Torroni, A., Schurr, T.G., Cabell, M.F., Brown, M.D., Neel, J.V., 601–610.Wallace, D.C., Singh, G., Lott, M.T., Hodge, J.A., Schurr, T.G.,Larsen, M., Smith, D.G., Vullo, C.M., Wallace, D.C., 1993a.
Lezza, A.M., Elsas, L.J., Nikoskelainen, E.K., 1988b. Science 242,American Journal of Human Genetics 53, 563–590.1427–1430.Torroni, A., Sukernik, R.I., Schurr, T.G., Starikovskaya, Y.B., Cabell,
Wallace, D.C., Lott, M.T., Shoffner, J.M., Ballinger, S., 1994. EpilepsiaM.F., Crawford, M.H., Comuzzie, A.G., Wallace, D.C., 1993b.35, S43–S50.American Journal of Human Genetics 53, 591–608.
Ward, R.H., Frazier, B.L., Dew-Jager, K., Paabo, S., 1991. Proceed-Torroni, A., Neel, J.V., Barrantes, R., Schurr, T.G., Wallace, D.C.,ings of the National Academy of Sciences of the United States of1994a. Proceedings of the National Academy of Sciences of theAmerica 88, 8720–8724.
United States of America 91, 1158–1162. Ward, R.H., Redd, A., Valencia, D., Frazier, B., Paabo, S., 1993.Torroni, A., Lott, M.T., Cabell, M.F., Chen, Y., Laverge, L., Wallace, Proceedings of the National Academy of Sciences of the United
D.C., 1994b. American Journal of Human Genetics 55, 760–776. States of America 90, 10 663–10 667.Torroni, A., Miller, J.A., Moore, L.G., Zamudio, S., Zhuang, J., Watson, E., Bauer, K., Aman, R., Weiss, G., von Haeseler, A., Paabo,
Droma, R., Wallace, D.C., 1994c. American Journal of Physical S., 1996. American Journal of Human Genetics 59, 437–444.Anthropology 93, 189–199. Wrischnik, L.A., Higuchi, R.G., Stoneking, M., Erlich, H.A., Arn-
heim, N., Wilson, A.C., 1987. Nucleic Acids Research 15, 529–542.Torroni, A., Chen, Y., Semino, O., Santachiara-Beneceretti, A.S.,