Embed Size (px)
Citation preview

sustainability
Article
Mitigating Supply Chain Risk via SustainabilityUsing Big Data Analytics: Evidence from theManufacturing Supply Chain
Venkatesh Mani 1,*, Catarina Delgado 1, Benjamin T. Hazen 2 and Purvishkumar Patel 3
1 Faculty of Economics, University of Porto, Dr. Roberto Frias, 4200-464 Porto, Portugal; [email protected] Department of Marketing and Supply Chain Management, University of Tennessee, Knoxville,
TN 37996, USA; [email protected] Maruti 3PL Private Ltd., Navdurga Society, Faizal Navapur, Bardoli, Gujarat 394601, India;
[email protected]* Correspondence: [email protected]; Tel.: +351-2-2557-1100
Academic Editors: Fabio Carlucci and Giuseppe IoppoloReceived: 14 December 2016; Accepted: 10 April 2017; Published: 14 April 2017
Abstract: The use of big data analytics for forecasting business trends is gaining momentum amongprofessionals. At the same time, supply chain risk management is important for practitionersto consider because it outlines ways through which firms can allay internal and external threats.Predicting and addressing the risks that social issues cause in the supply chain is of paramountimportance to the sustainable enterprise. The aim of this research is to explore the application of bigdata analytics in mitigating supply chain social risk and to demonstrate how such mitigation canhelp in achieving environmental, economic, and social sustainability. The method involves an expertpanel and survey identifying and validating social issues in the supply chain. A case study wasused to illustrate the application of big data analytics in identifying and mitigating social issues inthe supply chain. Our results show that companies can predict various social problems includingworkforce safety, fuel consumptions monitoring, workforce health, security, physical condition ofvehicles, unethical behavior, theft, speeding and traffic violations through big data analytics, therebydemonstrating how information management actions can mitigate social risks. This paper contributesto the literature by integrating big data analytics with sustainability to explain how to mitigate supplychain risk.
Keywords: big data; sustainability; supply chain social sustainability; social risk; social issues;case study
1. Introduction
The term social sustainability can be defined as the product and process factors affecting peopleinvolved in the manufacturing value chain [1]. Furthermore, social dimensions (e.g., inequality,safety, health and welfare), ethical issues, and bad labor practices affecting the workforce have beendescribed in terms of a supply chain’s social sustainability [2,3]. As competition increases globally,companies are finding new ways to strengthen their supply chain and to explore sustainable waysto gain a competitive advantage [4–6]. Thus, managers are revisiting their competitive strategies [7]with many investing considerable time and effort to capitalize on data analytics as a means of gainingcompetitive advantage [8]. However, the application of big data analytics in supply chain socialsustainability is scant, given that managers still use traditional data sources (e.g., enterprise resourceplanning, customer relationship management, and optimization algorithms) in making supply chaindecisions [9–11].
Sustainability 2017, 9, 608; doi:10.3390/su9040608 www.mdpi.com/journal/sustainability

Sustainability 2017, 9, 608 2 of 21
In reviewing literature on big data analytics (BDA) and sustainability, Keeso [12] argues thatthe application of big data in sustainable operations is often slow to achieve desired outcomes.Although sustainable supply chain management has little history in academic literature, it has becomea mainstream area for practitioners [13–15]. On the other hand, building on the knowledge-basedperspective some suggest the need for BDA as a knowledge resource that can be harvested andretained. The knowledge-based view can be traced from Simon’s [16] seminal work with significantextensions by Grant [17,18], Huber [19] and Levitt and March [20]. Further, the knowledge-basedperspective suggests how big data can fuel the purposive search for market and resource innovationopportunities [21]; such resources can provide corporations a competitive advantage [22].
While building knowledge-based resources, it is also imperative to predict and avoid risks causingpotential disruptions [23]. Recently, supply chain risk management (SCRM) has become a prioritybecause of its capability to avert potential disruption and recover more quickly from disruptions thatcannot be averted [24]. There are various risks including material flow risk, information flow risk andfinancial flow risk that cause supply chain disruptions [25]. Among these risks, supply chain socialissues can impose significant operational risks on the supply chain [26]. In the literature the linkagebetween supply chain social issues, and risk management has been established [26]. Further, Klassenand Vreecke [26] show that social issues can be managed through effective monitoring, innovationcapability and collaboration. They further assert that such social management capabilities not onlyavert potential risk in the supply chain but also evoke tangible outcomes [26]. Others point out severalsupply-chain-related disruptions (e.g., road accidents, drinking and driving, and floods) that causedelays in the supply chain [25]. These disruptions must be monitored in real time and should bebroadcast to supply chain partners. This process ensures both detection of supply chain risk anddisruption recovery [27,28].
Although scholars recognize the importance of using big data to enhance sustainability [29–31],practitioners have had some problems when integrating big data for sustainability, especially inmitigating social risk in supply chain decisions [25,30,32]. Additionally, research investigating thelink between big data analytics (BDA) and sustainability in the supply chain is urgently needed.Closing this research gap, our paper integrates BDA and supply chain sustainability to predict andaddress issues related to sustainability. Guiding research questions include the following: What aresocial issues pertaining to logistics and supply chain management in developing nations? How canthese issues be predicted and mitigated? Our contributions are two-fold. First we identify variousforms of social sustainability risk that disrupt the supply chain through panel discussion and surveymethods. Second, we describe a novel way of mitigating such risks by effectively adopting BDA topredict failures. This research helps practitioners know how to use big data in sustainability-relateddecision making.
The remainder of this paper is organized as follows. First, the theoretical foundation andliterature related to big data and social sustainability are explored in Section 2. Section 3 describes themethodology followed by results and analysis in Section 4. Section 5 discusses the study’s theoreticaland practical contributions. Finally, the conclusions and future research directions are presented inSection 6.
2. Review of Literature
2.1. Big Data Analytics and Supply Chain Management
Through globalization and digital technology, BDA has emerged as a new capability to providevalue from massive data and create a competitive advantage for corporations [33,34]. Big data can bereferred to as data characterized by high levels of volume (amount of data), variety (number of types),and velocity (speed) [30]. Thus, big data analytics refers a business’s capability to gain business insightsfrom big data by applying statistical tools, algorithms, simulations and optimizations [35]. Researcherscategorize big data analytics into descriptive, predictive, and prescriptive [5,11,36]. While descriptive

Sustainability 2017, 9, 608 3 of 21
analytics is used to identify problems and opportunities through existing processes such as onlineanalytical processing (OLAP), predictive analytics aims at discovering explanatory or predictivepatterns using data, text and web mining, so as to accurately project future trends [36,37]. On the otherhand, prescriptive analytics involves use of data and mathematical algorithms to determine and assessalternative decisions in order to improve business performance [37,38]. According to Mishra et al. [39],application of BDA in supply chain management and forecasting has been gaining importance overthe past decade. Supply chain practitioners are seriously considering the use of BDA in their supplychains to gain strategic benefits. For example, Accenture’s survey revealed that many managers havealready started applying big data knowledge in making their supply chain decisions [40].
Supply chain management faces serious challenges in the form of delayed shipments, inefficiencies,accidents, rising fuel costs, and ever-increasing consumer expectations that potentially harm the supplychain’s efficiency [41]. Applying BDA at both strategic and operational levels is considered crucialfor sustainability. Particularly in the supply chain’s operation-planning phase, big data analytics hasbeen used widely to solve problems with procurement, inventory, and logistics [38]. Others point outhow big data helps in efficiency of design, production, intelligence and service processes employed inproduct life cycle management (PLM) [42]. For example, Xia et al. [43] apply a robust big data systemto avoid stock-outs and maintain high fill rates that enable more accurate sales forecasting. Shen andChan [44] address demand forecasting and supply forecasting using BDA. Similarly, Hofmann [45]shows how big data can be used to avert and mitigate the bullwhip effect in the supply chain operations.However, most scholars emphasize that applying big data analytics in supply chain decisions is still inits infancy; therefore, studies related to BDA and supply chain management are scant [11,36,38,46].
2.2. Big Data Analytics and Sustainable Supply Chain Management
Although sustainable supply chain management has been discussed in corporate offices for sometime, actually implementing the sustainability phenomenon in the extended supply chain has proveddifficult [47]. Nevertheless, large corporations perceive sustainability efforts as long-term investmentsaimed toward building strategic resources [48]. Corporations are increasingly interested in using bigdata analytics in their sustainable efforts, which in turn give them a strategic edge [21] According toa Mckinsey survey report, companies using BDA are able to predict the 65% of customers that makerepeated purchases through shop alerts and 75% of those customers reported that they are likely touse the service again [22].
Several scholars acknowledge sustainability (environmental, social and financial) as an emergingarea for BDA applications in business [30,49]. However, such applications need to be implementedthroughout the supply chain in order to reap full benefits [8]. As a company aligns itself withdata-based decision-making processes, the company’s organizational and strategic capabilities arebound to change, thus affecting sustainability efforts. However, because of the increasing importance ofBDA and sustainability, these areas need to merge to yield the maximum competitive advantage [31,49].Although practitioners and scholars understand the pressing need for integrating big data analyticswith sustainable logistics and supply chain management, progress has been limited [12]. Few scholarsemphasize the need for integration of BDA and sustainability to avail the business and strategicbenefits [31,49]. Garetti and Taisch [50] advocate the need for methods that can process a large volumeof data to gain actionable insights into economic, social and environmental sustainability.
Studies have explored big data usage in predicting natural disasters such as seismic and tsunamihazards and mitigating other environmental hazards through big data simulation [51]. Big data are alsocollected about melting glaciers, deforestation, and extreme weather through satellite images, weatherradar and terrestrial monitoring devices. Such data are used to comprehensively study global climatechange and assign specific causality [52]. One of the other compelling social applications of big data ispeople’s health and welfare. For example, some scholars have applied big data analytics in identifyingprostate cancer biomarkers which can act as predictors of certain prognoses in health and social workactivities in Europe and US [53,54]. Yet another study has illustrated using policy-driven big data to

Sustainability 2017, 9, 608 4 of 21
support sustainability in various operations. For instance, computer platforms have been establishedto share environmental data (i.e., big data) and to use such data for environmental protection andgovernment-led publication of information on medical records for research and risk mitigation, amongother applications [55]. However, literature on the application of BDA for supply chain sustainabilityhas been much less explored. Thus, scholars acknowledge the need for further exploration in thisdomain [21,29,30,44]. Furthermore, for the supply chain to be sustainable, the potential risks disruptingoperations must be identified and predicted. In the next section, we explore the literature related tosupply chain risk management.
2.3. Big Data Analytics and Risk Mitigation
Many supply chain practitioners are attempting to manage supply chain risks, which can disruptthe supply chain in many ways. The strategies for mitigating such risk and averting disruption area key agenda for supply chain professionals. According to Tang and Musa [25] risk can be referred toas events with small probability but may occur abruptly; these events brings negative consequences tothe system. Further, Tang and Musa [25] classify the potential risks associated with supply chain asmaterials, cash, and information risks.
Mason-Jones and Towill [56] identify five overlapping sources of risk for supply chain: demand,supply, environmental, process, and control. Environmental risk sources are any external uncertaintiesarising out of political (e.g., fuel crisis); natural (e.g., fire and earth quakes); and social (e.g., terroristattacks and strikes). Others argue natural disasters, terrorist attacks, labor strikes and accidents candisrupt the supply chain [57–62]. Such disruptions halt operations; furthermore, without precautionsand preparation, much time is required for the affected system to recover [63,64]. Expanding thestudy of supply chain risk, we argue that such risk determines supply chain vulnerability, defined as“an exposure to disturbances stemming out of supply chain risks and impacting the supply chain abilityto effectively serve the end customer market” [65]. To be sustainable, these risks must be predictedand averted. On the other hand, Choi et al. [66] asserts big data is a powerful tool that can be usedeffectively to solve problems related to operational and supply chain risk. Others acknowledge thesimilar need for big data applications in risk and operation management in industrial applications [67].
Rising use of the Internet and of traditional enterprise resource planning ERP systems hashelped companies share real- time information to reduce transaction time, information inaccuracy,and redundancy [58,68–70]. However, because of network complexity, consumers’ variety seeking,and supply chain efficiency, predicting and managing such risks in real time are difficult. However,BDA can be used not only to predict and avert the risks but also to build innovative resources, whichcan provide strategic advantage and sustainability.
2.4. Theoretical Background
Innovation across the value chain is a central element of business model and such innovationfosters long-term sustainability for profit, survival, and dynamic fit with the changing environment [21].We refer to a knowledge-based view (NBV) to suggest a schematic outline of how and wherebig data analytics can facilitate resource innovation for sustainability. Sustainability refers toaddressing an enterprise’s social, environmental, and financial needs. Alternatively, it may alsorefer to long-term survival and fit with the environment. Firms constantly need to innovatetheir resources to better fit with the business environment and to get the strategic advantage.The knowledge-based view (KBV) can be traced back to Simon’s [16] research, which was laterextended by Grant [17,18], Levitt and March [20], and Huber [19]. According to KBV, “knowledge isan important resource of the firm. Knowledge management is the inimitable process that facilitatesknowledge based strategy for competitive advantage” [17]. Therefore, knowledge management refersto how organizations accumulate, absorb and apply knowledge based on prior experiences to decidefuture actions [17,20,71,72]. We build upon the knowledge-management perspective to further describebig data as a knowledge driver for the spectrum of sustainability innovations in the supply chain.
Sustainability 2017, 9, 608 5 of 21
The knowledge-management perspective also drives innovations in sourcing, transportation, materialuse, design, and manufacturing. KBV also indicates the longer-term perspectives of expanding existingresources (e.g., speed, efficiency, methodology, material usage, and firm capabilities), which can changethe way a firm works. Building upon KBV, we explore big data innovations in the supply chain tobuild the knowledge base for sustainability.
3. Methodology
We adopted an exploratory approach because the research revolves around supply chain issuesthat create risk and subsequently lead to disruptions. Qualitative research methods are appropriatefor research exploring new methods, process, and functioning because it addresses the “how” partof the research phenomenon [73]. Case studies are useful for preliminary, exploratory stages ofresearch that investigates contemporary phenomenon with its real life context, especially when theboundaries between phenomenon and context are not clearly evident [74]. According to Yin [73], “casestudies are the preferred strategy when how or why questions are being posed and when the focus ison a contemporary phenomenon within some real-life context”. However, he also emphasizes thatinvestigators must be careful when designing and conducting case studies to overcome traditionalcriticism [73]. To overcome such criticisms, our case study research design follows valid protocolsas suggested by Yin [73], including study questions, identification of study population, unit of dataanalysis, and what must be done after data collection. Others suggest that the investigator mustunderstand whether the case study’s purpose is to develop or to test the theory in the design phase [75].In this study, we use a knowledge-based perspective to view how big data integration in the supplychain might predict social issues.
We used two procedures to identify potential risks. First, a panel discussion on “challenges andopportunities to supply chain of Indian manufacturing” was conducted in December of 2014. The panelmembers included three prominent academicians with over three decades’ experience teaching supplychain management in premier business schools and six senior executives from industries. The seniorexecutives were selected based on their previous experience and current role in logistics sector inIndian industry. The executives were either chief executive officers (CEOs) or senior vice presidents oflogistics companies in India. These discussions were videotaped and later transcribed for analysis.
The panel discussions’ outcomes suggest various potential issues plaguing supply chain.These issues were later validated by 54 supply chain managers through a survey conducted betweenJanuary and March of 2015 in India. The managers were asked to rate the relevance of the issuespotentially disrupting the supply chain on a five-point Likert scale with 1 being “not at all relevant”and 5 being “highly relevant”. Based on the managers’ opinions and ratings, all the issues are rankedas listed in Table 1. The reliability test using Cronbach’s Alpha was calculated to ascertain internalconsistency. The Alpha value was 0.757. The descriptive statistics of mean and standard deviation forall the issues are presented in Table 1. Based on their mean values, issues are ranked. All the issues inTable 2 indicate significant correlations. The methodology is depicted in Figure 1. The second part ofour study involves a case study as described in the preceding section.
Case studies are conducted to demonstrate decisions, programs, implementation process,and organizational change. We used obtrusive and unobtrusive methods for data collection thatinclude interviews, memoranda, business plans, organizational charts, observations, physical artifacts,employee actions and interactions etc. The goal is to understand fully to an extent possible thephenomenon being studied through what is called “perceptual triangulation” [76]. This processensures multiple sources of evidences to assure that facts being collected are indeed correct. Singlecase studies are appropriate when the case is unique for some reason in relation to established theory.The choice of single case arises when the case provides critical details to well-established theory orwhere the case is unique, extreme or has something special to reveal [77]. For instance, Feagin et al. [78]and Drucker [79] wrote classic single-case studies to elucidate theories. Yin [80] asserts that throughcase study research, analytical generalizations, which are on par with statistical generalizations, can be

Sustainability 2017, 9, 608 6 of 21
made [80]. The case study’s validity can be judged based on the robust design the investigatoradopts. For example, to fulfill the construct validity, multiple sources of evidence and key informantinterviews are required; for internal validity, pattern matching and explanation building is needed;and for reliability, a case study protocol is necessary [81,82]. We adopted a single-case study design todemonstrate how big data innovation in the supply chain can mitigate social issues. Many scholarsbelieve that a single-case study design is appropriate when an investigator can observe and analyzephenomena previously inaccessible for scientific investigation [83]. We used Surat Milk Union Limited(SUMUL), Gujarat, India as a case study to demonstrate integrating big data analytics into the supplychain can mitigate a social risk.
Table 1. Supply chain social issues and their ranking.
Serial. No. Logistical Issues that Cause Disruptions Mean Ranking Standard Deviation
1 Workforce safety 4.29 1 0.757
2 Monitoring fuel-consumption (looking forexcessive fuel consumption) 3.98 2 1.033
3 Theft of vehicles and goods 3.96 3 1.167
4 Tracking workforce health and drinking and driving 3.89 4 1.112
5 Controlling fuel cost (fuel economy) 3.84 5 1.167
6 Route optimization (time, route, energy, go green) 3.73 6 1.321
7 Proof of delivery 3.64 7 1.228
8 Unethical workforce activities (fuel adulteration,goods theft, information sharing) 3.62 8 1.248
9 Workforce security (robbery, communal clash) 3.62 9 1.072
10 Traffic violations (parking in no parking areas,signal jumping, abandoning vehicles) 3.60 10 1.214
11Unscrupulous workforce behavior (loadingunwanted and restricted material, vehiclemovements in restricted areas, door open)
3.60 11 1.268
12 Natural calamities (floods, earthquakes,riots, agitations, fire) 3.49 12 1.456
13 Overspeeding 3.29 13 1.359
Sustainability 2016, 8, 608 6 of 21
building is needed; and for reliability, a case study protocol is necessary [81,82]. We adopted a single-case study design to demonstrate how big data innovation in the supply chain can mitigate social issues. Many scholars believe that a single-case study design is appropriate when an investigator can observe and analyze phenomena previously inaccessible for scientific investigation [83]. We used Surat Milk Union Limited (SUMUL), Gujarat, India as a case study to demonstrate integrating big data analytics into the supply chain can mitigate a social risk.
Table 1. Supply chain social issues and their ranking.
Serial. No. Logistical Issues that Cause Disruptions Mean Ranking Standard Deviation1 Workforce safety 4.29 1 0.757
2 Monitoring fuel-consumption (looking for excessive fuel consumption)
3.98 2 1.033
3 Theft of vehicles and goods 3.96 3 1.167
4 Tracking workforce health and drinking and driving
3.89 4 1.112
5 Controlling fuel cost (fuel economy) 3.84 5 1.167
6 Route optimization (time, route, energy, go green)
3.73 6 1.321
7 Proof of delivery 3.64 7 1.228
8 Unethical workforce activities (fuel adulteration, goods theft, information sharing)
3.62 8 1.248
9 Workforce security (robbery, communal clash) 3.62 9 1.072
10 Traffic violations (parking in no parking areas, signal jumping, abandoning vehicles)
3.60 10 1.214
11 Unscrupulous workforce behavior (loading unwanted and restricted material, vehicle movements in restricted areas, door open)
3.60 11 1.268
12 Natural calamities (floods, earthquakes, riots, agitations, fire)
3.49 12 1.456
13 Overspeeding 3.29 13 1.359
Figure 1. Steps involved in research methodology.
Figure 1. Steps involved in research methodology.

Sustainability 2017, 9, 608 7 of 21
Table 2. Correlation matrix among the sustainability issues.
Social issues 13 12 11 10 9 8 7 6 5 4 3 2 1
Traffic violations (parking in no parkingareas, signal jumping, abandoned vehicles) −0.157 0.047 −0.051 −0.189 −0.295 * 0.244 −0.189 −0.267 0.003 0.189 0.209 −0.237
Unethical acts by workforce (fueladulteration, goods theft,information sharing etc.)
0.054 −0.148 −0.145 0.073 0.489 ** −0.119 0.146 0.262 −0.230 −0.098 −0.296 *
Over-speeding thereby causinginjury and accidents −0.062 −0.044 0.172 0.404 ** −0.412 ** 0.115 0.077 −0.061 0.023 0.280
Unscrupulous workforce behavior(loading unwanted and restricted material,vehicle movements in restricted areas)
−0.002 0.028 0.274 0.009 −0.011 0.049 0.053 0.005 0.018
Theft of vehicle and goods −0.054 0.244 0.346 * 0.052 0.036 0.162 −0.032 0.092
Workforce safety 0.384 ** −0.050 0.309 * 0.382 ** 0.101 0.078 −0.086
Workforce security(robbery, communal clash) −0.141 −0.151 −0.036 −0.035 0.264 −0.302 *
Controlling fuel cost (fuel economy) 0.367 * −0.229 −0.066 −0.151 −0.160
Route optimization −0.025 0.029 −0.113 −0.256
Proof of goods delivery 0.188 −0.042 0.370 *
Workforce health and tracking(workforce health, drunk and driving) 0.104 0.077
Fuel consumption monitoring(excessive fuel consumptions) −0.098
Natural calamities such as flood,earthquake, riots, agitations, fire etc.
*, ** shows the degree of correlation between issues.

Sustainability 2017, 9, 608 8 of 21
3.1. Data Collection
The data were collected through interviews with chief executives; supply chain managers;operations managers; senior logistics executives; and other stakeholders including drivers andemployees. We visited SUMUL during September and October of 2015 multiple times fordata collection and observations. Data was also collected from company manuals, periodicals,and a knowledge-management system. The data set was corroborated with the statistical foot printsthat Maruti 3PL Logistics Private Ltd, Gujarat, India obtained through its “Fleeton” servers. Scholarssuggest that process mapping, interviewing, and quantitative data analysis bring new insights tothe case method [84,85]. Furthermore, to ensure the data’s reliability, a valid protocol was used tointerview members from both 3PL Logistics and SUMUL as recommended by Yin [73]. Additionallywe used process mapping and explanation building procedures to describe the case study [82].
The following section explains the reason for choosing SUMUL, integration of the Internet ofthings (IOT), and the big data systems developed. Also discussed is the way social issues are predicted,monitored and mitigated in the supply chain.
3.2. Indian Logistical Industry
The Indian logistical industry is estimated to grow rapidly because of favorable infrastructurepolicies that include “make in India”, a national integrated logistics policy, and 100% direct investmentin foreign warehouses and store facilities. Some of these initiatives have led to logistics companies’significant improvement, as is reflected in India’s logistics performance index (LPI) rank moving fromthe 54th to the 35th position [86]. Furthermore, regarding India’s gross domestic product (GDP) growth,the logistical industry is projected to grow 15–20% during 2016–2017 [87]. The Indian logistic industryconsists of four sectors: transportation, warehousing, freight forwarding, and value-added services.Transportation represents 60% of this industry. Logistics chains in Indian firms are either owned bythe firm or outsourced to third-party logistics providers. In the event of outsourcing, the companyis responsible for its logistic providers’ actions because of business interest and corporate image.However, serious social issues are plaguing Indian logistics that not only disrupt the supply chainbut also degrade the environment. These issues include workforce safety, excessive fuel consumption,vehicle theft, workforce health, fuel economy, workforce’s unethical behavior, workforce security,traffic violations, and natural calamities.
Practitioners recognize the importance of predicting, monitoring and mitigating such issues.However, to our knowledge, no innovative, integrated approach to solve this menace has beenpresented. In our illustrative case, we clarify how integrating knowledge-based big data into thesupply chain helps mitigate social and environmental risks.
3.3. Big Data Integration and SUMUL
A co-operative milk-processing organization, Surat Milk Union Limited (SUMUL) is a member ofthe Gujarat Cooperative Milk and Marketing Federation (GCMMF), which is the largest milk processingand marketing organization in India under the brand name AMUL. The GCMMF’s products includemilk, butter, varieties of sweets, flavored milk, ice cream, chocolates, and packaged ready-to-eat food.SUMUL established a three-tier supply chain system that includes village-level co-operatives thatprocure milk from farmers, block-level co-operatives, and district-level processing centers. Since milkis a perishable product, SUMUL has also established 489 bulk collection units (BCUs) and chillingcenters. BCUs are spread across four states: South Gujarat, Mid-Gujarat, North West Maharashtra andGoa. SUMUL operates thousands of vehicles to support its inbound and outbound logistics. The stagesof milk supply chain activities are identified in Figure 2.
SUMUL is an interesting example of how complex supply chains are operated, social issues areaddressed, and an environmentally friendly supply chain can be built. As milk’s shelf life is short,operating all the vehicles on time is imperative. Monitoring vehicles and the workforce is also key for

Sustainability 2017, 9, 608 9 of 21
successful operations because milk theft en route is common. Other challenges include route planningand management, BCU allocations, and unscheduled stoppages. In addition, real-time tracking of dooroperations is necessary because of pilferage/theft with the workforce’s help. Furthermore, if a driverdeviates from the assigned route, the dairy’s production cycle is affected, thus disturbing the milk supply.
Sustainability 2016, 8, 608 9 of 21
Figure 2. Surat Milk Union Limited (SUMUL) Supply chain activities.
SUMUL is an interesting example of how complex supply chains are operated, social issues are addressed, and an environmentally friendly supply chain can be built. As milk’s shelf life is short, operating all the vehicles on time is imperative. Monitoring vehicles and the workforce is also key for successful operations because milk theft en route is common. Other challenges include route planning and management, BCU allocations, and unscheduled stoppages. In addition, real-time tracking of door operations is necessary because of pilferage/theft with the workforce’s help. Furthermore, if a driver deviates from the assigned route, the dairy’s production cycle is affected, thus disturbing the milk supply.
Unethical practices among the workforce include fuel adulteration, impacting environment and efficiency; communal clashes, putting people and the system at risk; gross traffic violations; changes in specified routes; and entering restricted areas. These unethical behaviors in turn lead to law enforcement authorities’ seizing vehicles, causing operational delays. Other unscrupulous behavior includes loading prohibited materials, sharing information with competitors, and keeping vehicle doors open while driving. These behaviors potentially risk people’s health and safety and can potentially halt operations. Other threatening issues include communal clashes, riots, and protests. In fact, SUMUL’s president said, “It was evident when there was communal clash and agitation during 2015, when the major community took on to streets vandalizing public properties, many of our vehicles were abandoned, our workforce and vehicles were at risk”. Thus, tracing both vehicles and workforce behavior is important.
In outbound logistics, timely delivery is important as the company has a short cycle time because of the products’ short shelf life. Since the vehicles traverse four states, workforce safety and security is very important. Any deviation in the route may signal risk and disruption. For instance, if a vehicle travels the shortest route identified by the company, less energy is consumed and the environmental impact is reduced. Robbery en route to a destination is another issue that puts the system at risk. According to one driver, “Many of us drive the vehicles over 24 h and in hilly areas, during night vehicles are stopped and robbed. Few months back, to escape the robbery attempt, I jumped from the vehicle and ran away from the scene”.
These issues have challenged SUMUL operations over three decades. Thus, the entire supply chain was at risk and disturbed. In turn, business and survival were affected. Because of SUMUL’s large-scale operations and the involvement of over 1000 vehicles and people, tracking big volumes of data and identifying issues in advance has been challenging. Furthermore, SUMUL has consistently invested in innovative solutions for business processes and believes that innovation efforts can lead to a sustainable competitive advantage and an unmatched leadership position in the market. To address social and environmental issues in the supply chain, SUMUL has integrated big
Figure 2. Surat Milk Union Limited (SUMUL) Supply chain activities.
Unethical practices among the workforce include fuel adulteration, impacting environment andefficiency; communal clashes, putting people and the system at risk; gross traffic violations; changes inspecified routes; and entering restricted areas. These unethical behaviors in turn lead to law enforcementauthorities’ seizing vehicles, causing operational delays. Other unscrupulous behavior includes loadingprohibited materials, sharing information with competitors, and keeping vehicle doors open whiledriving. These behaviors potentially risk people’s health and safety and can potentially halt operations.Other threatening issues include communal clashes, riots, and protests. In fact, SUMUL’s president said,“It was evident when there was communal clash and agitation during 2015, when the major communitytook on to streets vandalizing public properties, many of our vehicles were abandoned, our workforceand vehicles were at risk”. Thus, tracing both vehicles and workforce behavior is important.
In outbound logistics, timely delivery is important as the company has a short cycle time becauseof the products’ short shelf life. Since the vehicles traverse four states, workforce safety and security isvery important. Any deviation in the route may signal risk and disruption. For instance, if a vehicletravels the shortest route identified by the company, less energy is consumed and the environmentalimpact is reduced. Robbery en route to a destination is another issue that puts the system at risk.According to one driver, “Many of us drive the vehicles over 24 h and in hilly areas, during nightvehicles are stopped and robbed. Few months back, to escape the robbery attempt, I jumped from thevehicle and ran away from the scene”.
These issues have challenged SUMUL operations over three decades. Thus, the entire supplychain was at risk and disturbed. In turn, business and survival were affected. Because of SUMUL’slarge-scale operations and the involvement of over 1000 vehicles and people, tracking big volumes ofdata and identifying issues in advance has been challenging. Furthermore, SUMUL has consistentlyinvested in innovative solutions for business processes and believes that innovation efforts can lead toa sustainable competitive advantage and an unmatched leadership position in the market. To addresssocial and environmental issues in the supply chain, SUMUL has integrated big data analytics, the firstof its kind in India, into its supply chain in association with Maruti 3PL Logistics Private Ltd., a serviceprovider. In the following section, we discuss the big data analytics system and its role in identifyingand mitigating issues causing disruption.
4. Results and Analysis
SUMUL has installed an online fleet-management and vehicle-tracking software system (Fleeton).Additionally, an Internet of things (IOT) device is mounted on all vehicles. An IOT device consists of

Sustainability 2017, 9, 608 10 of 21
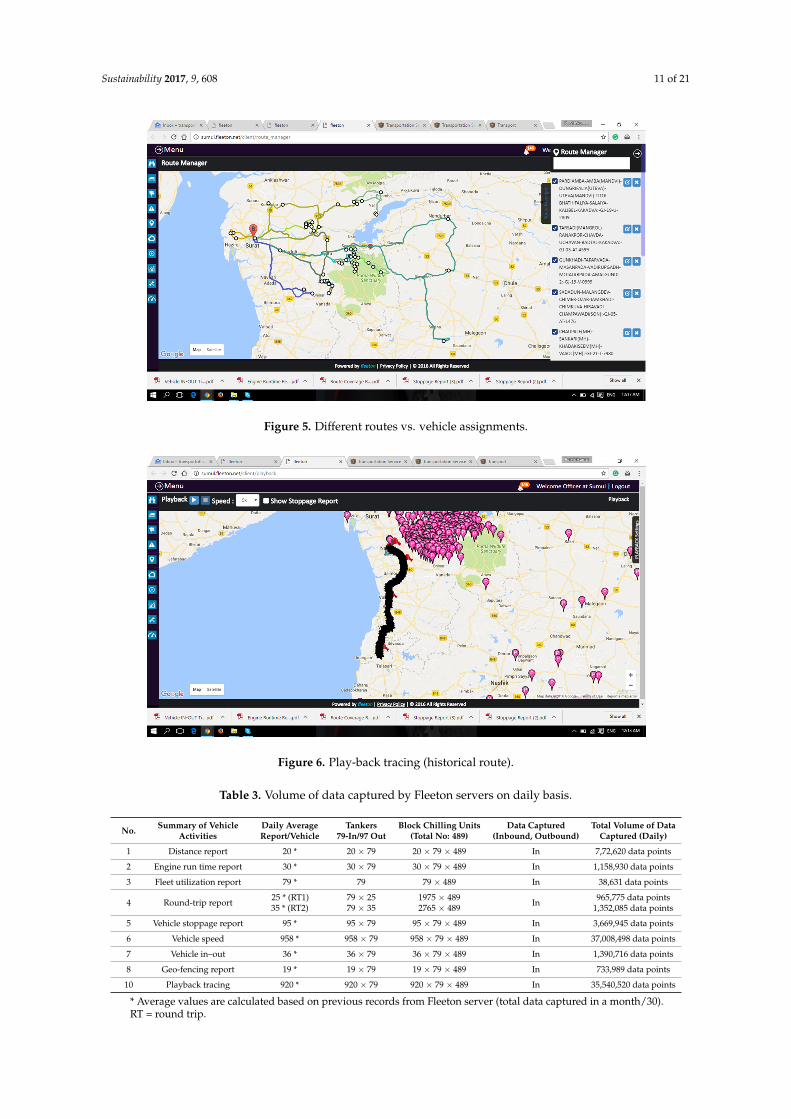
sensors (e.g., GPS, accelerometer, digital voltage sensor (1 or 0), and analog sensor). This device has anintegrative on-board GSM module, which runs a continued TCP/IP connection with the centralizedserver, enabling the system to track vehicle data. In addition, all the block chilling units (BCUs)are marked on the Google Map’s licensed engine that is integrated into Fleeton servers. Fleetonregularly records millions of data points and tracks alarm situations such as reckless driving, speeding,doors open at unscheduled locations, non-BCU stoppage location, geo-fence entry/exit (governmentrestricted or prohibited areas), and route deviation. Mr. Patel, chief executive of Maruti 3PL Private Ltd.,reported that Fleeton is a patented integrative logistic solution that not only predicts the risk anddisruptions in the supply chain but also assists in mitigating through large volumes of data guided byseasoned professionals.
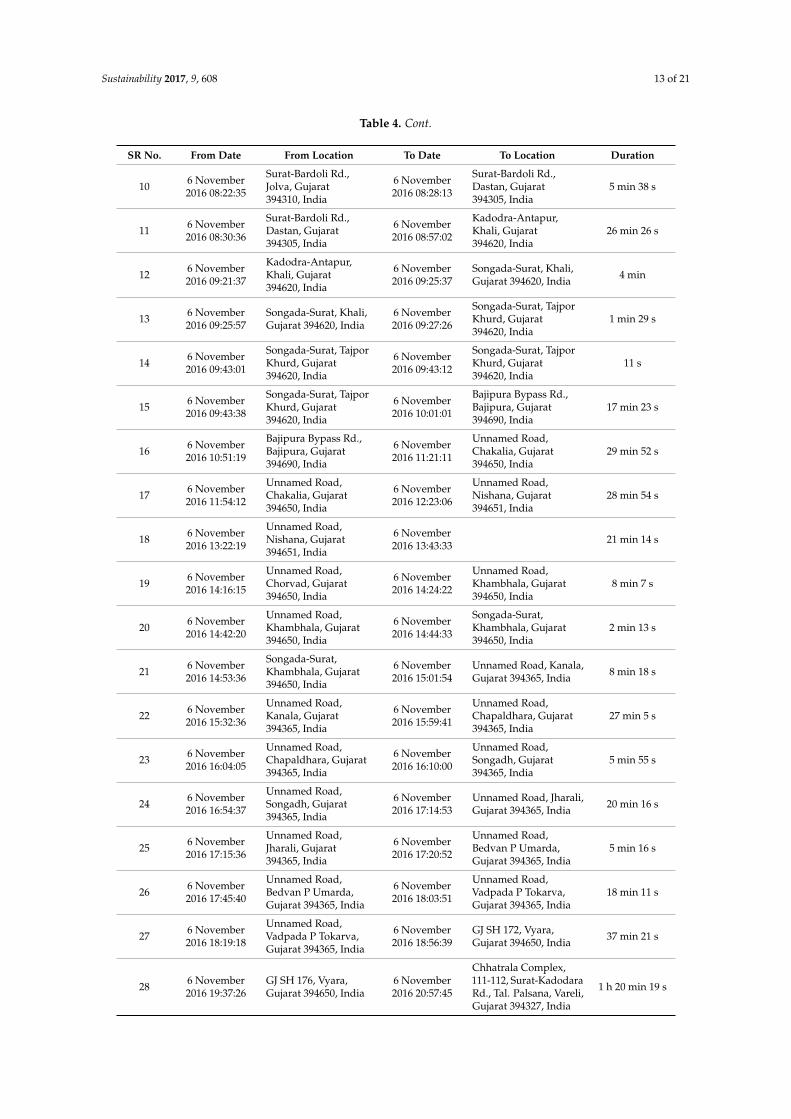
The Fleeton system is pre-loaded with the data that can be seen through Fleeton screen shotsof BCU’s locations (Figure 3), geo-fences (Figure 4), and routes with vehicle assignments (Figure 5).The system records in real time the behavior of vehicles and people involved in logistics. The Fleetonsystem is also connected with the supply chain managers’ cell phones, thus enabling managers to havereal-time information on supply chain activities. As the managers or decision makers are updatedwith this information, they can predict risks and mitigate such risks. Figure 6 shows the distancevehicles cover on a particular day. Distance data for a 30-day period runs into a few million data points(Table 3), providing managers a realistic of vehicle use and its environmental impact.
Sustainability 2016, 8, 608 11 of 21
Figure 3. Block chilling units marked in Fleeton.
Figure 4. Geo-fence markings in Fleeton.
Figure 5. Different routes vs. vehicle assignments.
Figure 3. Block chilling units marked in Fleeton.
Sustainability 2016, 8, 608 11 of 21
Figure 3. Block chilling units marked in Fleeton.
Figure 4. Geo-fence markings in Fleeton.
Figure 5. Different routes vs. vehicle assignments.
Figure 4. Geo-fence markings in Fleeton.
Sustainability 2017, 9, 608 11 of 21
Sustainability 2016, 8, 608 11 of 21
Figure 3. Block chilling units marked in Fleeton.
Figure 4. Geo-fence markings in Fleeton.
Figure 5. Different routes vs. vehicle assignments.
Figure 5. Different routes vs. vehicle assignments.Sustainability 2016, 8, 608 12 of 21
Figure 6. Play-back tracing (historical route).
Table 4 shows frequency of engine run-time, stoppages and intervals, and associated places. These data help track the vehicle and the driver’s actions, and ensure vehicle and personal safety. Based on this information, managers can obtain in-depth views of workforce safety, which can help them to avert these issues. Figure 7 shows the round-trip report, which reveals how much time the vehicle has taken for each round trip; in turn, managers can identify thefts, unnecessary stoppages, and delays. Table 5 is the fleet-utilization report, which reflects underutilization or overutilization. Using the underutilized fleet and optimizing resources help reduce the carbon footprint. Figure 8 and Table 6 plot vehicle speed and show the percentage of times vehicles exceeded the average speed. Data related to vehicle speed helps managers to track speed violations, thus helping to avoid potential damage to other people and society at large. Table 7 reports vehicle stoppages, indicating the time taken at each stage and unwanted stoppages, to identify theft and unethical behavior. Because the data is in real time, many issues such as speeding (reckless driving), accidents, traffic violations and penalties can be prevented. In addition, fuel efficiency can be increased and the environmental impact decreased. Through geo-fencing, vehicles’ entry into prohibited areas can be predicted and mitigated, thus preventing unwanted vehicle seizure by law-enforcement authorities that leads to time delays and disruptions. Furthermore, this statistical information helps in identifying drivers’ violations and tracks them in the supply chain. By adopting big data analytics in logistics and supply chain management, SUMUL can predict and mitigate supply chain issues that cause disruptions leading to risk.
Table 4. Engines’ run-time report of vehicle GJ-19-U-2909 (Milk Tanker 2909).
SR No.
From Date From Location To Date To Location Duration
1 6 November 2016
00:20:06
Mahuva-Anawal Rd., Tarkani, Gujarat 394248, India
6 November 2016 00:42:50
Mahuva-Anawal Rd., Bamaniya, Gujarat 394246, India
22 min 44 s
2 6 November 2016
00:58:10
Mahuva-Anawal Rd., Bamaniya, Gujarat 394246, India
6 November 2016 01:04:07
SH 180, Vadi Faliya, Gujarat 394246, India
5 min 57 s
3 6 November 2016
02:12:18 SH 180, Gunasvel, Gujarat 394246, India
6 November 2016 02:20:09
SH 180, Kumbhar Faliya, Gujarat 394245, India
7 min 51 s
4 6 November 2016
03:24:30
SH 180, Kumbhar Faliya, Gujarat 394245, India
6 November 2016 04:28:04
Thakorji Complex, 121, Surat-Kadodara Rd.,
1 h 3 min 34 s
Figure 6. Play-back tracing (historical route).
Table 3. Volume of data captured by Fleeton servers on daily basis.
No. Summary of VehicleActivities
Daily AverageReport/Vehicle
Tankers79-In/97 Out
Block Chilling Units(Total No: 489)
Data Captured(Inbound, Outbound)
Total Volume of DataCaptured (Daily)
1 Distance report 20 * 20 × 79 20 × 79 × 489 In 7,72,620 data points
2 Engine run time report 30 * 30 × 79 30 × 79 × 489 In 1,158,930 data points
3 Fleet utilization report 79 * 79 79 × 489 In 38,631 data points
4 Round-trip report 25 * (RT1)35 * (RT2)
79 × 2579 × 35
1975 × 4892765 × 489 In 965,775 data points
1,352,085 data points
5 Vehicle stoppage report 95 * 95 × 79 95 × 79 × 489 In 3,669,945 data points
6 Vehicle speed 958 * 958 × 79 958 × 79 × 489 In 37,008,498 data points
7 Vehicle in–out 36 * 36 × 79 36 × 79 × 489 In 1,390,716 data points
8 Geo-fencing report 19 * 19 × 79 19 × 79 × 489 In 733,989 data points
10 Playback tracing 920 * 920 × 79 920 × 79 × 489 In 35,540,520 data points
* Average values are calculated based on previous records from Fleeton server (total data captured in a month/30).RT = round trip.

Sustainability 2017, 9, 608 12 of 21
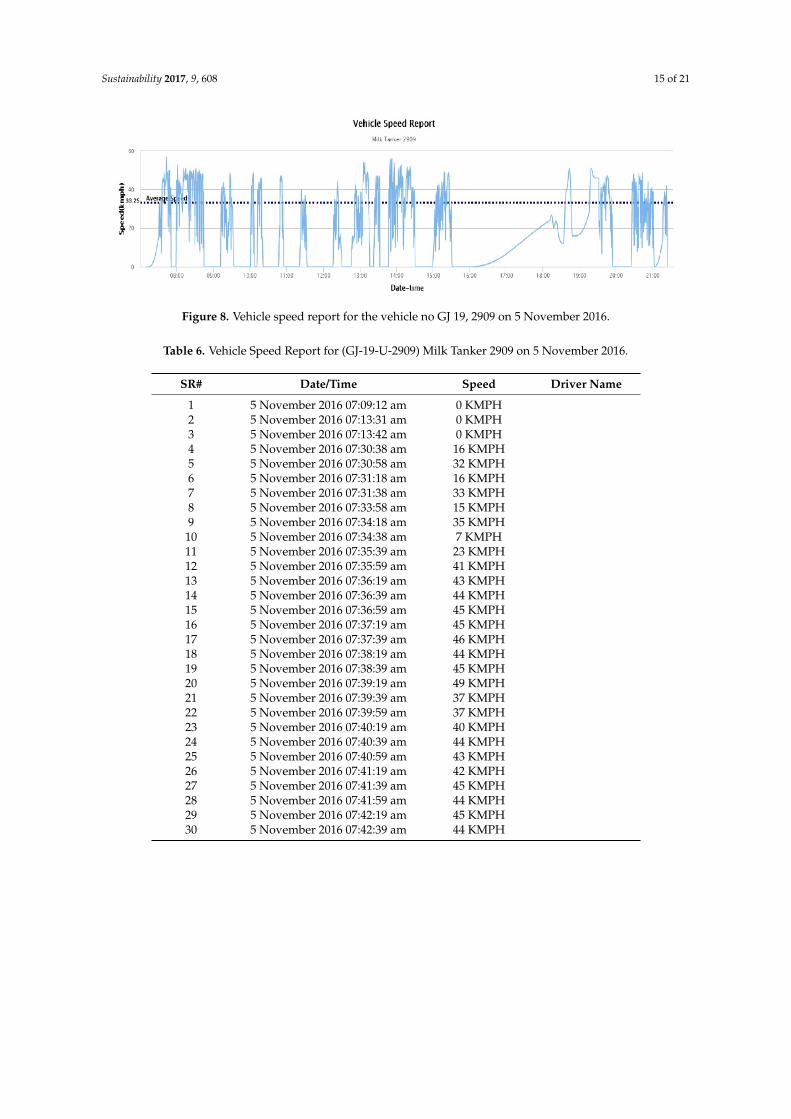
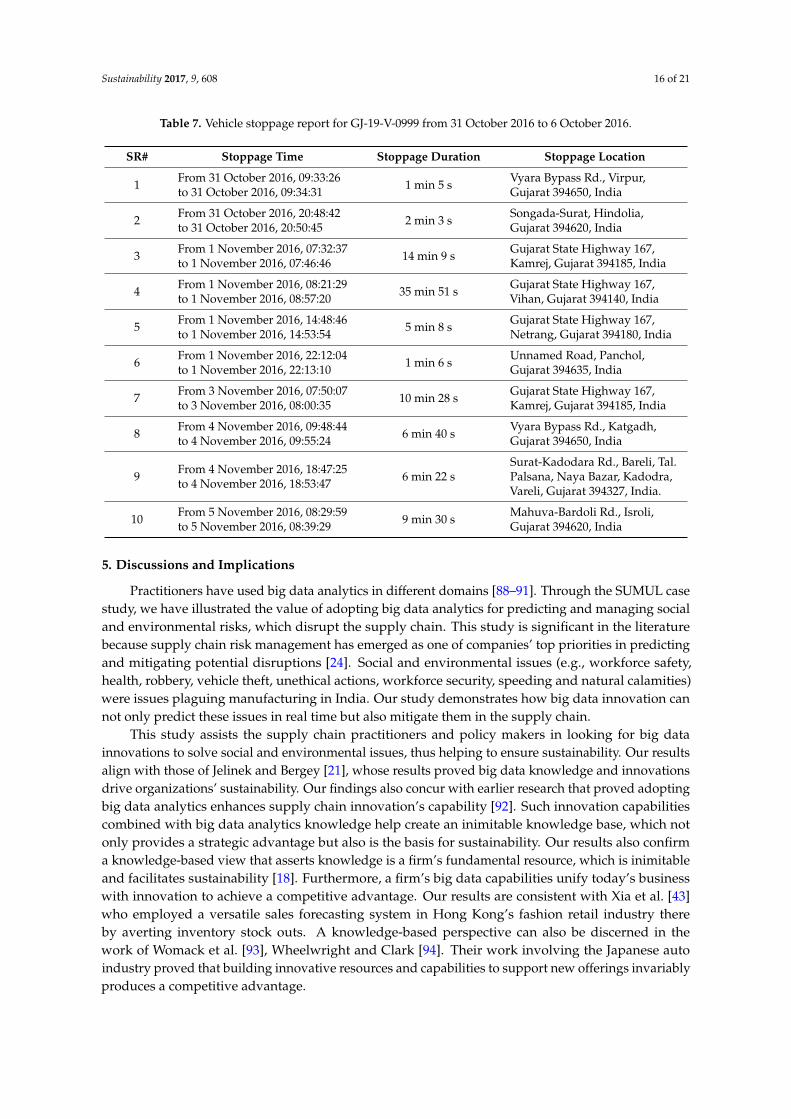
Table 4 shows frequency of engine run-time, stoppages and intervals, and associated places.These data help track the vehicle and the driver’s actions, and ensure vehicle and personal safety.Based on this information, managers can obtain in-depth views of workforce safety, which can helpthem to avert these issues. Figure 7 shows the round-trip report, which reveals how much time thevehicle has taken for each round trip; in turn, managers can identify thefts, unnecessary stoppages,and delays. Table 5 is the fleet-utilization report, which reflects underutilization or overutilization.Using the underutilized fleet and optimizing resources help reduce the carbon footprint. Figure 8and Table 6 plot vehicle speed and show the percentage of times vehicles exceeded the average speed.Data related to vehicle speed helps managers to track speed violations, thus helping to avoid potentialdamage to other people and society at large. Table 7 reports vehicle stoppages, indicating the timetaken at each stage and unwanted stoppages, to identify theft and unethical behavior. Because thedata is in real time, many issues such as speeding (reckless driving), accidents, traffic violations andpenalties can be prevented. In addition, fuel efficiency can be increased and the environmental impactdecreased. Through geo-fencing, vehicles’ entry into prohibited areas can be predicted and mitigated,thus preventing unwanted vehicle seizure by law-enforcement authorities that leads to time delays anddisruptions. Furthermore, this statistical information helps in identifying drivers’ violations and tracksthem in the supply chain. By adopting big data analytics in logistics and supply chain management,SUMUL can predict and mitigate supply chain issues that cause disruptions leading to risk.
Table 4. Engines’ run-time report of vehicle GJ-19-U-2909 (Milk Tanker 2909).
SR No. From Date From Location To Date To Location Duration
1 6 November2016 00:20:06
Mahuva-Anawal Rd.,Tarkani, Gujarat394248, India
6 November2016 00:42:50
Mahuva-Anawal Rd.,Bamaniya, Gujarat394246, India
22 min 44 s
2 6 November2016 00:58:10
Mahuva-Anawal Rd.,Bamaniya, Gujarat394246, India
6 November2016 01:04:07
SH 180, Vadi Faliya,Gujarat 394246, India 5 min 57 s
3 6 November2016 02:12:18
SH 180, Gunasvel,Gujarat 394246, India
6 November2016 02:20:09
SH 180, Kumbhar Faliya,Gujarat 394245, India 7 min 51 s
4 6 November2016 03:24:30
SH 180, KumbharFaliya, Gujarat394245, India
6 November2016 04:28:04
Thakorji Complex, 121,Surat-Kadodara Rd.,Kadodra, Kadodara,Gujarat 394325, India
1 h 3 min 34 s
5 6 November2016 05:13:38
61, Surat-Kadodara Rd.,Kadodara, Gujarat394327, India
6 November2016 05:38:17
JayPrakash NarayanMarg, Sahara Darwaja,Begampura, Surat,Gujarat 395003, India
24 min 39 s
6 6 November2016 05:45:21
Jay Prakash NarayanMarg, Sahara Darwaja,Begampura, Surat,Gujarat 395003, India
6 November2016 05:49:38
81, Sumul Dairy Rd.,Sardar Nagar Society,Sardar Nagar, PatelNagar, Surat, Gujarat395008, India
4 min 17 s
7 6 November2016 05:56:55
81, Sumul Dairy Rd.,Sardar Nagar Society,Sardar Nagar, PatelNagar, Surat, Gujarat395008, India
6 November2016 05:59:10
3, Sumul Dairy Rd.,Sahyog Society, AlkapuriSociety, Patel Nagar,Surat, Gujarat 395008,India
2 min 15 s
8 6 November2016 06:12:14
3, Sumul Dairy Rd.,Sahyog Society,Alkapuri Society, PatelNagar, Surat, Gujarat395008, India
6 November2016 07:28:33
3, Sumul Dairy Rd.,Sahyog Society, AlkapuriSociety, Patel Nagar,Surat, Gujarat395008, India
1 h 16 min 19 s
9 6 November2016 07:47:48
3, Sumul Dairy Rd.,Sahyog Society,Alkapuri Society, PatelNagar, Surat, Gujarat395008, India
6 November2016 08:20:00
Surat-Bardoli Rd., Jolva,Gujarat 394310, India 32 min 12 s
Sustainability 2017, 9, 608 13 of 21
Table 4. Cont.
SR No. From Date From Location To Date To Location Duration
10 6 November2016 08:22:35
Surat-Bardoli Rd.,Jolva, Gujarat394310, India
6 November2016 08:28:13
Surat-Bardoli Rd.,Dastan, Gujarat394305, India
5 min 38 s
11 6 November2016 08:30:36
Surat-Bardoli Rd.,Dastan, Gujarat394305, India
6 November2016 08:57:02
Kadodra-Antapur,Khali, Gujarat394620, India
26 min 26 s
12 6 November2016 09:21:37
Kadodra-Antapur,Khali, Gujarat394620, India
6 November2016 09:25:37
Songada-Surat, Khali,Gujarat 394620, India 4 min
13 6 November2016 09:25:57
Songada-Surat, Khali,Gujarat 394620, India
6 November2016 09:27:26
Songada-Surat, TajporKhurd, Gujarat394620, India
1 min 29 s
14 6 November2016 09:43:01
Songada-Surat, TajporKhurd, Gujarat394620, India
6 November2016 09:43:12
Songada-Surat, TajporKhurd, Gujarat394620, India
11 s
15 6 November2016 09:43:38
Songada-Surat, TajporKhurd, Gujarat394620, India
6 November2016 10:01:01
Bajipura Bypass Rd.,Bajipura, Gujarat394690, India
17 min 23 s
16 6 November2016 10:51:19
Bajipura Bypass Rd.,Bajipura, Gujarat394690, India
6 November2016 11:21:11
Unnamed Road,Chakalia, Gujarat394650, India
29 min 52 s
17 6 November2016 11:54:12
Unnamed Road,Chakalia, Gujarat394650, India
6 November2016 12:23:06
Unnamed Road,Nishana, Gujarat394651, India
28 min 54 s
18 6 November2016 13:22:19
Unnamed Road,Nishana, Gujarat394651, India
6 November2016 13:43:33 21 min 14 s
19 6 November2016 14:16:15
Unnamed Road,Chorvad, Gujarat394650, India
6 November2016 14:24:22
Unnamed Road,Khambhala, Gujarat394650, India
8 min 7 s
20 6 November2016 14:42:20
Unnamed Road,Khambhala, Gujarat394650, India
6 November2016 14:44:33
Songada-Surat,Khambhala, Gujarat394650, India
2 min 13 s
21 6 November2016 14:53:36
Songada-Surat,Khambhala, Gujarat394650, India
6 November2016 15:01:54
Unnamed Road, Kanala,Gujarat 394365, India 8 min 18 s
22 6 November2016 15:32:36
Unnamed Road,Kanala, Gujarat394365, India
6 November2016 15:59:41
Unnamed Road,Chapaldhara, Gujarat394365, India
27 min 5 s
23 6 November2016 16:04:05
Unnamed Road,Chapaldhara, Gujarat394365, India
6 November2016 16:10:00
Unnamed Road,Songadh, Gujarat394365, India
5 min 55 s
24 6 November2016 16:54:37
Unnamed Road,Songadh, Gujarat394365, India
6 November2016 17:14:53
Unnamed Road, Jharali,Gujarat 394365, India 20 min 16 s
25 6 November2016 17:15:36
Unnamed Road,Jharali, Gujarat394365, India
6 November2016 17:20:52
Unnamed Road,Bedvan P Umarda,Gujarat 394365, India
5 min 16 s
26 6 November2016 17:45:40
Unnamed Road,Bedvan P Umarda,Gujarat 394365, India
6 November2016 18:03:51
Unnamed Road,Vadpada P Tokarva,Gujarat 394365, India
18 min 11 s
27 6 November2016 18:19:18
Unnamed Road,Vadpada P Tokarva,Gujarat 394365, India
6 November2016 18:56:39
GJ SH 172, Vyara,Gujarat 394650, India 37 min 21 s
28 6 November2016 19:37:26
GJ SH 176, Vyara,Gujarat 394650, India
6 November2016 20:57:45
Chhatrala Complex,111-112, Surat-KadodaraRd., Tal. Palsana, Vareli,Gujarat 394327, India
1 h 20 min 19 s

Sustainability 2017, 9, 608 14 of 21
Sustainability 2016, 8, 608 14 of 21
23 6 November 2016
16:04:05
Unnamed Road, Chapaldhara, Gujarat 394365, India
6 November 2016 16:10:00
Unnamed Road, Songadh, Gujarat 394365, India
5 min 55 s
24 6 November 2016
16:54:37
Unnamed Road, Songadh, Gujarat 394365, India
6 November 2016 17:14:53
Unnamed Road, Jharali, Gujarat 394365, India
20 min 16 s
25 6 November 2016
17:15:36
Unnamed Road, Jharali, Gujarat 394365, India
6 November 2016 17:20:52
Unnamed Road, Bedvan P Umarda, Gujarat 394365, India
5 min 16 s
26 6 November 2016
17:45:40
Unnamed Road, Bedvan P Umarda, Gujarat 394365, India
6 November 2016 18:03:51
Unnamed Road, Vadpada P Tokarva, Gujarat 394365, India
18 min 11 s
27 6 November 2016
18:19:18
Unnamed Road, Vadpada P Tokarva, Gujarat 394365, India
6 November 2016 18:56:39
GJ SH 172, Vyara, Gujarat 394650, India
37 min 21 s
28 6 November 2016
19:37:26 GJ SH 176, Vyara, Gujarat 394650, India
6 November 2016 20:57:45
Chhatrala Complex, 111-112, Surat-Kadodara Rd., Tal. Palsana, Vareli, Gujarat 394327, India
1 h 20 min 19 s
Figure 7. Round-trip report from Fleeton server indicating total distance vehicles traveled.
Figure 8. Vehicle speed report for the vehicle no GJ 19, 2909 on 5 November 2016.
Table 5. Fleet-utilization report for the period from 18 October 2016 to 27 October 2016.
SR# Vehicle Utilized (%) Unutilized (%) 1 GJ-19-U-2809 (Milk Tanker 2809) 31.74 68.26 2 GJ-05-AV-3499 (Milk Tanker 3499) 21.48 78.52 3 GJ-19-X-2709 (Milk Tanker 2709) 39.67 60.33 4 GJ-19-U-3809 (Milk Tanker 3809) 33.45 66.55 5 GJ-19-U-4909 (Milk Tanker 4909) 35.61 64.39 6 GJ-19-V-0999 (Milk Tanker 0999) 52.57 47.43
Figure 7. Round-trip report from Fleeton server indicating total distance vehicles traveled.
Table 5. Fleet-utilization report for the period from 18 October 2016 to 27 October 2016.
SR# Vehicle Utilized (%) Unutilized (%)
1 GJ-19-U-2809 (Milk Tanker 2809) 31.74 68.262 GJ-05-AV-3499 (Milk Tanker 3499) 21.48 78.523 GJ-19-X-2709 (Milk Tanker 2709) 39.67 60.334 GJ-19-U-3809 (Milk Tanker 3809) 33.45 66.555 GJ-19-U-4909 (Milk Tanker 4909) 35.61 64.396 GJ-19-V-0999 (Milk Tanker 0999) 52.57 47.437 GJ-05-BT-8008 (Milk Tanker 8008) 29.18 70.828 GJ-05-AU-5897 (Milk Tanker 5897) 40.47 59.539 GJ-19-V-4709 (Milk Tanker 4709) 39.35 60.65
10 GJ-19-T-3409 (Milk Tanker 3409) 33.02 66.9811 GJ-21-T-7737 (Milk Tanker 7737) 40.97 59.0312 GJ-19-V-3909 (Milk Tanker 3909) 35.49 64.5113 GJ-05-AT-2278 (Milk Tanker 2278) 32.37 67.6314 GJ-19-U-3609 (Milk Tanker 3609) 32.4 67.615 GJ-19-U-7609 (Milk Tanker 7609) 35.36 64.6416 GJ-21-V-9060 (Milk Tanker 9060) 41.31 58.6917 GJ-19-V-8181 (Milk Tanker 8181) 19.53 80.4718 GJ-05-AT-1098 (Milk Tanker 1098) 28.79 71.2119 GJ-19-T-3709 (Milk Tanker 3709) 36.45 63.5520 GJ-19-V-4809 (Milk Tanker 4809) 31.29 68.7121 GJ-19-V-4509 (Milk Tanker 4509) 35.89 64.1122 GJ-05-AZ-4201 (Milk Tanker 4201) 34.66 65.3423 GJ-19-V-4209 (Milk Tanker 4209) 40.2 59.824 GJ-19-X-2636 (Milk Tanker 2636) 22.29 77.7125 GJ-19-U-2909 (Milk Tanker 2909) 45.06 54.9426 GJ-19-U-7709 (Milk Tanker 7709) 36.64 63.3627 GJ-05-YY-7236 (Milk Tanker 7236) - -28 GJ-05-AT-1476 (Milk Tanker 1476) 34.38 65.6229 GJ-05-AT-4599 (Milk Tanker 4599) 38.18 61.8230 GJ-05-AZ-1818 (Milk Tanker 1818) 32.08 67.9231 GJ-05-AU-8868 (Milk Tanker 8868) 34.04 65.9632 GJ-19-T-9099 (Milk Tanker 9099) 39.61 60.3933 GJ-21-V-8970 (Milk Tanker 8970) 44.17 55.8334 GJ-19-T-3445 (Milk Tanker 3445) 32.89 67.1135 GJ-21-T-7980 (Milk Tanker 7980) 40.89 59.1136 GJ-21-V-5640 (Milk Tanker 5640) 38.75 61.2537 GJ-21-T-7773 (Milk Tanker 7773) 44.62 55.3838 GJ-19-T-3598 (Milk Tanker 3598) 83.47 16.5339 GJ-02-Z-9696 (Milk Tanker 9696) 39.77 60.2340 GJ-02-Z-881 (Milk Tanker 881) 30.23 69.7741 GJ-02-Z-1157 (Milk Tanker 1157) 39.41 60.5942 GJ-02-Z-8319 (Milk Tanker 8319) 44.68 55.3243 GJ-21-Z-9600 (Milk Tanker 9600) 31.36 68.6444 GJ-21-V-4560 (Milk Tanker 4560) 36.55 63.4545 GJ-21-V-9330 (Milk Tanker 9330) 41.07 58.9346 GJ-02-Z-9496 (Milk Tanker 9496) 20.23 79.7747 GJ-02-Z-4501 (Millk Tanker 4501) 24.98 75.0248 GJ-02-Z-851 (Milk Tanker 851) 26.33 73.6749 GJ-19-U-4109 (Milk Tanker 4109) 42.14 57.8650 GJ-05-BT-4509 (Milk Tanker 4509) 56.58 43.42
Sustainability 2017, 9, 608 15 of 21
Sustainability 2016, 8, 608 14 of 21
23 6 November 2016
16:04:05
Unnamed Road, Chapaldhara, Gujarat 394365, India
6 November 2016 16:10:00
Unnamed Road, Songadh, Gujarat 394365, India
5 min 55 s
24 6 November 2016
16:54:37
Unnamed Road, Songadh, Gujarat 394365, India
6 November 2016 17:14:53
Unnamed Road, Jharali, Gujarat 394365, India
20 min 16 s
25 6 November 2016
17:15:36
Unnamed Road, Jharali, Gujarat 394365, India
6 November 2016 17:20:52
Unnamed Road, Bedvan P Umarda, Gujarat 394365, India
5 min 16 s
26 6 November 2016
17:45:40
Unnamed Road, Bedvan P Umarda, Gujarat 394365, India
6 November 2016 18:03:51
Unnamed Road, Vadpada P Tokarva, Gujarat 394365, India
18 min 11 s
27 6 November 2016
18:19:18
Unnamed Road, Vadpada P Tokarva, Gujarat 394365, India
6 November 2016 18:56:39
GJ SH 172, Vyara, Gujarat 394650, India
37 min 21 s
28 6 November 2016
19:37:26 GJ SH 176, Vyara, Gujarat 394650, India
6 November 2016 20:57:45
Chhatrala Complex, 111-112, Surat-Kadodara Rd., Tal. Palsana, Vareli, Gujarat 394327, India
1 h 20 min 19 s
Figure 7. Round-trip report from Fleeton server indicating total distance vehicles traveled.
Figure 8. Vehicle speed report for the vehicle no GJ 19, 2909 on 5 November 2016.
Table 5. Fleet-utilization report for the period from 18 October 2016 to 27 October 2016.
SR# Vehicle Utilized (%) Unutilized (%) 1 GJ-19-U-2809 (Milk Tanker 2809) 31.74 68.26 2 GJ-05-AV-3499 (Milk Tanker 3499) 21.48 78.52 3 GJ-19-X-2709 (Milk Tanker 2709) 39.67 60.33 4 GJ-19-U-3809 (Milk Tanker 3809) 33.45 66.55 5 GJ-19-U-4909 (Milk Tanker 4909) 35.61 64.39 6 GJ-19-V-0999 (Milk Tanker 0999) 52.57 47.43
Figure 8. Vehicle speed report for the vehicle no GJ 19, 2909 on 5 November 2016.
Table 6. Vehicle Speed Report for (GJ-19-U-2909) Milk Tanker 2909 on 5 November 2016.
SR# Date/Time Speed Driver Name
1 5 November 2016 07:09:12 am 0 KMPH2 5 November 2016 07:13:31 am 0 KMPH3 5 November 2016 07:13:42 am 0 KMPH4 5 November 2016 07:30:38 am 16 KMPH5 5 November 2016 07:30:58 am 32 KMPH6 5 November 2016 07:31:18 am 16 KMPH7 5 November 2016 07:31:38 am 33 KMPH8 5 November 2016 07:33:58 am 15 KMPH9 5 November 2016 07:34:18 am 35 KMPH
10 5 November 2016 07:34:38 am 7 KMPH11 5 November 2016 07:35:39 am 23 KMPH12 5 November 2016 07:35:59 am 41 KMPH13 5 November 2016 07:36:19 am 43 KMPH14 5 November 2016 07:36:39 am 44 KMPH15 5 November 2016 07:36:59 am 45 KMPH16 5 November 2016 07:37:19 am 45 KMPH17 5 November 2016 07:37:39 am 46 KMPH18 5 November 2016 07:38:19 am 44 KMPH19 5 November 2016 07:38:39 am 45 KMPH20 5 November 2016 07:39:19 am 49 KMPH21 5 November 2016 07:39:39 am 37 KMPH22 5 November 2016 07:39:59 am 37 KMPH23 5 November 2016 07:40:19 am 40 KMPH24 5 November 2016 07:40:39 am 44 KMPH25 5 November 2016 07:40:59 am 43 KMPH26 5 November 2016 07:41:19 am 42 KMPH27 5 November 2016 07:41:39 am 45 KMPH28 5 November 2016 07:41:59 am 44 KMPH29 5 November 2016 07:42:19 am 45 KMPH30 5 November 2016 07:42:39 am 44 KMPH
Sustainability 2017, 9, 608 16 of 21
Table 7. Vehicle stoppage report for GJ-19-V-0999 from 31 October 2016 to 6 October 2016.
SR# Stoppage Time Stoppage Duration Stoppage Location
1 From 31 October 2016, 09:33:26to 31 October 2016, 09:34:31 1 min 5 s Vyara Bypass Rd., Virpur,
Gujarat 394650, India
2 From 31 October 2016, 20:48:42to 31 October 2016, 20:50:45 2 min 3 s Songada-Surat, Hindolia,
Gujarat 394620, India
3 From 1 November 2016, 07:32:37to 1 November 2016, 07:46:46 14 min 9 s Gujarat State Highway 167,
Kamrej, Gujarat 394185, India
4 From 1 November 2016, 08:21:29to 1 November 2016, 08:57:20 35 min 51 s Gujarat State Highway 167,
Vihan, Gujarat 394140, India
5 From 1 November 2016, 14:48:46to 1 November 2016, 14:53:54 5 min 8 s Gujarat State Highway 167,
Netrang, Gujarat 394180, India
6 From 1 November 2016, 22:12:04to 1 November 2016, 22:13:10 1 min 6 s Unnamed Road, Panchol,
Gujarat 394635, India
7 From 3 November 2016, 07:50:07to 3 November 2016, 08:00:35 10 min 28 s Gujarat State Highway 167,
Kamrej, Gujarat 394185, India
8 From 4 November 2016, 09:48:44to 4 November 2016, 09:55:24 6 min 40 s Vyara Bypass Rd., Katgadh,
Gujarat 394650, India
9 From 4 November 2016, 18:47:25to 4 November 2016, 18:53:47 6 min 22 s
Surat-Kadodara Rd., Bareli, Tal.Palsana, Naya Bazar, Kadodra,Vareli, Gujarat 394327, India.
10 From 5 November 2016, 08:29:59to 5 November 2016, 08:39:29 9 min 30 s Mahuva-Bardoli Rd., Isroli,
Gujarat 394620, India
5. Discussions and Implications
Practitioners have used big data analytics in different domains [88–91]. Through the SUMUL casestudy, we have illustrated the value of adopting big data analytics for predicting and managing socialand environmental risks, which disrupt the supply chain. This study is significant in the literaturebecause supply chain risk management has emerged as one of companies’ top priorities in predictingand mitigating potential disruptions [24]. Social and environmental issues (e.g., workforce safety,health, robbery, vehicle theft, unethical actions, workforce security, speeding and natural calamities)were issues plaguing manufacturing in India. Our study demonstrates how big data innovation cannot only predict these issues in real time but also mitigate them in the supply chain.
This study assists the supply chain practitioners and policy makers in looking for big datainnovations to solve social and environmental issues, thus helping to ensure sustainability. Our resultsalign with those of Jelinek and Bergey [21], whose results proved big data knowledge and innovationsdrive organizations’ sustainability. Our findings also concur with earlier research that proved adoptingbig data analytics enhances supply chain innovation’s capability [92]. Such innovation capabilitiescombined with big data analytics knowledge help create an inimitable knowledge base, which notonly provides a strategic advantage but also is the basis for sustainability. Our results also confirma knowledge-based view that asserts knowledge is a firm’s fundamental resource, which is inimitableand facilitates sustainability [18]. Furthermore, a firm’s big data capabilities unify today’s businesswith innovation to achieve a competitive advantage. Our results are consistent with Xia et al. [43]who employed a versatile sales forecasting system in Hong Kong’s fashion retail industry thereby averting inventory stock outs. A knowledge-based perspective can also be discerned in thework of Womack et al. [93], Wheelwright and Clark [94]. Their work involving the Japanese autoindustry proved that building innovative resources and capabilities to support new offerings invariablyproduces a competitive advantage.
Sustainability 2017, 9, 608 17 of 21
Our study confirms earlier research by Chronopoulous et al. [95] that employed real optionsapproach to study the production capacity planning problem by incorporating risk aversion andoperational flexibility in an analytical model. This demonstrated how big data analytics was leveragedto avert risk and realize optimal capacity. Similar results were obtained by Hofmann [45] whosestudy showed how big data analytics helped to manage the bullwhip effect in customer serviceoperations. Our research further corresponds with research suggesting that adopting big data inchemical processing industries positively affects sustainability [51]. Similarly, research in Korea provedthat the combined use of big data and a green IT platform can mitigate environmental risks andenhance sustainability [41,96]. In contrast, research on a sustainable digital environment shows thatexcessive use of digital technology may lead to an unsustainable environment [32]. Our results concurwith those of Choy and Park [97], who describes how consumer-centric innovation and big dataknowledge in the supply chain contribute to a firm’s survival and sustainability.
As big data analytics gains importance in business, adopting big data in various business domainsis becoming a reality. The theory involving big data integration in sustainability, especially in thesupply chain operation domain, is limited but growing. Our research fills this gap by demonstratinghow big data analytics can be used effectively in predicting and mitigating supply chain risks forsurvival and competitive advantage, thereby adding knowledge to this domain. Another managerialimplication of this research is that it can assist supply chain domain’s practitioners in adopting big dataknowledge so they will be able to not only predict and mitigate the issues but also build sustainablesupply chains.
6. Conclusions and Future Research
The literature on integrating big data into supply chain sustainability is scant. This research isan early attempt to explore such integration with the outcome of contributing to the body of knowledge.The aim of this research was to explore social and environmental issues causing disruptions in thesupply chain and to determine how to mitigate such risks through BDA. Furthermore, this researchexplored and has illustrated the practitioner’s perspective through real-time implementation of BDA forsupply chain sustainability. Through this research, we have identified various social and environmentalissues leading to supply chain risk. The outcome of this research shows how BDA could mitigate therisks caused by social and environmental issues and in turn lead to sustainability.
While this research is an early attempt at integrating two disciplines (i.e., big data and sustainableoperations) into emerging economies, it can be extended to other developing and developed economiesto get more insights. Because social issues tend to vary based on social evolution, this research shouldbe extended into other economies. Further research can empirically examine the relationship betweenBDA and its impact on operational and firm performance.
Acknowledgments: We acknowledge the contribution of Purvishkumar Patel, Chief Executive, 3PL LogisticsPrivate Ltd. for timely information and data sharing. We extend our sincere gratitude to SUMUL senior executivesand employees for their contribution without which it would not have been possible to complete this researchon time.
Author Contributions: The research was designed by Venkatesh Mani and Catarina Delgado was responsible forsupervision. All authors contributed to the development of the manuscript.
Conflicts of Interest: The authors declare no conflict of interest.
References
1. Wood, D.J. Corporate social performance revisited. Acad. Manag. Rev. 1991, 16, 691–718.2. Mani, V.; Agrawal, R.; Gunasekaran, A.; Papadopoulos, T.; Dubey, R.; Childe, S. Social sustainability in the
supply chain: Construct development and measurement validation. Ecol. Indic. 2016, 71, 270–279. [CrossRef]3. Mani, V.; Gunasekaran, A.; Papadopoulos, T.; Benjamin, H.; Dubey, R. Supply Chain Social Sustainability for
Developing Nations: Evidence from India. Resour. Conserv. Recycl. 2016, 111, 42–52. [CrossRef]
Sustainability 2017, 9, 608 18 of 21
4. Ketchen, D.J., Jr.; Hult, G.T.M. Bridging organization theory and supply chain management: The case of bestvalue supply chains. J. Oper. Manag. 2007, 25, 573–580.
5. Slone, R.E. Leading a supply chain turn around. Harv. Bus. Rev. 2004, 82, 114–121. [PubMed]6. Whipple, J.M.; Frankel, R. Strategic alliance success factors. J. Supply Chain Manag. 2000, 36, 21–28. [CrossRef]7. Zacharia, Z.G.; Sanders, N.R.; Nix, N.W. The emerging role of the third-party logistics provider (3PL) as
an orchestrator. J. Bus. Logist. 2011, 32, 40–54. [CrossRef]8. Davenport, T.H. Competing on analytics. Harv. Bus. Rev. 2006, 84, 84–93.9. Chae, B.; Olson, D. Business analytics for supply chain: A dynamic-capabilities frame work. Int. J. Inf.
Technol. Decis. Mak. 2013, 12, 9–26. [CrossRef]10. Hazen, B.T.; Boone, C.A.; Ezell, J.D.; Jones-Farmer, L.A. Data quality for data science, predictive analytics,
and big data in supply chain management: An introduction to the problem and suggestions for research andapplications. Int. J. Prod. Econ. 2014, 154, 72–80. [CrossRef]
11. Trkman, P.; McCormack, K.; de Oliveira, M.P.V.; Ladeira, M.B. The impact of business analytics on supplychain performance. Decis. Support Syst. 2010, 49, 318–327. [CrossRef]
12. Keeso, A. Big Data and Environmental Sustainability: A Conversation Starter; Smith School Working PaperSeries; Working Paper 14-04; Smith School of Enterprise and the Environment, University of Oxford: Oxford,UK, 2014; Available online: http://www.smithschool.ox.ac.uk/library/workingpapers/workingpaper%2014-04.pdf (accessed on 7 May 2015).
13. Chen, L.; Olhager, J.; Tang, O. Manufacturing facility location and sustain- ability: A literature review andresearch agenda. Int. J. Prod. Econ. 2014, 149, 154–163. [CrossRef]
14. Giannakis, M. The intellectual structure of the supply chain management discipline: A citation and socialnetwork analysis. J. Enterp. Inf. Manag. 2012, 25, 136–169. [CrossRef]
15. Seuring, S.; Müller, M. From a literature review to a conceptual framework for sustainable supply chainmanagement. J. Clean. Prod. 2008, 16, 1699–1710. [CrossRef]
16. Simon, H.A. Administrative Behavior; Free Press: New York, NY, USA, 1965.17. Grant, R.M. Prospering in dynamically-competitive environments: Organizational capability as knowledge
integration. Organ. Sci. 1996, 7, 375–387. [CrossRef]18. Grant, R.M. Toward a knowledge-based theory of the firm. Strateg. Manag. J. 1996, 17, 109–122. [CrossRef]19. Huber, G.P. Organizational learning: The contributing processes and literatures. Organ. Sci. 1991, 2, 71–87.
[CrossRef]20. Levitt, B.; March, J.G. Organizational learning. Annu. Rev. Sociol. 1988, 14, 319–340. [CrossRef]21. Jelinek, M.; Bergey, P. Innovation as the strategic driver of sustainability: Big data knowledge for profit and
survival. IEEE Eng. Manag. Rev. 2013, 41, 14–22. [CrossRef]22. Manyika, J.; Sinclair, J.; Dobbs, R.; Strube, G.; Rassey, L.; Mischke, J.; Remes, J.; Roxburg, C.; George, K.;
O’Halloran, D.; et al. Manufacturing the Future: The Next Era of Global Growth and Innovation. 2012,pp. 1–184. Available online: http://www.mckinsey.com/business-functions/operations/our-insights/the-future-of-manufacturing (accessed on 22 July 2016).
23. Hazen, B.T.; Sankar, C. Cross-border process innovations: Improving the fit between information processingneeds and capabilities. Int. J. Innov. Technolo. Manag. 2015, 12, 1–26. [CrossRef]
24. Chopra, S.; Sodhi, M. Reducing the risk of supply chain disruptions. MIT Sloan Manag. Rev. 2014, 55, 72–80.25. Tang, O.; Nurmaya Musa, S. Identifying risk issues and research advancements in supply chain risk
management. Int. J. Prod. Econ. 2011, 133, 25–34. [CrossRef]26. Klassen, R.D.; Vereecke, A. Social issues in supply chains: Capabilities link responsibility, risk (opportunity),
and performance. Int. J. Prod. Econ. 2012, 140, 103–115. [CrossRef]27. Kumar, S.; Havey, T. Before and after disaster strikes: A relief supply chain decision support frame work.
Int. J. Prod. Econ. 2013, 145, 613–629. [CrossRef]28. O’Leary, D. The use of social media in the supply chain: Survey and extensions. Intell. Syst. Account.
Financ. Manag. 2011, 18, 121–144. [CrossRef]29. Dubey, R.; Gunasekaran, A.; Childe, S.J.; Wamba, S.F.; Papadopoulos, T. The impact of big data on world-class
sustainable manufacturing. Int. J. Adv. Manuf. Technol. 2016, 84, 631–645. [CrossRef]30. Hazen, B.T.; Skipper, J.B.; Ezell, J.D.; Boone, C.A. Big Data and predictive analytics for supply chain
sustainability: A theory-driven research agenda. Comput. Ind. Eng. 2016, 101, 592–598. [CrossRef]

Sustainability 2017, 9, 608 19 of 21
31. Hsu, J. Why Big Data Will Have an Impact on Sustainability. The Guardian. Available online: http://www.theguardian.com/sustainable-business/big-dataimpact-sustainable-business (accessed on 31 January 2014).
32. Scholz, R.W. Sustainable Digital Environments: What Major Challenges Is Humankind Facing? Sustainability2016, 8, 726. [CrossRef]
33. Chen, H.; Chiang, R.H.; Storey, V.C. Business intelligence and analytics: From big data to big impact. MIS Q.2012, 4, 1165–1188.
34. Spotfire. Big Data in Manufacturing: Rise of the Machine: TIBCO Spotfire’s Trends and OutliersBlog. Available online: http://spotfire.tibco.com/blog/?p=20446\T1\textgreater.2013 (accessed on22 June 2016).
35. Wamba, S.; Akter, S.; Edwards, A.; Chopin, G.; Gnanzou, D. How ‘big data’ can make big impact: Findingsfrom a systematic review and a longitudinal case study. Int. J. Prod. Econ. 2015. [CrossRef]
36. Demirkan, H.; Delen, D. Leveraging the capabilities of service-oriented decision support systems: Puttinganalytics and big data in cloud. Decis. Support Syst. 2013, 55, 412–421. [CrossRef]
37. Hazen, B.T.; Skipper, J.B.; Boone, C.A.; Hill, R.R. Back in business: Operations research in support of big dataanalytics for operations and supply chain management. Ann. Oper. Res. 2016. [CrossRef]
38. Wang, G.; Gunasekaran, A.; Ngai, E.W.; Papadopoulos, T. Big data analytics in logistics and supply chainmanagement: Certain investigations for research and applications. Int. J. Prod. Econ. 2016, 176, 98–110.[CrossRef]
39. Mishra, D.; Gunasekaran, A.; Papadopoulos, T.; Childe, S.J. Big Data and supply chain management:A review and bibliometric analysis. Ann. Oper. Res. 2016. [CrossRef]
40. Accenture Global Operations Mega Trends Study. Big Data Analytics in Supply Chain: Hype or Here toStay? Available online: http://www.accenture.com/us-en/Pages/insight-global-operations-megatrends-big-data-analytics.aspx (accessed on 7 December 2014).
41. Barnaghi, P.; Sheth, A.; Henson, C. From data to actionable knowledge: Big data challenges in the web ofthings. IEEE Intell. Syst. 2013, 28, 67–71. [CrossRef]
42. Li, J.; Tao, F.; Cheng, Y.; Zhao, L. Big data in product lifecycle management. Int. J. Adv. Manuf. Technol. 2015,81, 667–684. [CrossRef]
43. Xia, M.; Zhang, Y.; Weng, L.; Ye, X. Fashion retailing forecasting based on extreme learning machine withadaptive metrics of inputs. Knowl. Based Syst. 2012, 36, 253–259. [CrossRef]
44. Shen, B.; Chan, H.L. Forecast Information Sharing for Managing Supply Chains in the Big Data Era: RecentDevelopment and Future Research. Asia Pac. J. Oper. Res. 2017, 34, 1740001. [CrossRef]
45. Hofmann, E. Big data and supply chain decisions: The impact of volume, variety and velocity properties onthe bullwhip effect. Int. J. Prod. Res. 2015. [CrossRef]
46. Souza, G.C. Supply chain analytics. Bus. Horiz. 2014, 57, 595–605. [CrossRef]47. Brockhaus, S.; Kersten, W.; Knemeyer, A.M. Where do we go from here? Progressing sustainability
implementation efforts across supply chains. J. Bus. Logist. 2013, 34, 167–182. [CrossRef]48. McWilliams, A.; Siegel, D.S. Creating and capturing value: Strategic corporate social responsibility,
resource-based theory, and sustainable competitive advantage. J. Manag. 2011, 37, 1480–1495. [CrossRef]49. Hsu, J.M. Big Business + Big Data = Big Sustainability. 2013. Available online: http://www.sustainablebrands.
com/news_and_views/info_tech/john-m-hsu/bigbusiness-Big-data-big-sustainability (accessed on16 January 2016).
50. Garetti, M.; Taisch, M. Sustainable manufacturing: Trends and research challenges. Prod. Plan. Control 2012,23, 83–104. [CrossRef]
51. Belaud, J.P.; Negny, S.; Dupros, F.; Michéa, D.; Vautrin, B. Collaborative simulation and scientific big dataanalysis: Illustration for sustainability in natural hazards management and chemical process engineering.Comput. Ind. 2014, 65, 521–535. [CrossRef]
52. Kambatla, K.; Kollias, G.; Kumar, V.; Grama, A. Trends in big data analytics. J. Parallel Distrib. Comput. 2014,74, 2561–2573. [CrossRef]
53. Bettencourt-Silva, J.H.; Clark, J.; Cooper, C.S.; Mills, R.; Rayward-Smith, V.J.; De La Iglesia, B. Buildingdata-driven pathways from routinely collected hospital data: A case study on prostate cancer. JMIR Med. Inf.2015, 3, e26. [CrossRef] [PubMed]
54. Halamka, J.D. Early experiences with big data at an academic medical center. Health Aff. 2014, 33, 1132–1138.[CrossRef] [PubMed]

Sustainability 2017, 9, 608 20 of 21
55. Baek, H.; Park, S.K. Sustainable developments plan for Korea through expansion of green IT: Policy issuesfor the effective utilization of big data. Sustainability 2015, 7, 1308–1328. [CrossRef]
56. Mason-Jones, R.; Towill, D.R. Shrinking the supply Chain Uncertainty Cycle, Control. Available online:http://www.enterrasolutions.com/media/docs/2011/02/19980901d.pdf (accessed on 10 July 2015).
57. Berger, P.D.; Gerstenfeld, A.; Zeng, A.Z. How many suppliers are best? A decision-analysis approach. Omega2004, 32, 9–15. [CrossRef]
58. Christopher, M.; Lee, H. Mitigating supply chain risk through improved confidence. Int. J. Phys. Distrib.Logist. Manag. 2004, 34, 388–396. [CrossRef]
59. LaLonde, B.J. A Crisis in Transportation. In Supply Chain Management Review; EH Publishing: Framingham,MA, USA, 2004; pp. 7–8.
60. Norrman, A.; Jansson, U. Ericsson’s proactive supply chain risk management approach after a serioussub-supplier accident. Int. J. Phys. Distrib. Logist. Manag. 2004, 34, 434–456. [CrossRef]
61. Quinn, F. Risky Business. In Supply Chain Management Review; EH Publishing: Framingham, MA, USA, 2006.62. Tang, C.S. Perspectives in supply chain risk management. Int. J. Prod. Econ. 2006, 103, 451–488. [CrossRef]63. Hendricks, K.B.; Singhal, V.R. An Empirical Analysis of the Effect of Supply Chain Disruptions on Long-Run
Stock Price Performance and Equity Risk of the Firm. Prod. Oper. Manag. 2005, 14, 35–52. [CrossRef]64. Sheffi, Y.; Rice, J.B. A Supply Chain View of the Resilient Enterprise. MIT Sloan Manag. Rev. 2005, 47, 41–48.65. Jüttner, U. Supply chain risk management: Understanding the business requirements from a practitioner
perspective. Int. J. Logist. Manag. 2005, 16, 120–141. [CrossRef]66. Choi, T.M.; Chan, H.K.; Yue, X. Recent development in big data analytics for business operations and risk
management. IEEE Trans. Cybern. 2017, 47, 81–92. [CrossRef] [PubMed]67. Chan, H.K.; Choi, T.M.; Yue, X. Guest Editorial Big Data Analytics: Risk and Operations Management for
Industrial Applications. IEEE Trans. Ind. Inf. 2016, 12, 1214–1218. [CrossRef]68. Lee, H.L. Aligning Supply Chain Strategies with Product Uncertainties. Calif. Manag. Rev. 2002, 44, 105–119.
[CrossRef]69. Lee, H.L. The Triple-A Supply Chain. Harv. Bus. Rev. 2004, 82, 102–112. [PubMed]70. Narayanan, V.G.; Raman, A. Aligning Incentives in Supply Chains. Harv. Bus. Rev. 2004, 82, 94–102.
[PubMed]71. Amit, R.; Schoemaker, P.J.H. Strategic assets and organizational rents. Strateg. Manag. J. 1993, 14, 33–46.
[CrossRef]72. Cohen, W.; Levinthal, D. Absorptive capability: A new perspective on learning and innovation. Admin. Sci. Q.
1990, 35, 128–152. [CrossRef]73. Yin, R.K. Case Study Research: Design and Methods; Sage Publications: London, UK, 2013.74. Eisenhardt, K.M. Building theories from case study research. Acade. Manag. Rev. 1989, 14, 532–550.75. Markus, M.L. Power, politics, and MIS implementation. Commun. ACM 1983, 26, 430–444. [CrossRef]76. Bonoma, T.V. Case research in marketing: Opportunities, problems, and a process. J. Mark. Res. 1985, 22,
199–208. [CrossRef]77. Rowley, J. Using case studies in research. Manag. Res. News 2002, 25, 16–27.78. Feagin, J.R.; Orum, A.M.; Sjoberg, G. Conclusion: The present crisis in US sociology. In A Case for the Case
Study; University of North Carolina Press: Chapel Hill, NC, USA, 1991; pp. 269–278.79. Drucker, P.F. The changed world economy. Foreign Aff. 1986, 64, 768–791. [CrossRef]80. Yin, R.K. Qualitative Research from Start to Finish; The Guilford Press: New York, NY, USA, 2011.81. Judd, C.M. Combining process and outcome evaluation. New Dir. Progr. Eval. 1987, 35, 23–41. [CrossRef]82. Kidder, L.H.; Fine, M. Qualitative and quantitative methods: When stories converge. New Dir. Eval. 1987, 35,
57–75. [CrossRef]83. Liebow, E. Tally’s Corner: A Study of Negro Street Corner Men; Rowman & Littlefield Publishers: New York,
NY, USA, 2003.84. Naim, M.M.; Childerhouse, P.; Disney, S.M.; Towill, D.R. A supply chain diagnostic methodology:
Determining the vector of change. Comput. Ind. Eng. 2002, 43, 135–157. [CrossRef]85. Wang, Y.; Lalwani, C.S. Using e-business to enable customized logistics sustainability. Int. J. Logist. Manag.
2007, 18, 402–419. [CrossRef]86. World Bank Report. International LPI Global Rankings. Available online: http://lpi.worldbank.org/
international/global (accessed on 15 June 2016).
Sustainability 2017, 9, 608 21 of 21
87. Chandra, P.; Jain, N. The logistics sector in India: Overview and challenges. In World Scientific Series on 21stCentury Business; Working Paper Series 2007; Indian Institute of Management: Ahmedabad, India, 2007;p. 105. Available online: http://iimahd.ernet.in/publications/data/2007-03-07Pankajchandra.pdf (accessedon 7 September 2016).
88. Joshi, K.; Yesha, Y. Workshop on analytics for big data generated by healthcare and personalized medicinedomain. In Proceedings of the 2012 Conference of the Center for Advanced Studies on CollaborativeResearch, Toronto, ON, Canada, 5–7 November 2012; pp. 267–269.
89. Henschen, D. Merck Optimizes Manufacturing with Big Data Analytics: Information Week Connectingthe Business Technology Community. Available online: http://www.informationweek.com/strategic-cio/executive-insights-and-innovation/merck-optimizes-manufacturing-with-big-data-analytics/d/d-id/1127901\T1\textgreater.2014 (accessed on 22 July 2016).
90. Peat, M. Big data in finance. In Finance: The Magazine for Finsia Members; Financial Services Institute ofAustralasia: Sydney, Australia, 2013; Volume 127, p. 34.
91. Zhong, R.Y.; Xu, C.; Chen, C.; Huang, G.Q. Big data analytics for physical internet-based intelligentmanufacturing shop floors. Int. J. Prod. Res. 2015. [CrossRef]
92. Tan, K.H.; Zhan, Y.; Ji, G.; Ye, F.; Chang, C. Harvesting big data to enhance supply chain innovationcapabilities: An analytic infrastructure based on deduction graph. Int. J. Prod. Econ. 2015, 165, 223–233.[CrossRef]
93. Womack, J.P.; Jones, D.T.; Roos, D. The Machine that Changed the World; Rawson Associates: New York, NY,USA, 1990.
94. Wheelwright, S.; Clark, K. Revolutionizing New Product Development; Free Press: New York, NY, USA, 1992.95. Chronopoulos, M.; De Reyck, B.; Siddiqui, A. The value of capacity sizing under risk aversion and operational
flexibility. IEEE Trans. Eng. Manag. 2013, 60, 272–288. [CrossRef]96. Choi, J.; Jun, S.; Park, S. A Patent Analysis for Sustainable Technology Management. Sustainability 2016,
8, 688. [CrossRef]97. Choy, M.; Park, G. Sustaining Innovative Success: A Case Study on Consumer-Centric Innovation in the ICT
Industry. Sustainability 2016, 8, 986. [CrossRef]
© 2017 by the authors. Licensee MDPI, Basel, Switzerland. This article is an open accessarticle distributed under the terms and conditions of the Creative Commons Attribution(CC BY) license (http://creativecommons.org/licenses/by/4.0/).