Embed Size (px)
Citation preview

As of June 30, 2020
52nd ComprehensiveAnnual Financial Report
M
ISSOU
RI
LAGERS
A summary of Missouri LAGERS financial, investment, actuarial, and statistical information for our members
Missouri Local Government Employees Retirement System


MISSOURI LOCAL GOVERNMENT EMPLOYEES RETIREMENT SYSTEM
Fifty-second Comprehensive Annual Financial ReportFiscal Year Ended June 30, 2020
Robert L. Wilson, CEBSExecutive Director
Melissa K. Rackers, CPA, CGFM, CEBSChief Financial Officer
Missouri Local GovernmentEmployees Retirement System
701 W. Main St.P.O. Box 1665
Jefferson City, MO 65102(573) 636-9455(800) 447-4334
Cover Photo Credit: Missouri LAGERS Team
M
ISSOU
RI
L
AGERS

4Missouri Local Government Employees Retirement System
Table of ContentsIntroductory Section
Vision, Mission, Values ........................................................................................................................................................................................... 6Administrative Organization ............................................................................................................................................................................... 7Consulting Services ................................................................................................................................................................................................ 8Awards ........................................................................................................................................................................................................................ 8Acknowledgements ............................................................................................................................................................................................... 9Economic Impact .................................................................................................................................................................................................... 9Letter of Transmittal .............................................................................................................................................................................................10Chairperson’s Report ............................................................................................................................................................................................13Board of Trustees ...................................................................................................................................................................................................14Executive Team ......................................................................................................................................................................................................15LAGERS Team .........................................................................................................................................................................................................16
Financial SectionIndependent Auditors’ Report ..........................................................................................................................................................................18Management’s Discussion and Analysis .......................................................................................................................................................20Financial Statements
Statement of Fiduciary Net Position ..........................................................................................................................................................24Statement of Changes in Fiduciary Net Position ...................................................................................................................................25Notes to Financial Statements .....................................................................................................................................................................26
Required Supplementary InformationSchedule of Investment Returns ................................................................................................................................................................45
LAGERS Staff Retirement PlanSchedule of Changes in Net Pension Liabilities...........................................................................................................................45Schedule of Employer Contributions ..............................................................................................................................................46
LAGERS Retiree Healthcare SupplementSchedule of Changes in Net OPEB Liability ...................................................................................................................................47Schedule of Employer Contributions ..............................................................................................................................................48
Supplementary InformationSchedule of Operating Expenses ...............................................................................................................................................................49
Investment SectionChief Investment Officer’s Report ...................................................................................................................................................................52Asset Allocation .....................................................................................................................................................................................................54Investment Policy ..................................................................................................................................................................................................55Investment Results ...............................................................................................................................................................................................60Largest Holdings ...................................................................................................................................................................................................61Schedule of Advisor Fees ...................................................................................................................................................................................61Schedule of Investment Advisors ....................................................................................................................................................................62Brokerage Schedule .............................................................................................................................................................................................64
Actuarial SectionActuary’s Certification Letter ............................................................................................................................................................................66Summary of Actuarial Assumptions ...............................................................................................................................................................68Actuarial Valuation Data
Participating Employers and Active Members .......................................................................................................................................71Retirant and Beneficiary Data ......................................................................................................................................................................71Schedule of Funding Progress .....................................................................................................................................................................72Short Condition Test ........................................................................................................................................................................................73Employer Contribution Rate Changes ......................................................................................................................................................73
Employer Contribution Rates ...........................................................................................................................................................................74Schedule of Gains and Losses in Accrued Liabilities ................................................................................................................................76Summary of Plan Provisions ..............................................................................................................................................................................77
Statistical SectionSummary ..................................................................................................................................................................................................................81Change in Fiduciary Net Position ....................................................................................................................................................................82Interest Credits to Reserve Accounts .............................................................................................................................................................83Retired Member Data ..........................................................................................................................................................................................84Benefit Expenses by Type ...................................................................................................................................................................................85Average Monthly Benefit Payments ...............................................................................................................................................................86Participants by Classification ............................................................................................................................................................................87Participating Political Subdivisions ................................................................................................................................................................88

IntroductionSection 1:
Photo Credit: Local Government Hero FinalistCarol Rhodes
Assistant City AdministratorCity of Columbia

6Missouri Local Government Employees Retirement System
Introductory Section
At LAGERS, we believe in a secure retirement for all and strive to achieve this vision by pursuing our mission of providing secure retirement, survivor's and disability benefits to local government subdivisions in Missouri. Our mission and vision are supported by the values held in high regard by the Board of Trustees and team. The pyramid below illustrates LAGERS vision, mission and values.
Vision, Mission, Values
VISION
MISSION
VALUES
probenefits in the most efficient and economical
manner possible, while providing superior and fulfilling our fiduciary obligations
To provide and preserve retirement security for those dedicated to serving Missouri’s local
communities.
Excellence
Dedication Respect
A secure retirement for all.
Teamwork Integrity
Communication Accountability
Introductory Section
7Missouri Local Government Employees Retirement System
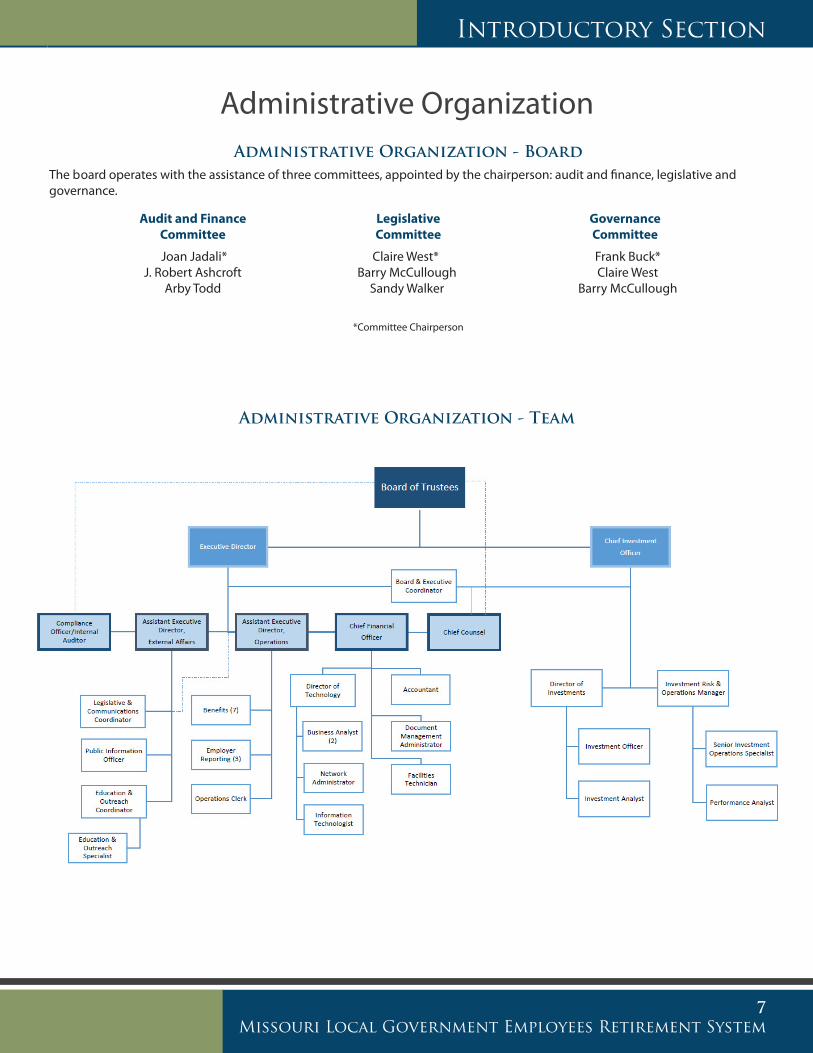
Administrative Organization - BoardThe board operates with the assistance of three committees, appointed by the chairperson: audit and finance, legislative and governance.
Audit and Finance Legislative Governance Committee Committee Committee
Joan Jadali* Claire West* Frank Buck* J. Robert Ashcroft Barry McCullough Claire West Arby Todd Sandy Walker Barry McCullough
*Committee Chairperson
Administrative Organization - Team
Administrative Organization

8Missouri Local Government Employees Retirement System
Introductory Section
Consulting Services
ActuaryGabriel, Roeder, Smith & Co.Mita D. DrazilovJudith A. KermansSouthfield, MI
AuditorWilliams Keepers, LLCCertified Public AccountantNick Mestres, CPAJefferson City, MO
Eclipse ConsultantSagitec Solutions, LLCPaul EberhartLittle Canada, MN
Legal CounselHusch Blackwell, LLPAttorneys at LawLowell PearsonJefferson City, MO.
Legal CounselThompson Coburn, LLPAttorneys at LawGregory A. PattersonJefferson City, MO
Legislative ConsultantFlotron & McIntoshRichard McIntoshJefferson City, MO
Medical AdvisorUniversity of Massachusetts Medical SchoolDisability Evaluation ServicesJody Simpson, RNShrewsberry, MA
The following firms were retained at fiscal year-end and by the Board of Trustees to serve in professional capacities or provide consultant services. Please refer to pages 61 in the Investment Section for the Schedule of Advisor Fees, page 64 for the Brokerage Commissions and pages 62-63 for the Investment Professionals.
Awards
Public Pension Coordinating Council
Recognition Award for Funding2017
Presented to
Missouri Local Government Employees Retirement System
In recognition of meeting professional standards forplan funding as
set forth in the Public Pension Standards.
Presented by the Public Pension Coordinating Council, a confederation of
National Association of State Retirement Administrators (NASRA)National Conference on Public Employee Retirement Systems (NCPERS)
National Council on Teacher Retirement (NCTR)
Alan H. WinkleProgram Administrator
P CP C
Recognition Award for Funding 2019
Public Pension Coordinating Council
Recognition Award for Funding2017
Presented to
Missouri Local Government Employees Retirement System
In recognition of meeting professional standards forplan funding as
set forth in the Public Pension Standards.
Presented by the Public Pension Coordinating Council, a confederation of
National Association of State Retirement Administrators (NASRA)National Conference on Public Employee Retirement Systems (NCPERS)
National Council on Teacher Retirement (NCTR)
Alan H. WinkleProgram Administrator
P CP CGovernment Finance Officers Association
Certificate of Achievementfor Excellence
in Financial Reporting
Presented to
Missouri Local GovernmentEmployees Retirement System
For its Comprehensive AnnualFinancial Report
For the Fiscal Year Ended
June 30, 2019
Executive Director/CEO
Certificate of Achievement for Excellence in Financial Reporting PPCC Achievement Award for Funding

Introductory Section
9Missouri Local Government Employees Retirement System
AcknowledgementsThe LAGERS Comprehensive Annual Financial Report (CAFR) for the year ended June 30, 2020, was coordinated by the Chief Financial Officer. Special thanks to the individuals who contributed significant amounts of time and energy to help complete this report.
Danielle Plassmeyer, AccountantErin Stieferman, Investment Risk and Operations ManagerAshley Schmitz, Senior Investment Operations SpecialistPenny Thomas, Education and Outreach Specialist
ActuaryGabriel, Roeder, Smith & Co.Mita D. DrazilovJudith A. KermansSouthfield, MI
AuditorWilliams Keepers, LLCCertified Public AccountantNick Mestres, CPAJefferson City, MO
Eclipse ConsultantSagitec Solutions, LLCPaul EberhartLittle Canada, MN
Legal CounselHusch Blackwell, LLPAttorneys at LawLowell PearsonJefferson City, MO.
Legal CounselThompson Coburn, LLPAttorneys at LawGregory A. PattersonJefferson City, MO
Legislative ConsultantFlotron & McIntoshRichard McIntoshJefferson City, MO
Medical AdvisorUniversity of Massachusetts Medical SchoolDisability Evaluation ServicesJody Simpson, RNShrewsberry, MA
LAGERS paid out $356 million to 25,668 benefit recipients last year, with
93% ($332 million) staying in Missouri.
LAGERS is a defined benefit pension plan. Defined benefit plans pay a retiree a modest, predetermined amount each month. The amount of the benefit is based on a formula, not an account balance, and is driven by the employee’s years of service and salary. Defined benefit plans remain the most economical and effective retirement plans not only for employees, but for employers and taxpayers as well. They provide a clear and secure path to retirement for employees and help employers recruit and retain a strong, loyal workforce.
Defined benefit plans return value to the communities as well. Approximately 93% of the benefits are paid to retirees living in the communities they served as public workers. The steady monthly retirement benefits received by these pensioners are reinvested in their hometowns.
Economic Impact

10Missouri Local Government Employees Retirement System
Introductory Section
Letter of Transmittal
October 22, 2020
The Board of TrusteesMissouri Local GovernmentEmployees Retirement SystemJefferson City, MO 65102
The Annual Report of the Missouri Local Government Employees Retirement System (LAGERS) for the fiscal year ended June 30, 2020, is submitted herewith. The management of LAGERS is responsible for the compilation and accuracy of the financial, investment, actuarial and statistical information contained in this report. Responsibility for both the accuracy of the data, and completeness and fairness of the presentation, rests with the management of the system. We trust that you and the members of the system will find this annual report helpful in understanding your public employee retirement system – a system which continues to maintain a strong and positive financial future.
The LAGERS system was established in 1967 consisting of 10 employers and has subsequently expanded to include 806 political subdivisions of the state. A listing of the current employers begins on page 87.
STRATEGIC PLANNING
The core of our strategic planning is our values. Our values are the beliefs that we hold dear and provide the guidance for how we conduct ourselves. Our values provide the support for our mission and vision statements (as stated on page 6). During the 2020 fiscal year, the LAGERS Board adopted a new – member focused - mission statement. With these three components in place we were able to develop a three-year strategic plan which includes critical success factors, key strategies, objectives and action items. The four critical success factors are: funding sustainability, stakeholder service and outreach, staffing, and technology and cybersecurity. LAGERS management team developed key strategies we must achieve for success, objectives for how we will achieve the key strategies and planned actions for how we will accomplish the objectives. The strategic plan then became the basis for the annual business plan and budgeting process for the fiscal year. The development of the business plan is a coordinated effort of LAGERS management team.
CURRENT AND FUTURE INITIATIVES
The following items provide insight on a few initiatives the LAGERS team is currently focused on:
• Enhancing and expanding our outreach to all stakeholders. We are focused on communicating at the local, state and national levels the value of public service and defined benefit plans. LAGERS has focused its communication strategy on the strength and security of our system as an essential building block for Missouri’s communities. We’re sharing our plan design and operation as a role model of success.
• Ensuring the security of the system’s data and business continuity. LAGERS information technology team continues to focus on cybersecurity protection and ensuring LAGERS ability to continue serving our members in the event of a disaster. We have also implemented annual training on social engineering for the entire LAGERS team.
• We have been focusing on our document management process over the past 12-18 months and have made great strides in removing the handling of paper documents. This will allow us to strengthen our ability to ensure all member records are secure at all times. It also helps us to be more nimble given these uncertain times.
M
ISSOU
RI
L
AGERSMissouri Local Government Employees Retirement System
701 West Main, P.O. Box 1665, Jefferson City, Missouri 65102Telephone (573) 636-9455 • 800-447-4334 • FAX (573) 636-9671
www.molagers.org
Introductory Section
11Missouri Local Government Employees Retirement System
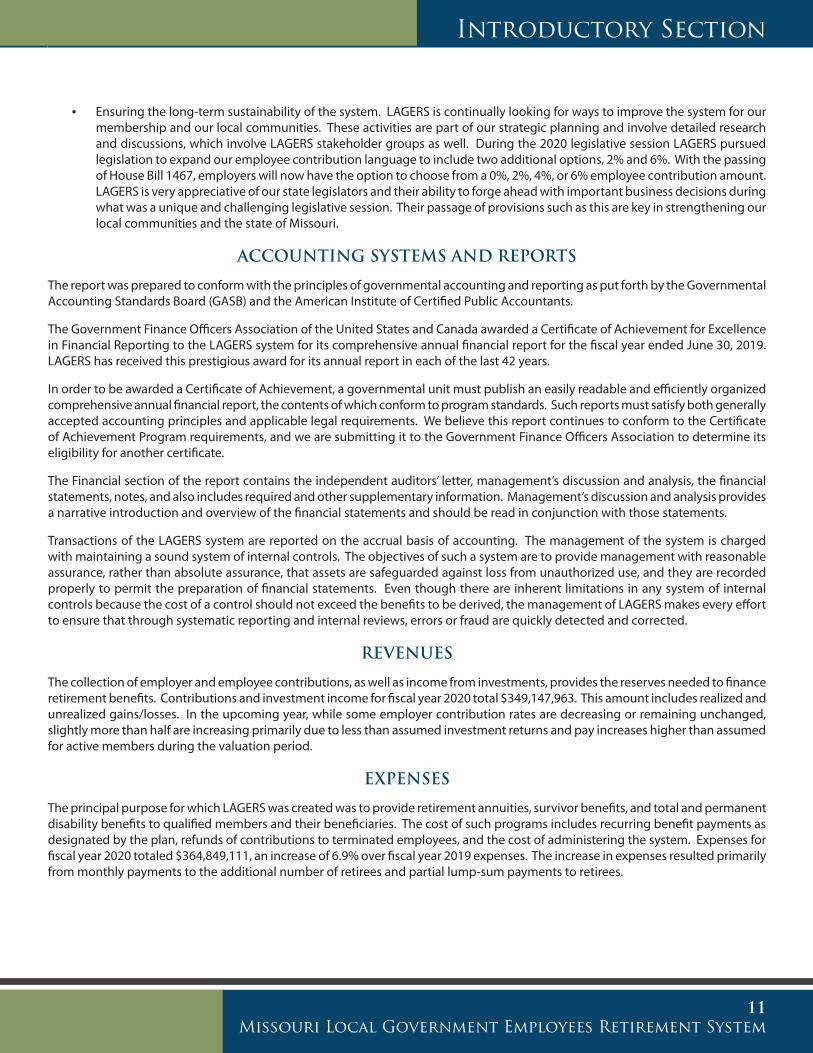
• Ensuring the long-term sustainability of the system. LAGERS is continually looking for ways to improve the system for our membership and our local communities. These activities are part of our strategic planning and involve detailed research and discussions, which involve LAGERS stakeholder groups as well. During the 2020 legislative session LAGERS pursued legislation to expand our employee contribution language to include two additional options, 2% and 6%. With the passing of House Bill 1467, employers will now have the option to choose from a 0%, 2%, 4%, or 6% employee contribution amount. LAGERS is very appreciative of our state legislators and their ability to forge ahead with important business decisions during what was a unique and challenging legislative session. Their passage of provisions such as this are key in strengthening our local communities and the state of Missouri.
ACCOUNTING SYSTEMS AND REPORTS
The report was prepared to conform with the principles of governmental accounting and reporting as put forth by the Governmental Accounting Standards Board (GASB) and the American Institute of Certified Public Accountants.
The Government Finance Officers Association of the United States and Canada awarded a Certificate of Achievement for Excellence in Financial Reporting to the LAGERS system for its comprehensive annual financial report for the fiscal year ended June 30, 2019. LAGERS has received this prestigious award for its annual report in each of the last 42 years.
In order to be awarded a Certificate of Achievement, a governmental unit must publish an easily readable and efficiently organized comprehensive annual financial report, the contents of which conform to program standards. Such reports must satisfy both generally accepted accounting principles and applicable legal requirements. We believe this report continues to conform to the Certificate of Achievement Program requirements, and we are submitting it to the Government Finance Officers Association to determine its eligibility for another certificate.
The Financial section of the report contains the independent auditors’ letter, management’s discussion and analysis, the financial statements, notes, and also includes required and other supplementary information. Management’s discussion and analysis provides a narrative introduction and overview of the financial statements and should be read in conjunction with those statements.
Transactions of the LAGERS system are reported on the accrual basis of accounting. The management of the system is charged with maintaining a sound system of internal controls. The objectives of such a system are to provide management with reasonable assurance, rather than absolute assurance, that assets are safeguarded against loss from unauthorized use, and they are recorded properly to permit the preparation of financial statements. Even though there are inherent limitations in any system of internal controls because the cost of a control should not exceed the benefits to be derived, the management of LAGERS makes every effort to ensure that through systematic reporting and internal reviews, errors or fraud are quickly detected and corrected.
REVENUES
The collection of employer and employee contributions, as well as income from investments, provides the reserves needed to finance retirement benefits. Contributions and investment income for fiscal year 2020 total $349,147,963. This amount includes realized and unrealized gains/losses. In the upcoming year, while some employer contribution rates are decreasing or remaining unchanged, slightly more than half are increasing primarily due to less than assumed investment returns and pay increases higher than assumed for active members during the valuation period.
EXPENSES
The principal purpose for which LAGERS was created was to provide retirement annuities, survivor benefits, and total and permanent disability benefits to qualified members and their beneficiaries. The cost of such programs includes recurring benefit payments as designated by the plan, refunds of contributions to terminated employees, and the cost of administering the system. Expenses for fiscal year 2020 totaled $364,849,111, an increase of 6.9% over fiscal year 2019 expenses. The increase in expenses resulted primarily from monthly payments to the additional number of retirees and partial lump-sum payments to retirees.
12Missouri Local Government Employees Retirement System
Introductory Section
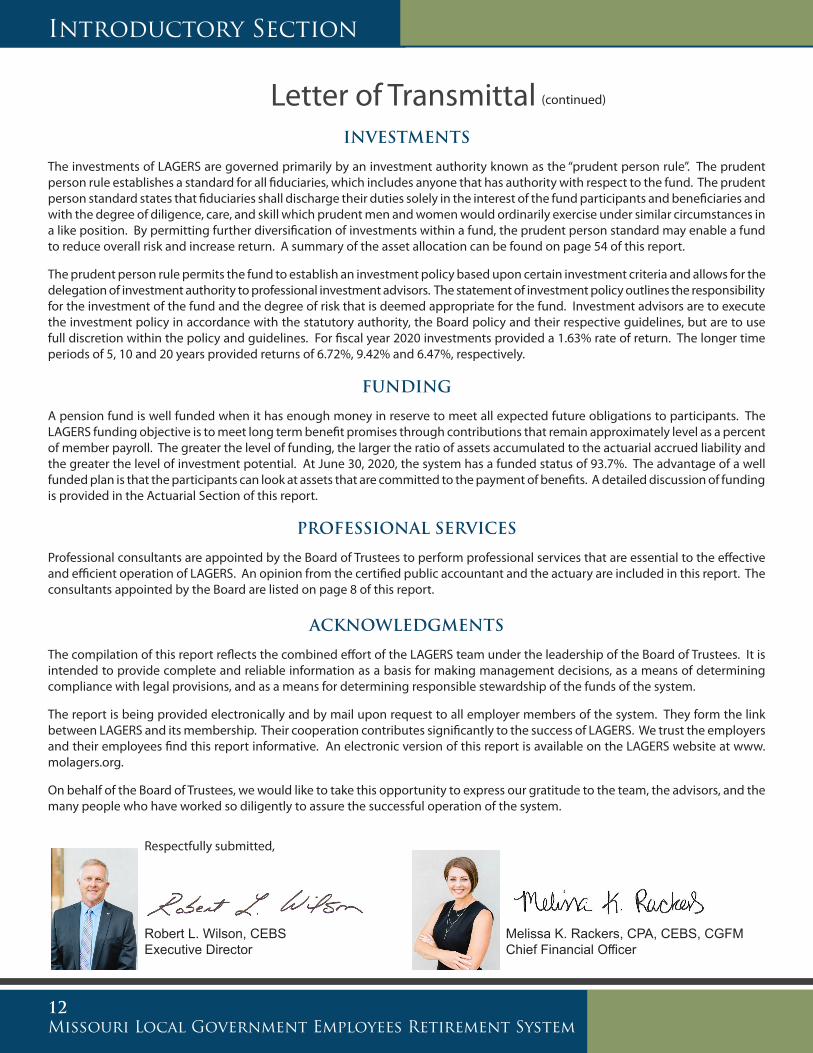
INVESTMENTS
The investments of LAGERS are governed primarily by an investment authority known as the “prudent person rule”. The prudent person rule establishes a standard for all fiduciaries, which includes anyone that has authority with respect to the fund. The prudent person standard states that fiduciaries shall discharge their duties solely in the interest of the fund participants and beneficiaries and with the degree of diligence, care, and skill which prudent men and women would ordinarily exercise under similar circumstances in a like position. By permitting further diversification of investments within a fund, the prudent person standard may enable a fund to reduce overall risk and increase return. A summary of the asset allocation can be found on page 54 of this report.
The prudent person rule permits the fund to establish an investment policy based upon certain investment criteria and allows for the delegation of investment authority to professional investment advisors. The statement of investment policy outlines the responsibility for the investment of the fund and the degree of risk that is deemed appropriate for the fund. Investment advisors are to execute the investment policy in accordance with the statutory authority, the Board policy and their respective guidelines, but are to use full discretion within the policy and guidelines. For fiscal year 2020 investments provided a 1.63% rate of return. The longer time periods of 5, 10 and 20 years provided returns of 6.72%, 9.42% and 6.47%, respectively.
FUNDING
A pension fund is well funded when it has enough money in reserve to meet all expected future obligations to participants. The LAGERS funding objective is to meet long term benefit promises through contributions that remain approximately level as a percent of member payroll. The greater the level of funding, the larger the ratio of assets accumulated to the actuarial accrued liability and the greater the level of investment potential. At June 30, 2020, the system has a funded status of 93.7%. The advantage of a well funded plan is that the participants can look at assets that are committed to the payment of benefits. A detailed discussion of funding is provided in the Actuarial Section of this report.
PROFESSIONAL SERVICES
Professional consultants are appointed by the Board of Trustees to perform professional services that are essential to the effective and efficient operation of LAGERS. An opinion from the certified public accountant and the actuary are included in this report. The consultants appointed by the Board are listed on page 8 of this report.
ACKNOWLEDGMENTS
The compilation of this report reflects the combined effort of the LAGERS team under the leadership of the Board of Trustees. It is intended to provide complete and reliable information as a basis for making management decisions, as a means of determining compliance with legal provisions, and as a means for determining responsible stewardship of the funds of the system.
The report is being provided electronically and by mail upon request to all employer members of the system. They form the link between LAGERS and its membership. Their cooperation contributes significantly to the success of LAGERS. We trust the employers and their employees find this report informative. An electronic version of this report is available on the LAGERS website at www.molagers.org.
On behalf of the Board of Trustees, we would like to take this opportunity to express our gratitude to the team, the advisors, and the many people who have worked so diligently to assure the successful operation of the system.
Respectfully submitted,
Robert L. Wilson, CEBS Melissa K. Rackers, CPA, CEBS, CGFM Executive Director Chief Financial Officer
Letter of Transmittal (continued)

Introductory Section
13Missouri Local Government Employees Retirement System
October 22, 2020
To all LAGERS members:
Our LAGERS system has encountered and overcome many challenges in its 53-year history, and this past year has presented us with yet another opportunity to adapt and press forward. Throughout the past 12 months, LAGERS’ board and staff have never wavered from providing top-notch service to all of our members while maintaining a financially strong pension fund.
The events of the last year have further highlighted the importance of LAGERS’ defined benefit plan to retirees, members, employers, and Missouri’s communities. Even as the markets contracted during the first quarter of 2020, secure monthly benefits continued to be paid to our 26,000 retirees and beneficiaries, pushing $332 million back into Missouri’s economy. Our LAGERS system has truly proven, once again, we can weather any storm and continue to be a great investment for Missouri.
LAGERS exists to provide secure retirement income to Missouri’s local government workers. The system continues to thrive and be a source of security, stability and fiscal responsibility for a growing number of communities. This last fiscal year alone (ending June 30th), 48 new employers joined LAGERS, bringing our total membership to 806 employers. This is proof the defined benefit model is alive and well as LAGERS continues to be the preferred retirement plan for Missouri’s local governments.
LAGERS continues its strong pre-funded ratio, coming in at 93.7% in 2020. This pre-funded ratio ranks LAGERS in the top 10% of all U.S. public pension plans. LAGERS' return of 1.63% for the one-year period is in line with expectations during an unprecedented year. Over the longer period of 5, 10, and 15 years, LAGERS has provided returns of 6.72%, 9.42%, and 7.33%, respectively. These long-term returns continue to exceed LAGERS’ custom benchmarks for each respective period. The Board has affirmed the continuation of a risk preference of a 10% standard deviation for LAGERS’ investment portfolio, further supporting the current portfolio allocation targeting an assumed rate of return of 7.25%. As we move forward, and LAGERS’ private asset allocation is fully deployed, the investment team will focus on keeping a balance between LAGERS’ asset allocation and liquidity allocation. LAGERS continues to manage inflation and growth risk in these disorderly times.
I would like to thank my fellow trustees for their dedication to all LAGERS’ members. Each individual board member contributes greatly to the success of the system and their incredible support is ever present. Serving as your chairperson has been an honor.
Finally, I am pleased to present the 2020 Comprehensive Annual Financial Report. This report offers a detailed analysis of the financial, investment and actuarial performance of your retirement system and serves as evidence of our responsibility of transparency to all of our stakeholders.
Respectfully,
Arby Todd, ChairpersonLAGERS Board of Trustees
701 West Main, P.O. Box 1665, Jefferson City, Missouri 65102Telephone (573) 636-9455 • 800-447-4334 • FAX (573) 636-9671
www.molagers.org
Chairperson’s ReportM
ISSOU
RI
L
AGERS
Missouri Local Government Employees Retirement System

14Missouri Local Government Employees Retirement System
Introductory Section
Board of Trustees
Barry McCulloughEmployer TrusteeCity of GladstoneTerm Expires 12-31-2022
J. Robert AshcroftEmployer TrusteePlatte CountyTerm Expires 12-31-2021
Arby ToddMember TrusteeChairpersonCity of Lee’s SummitTerm Expires 12-31-2021
Claire WestCitizen TrusteeTerm Expires 12-31-2020
Joan JadaliMember TrusteeVice - ChairpersonCity of Webster GrovesTerm Expires 12-31-2022
Sandy WalkerMember TrusteeCity of Poplar BluffTerm Expires 12-31-2020
From Left: Frank Buck, Arby Todd, Joan Jadali, Barry McCullough, Sandy Walker, J. Robert Ashcroft, Claire West
Frank BuckEmployer TrusteeDekalb CountyTerm Expires 12-31-2020

Introductory Section
15Missouri Local Government Employees Retirement System
LAGERS Executive Team
From Left: Sheila Reinsch, Jason Paulsmeyer, Melissa Rackers, Robert Wilson, Pam Hopkins, Jeff Kempker, Tami Jaegers, Brian Collett
Robert Wilson,CEBSExecutive Director
Brian Collett,CFA, CAIAChief Investment Officer
Melissa Rackers,CPA, CGFM, CEBSChief Financial Officer
Jeff Kempker,CEBS, CRCAsst. Director, External Affairs
Tami Jaegers,RPAAsst. Director, Operations
Pam Hopkins,CPA, CIA, CRMA, RPA, CGFM, Compliance Officer / Internal Auditor
Jason PaulsmeyerChief Counsel
Sheila Reinsch,Board & Executive Coordinator

16Missouri Local Government Employees Retirement System
Introductory Section
Benefits Team Administrative Team
Employer Reporting Team Information Technology Team
Investment Team External Affairs Team
From Left: Danielle Wilbers, Maggie Etter, Dana Eichholz, Tami Jaegers, Tammy Burlbaw, Amanda Stratman, Stephanie Leonard, (not pictured) Leslie Loar, (not pictured) Betty Rutledge
From Left: Melissa Rackers, Jan Kinard, Danielle Plassmeyer, Dale Feeler
From Left: Miranda Fishback, Dennise Schaben, Liz Trabue, Tami Jaegers
From Left: Meghan Gentges, Mya Bernskoetter, Misty Brazzell, Jamie Houk, Richard Allison, Melissa Rackers
From Left: Tyler Luebbert, Derek Trinh, Adam Brown, Brian Collett, Megan Loehner, Ashley Schmitz, Jason Paulsmeyer, Erin Stieferman, Sheila Reinsch
From Left: Angela Lechtenberg, Jeff Kempker, Elizabeth Althoff, Jeff Pabst, Penny Thomas
LAGERS Team

Photo Credit: Local Government Hero FinalistDavid Dunn
Assistant Superintendent (Public Works)City of Monett
FinancialSection 2:
Financial Section
18Missouri Local Government Employees Retirement System
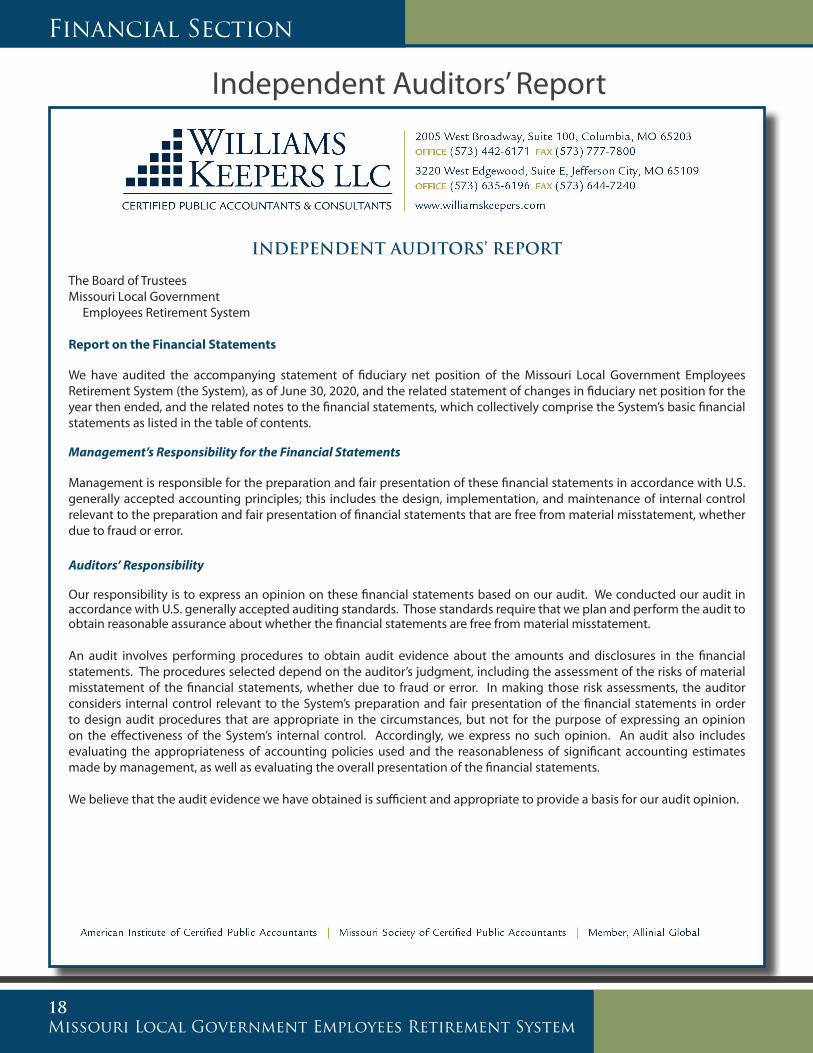
INDEPENDENT AUDITORS’ REPORT
The Board of TrusteesMissouri Local Government Employees Retirement System
Report on the Financial Statements
We have audited the accompanying statement of fiduciary net position of the Missouri Local Government Employees Retirement System (the System), as of June 30, 2020, and the related statement of changes in fiduciary net position for the year then ended, and the related notes to the financial statements, which collectively comprise the System’s basic financial statements as listed in the table of contents.
Management’s Responsibility for the Financial Statements
Management is responsible for the preparation and fair presentation of these financial statements in accordance with U.S. generally accepted accounting principles; this includes the design, implementation, and maintenance of internal control relevant to the preparation and fair presentation of financial statements that are free from material misstatement, whether due to fraud or error.
Auditors’ Responsibility
Our responsibility is to express an opinion on these financial statements based on our audit. We conducted our audit in accordance with U.S. generally accepted auditing standards. Those standards require that we plan and perform the audit to obtain reasonable assurance about whether the financial statements are free from material misstatement.
An audit involves performing procedures to obtain audit evidence about the amounts and disclosures in the financial statements. The procedures selected depend on the auditor’s judgment, including the assessment of the risks of material misstatement of the financial statements, whether due to fraud or error. In making those risk assessments, the auditor considers internal control relevant to the System’s preparation and fair presentation of the financial statements in order to design audit procedures that are appropriate in the circumstances, but not for the purpose of expressing an opinion on the effectiveness of the System’s internal control. Accordingly, we express no such opinion. An audit also includes evaluating the appropriateness of accounting policies used and the reasonableness of significant accounting estimates made by management, as well as evaluating the overall presentation of the financial statements.
We believe that the audit evidence we have obtained is sufficient and appropriate to provide a basis for our audit opinion.
Independent Auditors’ Report
INDEPENDENT AUDITORS’ REPORT The Board of Trustees Missouri Local Government Employees Retirement System Report on the Financial Statements We have audited the accompanying statement of fiduciary net position of the Missouri Local Government Employees Retirement System (the System), as of June 30, 2018, and the related statement of changes in fiduciary net position for the year then ended, and the related notes to the financial statements, which collectively comprise the System’s basic financial statements as listed in the table of contents. Management’s Responsibility for the Financial Statements Management is responsible for the preparation and fair presentation of these financial statements in accordance with U.S. generally accepted accounting principles; this includes the design, implementation, and maintenance of internal control relevant to the preparation and fair presentation of financial statements that are free from material misstatement, whether due to fraud or error. Auditors’ Responsibility Our responsibility is to express an opinion on these financial statements based on our audit. We conducted our audit in accordance with U.S. generally accepted auditing standards. Those standards require that we plan and perform the audit to obtain reasonable assurance about whether the financial statements are free from material misstatement. An audit involves performing procedures to obtain audit evidence about the amounts and disclosures in the financial statements. The procedures selected depend on the auditor’s judgment, including the assessment of the risks of material misstatement of the financial statements, whether due to fraud or error. In making those risk assessments, the auditor considers internal control relevant to the System’s preparation and fair presentation of the financial statements in order to design audit procedures that are appropriate in the circumstances, but not for the purpose of expressing an opinion on the effectiveness of the System’s internal control. Accordingly, we express no such opinion. An audit also includes evaluating the appropriateness of accounting policies used and the reasonableness of significant accounting estimates made by management, as well as evaluating the overall presentation of the financial statements. We believe that the audit evidence we have obtained is sufficient and appropriate to provide a basis for our audit opinion.
INDEPENDENT AUDITORS’ REPORT The Board of Trustees Missouri Local Government Employees Retirement System Report on the Financial Statements We have audited the accompanying statement of fiduciary net position of the Missouri Local Government Employees Retirement System (the System), as of June 30, 2018, and the related statement of changes in fiduciary net position for the year then ended, and the related notes to the financial statements, which collectively comprise the System’s basic financial statements as listed in the table of contents. Management’s Responsibility for the Financial Statements Management is responsible for the preparation and fair presentation of these financial statements in accordance with U.S. generally accepted accounting principles; this includes the design, implementation, and maintenance of internal control relevant to the preparation and fair presentation of financial statements that are free from material misstatement, whether due to fraud or error. Auditors’ Responsibility Our responsibility is to express an opinion on these financial statements based on our audit. We conducted our audit in accordance with U.S. generally accepted auditing standards. Those standards require that we plan and perform the audit to obtain reasonable assurance about whether the financial statements are free from material misstatement. An audit involves performing procedures to obtain audit evidence about the amounts and disclosures in the financial statements. The procedures selected depend on the auditor’s judgment, including the assessment of the risks of material misstatement of the financial statements, whether due to fraud or error. In making those risk assessments, the auditor considers internal control relevant to the System’s preparation and fair presentation of the financial statements in order to design audit procedures that are appropriate in the circumstances, but not for the purpose of expressing an opinion on the effectiveness of the System’s internal control. Accordingly, we express no such opinion. An audit also includes evaluating the appropriateness of accounting policies used and the reasonableness of significant accounting estimates made by management, as well as evaluating the overall presentation of the financial statements. We believe that the audit evidence we have obtained is sufficient and appropriate to provide a basis for our audit opinion.

Financial Section
19Missouri Local Government Employees Retirement System
Opinion
In our opinion, the financial statements referred to above present fairly, in all material respects, the fiduciary net position of the System at June 30, 2020, and the changes in fiduciary net position for the year then ended, in conformity with U.S. generally accepted accounting principles.
Other Matters
Required Supplementary Information
U.S. generally accepted accounting principles require that the management’s discussion and analysis on pages 20 through 23 and the schedules of investment returns, changes in net pension liability, changes in net OPEB liability and related ratios, and employer contributions on pages 45 through 48 be presented to supplement the basic financial statements. Such information, although not a part of the basic financial statements, is required by the Governmental Accounting Standards Board, who considers it to be an essential part of financial reporting for placing the basic financial statements in an appropriate operational, economic, or historical context.
We have applied certain limited procedures to the required supplementary information in accordance with U.S. generally accepted auditing standards, which consisted of inquiries of management about the methods of preparing the information and comparing the information for consistency with management’s responses to our inquiries, the basic financial statements, and other knowledge we obtained during our audit of the basic financial statements. We do not express an opinion or provide any assurance on the information because the limited procedures do not provide us with sufficient evidence to express an opinion or provide any assurance.
Other Information
Our audit was conducted for the purpose of forming an opinion on the financial statements that collectively comprise the Systems’ basic financial statements. The introductory, investment, actuarial and statistical sections as listed in the table of contents and the schedule of operating expenses on page 49 are presented for purposes of additional analysis and are not a required part of the basic financial statements.
The schedule of operating expenses on page 49 is the responsibility of management and was derived from and relates directly to the underlying accounting and other records used to prepare the financial statements. The information on page 49 has been subjected to the auditing procedures applied in the audit of the basic financial statements and certain additional procedures, including comparing and reconciling such information directly to the underlying accounting and other records used to prepare the basic financial statements or to the basic financial statements themselves, and other additional procedures in accordance with U.S. generally accepted auditing standards. In our opinion, the information on page 49 is fairly stated in all material respects in relation to the basic financial statements as a whole.
The introductory, investment, actuarial and statistical sections have not been subjected to the auditing procedures applied in the audit of the basic financial statements
October 22, 2020
INDEPENDENT AUDITORS’ REPORT The Board of Trustees Missouri Local Government Employees Retirement System Report on the Financial Statements We have audited the accompanying statement of fiduciary net position of the Missouri Local Government Employees Retirement System (the System), as of June 30, 2018, and the related statement of changes in fiduciary net position for the year then ended, and the related notes to the financial statements, which collectively comprise the System’s basic financial statements as listed in the table of contents. Management’s Responsibility for the Financial Statements Management is responsible for the preparation and fair presentation of these financial statements in accordance with U.S. generally accepted accounting principles; this includes the design, implementation, and maintenance of internal control relevant to the preparation and fair presentation of financial statements that are free from material misstatement, whether due to fraud or error. Auditors’ Responsibility Our responsibility is to express an opinion on these financial statements based on our audit. We conducted our audit in accordance with U.S. generally accepted auditing standards. Those standards require that we plan and perform the audit to obtain reasonable assurance about whether the financial statements are free from material misstatement. An audit involves performing procedures to obtain audit evidence about the amounts and disclosures in the financial statements. The procedures selected depend on the auditor’s judgment, including the assessment of the risks of material misstatement of the financial statements, whether due to fraud or error. In making those risk assessments, the auditor considers internal control relevant to the System’s preparation and fair presentation of the financial statements in order to design audit procedures that are appropriate in the circumstances, but not for the purpose of expressing an opinion on the effectiveness of the System’s internal control. Accordingly, we express no such opinion. An audit also includes evaluating the appropriateness of accounting policies used and the reasonableness of significant accounting estimates made by management, as well as evaluating the overall presentation of the financial statements. We believe that the audit evidence we have obtained is sufficient and appropriate to provide a basis for our audit opinion.

Financial Section
20Missouri Local Government Employees Retirement System
Management’s Discussion & Analysis (MD&A)Management is pleased to present this overview and analysis of the financial activities of the Missouri Local Government Employees Retirement System (LAGERS) for the year ended June 30, 2020. We encourage readers to consider the information presented in conjunction with the Letter of Transmittal on page 10 of this report, the financial statements, required supplementary information, and supplementary information, which follow the MD&A.
Required Financial Statements
LAGERS, an agent multiple-employer public employee retirement system, prepares its financial statements on an accrual basis in accordance with U.S. generally accepted accounting principles promulgated by the Governmental Accounting Standards Board. The Statement of Fiduciary Net Position indicates the net assets available to pay future benefits and provides a snapshot at a particular point in time. The Statement of Changes in Fiduciary Net Position provides a view of the current year’s additions and deductions from net assets. The Notes to the Financial Statements are necessary for a full understanding of the financial statements. The Required Supplementary Information provides the money-weighted rate of return information. In addition, there is current and historical pension liability information for the LAGERS Staff Retirement Plan and current and historical OPEB liability information for the LAGERS Staff Retiree Healthcare Supplement. Other Supplementary Information provides detailed administrative and investment expense information.
Financial Analysis of LAGERS
LAGERS receivables consist of investments and employer and employee contributions that settle in July 2020. LAGERS had capital assets, net of accumulated depreciation, of $5.8 million. Of the total, $3.7 million is comprised of software needed for pension administration as well as other equipment and furniture, $1.4 million is comprised of buildings and land and $650 thousand is construction in progress. In February 2020, LAGERS purchased an additional building that is adjacent to the current property. This building will be remodeled over the next year and used for meeting space and office space for the investment team and future growth. Deferred outflows and inflows relate to the separate pension and OPEB plans administered by the LAGERS Board of Trustees with the participants being the employees of LAGERS. Liabilities at year-end relate to accrued investment and administrative expenses, securities lending collateral and a revolving line of credit. Liabilities as of June 30, 2020 also consist of the pension liability related to the LAGERS Staff Retirement Plan and the OPEB liability related to the LAGERS Staff Retiree Healthcare Supplement.

Financial Section
21Missouri Local Government Employees Retirement System
Comparative Financial Statements
LAGERS provides retirement, death, and disability benefits to employees of participating political subdivisions. The table below is a summary of LAGERS’ Fiduciary Net Position (in thousands) as of June 30.
This table presents a $16 million decrease in net position. The decrease in net position reflects the investment markets this past year which resulted in a 1.6% annualized return coupled with LAGERS being a mature pension system with negative cash flow. For the 2020 fiscal year, benefit payments and expenses exceeded contributions by $121 million. As a pension fund, LAGERS must retain a long-term investment horizon and the table below presents the returns for such time frames.
Comparative Statement of Fiduciary Net Position
Increase Increase (Decrease) (Decrease) 2020 2019 Amount Percent
Assets Cash $ 11,322 $ 13,303 $ (1,981) (15)% Receivables and accrued income 32,509 35,648 (3,139) (9) Prepaid expenses 62 160 (98) (61) Investments 8,366,382 8,330,011 36,371 0 Invested securities lending collateral 438,645 468,802 (30,157) (6) Capital assets 5,810 5,770 40 1 Total assets $ 8,854,730 $ 8,853,694 $ 1,036 0%Deferred outflow of resources Outflows related to pensions $ 5,758 $ 5,770 $ (12) 0% Outflows related to OPEB 1,057 690 367 53 Total deferred outflow of resources $ 6,815 $ 6,460 $ 355 5%Liabilities Payables and accrued expenses $ 8,691 $ 9,308 $ (617) (7)% Collateral for securities on loan 438,645 468,802 (30,157) (6) Line of credit 250,000 200,000 50,000 25 Net pension liability 2,325 4,818 (2,493) (52) Net OPEB liability 1,055 449 606 135 Total liabilities $ 700,716 $ 683,377 $ 17,339 3%Deferred inflow of resources Inflows related to pensions $ 140 $ 380 $ (240) (63)% Inflows related to OPEB 73 80 (7) (9) Total deferred inflow of resources $ 213 $ 460 $ (247) (54)%Net position restricted for pension benefits $ 8,160,616 $ 8,176,317 $ (15,701) 0%
3 Years 20 Years10 Years5 Years
Annualized Returns 7.4% 6.7% 6.5%9.4%
Financial Section
22Missouri Local Government Employees Retirement System
Management’s Discussion & Analysis (continued)
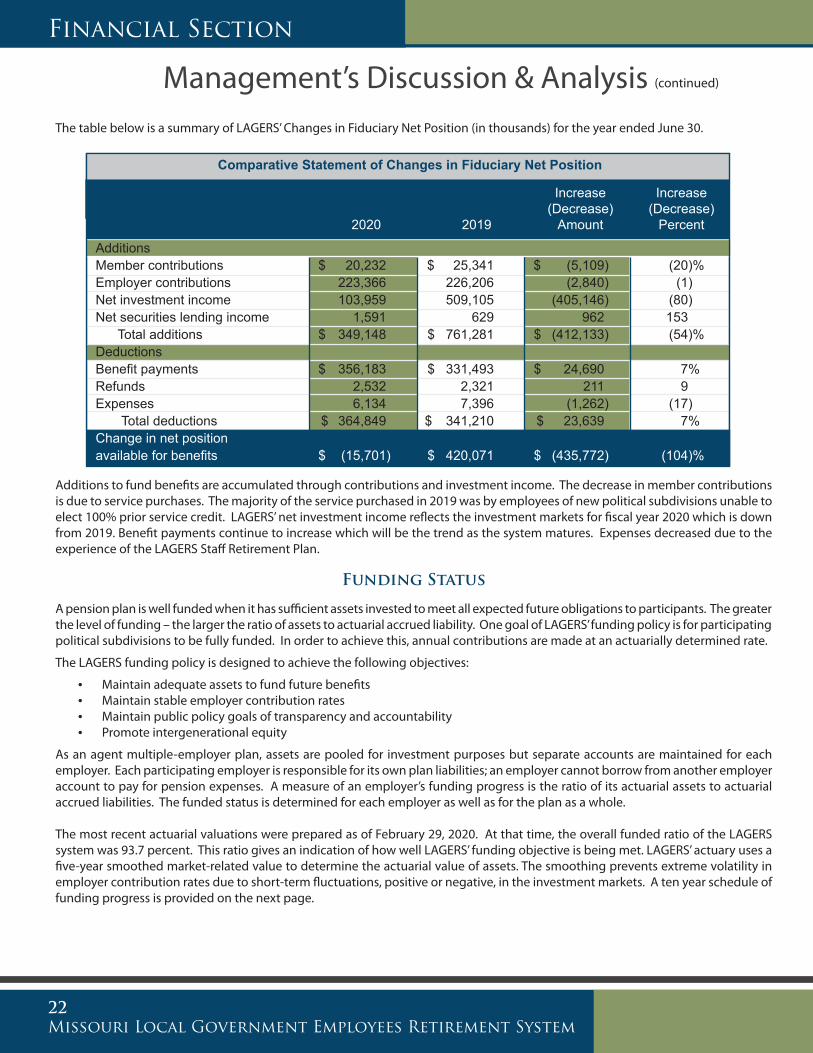
The table below is a summary of LAGERS’ Changes in Fiduciary Net Position (in thousands) for the year ended June 30.
Additions to fund benefits are accumulated through contributions and investment income. The decrease in member contributions is due to service purchases. The majority of the service purchased in 2019 was by employees of new political subdivisions unable to elect 100% prior service credit. LAGERS’ net investment income reflects the investment markets for fiscal year 2020 which is down from 2019. Benefit payments continue to increase which will be the trend as the system matures. Expenses decreased due to the experience of the LAGERS Staff Retirement Plan.
Funding Status
A pension plan is well funded when it has sufficient assets invested to meet all expected future obligations to participants. The greater the level of funding – the larger the ratio of assets to actuarial accrued liability. One goal of LAGERS’ funding policy is for participating political subdivisions to be fully funded. In order to achieve this, annual contributions are made at an actuarially determined rate.
The LAGERS funding policy is designed to achieve the following objectives:
• Maintain adequate assets to fund future benefits• Maintain stable employer contribution rates• Maintain public policy goals of transparency and accountability• Promote intergenerational equity
As an agent multiple-employer plan, assets are pooled for investment purposes but separate accounts are maintained for each employer. Each participating employer is responsible for its own plan liabilities; an employer cannot borrow from another employer account to pay for pension expenses. A measure of an employer’s funding progress is the ratio of its actuarial assets to actuarial accrued liabilities. The funded status is determined for each employer as well as for the plan as a whole.
The most recent actuarial valuations were prepared as of February 29, 2020. At that time, the overall funded ratio of the LAGERS system was 93.7 percent. This ratio gives an indication of how well LAGERS’ funding objective is being met. LAGERS’ actuary uses a five-year smoothed market-related value to determine the actuarial value of assets. The smoothing prevents extreme volatility in employer contribution rates due to short-term fluctuations, positive or negative, in the investment markets. A ten year schedule of funding progress is provided on the next page.
Comparative Statement of Changes in Fiduciary Net Position
Increase Increase (Decrease) (Decrease) 2020 2019 Amount Percent
AdditionsMember contributions $ 20,232 $ 25,341 $ (5,109) (20)%Employer contributions 223,366 226,206 (2,840) (1)Net investment income 103,959 509,105 (405,146) (80)Net securities lending income 1,591 629 962 153 Total additions $ 349,148 $ 761,281 $ (412,133) (54)%Deductions Benefit payments $ 356,183 $ 331,493 $ 24,690 7%Refunds 2,532 2,321 211 9 Expenses 6,134 7,396 (1,262) (17) Total deductions $ 364,849 $ 341,210 $ 23,639 7%Change in net position available for benefits $ (15,701) $ 420,071 $ (435,772) (104)%

Financial Section
23Missouri Local Government Employees Retirement System
LAGERS Schedule of Funding Progress Status Entry Age Unfunded UAL as a Actuarial Actuarial Accrued Annual % of Valuation Value of Accrued Liability Funded Covered Covered Date Assets Liability (UAL) Ratio Payroll Payroll 2-29-20 $ 8,083,990,980 $ 8,630,842,143 $ 546,851,163 93.7% $ 1,787,038,817 30.6% 2-28-19 7,698,244,648 8,113,100,648 414,856,000 94.9 1,682,772,357 24.7 2-28-18 7,297,699,793 7,631,702,645 334,002,852 95.6 1,616,895,524 20.7 2-28-17 6,764,626,389 7,135,950,253 371,323,864 94.8 1,555,729,666 23.9 2-29-16 6,320,171,438 6,671,352,337 351,180,899 94.7 1,507,588,470 23.3 2-28-15 5,972,471,342 6,324,109,191 351,637,849 94.4 1,462,218,216 24.0 2-28-14 5,388,198,677 5,873,910,959 485,712,282 91.7 1,456,008,487 33.4 2-28-13 4,692,218,862 5,423,684,243 731,465,381 86.5 1,395,261,077 52.4 2-29-12 4,274,440,345 5,120,274,198 845,833,853 83.5 1,359,655,784 62.2 2-28-11 3,945,085,880 4,837,423,311 892,337,431 81.6 1,350,646,560 66.1
The chart below represents a distribution of funded percentage of actuarial accrued liability among the participating political subdivisions as of February 28, 2019 and February 29, 2020.
*
*The increase in the number of political subdivisions under 50% is due to the new political subdivisions joining during the 2020 valuation period which totaled 48.

Financial Section
24Missouri Local Government Employees Retirement System
Statement of Fiduciary Net Position
June 30, 2020
AssetsCash $ 11,322,124Receivables:
Member $ 1,556,930Employer 17,246,499Accrued investment income 13,705,652
Total receivables 32,509,081Prepaid expenses 62,286Investments at fair value:
Short-term investments $ 97,473,359Government bonds 629,009,640Corporate bonds 287,267,497International bonds 574,723,283Mortgage and asset-backed securities 251,242,817Domestic stocks 585,816,019International stocks 590,820,794Real estate 982,796,964Partnerships 3,420,332,797Absolute return 844,659,222Other alternative investments 102,239,151
Total investments 8,366,381,543Invested securities lending collateral 438,645,037Capital assets, net of accumulated depreciation of $6,664,347 5,809,597
Total assets $ 8,854,729,668
Deferred outflow of resourcesOutflows related to pension $ 5,758,573 Outflows related to OPEB 1,056,802
Total deferred outflow of resources $ 6,815,375
LiabilitiesAccounts payable and accrued expenses $ 4,404,747Accrued investment expenses 4,286,497Collateral for securities on loan 438,645,037Line of credit 250,000,000 Net pension liability 2,324,847Net OPEB liability 1,054,895 Total liabilities $ 700,716,023
Deferred inflow of resourcesInflows related to pension $ 140,115Inflows related to OPEB 72,997
Total deferred inflow of resources $ 213,112
Net position - restricted for pension benefits $ 8,160,615,908See accompanying notes to financial statements.

Financial Section
25Missouri Local Government Employees Retirement System
Statement of Changes in Fiduciary Net PositionYear Ended June 30, 2020
Reserves
Income Total Member Employer Benefit Casualty (Expense)
Additions
Contributions: Member $ 20,232,107 $ 20,232,107 Employer 223,365,800 $ 214,155,102 $ 9,210,698 Total Contributions $ 243,597,907 $ 20,232,107 $ 214,155,102 $ 9,210,698
Investment income: Interest income $ 62,826,795 $ 62,826,795 Dividend income 27,769,391 27,769,391 Other income 3,439,578 3,439,578 Net appreciation in fair value 87,734,503 87,734,503 Total investment income 181,770,267 181,770,267 Less investment expenses 77,811,587 77,811,587 Net investment income 103,958,680 103,958,680Securities lending income 9,032,861 9,032,861Less securities lending rebates 7,441,485 7,441,485 Net securities lending income 1,591,376 1,591,376 Investment income allocated $ 742,598 $ 51,078,464 $ 53,126,624 $ 1,333,488 $ (106,281,174)Net additions (reductions) $ 349,147,963 $ 20,974,705 $ 265,233,566 $ 53,126,624 $ 10,544,186 $ (731,118)
Deductions
Benefits Paid: Annuity benefits $ 356,183,304 $ 3,187,734 $ 352,995,570 Refunds 2,531,823 $ 2,531,823 Net benefits paid 358,715,127 2,531,823 3,187,734 352,995,570 Annuities awarded 10,848,052 368,412,364 (389,429,134) $ 10,166,585 $ 2,133Administrative expenses 9,356,505 5,860,058 3,496,447 Pension gain (3,293,611) (3,293,611)OPEB expense 71,090 71,090 Net deductions $ 364,849,111 $ 13,379,875 $ 377,460,156 $ (32,937,117) $ 10,166,585 $ (3,220,388)Net increase (decrease)in net position $ (15,701,148) $ 7,594,830 $ (112,226,590) $ 86,063,741 $ 377,601 $ 2,489,270
Net position restricted for pension benefits at June 30, 2019 $ 8,176,317,056 $ 164,715,384 $ 3,878,917,002 $ 4,111,647,822 $ 20,303,597 $ 733,251
Net position restricted for pension benefits at June 30, 2020 $ 8,160,615,908 $ 172,310,214 $ 3,766,690,412 $ 4,197,711,563 $ 20,681,198 $ 3,222,521
See accompanying notes to financial statements.

Financial Section
26Missouri Local Government Employees Retirement System
Notes to Financial Statements(1) Summary of Significant Accounting Policies and Plan Asset MattersBasis of Accounting:
The financial statements were prepared using the accrual basis of accounting. Employee and employer contributions are recognized in the period in which the contributions are due and for which employee services have been rendered. Benefits and refunds are recognized when due and payable in accordance with the terms of the plan. Expenses are recorded when the corresponding liabilities are incurred, regardless of when payment is made.
Use of Estimates:
The preparation of financial statements in conformity with U.S. generally accepted accounting principles (GAAP) requires Missouri Local Government Employees Retirement System (LAGERS) to use estimates and assumptions that affect the accompanying financial statements and disclosures. Actual results could differ from those estimates.
Reporting Entity:
The accompanying financial statements include only the accounts of the LAGERS retirement system pursuant to RSMo 70.605.18 which requires an audit to be performed by a certified public accountant. RSMo 70.605.21 provides the LAGERS Board of Trustees with the authority to govern its own proceedings and administer the LAGERS retirement system. The LAGERS Board of Trustees established retirement and postemployment healthcare plans (Notes (5) and (6)), for its employees who administer the LAGERS retirement system. Such plans are not considered to be part of the reporting entity and thus are not included in the accompanying financial statements beyond the employer reporting requirements of GAAP.
Method Used to Value Investments:
Investments are reported at fair value. Short-term investments are reported at cost, which approximates fair value. Bonds and stocks traded on a national or international exchange are valued at the reported sales price at current exchange rates. Mortgages are valued on the basis of future principal and interest payments, and are discounted at prevailing interest rates for similar instruments. Fair values for alternative investments in timberland and real estate represent net asset value estimates provided by the general partner’s administrators or portfolio managers and are compared to independent appraisals. Investments that do not have an established market are reported at estimated fair value. The fair value of the absolute return and partnership portfolios are based upon the valuations of the underlying companies as determined by the general partner or portfolio manager.
Capital Assets:
The office building, software, equipment and fixtures, which are presented at cost, are depreciated on the straight-line method over the estimated useful lives of the related assets, which have an original cost of $500 or greater. The estimated useful lives are as follows: building -25 years, furniture -8 years, equipment -3 years and internally generated computer software -15 years.
New Accounting Pronouncements:
In January 2017, GASB issued Statement No. 84 – Fiduciary Activities. The objective of this Statement is to improve guidance regarding the identification of fiduciary activities for accounting and financial reporting purposes and how those activities should be reported by the primary government. This Statement is effective for LAGERS’ June 30, 2020 financial statements but was delayed until June 30, 2021 with the issuance of GASB Statement No. 95 issued in May 2020.
In June 2017, GASB issued Statement No. 87 – Leases. The objective of this Statement is to improve accounting and financial reporting for leases by governments. LAGERS does not anticipate this statement will have a material impact to the financial statements.
In June 2018, GASB issued Statement No. 89 – Accounting for Interest Cost Incurred before the End of a Construction Period. The objective of this Statement is (1) to enhance the relevance and comparability of information about capital assets and the cost of borrowing for a reporting period and (2) to simplify accounting for interest cost incurred before the end of a construction period. LAGERS does not borrow funds for construction projects and therefore there is no impact to the financial statements.
(Year Ended June 30, 2020)
Financial Section
27Missouri Local Government Employees Retirement System
(2) Plan DescriptionLAGERS was established in 1967 and is administered in accordance with RSMo. 70.600-70.755. LAGERS is an agent multiple-employer, statewide public employee retirement plan for units of local government which is legally separate and fiscally independent of the State of Missouri.
Responsibility for the operation and administration of the plan is vested in the LAGERS Board of Trustees consisting of seven persons. Three trustees are elected by the employees who participate in the system, three trustees are elected by the members of the governing bodies of those political subdivisions which participate in the system, and one trustee is appointed by the governor of the State of Missouri. The regular term of office for members of the LAGERS Board of Trustees is four years. Members of the LAGERS Board of Trustees serve without compensation with respect to their duties, but are reimbursed by LAGERS for their actual and necessary expenses incurred in the performance of their duties.
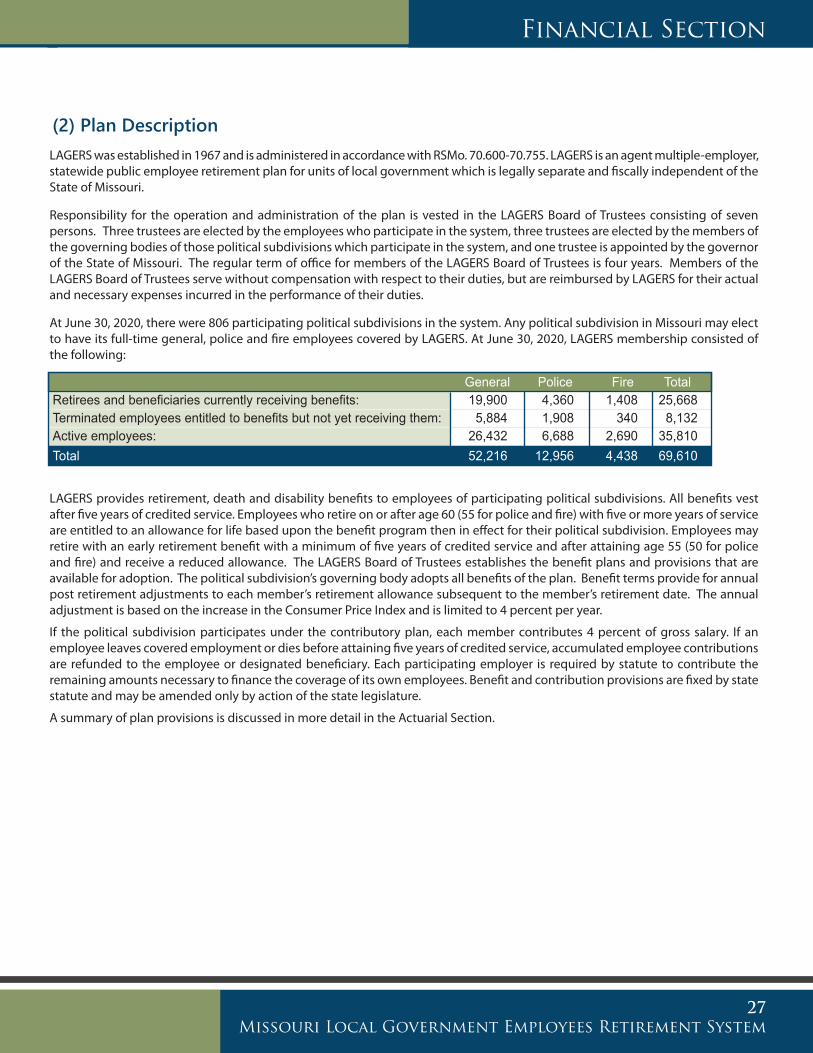
At June 30, 2020, there were 806 participating political subdivisions in the system. Any political subdivision in Missouri may elect to have its full-time general, police and fire employees covered by LAGERS. At June 30, 2020, LAGERS membership consisted of the following:
LAGERS provides retirement, death and disability benefits to employees of participating political subdivisions. All benefits vest after five years of credited service. Employees who retire on or after age 60 (55 for police and fire) with five or more years of service are entitled to an allowance for life based upon the benefit program then in effect for their political subdivision. Employees may retire with an early retirement benefit with a minimum of five years of credited service and after attaining age 55 (50 for police and fire) and receive a reduced allowance. The LAGERS Board of Trustees establishes the benefit plans and provisions that are available for adoption. The political subdivision’s governing body adopts all benefits of the plan. Benefit terms provide for annual post retirement adjustments to each member’s retirement allowance subsequent to the member’s retirement date. The annual adjustment is based on the increase in the Consumer Price Index and is limited to 4 percent per year.
If the political subdivision participates under the contributory plan, each member contributes 4 percent of gross salary. If an employee leaves covered employment or dies before attaining five years of credited service, accumulated employee contributions are refunded to the employee or designated beneficiary. Each participating employer is required by statute to contribute the remaining amounts necessary to finance the coverage of its own employees. Benefit and contribution provisions are fixed by state statute and may be amended only by action of the state legislature.
A summary of plan provisions is discussed in more detail in the Actuarial Section.
General Police Fire TotalRetirees and beneficiaries currently receiving benefits: 19,900 4,360 1,408 25,668Terminated employees entitled to benefits but not yet receiving them: 5,884 1,908 340 8,132Active employees: 26,432 6,688 2,690 35,810Total 52,216 12,956 4,438 69,610

Financial Section
28Missouri Local Government Employees Retirement System
(3) Investments and DepositsThe LAGERS Board of Trustees has the fiduciary responsibility and authority to oversee the investment portfolio. The purpose of LAGERS’ investment fund is to accumulate the financial reserves necessary to provide for the retirement or pensioning of employees and beneficiaries of member political subdivisions in the state of Missouri. Various professional investment managers are contracted to manage the LAGERS’ assets. Investment decisions are subject to statutory regulations and the Statement of Investment Policy and Objectives adopted by the LAGERS Board of Trustees.
LAGERS’ asset allocation is an important determinant of achieving the investment goals of the fund. An asset allocation study is conducted at least every five years to assess portfolio construction and design. Factors influencing the allocation include project-ing actuarial liabilities, historical and expected long-term market returns and risk, future economic conditions, inflation and interest rate risks and liquidity requirements.
Investment manager selection is an important decision involving complex due diligence. Managers are selected after a lengthy and time consuming process involving a review of the quantitative and qualitative components as well as the manager’s investment process. Once selected, managers are monitored and reviewed for investment performance.
Other investment processes and procedures include daily capital calls, cash flow reconciliations, trade settlements, weekly portfolio review, monthly account reconciliations, performance reporting and reviews, quarterly conference calls and asset reallocation reviews.
A summary of the investment policy can be found on pages 55-60.
The annual money weighted rate of return on pension plan investments is calculated as the internal rate of return on pension plan investments, net of investment expenses. This expresses investment performance adjusted for the changing amounts actually in-vested throughout the year, measured on monthly inputs with expenses measured on an accrual basis. For the fiscal year 2020, the annual money weighted rate of return net of investment expenses measured on monthly inputs was 1.60 percent.
There are no investment funds where the portfolio of the fund exceeds 5 percent of the fiduciary net position.
Deposits:
Custodial credit risk for deposits is the risk that, in the event of a financial institution failure, LAGERS' deposits may not be returned. The deposits are held in one financial institution with a balance of up to $250,000 insured by the Federal Deposit Insurance Corpora-tion (FDIC). LAGERS mitigates custodial credit risk for deposits by requiring the bank to pledge securities in an amount over the FDIC insured amount at least equal in fair value to 100 percent of the aggregate amount of the deposits. These securities are required to be delivered to a third party institution mutually agreed upon by the bank and LAGERS.
Investment Policies:
The Missouri Revised Statutes prescribe the “prudent person rule” as LAGERS investment authority. The rule requires LAGERS to make investments with the same care, skill, prudence, and diligence under the circumstances then prevailing that a prudent person acting in a similar capacity and familiar with those matters would use in the conduct of a similar enterprise with similar aims. Within the “prudent person” framework, the Board of Trustees adopts investment guidelines for LAGERS investment managers that are included within the respective management agreements. The Investment Section contains a summary of these guidelines.
(continued)Notes to Financial Statements

Financial Section
29Missouri Local Government Employees Retirement System
Investment Summary:
The following table presents the summary of LAGERS investments by type at June 30, 2020.
LAGERS values these investments in good faith based upon audited financial statements or other information provided to LAGERS by the underlying investment managers. The estimated fair value of these investments may differ significantly from values that would have been used had a ready market existed.
Fair Value Measurements:
LAGERS categorizes their fair value measurements within the fair value hierarchy established by generally accepted accounting principles. The hierarchy is based on the valuation inputs used to measure the fair value of the asset and give the highest priority to unadjusted quoted prices in active markets for identical assets or liabilities (level 1 measurements) and the lowest priority to unobservable inputs (level 3 measurements).
Level 1 Unadjusted quoted prices for identical instruments in active markets.
Level 2 Quoted prices for similar instruments in active markets; quoted prices for identical or similar instruments in markets that are not active; and model-derived valuations in which all significant inputs are observable.
Level 3 Valuations derived from valuation techniques in which significant inputs are unobservable.
Investments that are measured at fair value using the net asset value per share (or its equivalent) as a practical expedient are not classified in the fair value hierarchy.
In instances where inputs used to measure fair value fall into different levels in the fair value hierarchy, fair value measurements in their entirety are categorized based on the lowest level input that is significant to the valuation. The System assessment of the significance of particular inputs to these fair value measurements requires judgment and considers factors specific to each asset or liability. The table on pages 30 and 31 shows the fair value leveling of the investments for the System.
The categorization of investments within the hierarchy is based upon the pricing transparency of the instrument and should not be perceived as the particular investment’s risk.
Assets classified in Level 1 of the fair value hierarchy are valued directly from a predetermined primary external pricing vendor. Assets classified in Level 2 are subject to pricing by an alternative pricing source due to lack of information available by the primary vendor. Real estate and Partnership assets classified in Level 3, due to lack of an independent pricing source, are valued using an internal fair value as provided by the investment manager.
The investments listed below are not listed on national exchanges, over-the-counter markets, nor do they have quoted market prices available.
Short-term investments $ 97,473,359 Government bonds 629,009,640 Corporate bonds 287,267,497 International bonds 574,723,283 Mortgages & asset backed securities 251,242,817 Domestic stocks 585,816,019 International stocks 590,820,794 Real estate 982,796,964 Partnerships 3,420,332,797 Absolute return 844,659,222 Other alternative investments 102,239,151 Total $ 8,366,381,543
Bank loans $ 75,347,522* Partnerships 3,420,332,797 Real estate 982,796,964 Absolute return 844,659,222Total $ 5,323,136,505
*Bank loans are included in corporate bonds in the investment summary.

Financial Section
30Missouri Local Government Employees Retirement System
Fair Value Level 1 Level 2 Level 3
Investments by fair value levelUS government bonds Government bonds $ 340,217,124 $ 340,217,124 Municipal/provincial bonds 7,585,642 7,585,642 Index linked government bonds 281,219,619 281,219,619 Fixed income derivatives - options (12,745) (11,510) $ (1,235)Total US government bonds $ 629,009,640 $ 629,010,875 $ (1,235)
US corporate bonds Bank loans $ 75,347,522 $ 959,950 $ 74,387,572 Corporate bonds 83,536,581 79,929,081 3,607,500Total US corporate bonds $ 158,884,103 $ 80,889,031 $ 77,995,072
International bonds Corporate bonds $ 124,471,782 $ 124,471,782 Corporate convertible bonds 4,513,671 4,513,671 Fixed income derivatives - options (669) (669) Funds - fixed income ETF 3,753,673 $ 3,753,673 Government agencies 10,465,378 10,465,378 Government bonds 135,750,741 135,750,741 Index linked government bonds 289,684,189 229,636,196 $ 60,047,993 Municipal/provincial bonds 5,757,992 5,757,992 Sukuk 326,526 326,526 Total international bonds $ 574,723,283 $ 3,753,673 $ 510,921,617 $ 60,047,993
Mortgages & asset backed securities Asset backed securities $ 97,310,347 $ 34,981,597 $ 62,328,750 Commercial mortgage backed 3,975,770 3,975,770 Government mortgage backed 129,120,262 129,120,262 Gov't-issued commercial mortgage backed 301,665 301,665 Non-government backed C.M.O.s 20,534,773 20,534,773 Total mortgages & asset backed securities $ 251,242,817 $ 188,914,067 $ 62,328,750
Domestic stock Common stock $ 546,177,821 $ 541,394,050 $ 12,805 $ 4,770,966 Funds - equities ETF (265,190) (265,190) Preferred stock 39,903,604 39,903,604 Rights/warrants (216) (216) Total domestic stock $ 585,816,019 $ 541,128,644 $ 12,805 $ 44,674,570
Investments and Derivative Instruments Measured at Fair Value
(continued)Notes to Financial Statements

Financial Section
31Missouri Local Government Employees Retirement System
Fair Value Level 1 Level 2 Level 3
Investments by fair value level
International stock Common stock $ 427,139,855 $ 426,308,370 $ 123,817 $ 707,668 Funds - common stock 1,214,090 1,214,090 Funds - equities ETF 4,410,253 4,410,253 Other equity assets 806,287 806,287 Preferred stock 893,224 893,224 Rights/warrants 65,271 65,271 Stapled securities (1,199,157) (1,199,157) Total international stock $ 433,329,823 $ 432,498,338 $ 123,817 $ 707,668
Other alternative investments Exchange cleared swaps - other assets $ (683,601) $ (683,601) Other options (190,103) (190,103) Swaps 59,077,428 45,338,710 $ 13,738,718 Miscellaneous 44,035,427 14,560 44,020,867 Total other alternative investments $ 102,239,151 $ 44,479,566 $ 57,759,585
Real estate $ 982,796,964 $ 982,796,964
Partnerships $ 3,420,332,797 $ 3,420,332,797
Total investment measured at fair value level $ 7,138,374,597 $ 977,380,655 $ 1,454,351,778 $ 4,706,642,164Investments exempt from fair value hierarchy Short term investments $ 97,473,359 Total investments exempt $ 97,473,359
Investments measured at the net asset value (NAV) US corporate bonds $ 128,383,394 International stocks 157,490,971 Absolute return 844,659,222 Total investments measured at the NAV $ 1,130,533,587
Total investments measured at fair value $ 8,366,381,543
Investments and Derivative Instruments Measured at Fair Value (continued)

Financial Section
32Missouri Local Government Employees Retirement System
Investments Measured at the NAV
Fair Value Strategy Type
Fund Life of Non-
redeemable mandates
Unfunded Commitments
Redemption Frequency (if currently
eligble)Redemption
Notice Period
Other Redemption Restrictions
Restriction Time
Remaining
US corporate bonds
Funds - corporate bond $ 39,098,774 Active global
fixed income N/A Daily, monthly 1 - 5 days N/A N/A
Funds - other fixed income 89,284,620 Active US fixed
income N/A Daily 1 day N/A N/A
International stocks
Funds - common stock 157,490,971 Active EM
equity N/A Daily 1 day N/A N/A
Absolute return
Hedge equity 127,827,419 Market neutral N/A Monthly 5 - 60 days N/A N/A
Hedge event driven 50,056,438 Multi-strategy N/A Quarterly 60 days 1 yr initial lock-up N/A
Hedge market dependent 93,096,609
Managed futures, market neutral
N/A Weekly, monthly 1 - 5 days N/A N/A
Hedge market independent 370,458,253 Market neutral N/A Monthly 10 days $1mm
minimum N/A
Hedge multi strategy 203,220,503 Market neutral N/A Monthly 5 days N/A N/A
Total investments measured at the NAV $1,130,533,587
(continued)Notes to Financial Statements
The valuation method for investments measured at the net asset value (NAV) per share (or its equivalent) is presented in the table above.
• Absolute Return: This asset class provides diversification to the total portfolio and strives to reduce total fund volatility while also enhancing the total return of the portfolio. The strategies underlying this asset class commonly are referred to as hedge funds, which are investment funds that can undertake a wider range of investment and trading activities than other mandates. Most often, hedge funds as a class will trade liquid securities on public markets but may also engage in private transactions. The following sub-asset classes contain hedge funds and their strategies are explained in greater detail on the next page:
Financial Section
33Missouri Local Government Employees Retirement System
• Hedge Equity. This sub-asset class contains three funds in which the strategy is considered Market Neutral. It attempts to exploit pricing inefficiencies between related securities, balancing long and short exposures helping to reduce market risk.
• Hedge Event Driven. This sub-asset class is a hedge fund investment strategy that seeks to exploit pricing inefficiencies that may occur before or after a corporate event, such as an earnings call, bankruptcy, merger, acquisition, or spinoff. Event-driven investing strategies are typically used only by sophisticated investors, such as hedge funds and private equity firms because traditional equity investors, including managers of equity mutual funds, do not have the expertise or access to information necessary to properly analyze the risks associated with many of these corporate events.
• Hedge Market Dependent. This sub-asset class contains two funds. One fund has a Managed Futures strategy, using tools like futures and options to gain the necessary exposure to equities, bonds, rates, currencies, and commodities to implement a long term trend following and directional strategy. The other fund has a Market Neutral strategy. It attempts to exploit pricing inefficiencies between related securities, balancing long and short exposures helping to reduce market risk.
• Hedge Market Independent. This sub-asset class contains one fund in which the strategy is considered Market Neutral. It attempts to exploit pricing inefficiencies between related securities, balancing long and short exposures helping to reduce market risk.
• Hedge Multi Strategy. This sub-asset class contains three funds in which the strategy is considered Market Neutral. It attempts to exploit pricing inefficiencies between related securities, balancing long and short exposures helping to reduce market risk.
Custodial Credit Risk for Investments:
The custodial credit risk for investments is the risk that, in the event of the failure of the counterparty to a transaction, LAGERS will not be able to recover the value of investments or collateral securities that are in the possession of an outside party. LAGERS does not have a formal policy for custodial credit risk. As of June 30, 2020, investments in the amount of $18,802,970 were uninsured and unregistered, with securities held by the counter party or by its trust department or agent but not in LAGERS name.
Concentration of Credit Risk:
Concentration of credit risk is the risk of loss that may be attributed to the magnitude of a government’s investment in a single issue. External investment management firms manage the fixed income portfolio. The allocation of assets among various asset classes is set by the Board with the objective of optimizing the investment return of LAGERS with framework of acceptable risk and diversification. As of June 30, 2020, no single issue exceeded 5 percent of the portfolio, excluding U.S. government securities.

Financial Section
34Missouri Local Government Employees Retirement System
Notes to Financial Statements (continued)
Credit Risk:
Credit risk is the risk that an issuer or other counterparty to an investment will not fulfill its obligations to LAGERS. LAGERS does not have a formal policy relating to credit risk. At June 30, 2020, 39 percent of the underlying fixed income assets represent obligations that are not guaranteed by the U.S. government. Below is a list of fixed income credit qualities.
Interest Rate Risk
Interest rate risk is the risk that changes in interest rates will adversely affect the fair value of an investment. Duration is a measure of a debt instrument’s exposure to a change in interest rates and the related sensitivity of market price to parallel shifts in the yield curve. It uses the present value of cash flows, weighted for those cash flows as a percentage of the instruments’ full price. LAGERS does not have a formal policy relating to interest rate risk. LAGERS benchmarks for the fixed income portfolio include the Consumer Price Index plus 4 percent (Private Fixed Income), Barclays Capital US Aggregate Bond Index, Barclays Capital Global Aggregate Bond Index, Barclays Capital US 20+ Year Treasury Bond Index, and 33.33% JP Morgan EMBI Global Diversified, 33.33% JP Morgan GBI-EM Global Diversified, 33.33% JP Morgan CEMBI Broad Diversified (Emerging Market Debt Blend). At June 30, 2020, the effective duration for the fixed income benchmark portfolio was 4.5 years, whereas, the LAGERS fixed income portfolio had an effective duration of 7.7 years.
Foreign Currency Risk:
The international portfolio is constructed on the principles of diversification, quality, value and growth. Risk of loss arises from changes in currency exchange rates. LAGERS’ external managers may or may not hedge the portfolio’s foreign currency exposures with cur-rency forward contracts depending upon their views on a specific foreign currency relative to the U.S. dollar. Currency trading may not be used for speculative purposes. LAGERS does not have a formal policy relating to foreign currency risk, as this is handled at the manager level. LAGERS exposure to foreign currency risk can be found on the next page:
Investment Fair Value Duration RateGovernment bonds $ 1,070,993,797 11.6 yearsCorporate bonds 420,006,623 3.1 yearsMortgage/asset backed securities 251,242,817 1.6 years
Total $ 1,742,243,237
Non-Investment AAA+/- AA+/- A+/- BBB+/- Grade/Not Rated Total
US corporate bonds $ 11,043,474 $ 11,148,998 $ 265,075,025# $ 287,267,497 US government bonds $ 614,584,326 6,045,153 8,380,161 629,009,640International bonds $ 55,268,808 89,986,845 79,741,791 95,834,018 253,891,821 574,723,283 Mortgage/asset backed securities 1,182,048 250,060,769 251,242,817
#Non-investment grade/not rated corporate bonds include investments in corporate bond funds, which include individually rated securities but are not rated at the fund level, as well as bank loans. As of June 30, 2020, corporate bond funds totaled $39,098,774 and bank loans totaled $75,347,522.
Quality Rating

Financial Section
35Missouri Local Government Employees Retirement System
ForeignCurrency Foreign Equities Fixed Income TotalAustralian dollar $ (60,831) $ 7,401,837 $ 7,341,006 Argentine peso - 656,405 656,405 Brazilian real 19,127,623 68,450,177 87,577,800 British pound 22,683,393 27,609,442 50,292,835 Canadian dollar 13,205,886 11,448,407 24,654,293 Chilean peso 291,386 13,474,135 13,765,521 Chinese yuan renminbi (offshore) 5,132,113 5,045 5,137,158 Chinese yuan renminbi - 2,366,214 2,366,214 Colombian peso 825,720 14,000,829 14,826,549 Czech koruna - 535,751 535,751 Danish krone 5,379,831 1,617,526 6,997,357 Egyptian pound 465,803 1,563,691 2,029,494 Euro 85,051,566 110,596,814 195,648,380 Hong Kong dollar 51,399,066 794,845 52,193,911 Hungarian forint 1,071,634 234,182 1,305,816 Indonesian rupiah 3,734,891 12,338,730 16,073,621 Indian rupee 20,949,780 5,181,198 26,130,978 Israeli shekel 118,779 7,541,769 7,660,548 Japanese yen 30,643,149 28,536,854 59,180,003 Kazakhstan tenge - 578,682 578,682 Kuwaiti dinar - 10 10 Malaysian ringgit 3,627,464 708,481 4,335,945 Mexican peso 2,170,998 59,612,136 61,783,134 New Zealand dollar (287,419) 2,503,609 2,216,190 Nigerian naira 463,942 121,377 585,319 Norwegian krone 3,453,484 2,122,325 5,575,809 Pakistan rupee 1,769,022 4,798 1,773,820 Peruvian Nuevo sol - 5,336,258 5,336,258 Philippine peso 1,366,827 817,663 2,184,490 Polish zloty 4,102,803 1,045,191 5,147,994 Qatari riyal 160,105 - 160,105 Romanian leu - 530,728 530,728 Russian ruble - 10,535,277 10,535,277 Singapore dollar 297,645 1,221,554 1,519,199 South African rand 3,920,546 14,139,706 18,060,252 South Korean won 42,081,561 3,004,180 45,085,741 Swedish krona 3,926,852 7,648,088 11,574,940 Swiss franc 18,066,436 2,270,004 20,336,440 Taiwan dollar 53,118,683 2,050,371 55,169,054 Thai baht 5,160,393 11,866,681 17,027,074 Turkish lira 5,908,219 1,606,558 7,514,777 United Arab Emirates dirham 1,073,731 148,378 1,222,109 Uruguayan peso - 122,201 122,201 Vietnamese dong - 490,632 490,632 $ 410,401,081 $ 442,838,739 $ 853,239,820

Financial Section
36Missouri Local Government Employees Retirement System
Notes to Financial Statements
Notional Value Unrealized Gain (Loss)Futures $ 1,161,260,635 Swaps 386,762,108 $ 59,606,295Forwards Foreign exchange contracts 610,133,466 (136,936)Options
Margined options 29,735 Caps and floors 167,773 42,245Options 17,735,449 66,758Options on futures 20,000,000 7,041Swaptions 99,799,070 (58,257) $ 2,295,888,236 $ 59,527,146
Derivatives
Derivative instruments are financial contracts whose values depend on the values of one or more underlying assets, reference rates, or financial indexes. They include futures contracts, swap contracts, options contracts, and forward foreign currency exchange con-tracts. The tables below summarize the various contracts in the portfolio as of June 30, 2020.
Through LAGERS external managers, LAGERS holds investments in futures contracts, swap contracts, option contracts, and forward foreign currency exchange contracts. LAGERS enters futures and swaps contracts to gain exposure to certain markets and to manage interest rate risk and enters into forward foreign exchange contracts primarily to hedge foreign currency exposure.
The notional values associated with these derivative instruments are generally not recorded in the financial statements; however, the amounts for the exposure of these instruments are recorded in the Statement of Fiduciary Net Position and the total changes in fair value for the year are included as investment income in the Statement of Changes in Fiduciary Net Position. For the year ended June 30, 2020, the change in fair value in futures contracts resulted in $0.8 million of investment loss, options contracts resulted in $1.4 million of investment income, swaps contracts resulted in $74.4 million of investment loss, and forwards contracts resulted in $17.4 million of investment loss. LAGERS does not anticipate additional significant market risk from the swap arrangements.
(continued)
Quality Rating Forwards Swaps Options TotalA+ $ 57,671,207 $ (195,202) $ 57,476,005 A 636,562 (8,436) 628,126 A- 3,075,718 3,075,718BBB+ 63,071 (981) 62,090 Not available or not rated $ (136,936) (3,054,376) 10,906 (3,180,406)Total subject to credit risk $ (136,936) $ 58,392,182 $ (193,713) $ 58,061,533
LAGERS could be exposed to risk if the counterparties to the contracts are unable to meet the terms of the contracts. LAGERS anticipates that the counterparties will be able to satisfy their obligations under the contracts.
At June 30, 2020, the counterparties’ credit ratings for futures, forwards, swaps, and options are subject to credit risk as shown in the table below. Derivative instruments traded on the exchange are not subject to counterparty risk and therefore are not included in the table below.
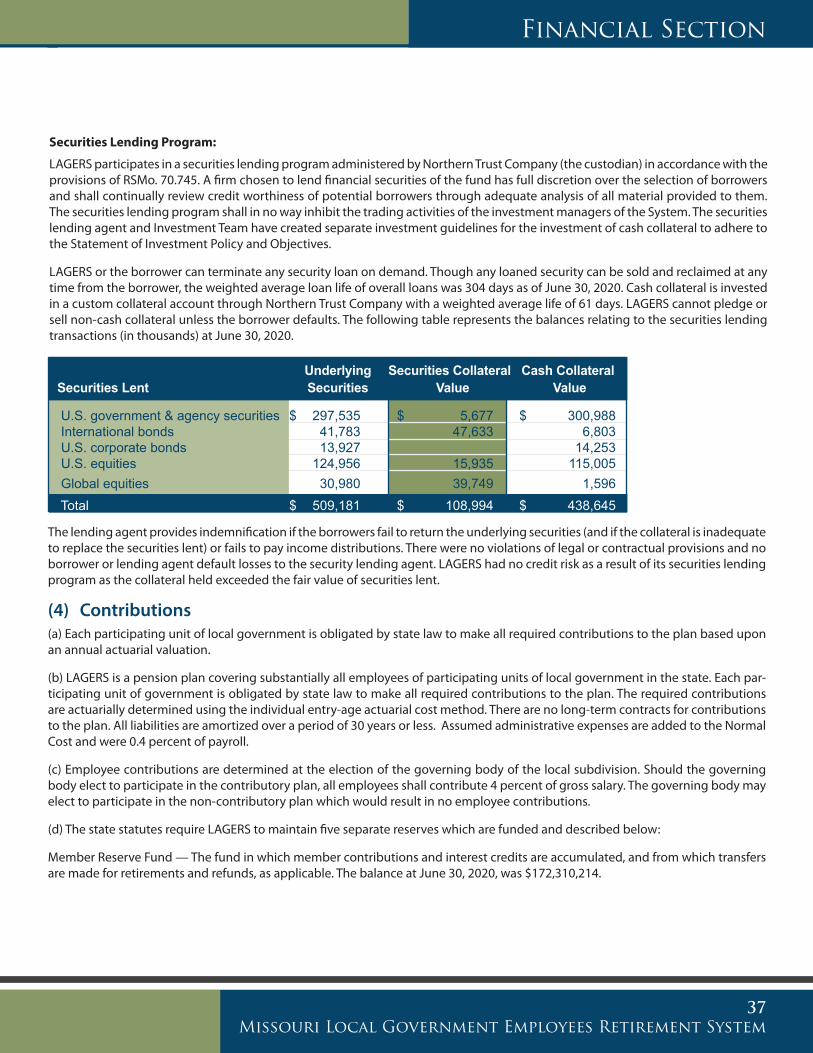
Financial Section
37Missouri Local Government Employees Retirement System
The lending agent provides indemnification if the borrowers fail to return the underlying securities (and if the collateral is inadequate to replace the securities lent) or fails to pay income distributions. There were no violations of legal or contractual provisions and no borrower or lending agent default losses to the security lending agent. LAGERS had no credit risk as a result of its securities lending program as the collateral held exceeded the fair value of securities lent.
(4) Contributions(a) Each participating unit of local government is obligated by state law to make all required contributions to the plan based upon an annual actuarial valuation.
(b) LAGERS is a pension plan covering substantially all employees of participating units of local government in the state. Each par-ticipating unit of government is obligated by state law to make all required contributions to the plan. The required contributions are actuarially determined using the individual entry-age actuarial cost method. There are no long-term contracts for contributions to the plan. All liabilities are amortized over a period of 30 years or less. Assumed administrative expenses are added to the Normal Cost and were 0.4 percent of payroll.
(c) Employee contributions are determined at the election of the governing body of the local subdivision. Should the governing body elect to participate in the contributory plan, all employees shall contribute 4 percent of gross salary. The governing body may elect to participate in the non-contributory plan which would result in no employee contributions.
(d) The state statutes require LAGERS to maintain five separate reserves which are funded and described below:
Member Reserve Fund — The fund in which member contributions and interest credits are accumulated, and from which transfers are made for retirements and refunds, as applicable. The balance at June 30, 2020, was $172,310,214.
Underlying Securities Collateral Cash CollateralSecurities Lent Securities Value Value
U.S. government & agency securities $ 297,535 $ 5,677 $ 300,988 International bonds 41,783 47,633 6,803 U.S. corporate bonds 13,927 14,253 U.S. equities 124,956 15,935 115,005 Global equities 30,980 39,749 1,596 Total $ 509,181 $ 108,994 $ 438,645
Securities Lending Program:
LAGERS participates in a securities lending program administered by Northern Trust Company (the custodian) in accordance with the provisions of RSMo. 70.745. A firm chosen to lend financial securities of the fund has full discretion over the selection of borrowers and shall continually review credit worthiness of potential borrowers through adequate analysis of all material provided to them. The securities lending program shall in no way inhibit the trading activities of the investment managers of the System. The securities lending agent and Investment Team have created separate investment guidelines for the investment of cash collateral to adhere to the Statement of Investment Policy and Objectives.
LAGERS or the borrower can terminate any security loan on demand. Though any loaned security can be sold and reclaimed at any time from the borrower, the weighted average loan life of overall loans was 304 days as of June 30, 2020. Cash collateral is invested in a custom collateral account through Northern Trust Company with a weighted average life of 61 days. LAGERS cannot pledge or sell non-cash collateral unless the borrower defaults. The following table represents the balances relating to the securities lending transactions (in thousands) at June 30, 2020.

Financial Section
38Missouri Local Government Employees Retirement System
Employer Reserve Fund — The fund in which employer contributions and interest credits are accumulated, and from which transfers are made to pay applicable benefits. The fund from which contributions are accumulated and benefit payments in excess of IRC Section 415 are made. The balance at June 30, 2020, was $3,766,690,412.
Benefit Reserve Fund — The fund from which all retirement, disability, survivor and certain deferred retirants due to Legacy Plans benefits are paid. At the time of retirement, this fund receives the necessary transfers to pay such benefits. All retired individuals and the assets of this fund become the sole responsibility of the LAGERS Board of Trustees and result in no further liabilities to the previous employers. The balance at June 30, 2020, was $4,197,711,563.
Casualty Reserve Fund — The fund in which the employer contributions and interest credits are accumulated and from which trans-fers are made to pay for members retired as a result of disability or whose death is duty related. The balance at June 30, 2020 was $20,681,198.
Income-Expense Reserve Fund — The fund which accumulates the investment income and pays the administrative expenses of the system. This fund provides for the transfer of administrative expenses and investment credits to the other reserves of the system. The remaining balance at June 30, 2020 was $3,222,521, which is equal to the net of the current year pension gain and OPEB expense for the LAGERS Staff Retirement Plan and LAGERS Postemployment Benefit Plan, respectively.
(5) LAGERS Staff Retirement PlanSummary of Significant Accounting Polices
Pensions. For purposes of measuring the net pension liability, deferred outflows of resources and deferred inflows of resources related to pensions, and pension expense, information about the fiduciary net position of the LAGERS Staff Retirement Plan (LSRP) and additions to/deductions from LSRP fiduciary net position have been determined on the same basis as they are reported by the LSRP. For this purpose, benefit payments are recognized when due and payable in accordance with the benefit terms. Investments are reported at fair value.
General Information about the Pension Plan
Plan description. The LSRP is a single-employer defined benefit pension plan administered by the LAGERS Board of Trustees. The plan provides retirement, death and disability benefits to LAGERS employees and beneficiaries. The plan document is controlled by the LAGERS Board of Trustees.
Benefits provided. The LSRP provides retirement, death and disability benefits. Benefit provisions are adopted by the LAGERS Board of Trustees. All benefits vest after five years of credited service. Employees who retire on or after age 60 with five or more years of service are entitled to an allowance for life based upon the benefit program information provided below. Employees may retire with an early retirement benefit with a minimum of five years of credited service and after attaining age 55 and receive a reduced allowance.
Benefit terms provide for annual post retirement adjustments to each member’s retirement allowance subsequent to the member’s retirement date. The annual adjustment is based on the increase in the Consumer Price Index and is limited to 4 percent each year.
(continued)Notes to Financial Statements
Benefit Multiplier 2%Final Average Salary 3 YearsMember Contributions 0%

Financial Section
39Missouri Local Government Employees Retirement System
Employees covered by benefit terms. At June 30, 2020, the following employees were covered by the benefit terms:
Contributions. LAGERS is required to contribute amounts at least equal to the actuarially determined rate. The actuarially determined rate is the estimated amount necessary to finance the cost of benefits earned by employees during the year, with an additional amount to finance an unfunded accrued liability. Full-time employees do not contribute to the pension plan. The employer contribution rate was 17.79 percent of annual covered payroll.
Net Pension Liability. The employer’s net pension liability was measured as of June 30, 2020, and the total pension liability used to calculate the net pension liability was determined by an actuarial valuation as of June 30, 2020.
Actuarial assumptions. The total pension liability in the June 30, 2020, actuarial valuation was determined using the following actuarial assumptions, applied to all periods included in the measurement:
Mortality rates were based on the RP-2014 mortality table for males and females, adjusted for mortality improvement back to the observation period base year of 2006.
The actuarial assumptions used in the June 30, 2020, valuation were based on the results of an actuarial experience study for the period March 1, 2010, through February 28, 2015.
The long-term expected rate of return on pension plan investments was determined using a model method in which the best-estimate ranges of expected future real rates of return (expected returns, net of investment expenses and inflation) are developed for each major asset class. These ranges are combined to produce the long-term expected rate of return by weighting the expected future real rates of return by the target asset allocation percentage and by adding expected inflation. The target allocation and a weighted average of the geometric real rates of return for each major asset class rollup are summarized in the following table:
Discount rate. The discount rate used to measure the total pension liability is 5.5 percent. The projection of cash flows used to determine the discount rate assumes that employer contributions will be made at the actuarially determined rates. Based on these assumptions, the pension plan’s fiduciary net position was projected to be available to pay all projected future benefit payments of current active and inactive employees. Therefore, the long-term expected rate of return on pension plan investments was applied to all periods of projected benefit payment to determine the total pension liability.
Inflation 3.25%Salary increase 3.25% to 6.55%, including wage inflationInvestment rate of return 5.50%
Target Long-Term Expected Asset Class Allocation Real Rate of Return Equity 39.00% 4.16% Fixed income 28.00 0.89 Real assets/real return 33.00 2.09
Retirees or beneficiaries currently receiving benefits 12 Inactive employees entitled to but not yet receiving benefits 1 Active employees 36 Total 49

Financial Section
40Missouri Local Government Employees Retirement System
Increase (Decrease) Total Pension Plan Fiduciary Net Pension Liability Net Position Liability (a) (b) (a) - (b)Balances at June 30, 2019 $ 18,879,856 $ 14,062,101 $ 4,817,755
Changes for the yearService cost 622,944 622,944 Interest 1,041,285 1,041,285 Difference between expected and actual experience 406,366 406,366Assumption changes* 64,570 64,570 Contributions - employer 4,572,434 (4,572,434)Net investment income 55,639 (55,639)Benefit payments including refunds (517,753) (517,753) Net changes 1,617,412 4,110,320 (2,492,908)Balances at June 30, 2020 $ 20,497,268 $ 18,172,421 $ 2,324,847
*New assumption regarding promotions
Sensitivity of the net pension liability to changes in the discount rate. The following presents the Net Pension Liability of the employer, calculated using the discount rate of 5.5 percent, as well as what the employer’s Net Pension Liability would be using a discount rate that is 1 percentage point lower (4.5%) or one percentage point higher (6.5%) than the current rate.
Plan fiduciary net position. Detailed information about the plan’s fiduciary net position is available in the separately issued financial statements. The LAGERS Board of Trustees issues a publicly available audited financial report that includes financial statements and required supplementary information for the LSRP. This report can be obtained by contacting the LAGERS office.
Pension Expense and Deferred Outflows of Resources and Deferred Inflows of Resources Related to Pensions For the year ended June 30, 2020, the employer recognized pension gain of $3,293,611. The employer reported deferred outflows and inflows of resources related to pensions from the following sources:
Current Single Discount
1% Decrease Rate Assumption 1% Increase 4.50% 5.50% 6.50% $6,136,691 $2,324,847 $(709,672)
Deferred Deferred Outflows Inflows of Resources of ResourcesDifference in experience $ 1,858,669 $ 140,115 Changes in assumptions 3,216,792 Net difference of investment returns 683,112
Total $ 5,758,573 $ 140,115
Changes in Net Pension Liability
Increase (Decrease)
(continued)Notes to Financial Statements

Financial Section
41Missouri Local Government Employees Retirement System
Amounts reported as deferred outflows and inflows of resources related to pensions will be recognized in pension expense as follows:
Payable to the Pension PlanAs of June 30, 2020, there is payable of $3.9 million for the additional contribution made to the LSRP in order to improve the funding level of the plan per the funding policy.
(6)Staff Postemployment Healthcare Supplement
Summary of Significant Accounting Policies
Postemployment Benefits Other Than Pensions (OPEB). For purposes of measuring the net OPEB liability, deferred outflows of resources and deferred inflows of resources related to OPEB, and OPEB expense, information about the fiduciary net position of the LAGERS Staff Retiree Healthcare Supplement (LSRHS) and additions to/deductions from LSRHS fiduciary net position have been determined on the same basis as they are reported by LSRHS. For this purpose, LSRHS recognizes benefit payments when due and payable in accordance with the benefit terms. Investments are reported at fair value, except for money market investments and participating interest-earning investment contracts that have a maturity at the time of purchase of one year or less, which are reported at cost.
General Information about the OPEB Plan
Plan description. LSRHS is a single-employer defined benefit healthcare supplement administered by the LAGERS Board of Trust-ees. The LSRHS provides a healthcare subsidy to eligible staff retirees, spouse and minor children. The supplement does not provide access to retiree health coverage but will pay for a portion of a retiree’s health premium (subsidy) based upon coverage the retiree is able to obtain through the open market. To be eligible for the subsidy a retiree must have at least 10 years of service credit and retire from active status.
Benefits provided. The subsidy is equal to 2.5 percent multiplied by years of credited service (maximum 30 years) multiplied by healthcare premium. Under no circumstances can the healthcare premium exceed the premium LAGERS would pay for an active member of the same age participating in the LAGERS Staff healthcare plan.
Employees covered by benefit terms. At June 30, 2020, the following employees were covered by the benefit terms:
Contributions. The Board establishes rates based on an actuarially determined rate. For the year ended June 30, 2020, the contribu-tion rate was 1.6 percent of covered payroll. Employees are not required to contribute to the plan.
Net OPEB Liability. The employer’s net OPEB liability was measured as of June 30, 2020, and the total OPEB liability used to calculate the net OPEB liability was determined by an actuarial valuation as of June 30, 2020.
Year Ending2021 $ 998,044 2022 1,083,690 2023 1,148,414 2024 1,060,640 2025 798,513 Thereafter 529,157 $ 5,618,458
Retirees or beneficiaries currently receiving benefit payments 10 Inactive employees entitled to but not yet receiving benefits 0 Active employees 36 Total 46

Financial Section
42Missouri Local Government Employees Retirement System
Mortality rates were based on the RP-2014 mortality table for males and females, adjusted for mortality improvement back to the observation period base year of 2006.
The actuarial assumptions used in the June 30, 2020, valuation were based on the results of an actuarial experience study for the period March 1, 2010, through February 28, 2015.
The long-term expected rate of return on OPEB plan investments was determined using a model method in which the best-estimate ranges of expected future real rates of return (expected returns, net of investment expenses and inflation) are developed for each major asset class. These ranges are combined to produce the long-term expected rate of return by weighting the expected future real rates of return by the target asset allocation percentage and by adding expected inflation. The target allocation and a weighted average of the geometric real rates of return for each major asset class rollup are summarized in the following table:
Discount rate. The discount rate used to measure the total OPEB liability was 5.5 percent. The projection of cash flows used to determine the discount rate assumes that employer contributions will be made at the actuarially determined rates. Based on these assumptions, the OPEB plan’s fiduciary net position was projected to be available to pay all projected future benefit payments of current active employees. Therefore, the long-term expected rate of return on OPEB plan investments was applied to all periods of projected benefit payment to determine the total OPEB liability.
Increase (Decrease) Total OPEB Plan Fiduciary Net OPEB Liability Net Position Liability (Asset) (a) (b) (a) - (b)Balances at June 30, 2019 $ 2,495,004 $ 2,046,104 $ 448,900
Changes for the yearService cost 99,851 99,851Interest 138,715 138,715Difference between expected and actual experience (5,323) (5,323)Assumption changes* 395,445 395,445 Contributions - employer 58,646 (58,646)Net investment income (35,953) 35,953Benefit payments including refunds (45,680) (45,680) Net changes 583,008 (22,987) 605,995Balances at June 30, 2020 $ 3,078,012 $ 2,023,117 $ 1,054,895* New healthcare trend rates
Changes in Net OPEB Liability
Actuarial assumptions. The total OPEB liability in the June 30, 2020, actuarial valuation was determined using the following actuarial assumptions, applied to all periods included in the measurement, unless otherwise specified:
Target Long-Term Expected Asset Class Allocation Real Rate of Return Equity 42.00% 4.19% Fixed income 28.00 1.06 Real assets/real return 30.00 2.36
Inflation 3.25%, including price inflationSalary increase 3.25% to 6.55%, including wage inflationInvestment rate of return 5.50%Healthcare cost trend rates 9% for 2019, decreasing .75% per year until 2024 then decreasing .50% until 2028 to an ultimate rate of 3.25% for 2028 and later years
(continued)Notes to Financial Statements

Financial Section
43Missouri Local Government Employees Retirement System
HealthcareCost Trend
1% Decrease Rate Assumption 1% Increase $590,540 $1,054,895 $1,617,557
Year Ending2021 $165,261 2022 165,259 2023 161,851 2024 156,135 2025 126,366 Thereafter 208,933 $983,805
Current Single Discount
1% Decrease Rate Assumption 1% Increase 4.50% 5.50% 6.50% $1,668,167 $1,054,895 $572,476
Deferred Deferred Outflows Inflows of Resources of ResourcesDifference in experience $ 72,996 Changes of assumptions $ 913,759 Net difference of investment returns 143,042
Total $ 1,056,801 $ 72,996
Sensitivity of the net OPEB liability to changes in the discount rate. The following presents the net OPEB liability of LAGERS as well as what LAGERS' net OPEB liability would be if it were calculated using a discount rate that is 1-percentage-point lower (4.5 percent) or 1-percentage-point higher (6.5 percent) than the current discount rate:
Sensitivity of the net OPEB liability to changes in the healthcare cost trend rates. The following presents the net OPEB liability of LAGERS as well as what LAGERS' net OPEB liability would be if it were calculated using healthcare cost trend rates that are 1-percentage-point lower or 1-percentage-point higher than the current healthcare cost trend rate:
OPEB plan fiduciary net position. Detailed information about the OPEB plan’s fiduciary net position is available in the separately issued financial statements. The LAGERS Board of Trustees issues a publicly available audited financial report that includes financial statements and required supplementary information for the LSRHS. This report can be obtained by contacting the LAGERS office.
OPEB Expense and Deferred Outflows of Resources and Deferred Inflows of Resources Related to OPEB
For the year ended June 30, 2020, LAGERS recognized an OPEB expense of $71,090. The employer reported deferred outflows and deferred inflows of resources related to OPEB from the following sources:
Amounts reported as deferred outflows of resources and deferred inflows of resources related to OPEB will be recognized in OPEB expense as follows:
Payable to the OPEB Plan
At June 30, 2020, there are no payables for the outstanding amount of contributions to the OPEB plan required for the year ended June 30, 2020.

Financial Section
44Missouri Local Government Employees Retirement System
(7) Long-term Debt and Line of CreditIn December 2018, LAGERS entered into a revolving credit agreement with Bank of America, N.A. consisting of a line of credit not to exceed $300 million. Under the terms of the credit agreement, each revolving loan shall bear interest on the outstanding principal amount thereof at a rate per annum equal to the LIBOR Daily Floating Rate plus an applicable spread of .95%. LAGERS leverage ratio at June 30, 2020, was approximately 1.26. Long-term debt at June 30, 2020 consists of a revolving loan of $250 million, maturing on December 17, 2021. The credit agreement contains covenants customary for financings of this type, including, but not limited to, financial covenants, which are tested as of the end of each fiscal quarter and requires that LAGERS Fair Value-Total Fund Investment Assets shall not be less than $5 billion at any time and LAGERS Funded Ratio shall not be less than 65% at any time. LAGERS was in compliance with these financial covenants at June 30, 2020.
(8) Commitments and ContingenciesLAGERS has committed $7,189,533,898 of which $4,882,393,033 has been invested, leaving total unfunded commitments to real estate, private equity, and other alternative investments of $2,307,140,865 as of June 30, 2020. The total unfunded investment com-mitments are not recorded in the accompanying Statement of Fiduciary Net Position.
(9) Risk ManagementLAGERS is exposed to various risks of loss related to natural disasters, errors and omissions, loss of assets, torts, etc. LAGERS has chosen to cover such losses through the purchase of commercial insurance. There have been no material insurance claims filed or paid during the past three years.
LAGERS has a disaster recovery plan that provides for continued computer operations at a remote location should the retirement office be unavailable for normal operations.
(continued)Notes to Financial Statements

Financial Section
45Missouri Local Government Employees Retirement System
Schedule of Investment Returns
Required Supplementary Information
Annual money weighted rate of return (IRR) net of investment expenses
2016
(0.22)%
This schedule is presented to illustrate the requirement to show information for 10 years. However, until a full 10-year trend is compiled, information is presented for those years where information is available.
2015
2.07%
2017
11.94%
2018
13.76%
2019
7.05%
Fiscal Year Ending June 30 2020 2019 2018 2017 2016 2015 2014Total pension liability Service cost $ 622,944 $ 345,616 $ 338,728 $ 279,933 $ 269,096 $ 248,381 $ 233,620 Interest on total pension liability 1,041,285 966,929 817,596 722,819 643,321 635,359 575,236 Difference between expected and actual experience 406,366 522,716 1,307,186 586,625 63,013 (553,190) 313,742 Assumption changes 64,570 4,090,932 341,762 Benefit payments (517,753) (420,962) (393,426) (229,584) (222,579) (239,592) (361,806) Net change in total pension liability $ 1,617,412 $ 5,505,231 $ 2,070,084 $ 1,359,793 $ 1,094,613 $ 90,958 $ 760,792 Total pension liability - beginning $ 18,879,856 $ 13,374,625 $ 11,304,541 $ 9,944,748 $ 8,850,135 $ 8,759,177 $ 7,998,385 Total pension liability - ending (a) $ 20,497,268 $ 18,879,856 $ 13,374,625 $ 11,304,541 $ 9,944,748 $ 8,850,135 $8,759,177 Plan fiduciary net position Employer contributions $ 4,572,434 $ 2,110,653 $ 363,705 $ 318,068 $ 371,358 $ 372,741 $ 769,001 Pension plan net investment income 55,639 735,076 779,735 1,132,266 305,689 18,466 1,365,280 Benefit payments (517,753) (420,962) (393,426) (229,584) (222,579) (239,592) (361,806) Net change in fiduciary net position $ 4,110,320 $ 2,424,767 $ 750,014 $ 1,220,750 $ 454,468 $ 151,615 $ 1,772,475Plan fiduciary net position beginning $ 14,062,101 $ 11,637,334 $ 10,887,320 $ 9,666,570 $ 9,212,102 $ 9,060,487 $ 7,288,012Plan fiduciary net position ending (b) $ 18,172,421 $ 14,062,101 $ 11,637,334 $ 10,887,320 $ 9,666,570 $ 9,212,102 $ 9,060,487 Net pension liability(asset) ending(a-b) $ 2,324,847 $ 4,817,755 $ 1,737,291 $ 417,221 $ 278,178 $ (361,967) $ (301,310)
Fiduciary net position as a percentage of total pension liability 88.66% 74.48 % 87.01% 96.31% 97.20% 104.09% 103.44%
Covered payroll $ 3,321,553 $ 3,065,670 $ 2,895,457 $ 2,862,600 $ 2,372,202 $ 2,253,365 $2,074,725
Net pension liability (asset) as a percentage of covered payroll 69.99% 157.15% 60.00 % 14.57% 11.73% (16.06) % (14.52)%
This schedule is presented to illustrate the requirement to show information for 10 years. However, until a full 10-year trend is compiled, information is presented for those years where information is available.
2020
1.60%
Schedule of Investment Returns
Schedule of Changes in Net Pension Liability
2014
19.03%
Lagers Staff Retirement Plan

Financial Section
46Missouri Local Government Employees Retirement System
Schedule of Employer Contributions Year Actuarial Contribution Actual Contribution Ended Determined Actual Deficiency Covered as a % of June 30 Contribution Contribution (Excess) Payroll Covered Payroll 2020 $ 531,843 $ 4,572,434 $ (4,040,591) $ 3,321,553 137.66% 2019 406,991 2,110,653 (1,703,662) 3,065,670 68.85 2018 304,693 363,705 (59,012) 2,895,457 12.56 2017 295,261 318,068 (22,807) 2,862,600 11.11 2016 336,059 371,358 (35,299) 2,372,202 15.65 2015 351,076 372,741 (21,665) 2,253,365 16.54 2014 314,407 740,127 (425,720) 2,074,725 35.67 2013 293,419 342,575 (49,156) 1,837,069 18.65 2012 348,479 936,857 (588,378) 1,672,378 56.02 2011 313,225 1,563,687 (1,250,462) 1,453,875 107.55
LAGERS Staff Retirement Plan
Valuation date ................................................................................................................................................................June 30, 2018
Methods and Assumptions Used to Determine Contribution Rates:
Actuarial cost method .........................................................................................................................................Entry Age NormalAmortization method ...............................................................................................................Closed, level percent of payrollRemaining amortization period ..............................................................................................Varies between 11 to 19 yearsAsset valuation method ...........................................................................................5-year smoothed market; 20% corridorInflation .................................................................................................3.25%; including price inflation assumption of 2.5%Salary increases ..................................................................................................................... .3.25% - 6.55% including inflationRetirement age ..................... Experience-based table of rates that are specific to the type of eligibility condition Last updated for 2016 valuation pursuant to an experience study of the period 2010 - 2015
Mortality ...RP-2014 mortality table for males and females, adjusted for improvement back to the observation period base year of 2006. The base year for males was then
established to be 2017. Mortality rates for a particular calendar year are determined by applying the MP-2015 mortality improvement scale.
The mortality table was established based on the experience of the Missouri LAGERS membership total. Based on the experience observed
during the most recent 5 year period study.Other InformationNotes ............................................................................................................. There were no benefit changes during the year.
A new assumption regarding promotions was adopted beginning with the June 30, 2020 actuarial valuation.
Required Supplementary Information (continued)

Financial Section
47Missouri Local Government Employees Retirement System
LAGERS Retiree Healthcare Supplement
This schedule is presented to illustrate the requirement to show information for 10 years. However, until a full 10-year trend is compiled, information is presented for those years where information is available.
Schedule of Changes in Net OPEB Liability and Related Ratios Fiscal Year Ending June 30 2020 2019 2018 2017Total OPEB liability Service cost $ 99,851 $ 60,805 $ 49,231 $ 47,681 Interest 138,715 126,173 113,349 104,515 Difference between expected
and actual experience (5,323) (104,764) Changes of assumptions 395,445 617,551 148,738 Benefit payments (45,680) (38,871) (32,053) (30,195) Net change in total OPEB liability $ 583,008 $ 765,658 $ 174,501 $ 122,001 Total OPEB liability - beginning $ 2,495,004 $ 1,729,346 $ 1,554,845 $ 1,432,844
Total OPEB liability - ending (a) $ 3,078,012 $ 2,495,004 $ 1,729,346 $ 1,554,845Plan fiduciary net position Employer contributions $ 58,646 $ 60,284 $ 52,560 $ 121,994 Net investment income (35,953) 110,950 112,769 183,168Benefit payments (45,680) (38,871) (32,053) (30,195) Net change in plan fiduciary net position (22,987) $ 132,363 $ 133,276 $ 274,967
Plan fiduciary net position - beginning $ 2,046,104 $ 1,913,741 $ 1,780,465 $ 1,505,498Plan fiduciary net position - ending (b) $ 2,023,117 $ 2,046,104 $ 1,913,741 $ 1,780,465Net OPEB liability (asset) - ending (a-b) $ 1,054,895 $ 448,900 $ (184,395) $ (225,620)Plan fiduciary net position as a Percentage of total OPEB liability 65.73% 82.01% 110.66% 114.51%
Covered payroll $ 3,321,533 $ 3,065,670 $ 2,895,457 $ 2,862,600
Net OPEB liability (asset) as a percentage of covered payroll 31.76% 14.64% (6.37)% (7.88)%

Financial Section
48Missouri Local Government Employees Retirement System
Valuation date ............................................................................................................................................................... June 30, 2018
Methods and Assumptions Used to Determine Contribution RatesActuarial cost method ........................................................................................................................................ Entry Age Normal
Amortization method .............................................................................................................. Closed, level percent of payroll
Equivalent single amortization period.............................................................................................................................18 years
Asset valuation method ............................................................................................................................Market value of assets
Inflation ................................................................................................ 3.25%; including price inflation assumption of 2.5%
Salary increases ..................................................................................................................... .3.25% - 6.55% including inflation
Retirement age ..................... Experience-based table of rates that are specific to the type of eligibility condition Last updated for 2016 valuation pursuant to an experience study of the period
2010 - 2015.
Mortality ............................ RP-2014 mortality table for males and females, adjusted for improvement back to the observation period base year of 2006. The base year for males was
then established to be 2017. Mortality rates for a particular calendar year are determined by applying the MP-2015 mortality improvement scale.
The mortality table was established based on the experience of the Missouri LAGERS membership total. Based on the experience observed during the most recent 5 year
period study.
Other InformationNotes ............................................................................................................. There were no benefit changes during the year.
A new assumption regarding promotions was adopted beginnning with the June 30, 2020 actuarial valuation. New trend rates were also assumed.
Schedule of Employer Contributions Year Actuarial Contribution Actual Contribution Ended Determined Actual Deficiency Covered as a % of June 30 Contribution Contribution (Excess) Payroll Covered Payroll 2020 $ 47,833 $ 58,646 $ (10,813) $ 3,321,533 1.77% 2019 45,267 60,284 (15,017) 3,065,670 1.97 2018 43,842 52,560 (8,718) 2,895,457 1.82 2017 104,013 121,994 (17,981) 2,862,600 4.26
Required Supplementary Information (continued)

Financial Section
49Missouri Local Government Employees Retirement System
Operating Expenses
Personnel Services:Staff salaries $ 2,342,202Social Security 153,300 Staff retirement plan 3,285,437OPEB 37,220 Insurance 473,190Professional development 23,085
Total Personnel Services $ 6,314,434Professional Services:
Actuarial services $ 459,419 Data processing 894,662Audit 55,583General counsel 111,521Legislative 54,000Medical advisors 48,974Other 24,839
Total Professional Services $ 1,648,998Communications:
Public information $ 52,632Printing 77,356Telephone 50,401Postage 117,952 Meetings and travel 100,493
Total Communications $ 398,834Miscellaneous:
Utilities $ 28,677Insurance premiums 107,802Equipment maintenance 92,251Office supplies 45,875Building maintenance 33,830Depreciation 685,804
Total Miscellaneous $ 994,239Total Administrative Expenses $ 9,356,505
Supplementary Information
Administrative ExpensesYear Ended June 30, 2020
Investment Manager Fees:Alpha managers $ 12,663,752Equity managers 28,052,150Fixed income managers 10,187,949Real asset managers 17,138,222Strategic managers 5,368,414Securities lending managers 7,905,357
Total Investment Manager Fees $ 81,315,844Other Investment Expenses:
Investment custodial services $ 693,151Internal investment expenses 3,244,077
Total Other Investment Expenses $ 3,937,228Total Investment Expenses $ 85,253,072
Investment ExpensesYear Ended June 30, 2020

Financial Section
50Missouri Local Government Employees Retirement System
NOTES

InvestmentsSection 3:
Photo Credit: Local Government Hero Nominees

Investment Section
52Missouri Local Government Employees Retirement System52Missouri Local Government Employees Retirement System
October 22, 2020
To all LAGERS members:
I hope you are well in the new COVID-19 world. You can have confidence that LAGERS’ risk-aware investment strategy continues to ensure the plan will achieve its long-term obligations to our members and retirees. The fiscal year ending June 30, 2020 was a tumultuous year for the markets overall and was primarily driven by the impact of the pandemic. The portfolio earned a positive return of +1.6% net of fees while the Total Policy Benchmark returned +6.8%. The performance of the portfolio was mixed, with positive outperformance coming from the Equity and Fixed Income asset classes while Alpha, Real Asset and Strategic lagged their respective benchmarks. The portfolio ended the year with a portfolio value of $8.1 billion. This one-year performance feeds into the portfolio’s long term returns below:
• +7.4% net of fees annualized return over three years• +6.7% net of fees annualized return over five years• +9.4% net of fees annualized return over ten years• +7.3% net of fees annualized return over fifteen yearsThese returns were calculated by LAGERS’ custodian, Northern Trust using the time-weighted rate of return methodology.
The portfolio return exceeded LAGERS’ Total Policy Benchmark return over the 5, 10 and 15 year periods and over the long term has outperformed the assumed rate of return over 3, 10, and 15 year periods. The short term performance translates into slight upward pressure on employer contributions and a slightly lower funding status. The five year asset smoothing policy distributes the 2020 loss across five years, mitigating these impacts and continuing to ensure a secure retirement for our members.
Public equities were hit hard in the second quarter of 2020, just after reaching an all-time record high in February. The market later bounced back strongly in the late summer months of 2020. The COVID-19 pandemic, US-China trade disputes and the upcoming US election are some of the big headlines that contributed to the year’s roller coaster ride. LAGERS’ Private Equity managers continued to provide strong returns in Equities, as they saw increased valuations for the companies they held or realized, resulting in a +24.7% net of fees return for the year. This was largely offset by the Public Equity portfolio’s net of fees return of -1.2%. The Equity bucket overall returned +7.8% net of fees, outperforming its benchmark by +3.1%.
The Fixed Income portfolio has proven its diversification benefits in the face of the market downturn last year. LAGERS’ Fixed Income portfolio returned +14.3% net of fees compared to LAGERS’ Fixed Income benchmark of +7.1%, an outperformance of +7.2%. The primary attribution is from LAGERS’ allocation in US Long Duration Treasuries. Amid the market turmoil in early March, the 30-year Treasury yield hit a record low, breaching the 1.0% threshold for the first time in history and sending Long Duration Treasuries prices up to unprecedented levels. As a result, LAGERS’ US Long Duration Treasuries portfolio returned +46.4% for the year versus +26.0% return of its benchmark, contributing to the overall Public Fixed Income outperformance of +11.0% for the fiscal year. LAGERS’ Private Fixed Income portfolio slightly offset the Public Fixed Income performance with a +2.8% net of fees return for the fiscal year, underperforming its policy benchmark by -1.8% net of fees for the year.
LAGERS’ Alpha portfolio had a difficult stretch in the volatile market. The portfolio returned -3.9% net of fees while its benchmark returned +4.2% for the last year. All but one Alpha manager had a negative return for the year, creating the -8.0% net of fees underperformance. The unprecedented and fast-moving pandemic took the hedge fund managers by surprise as many of the managers’ valuation metrics underperformed in a market showing counterintuitive behavior at historical extremes.
Chief Investment Officer’s Report
M
ISSOU
RI
L
AGERS
Missouri Local Government Employees Retirement System701 West Main, P.O. Box 1665, Jefferson City, Missouri 65102
Telephone (573) 636-9455 • 800-447-4334 • FAX (573) 636-9671www.molagers.org
Brian K. Collett, CFA, CAIA, Chief Investment Officer

Investment Section
53Missouri Local Government Employees Retirement System
LAGERS’ Real Assets/Real Return portfolio lagged its benchmark over the last year. The Real Assets/Real Return investments returned -6.7% net of fees compared to LAGERS’ Real Assets/Real Return Benchmark of +1.5%. The shortfall comes from both Public and Private Real Asset portfolios, which both underperformed their respective benchmarks by -9.0%. Timber led the Real Asset/Real Return portfolio with +5.0% net of fee return, compared to its respective benchmark returning +3.2%.
LAGERS’ Strategic portfolio returned -14.9% net of fees compared to LAGERS’ Strategic Benchmark of +6.2%. The primary attribution comes from Public Strategic returning -26.8% for the year compared to the benchmark return of +5.2%. Private Strategic had a +2.9% return for the year but still lagged its benchmark return of 6.7%.
The current levered allocation as of June 30, 2020 for the five main asset types are Alpha 12.5%, Equities 38.1%, Fixed Income 26.5%, Real Assets/Real Return 34.7%, and Strategic Assets 9.7%. However, the LAGERS’ team views risk and asset allocation at a much more granular level than just the five main buckets listed above. Below is an in-depth chart, showing all the various sub-categories within the portfolio. These sub-categories provide a better understanding of the risks and characteristics currently in the portfolio.
Generating LAGERS’ assumed rate of return of +7.25% in the current environment will involve implementing our risk-aware strategy. LAGERS’ strategy takes full advantage of the illiquid nature of LAGERS’ long-term, perpetual, investment portfolio by having the ability to invest in private strategies such as Private Equity, Infrastructure, Real Estate, Aviation, Mining, Shipping, Renewables and other strategies such as a sawmill. These private strategies are expected to earn a premium to the public market returns, while diversifying the portfolio and decreasing overall risk. The asset allocation has been developed for the purpose of meeting this assumed rate of return over the long term and through all environments, including the current. LAGERS’ team is continuously looking for attractive and unique opportunities to diversify the asset base to reduce overall risk and add to the return.
The asset allocation is based on long-term goals, liquidity needs, risks and return characteristics of asset types, costs associated with available assets, and market conditions. Again, you can have confidence that the risk-aware investment strategy that LAGERS continues to use will assure that long-term obligations to our members and retirees will be achieved.
Sincerely,
Brian K. Collett, CFA, CAIA
Chief Investment Officer
53Missouri Local Government Employees Retirement System
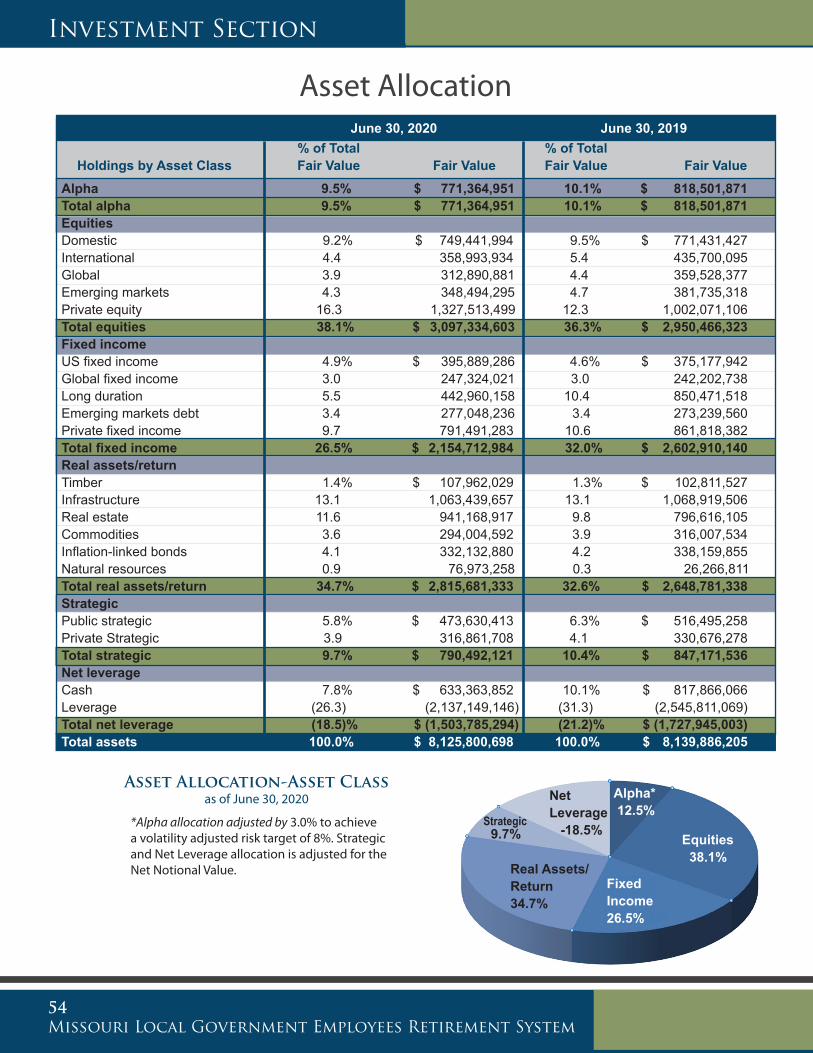
Investment Section
54Missouri Local Government Employees Retirement System
Asset Allocation June 30, 2020 June 30, 2019 % of Total % of Total Holdings by Asset Class Fair Value Fair Value Fair Value Fair ValueAlpha 9.5% $ 771,364,951 10.1% $ 818,501,871Total alpha 9.5% $ 771,364,951 10.1% $ 818,501,871Equities Domestic 9.2% $ 749,441,994 9.5% $ 771,431,427 International 4.4 358,993,934 5.4 435,700,095 Global 3.9 312,890,881 4.4 359,528,377 Emerging markets 4.3 348,494,295 4.7 381,735,318 Private equity 16.3 1,327,513,499 12.3 1,002,071,106 Total equities 38.1% $ 3,097,334,603 36.3% $ 2,950,466,323Fixed income US fixed income 4.9% $ 395,889,286 4.6% $ 375,177,942Global fixed income 3.0 247,324,021 3.0 242,202,738Long duration 5.5 442,960,158 10.4 850,471,518 Emerging markets debt 3.4 277,048,236 3.4 273,239,560 Private fixed income 9.7 791,491,283 10.6 861,818,382Total fixed income 26.5% $ 2,154,712,984 32.0% $ 2,602,910,140 Real assets/return Timber 1.4% $ 107,962,029 1.3% $ 102,811,527Infrastructure 13.1 1,063,439,657 13.1 1,068,919,506Real estate 11.6 941,168,917 9.8 796,616,105 Commodities 3.6 294,004,592 3.9 316,007,534 Inflation-linked bonds 4.1 332,132,880 4.2 338,159,855 Natural resources 0.9 76,973,258 0.3 26,266,811Total real assets/return 34.7% $ 2,815,681,333 32.6% $ 2,648,781,338 Strategic Public strategic 5.8% $ 473,630,413 6.3% $ 516,495,258 Private Strategic 3.9 316,861,708 4.1 330,676,278 Total strategic 9.7% $ 790,492,121 10.4% $ 847,171,536Net leverage Cash 7.8% $ 633,363,852 10.1% $ 817,866,066Leverage (26.3) (2,137,149,146) (31.3) (2,545,811,069)Total net leverage (18.5)% $ (1,503,785,294) (21.2)% $ (1,727,945,003)Total assets 100.0% $ 8,125,800,698 100.0% $ 8,139,886,205
Asset Allocation-Asset Classas of June 30, 2020 11.0%
*Alpha allocation adjusted by 3.0% to achieve a volatility adjusted risk target of 8%. Strategic and Net Leverage allocation is adjusted for the Net Notional Value.
Fixed Income26.5%
Equities 38.1%
Real Assets/Return34.7%
Alpha* 12.5%
Net Leverage -18.5%Strategic
9.7%

Investment Section
55Missouri Local Government Employees Retirement System
Investment PolicyThe LAGERS Board of Trustees, operating within the “prudent person” framework, has adopted a Statement of Investment Policy and Objectives for the investment managers and others who serve in a fiduciary capacity to the Fund. A summary of that policy follows. For a complete copy of the investment policy, please contact the LAGERS office.
Investment Goals The goal of the Fund shall be to achieve a rate of return, net of manager fees, of at least 7.25% per annum as measured over a full market cycle. The Trustees and Investment Staff will use the Fund’s asset allocation as the primary tool to achieve this goal. As this is a long-term projection and investments are subject to short-term volatility, the main investment focus of the Trustees and Invest-ment Staff will be towards the Total Fund. Each asset manager, individual investment and/or security selection (together known as ‘investment(s)’) will be judged on performance relative to its asset class and to its relative benchmark over a full market cycle, usually 5-7 years. With respect to the given purpose, the System’s liquidity requirement, and the source and predictability of contributions, the Board elects to target portfolio risk of 10% standard deviation in pursuing the investment program. LAGERS is unwilling to un-dertake investment strategies that might jeopardize the ability of the Fund to finance the pension benefits promised to the System’s participants. Thus, LAGERS actively seeks to lower/stabilize the cost of funding the System’s pension promise by prudently taking on types of risk that best serves the long-run interest of the Fund and, therefore, of the System’s participants.
The Trustees have established the following asset-mix guidelines for the Pension Fund:
Asset Class Target Guidelines
Equity Investments 35.00%Fixed Income Investments 31.00%Real Assets/Real Return 36.00%Strategic Assets 8.00%Alpha Portfolio** 15.00%Cash Portfolio* 10.00%Leverage Portfolio* -35.00%
* LAGERS targets 30% of the leveraged portfolio to be held in cash.** Alpha Portfolio allocation is based on a volatility adjusted exposure targeting 8% overall.
The Trustees have established the following liquidity guidelines for the Pension Fund:
Liquidity Time Frame Target Guidelines
Short-term (<1 week) 40.00%Medium-term (1 week – 1 year) 20.00%Long-term (> 1 year) 40.00%

Investment Section
56Missouri Local Government Employees Retirement System
The Pension Fund’s total return should exceed the total return of an index composed as follows:
General Portfolio GuidelinesDiversification
The diversification of securities among sectors and issuers is the responsibility of the investment manager and Investment Staff. The Investment Staff has further diversification responsibility at the asset manager and asset class level and the Trustees have diversification responsibility at the total portfolio level. All investments made shall be subject to the quality and diversification restrictions established by Section 70.745, 70.746, 70.747, 105.687, 105.688, 105.689 and 105.690 of the Revised Statutes of Missouri.
Liquidity
Individual assets and/or investment mandates, excluding leverage and its associated cash collateral, will be grouped into three different liquidity classifications. These classifications are based on the time frame it takes to liquidate the investment at prevailing market prices (i.e. not at a discount) and receive cash back. The classifications include:
• Short-Term: the ability to liquidate the investment and receive cash back in less than one week. These include but are not limited to publicly traded assets.
• Medium-Term: the ability to liquidate the investment and receive cash back within one week to one year. These include more illiquid assets such as hedge funds and overlay strategies that have a lock-up period and/or periodic redemptions (i.e. monthly, quarterly, or annually).
Investment Policy (continued)
Asset Class Asset Sub-Class Benchmark Weight
Equity
Domestic Equity Russell 3000 Index 10.0%Private Equity CPI +5.5% 10.0%Global Equity MSCI All Country World Index ND (non-hedge) 5.0%International Equity MSCI All Country World Index ex US ND (non-hedge) 5.0%Emerging Markets Equity MSCI Emerging Markets Index ND (non-hedge) 5.0%
Fixed Income
Long Duration Fixed Barclays Capital US 20+ Year Treasury Bond Index 10.0%Private Fixed Income CPI +4.0% 7.0%US Fixed Income Barclays Capital US Aggregate Bond Index 6.0%Global Fixed Income Barclays Capital Global Aggregate Bond Index 4.0%Emerging Market Debt 40% JPM EMBI Global Div; 40% JPM CEMBI Broad Div;
20% JPM GBI-EM Global Div4.0%
Real Assets
Real Estate CPI +4.5% 14.0%Infrastructure CPI +4.0% 7.0%Inflation Linked Bonds Barclays Capital Global Inflation-Linked Bond Index 6.0%Commodities Bloomberg Commodity Index 5.0%Timber CPI +2.5% 2.0%Natural Resources CPI +5.0% 2.0%
Strategic Assets Private Strategic CPI +6.0% 5.0%Public Strategic CPI +4.5% 3.0%
Alpha Alpha Portfolio CPI +3.5% 15.0%Cash Cash CPI 10.0%Leverage Leverage -(CPI +0.5%) -35.0%

Investment Section
57Missouri Local Government Employees Retirement System
• Long-Term: these assets are the most illiquid and have lock-up periods of greater than 1 year. These assets have increased liquid-ity risk if sold before lock-up expires.
Illiquid assets carry a theoretical illiquidity premium that is demanded by investors for securities that cannot be easily converted into cash. Therefore, these assets that are more illiquid should earn a higher return. Consistent with LAGERS’ liquidity requirements and long-term nature of the fund, LAGERS has established liquidity allocation ranges.
Style Adherence
The most important feature any individual manager brings to a multi-manager portfolio is style adherence. At least quarterly, fundamental portfolio characteristics and style benchmark comparisons will be monitored for adherence to a manager’s identified style. The Trustees and Investment Staff recognize that different maturity ranges and sectors within the broad market categories go in and out of favor. Therefore, short-term examination of each investment’s performance will review style adherence relative to similar style or duration, peer comparisons, and style benchmarks whilst maintaining a focus on the long-term return objective relative to their respective style benchmark.
Performance Objectives
Primary emphasis is to be placed on relative rates of return. Performance shall be evaluated over a full market cycle, usually 5-7 years. See "Specific Portfolio Guidelines" for further information regarding performance expectations.
Specific Portfolio Guidelines
Fixed Income
• The benchmark for the fixed income composite portfolio is composed as follows:
Asset Sub-Class Benchmark Weight
Long Duration Fixed Barclay's Capital US 20+ Year Treasury Bond Index 32.0%
Private Fixed Income CPI +4.0% 22.5%
US Fixed Income Barclays Capital US Aggregate Bond Index 19.5%
Global Fixed Income Barclays Capital Global Aggregate Bond Index 13.0%
Emerging Market Debt 33.33% JPM EMBI Global Div; 33.33% JPM CEMBI Broad Div; 33.33% JPM GBI-EM Global Div
13.0%
• The total return of the fixed income composite, net of fees, should exceed the total return of the composite benchmark outlined above.
• The total return of each underlying portfolio or mandate in the composite should exceed the total return of an index of similar mandate or style assigned. The Investment Staff will use benchmarks specific to each respective asset or manager’s mandate on a quarter-by-quarter basis to monitor each investment. Currency management is at the discretion of the Non-US managers.
• The goal of the fixed income composite portfolio shall be to achieve a total annualized real rate of return net of fees of at least 1.5% over the CPI as measured over a full market cycle, usually 5-7 years.

Investment Section
58Missouri Local Government Employees Retirement System
Investment Policy (continued)
Equity
• The benchmark for the equity composite portfolio is composed as follows:
• The total return of the equity composite, net of fees, should exceed the total return of the composite benchmark outlined above.
• The total return of each underlying portfolio or mandate in the composite should exceed the total return of an index of similar mandate or style assigned. The Investment Staff will use benchmarks specific to each respective asset or manager’s mandate on a quarter-by-quarter basis to monitor each investment. Currency management is at the discretion of the Non-US managers.
• The goal of the equity composite portfolio shall be to achieve a total annualized real rate of return net of fees of at least 5.0% over the CPI as measured over a full market cycle, usually 5-7 years.
Real Assets
• The benchmark for the real asset composite portfolio is composed as follows:
• The total return of the real asset composite, net of fees, should exceed the total return of the composite benchmark outlined above.
• The total return of each underlying portfolio or mandate in the composite should exceed the total return of an index of similar mandate or style assigned. The Investment Staff will use benchmarks specific to each respective asset or manager’s mandate on a quarter-by-quarter basis to monitor each investment. Currency management is at the discretion of the Non-US managers.
• The goal of the real asset composite portfolio shall be to achieve a total annualized real rate of return of at least 3.5% over the CPI as measured over a full market cycle, usually 5-7 years.
Asset Sub-Class Benchmark Weight
Domestic Equity Russell 3000 Index 29.0%
Private Equity CPI +5.5% 29.0%
Global Equity MSCI All Country World Index ND (non-hedge) 14.0%
International Equity MSCI All Country World Index ex US ND (non-hedge) 14.0%
Emerging Markets Equity MSCI Emerging Markets Index ND (non-hedge) 14.0%
Asset Sub-Class Benchmark Weight
Real Estate CPI +4.5% 39.0%
Infrastructure CPI +4.0% 19.5%
Inflation Linked Bonds Barclays Capital Global Inflation-Linked Bond Index 16.5%
Commodities Bloomberg Commodity Index 14.0%
Timber CPI +2.5% 5.5%
Natural Resources CPI +5.0% 5.5%

Investment Section
59Missouri Local Government Employees Retirement System
Strategic Assets
• The benchmark for the strategic asset composite portfolio is composed as follows:
• The total return of the strategic asset composite, net of fees, should exceed the total return of the composite benchmark out-lined above.
• The total return of each underlying portfolio or mandate in the composite should exceed the total return of an index of similar mandate or style assigned. The Investment Staff will use benchmarks specific to each respective asset or manager’s mandate on a quarter-by-quarter basis to monitor each investment. Currency management is at the discretion of the Non-US managers.
• The goal of the strategic asset composite portfolio shall be to achieve a total annualized real rate of return of at least 5.5% over the CPI as measured over a full market cycle, usually 5-7 years.
Alpha Portfolio
• The target allocation will be based on the volatility adjusted exposure for each alpha manager in order to achieve an overall alpha composite volatility of 8%.
• The benchmark for the alpha composite is composed as follows:
• The total return of the alpha composite, net of fees, should exceed the total return of the composite benchmark outlined above.
• The total return of each underlying portfolio or mandate in the composite should exceed the total return of an index of similar mandate or style assigned. The Investment Staff will use benchmarks specific to each respective asset or manager’s mandate on a quarter-by-quarter basis to monitor each investment. Currency management is at the discretion of the Non-US managers.
• The goal of the asset composite shall be to achieve a total annualized real rate of return of at least 3.5% over the CPI as measured over a full market cycle, usually 5-7 years.
Cash
• LAGERS tracks the cash on the overall portfolio and has a target cash position of 30% of leverage employed.
• The benchmark for the cash composite is composed as follows:
• The goal of the cash composite portfolio shall be to achieve a total annualized real rate of return of CPI as measured over a full market cycle, usually 5-7 years.
Asset Sub-Class Benchmark Weight
Private Strategic CPI +6.0% 62.5%
Public Strategic CPI +4.5% 37.5%
Asset Sub-Class Benchmark Weight
Alpha Portfolio CPI +3.5% 100.0%
Asset Sub-Class Benchmark Weight
Cash CPI 100.0%

Investment Section
60Missouri Local Government Employees Retirement System
Periods Ending June 30, 2020
Investment Results
Total Portfolio: 1 Year 3 Years 5 Years 10 Years 15 Years LAGERS 1.63 % 7.37 % 6.72 % 9.42 % 7.33 % LAGERS Custom Index 6.84 7.47 6.64 8.02 6.21 Actuarial Assumed Rate of Return 7.25 7.25 7.25 7.27 7.35 Median All Funds > $1 Bil 3.15 6.15 6.26 8.71 7.18 Consumer Price Index (CPI) 0.65 1.72 1.56 1.69 1.90 Equity Portfolio: LAGERS 7.75 % 8.23 % 8.35 % 12.08 % 7.50 % MSCI's All Country World Index 2.11 6.14 6.46 9.16 6.42 Russell 3000 Index 6.53 10.04 10.03 13.72 8.78 Standard & Poor's 500 Index 7.51 10.73 10.73 13.99 8.83 Fixed Income Portfolio: LAGERS 14.34 % 11.00 % 8.01 % 8.37 % 7.84 % Barclay's US Aggregate Index 8.74 5.32 4.30 3.82 4.39 Barclay's Global Aggregate Index 4.22 3.79 3.56 2.81 3.55 Real Assets/Return Portfolio:
LAGERS (6.69)% 5.05 % 5.10 % 5.51 % 4.65 % LAGERS Custom Real Assets/Return Benchmark 1.45 3.76 3.28 3.85 4.30 Strategic Portfolio:
LAGERS (14.87)% 4.87 % 2.61 % 4.06% LAGERS Custom Strategic Benchmark 6.23 7.35 7.14 6.98
Alpha Portfolio:
LAGERS (3.85)% Consumer Price Index (CPI) +3.5% 4.17
Leverage Portfolio
• The leverage composite is the liability side of any borrowed funds and therefore will not have a benchmark to exceed and will instead have an expected cost of CPI +0.5%, measured over a full market cycle, usually 5-7 years.
Securities Lending Guidelines
The Investment Staff may select a firm(s) to lend financial securities of the Fund. The firm shall have full discretion over the selection of borrowers and shall continually review credit worthiness of potential borrowers through adequate analysis of all material provided to them. The securities lending program shall in no way inhibit the trading activities of the investment managers of the System. The securities lending agent and Investment Staff will create investment guidelines for the investment of cash collateral to adhere to this document. The Investment Staff will review, at least quarterly, the performance of the program and ensure that proper collateraliza-tion procedures are adhered to as stated in the investment guidelines.
The Investment Staff has authority to manage the Security Lending’s cash collateral. This collateral will be invested at Staff’s discretion in the eligible investments permitted under this Statement of Investment Policy and Objectives, while also taking into the account the liquidity needs of the Security Lending program.
Investment Policy (continued)

Investment Section
61Missouri Local Government Employees Retirement System
Largest HoldingsLargest Bond Holdings (By Fair Value)
June 30, 2020
Par Bonds Fair Value1) $ 106,025,000 US Treas Bds 2.25% Due 08-15-2046 $ 125,751,449 2) 49,670,000 US Treas Nts Infl Idx 0.625% 04-15-2023 53,308,207 3) 49,530,000 US Treas NTS Idx Dtd 04-15-2017 0.125% Due 04-15-2022 52,975,886 4) 41,160,000 US Treas Bonds Dtd 05/15/2016 2.5% Due 05-15-2046 Reg 51,049,655 5) 70,000,000 US Treas Bd Stripped Prin Pmt00109 11-15-2045 (Unddate) Reg 48,101,151 6) 34,940,000 FNMA Single Family Mortgage 3.5% 30 Years Settles August 36,735,540 7) 29,600,000 US Treas Bds 00247 2.5% Due 02-15-2046 Reg 36,658,906 8) 32,000,000 US Treas Notes Infl Idx 0.125% 04-15-2021 34,780,209 9) 26,600,000 FNMA Single Family Mortgage 4% 30 Years Settles August 28,202,754 10) 28,500,000 PVTPL Garrison BSL CLO 2018-1 FLTG 144A 07-17-2028 27,930,000
Largest Stock Holdings (By Fair Value)June 30, 2020
Shares Stock Fair Value
1) 10,000 PVPL Eagle Holding Company Inc Series B $ 14,828,000 2) 4,112 Amazon Inc 11,118,045 3) 6,500 PVPL Hastings Holdings Corp Series C 9,654,970 4) 6,267 Adyen NV Eur0.01 9,118,741 5) 23,066 Apple Inc 8,414,477 6) 781,265 Centurylink Inc 7,600,584 7) 7,739 Shopify Inc 7,345,859 8) 6,907 Tesla Inc 7,039,281 9) 7,033 Mercadolibre Inc 6,932,920 10) 307,690 Meituan 6,824,366
Note: A complete list of holdings is available upon request.
Schedule of Advisor FeesInvestment Manager Expenses:Alpha Managers $ 12,663,752 Equity Managers 28,052,150 Fixed Income Managers 10,187,949 Real Asset Managers 17,138,222 Strategic Managers 5,368,414 Securities Lending Managers 7,905,357 Total Investment Manager Fees $ 81,315,844 Other Investment Expenses:Investment Custodial Services $ 693,151 Investment Consultant/Legal Counsel 95,086 Investment Staff Expenses 3,148,991 Total Other Investment Expenses $ 3,937,228Total Investment Expenses $ 85,253,072
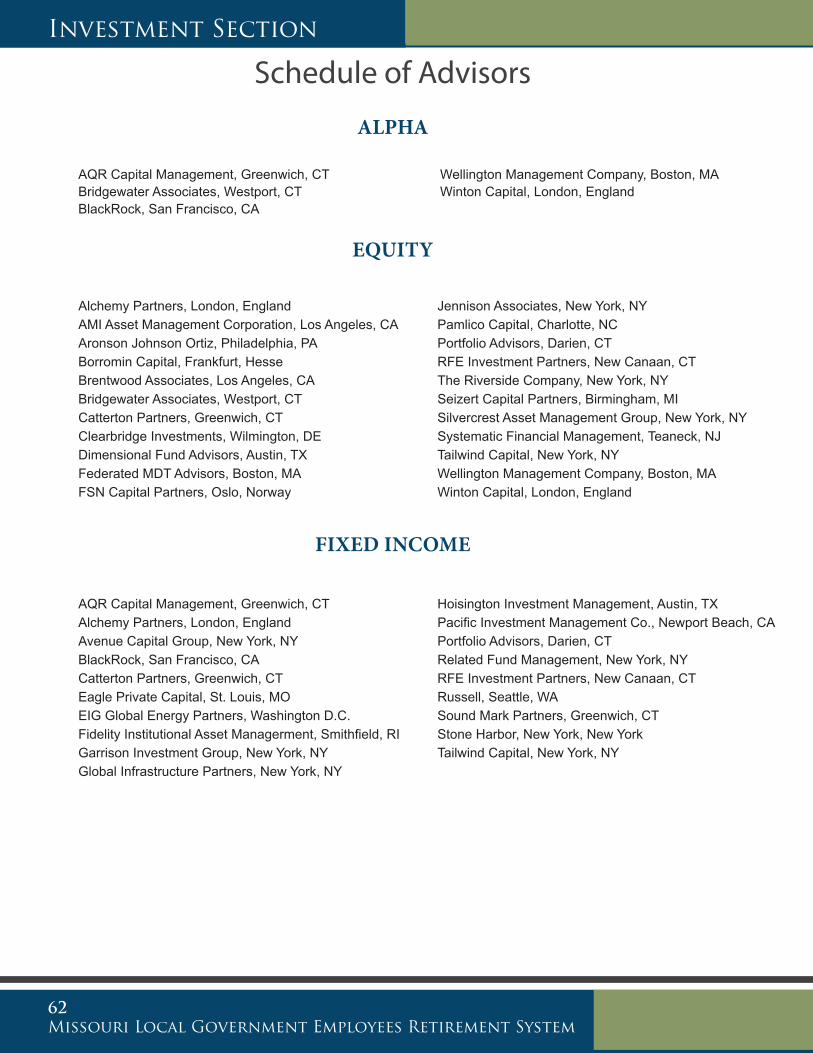
Investment Section
62Missouri Local Government Employees Retirement System
Schedule of Advisors
Alchemy Partners, London, England Jennison Associates, New York, NYAMI Asset Management Corporation, Los Angeles, CA Pamlico Capital, Charlotte, NCAronson Johnson Ortiz, Philadelphia, PA Portfolio Advisors, Darien, CTBorromin Capital, Frankfurt, Hesse RFE Investment Partners, New Canaan, CTBrentwood Associates, Los Angeles, CA The Riverside Company, New York, NYBridgewater Associates, Westport, CT Seizert Capital Partners, Birmingham, MICatterton Partners, Greenwich, CT Silvercrest Asset Management Group, New York, NYClearbridge Investments, Wilmington, DE Systematic Financial Management, Teaneck, NJDimensional Fund Advisors, Austin, TX Tailwind Capital, New York, NYFederated MDT Advisors, Boston, MA Wellington Management Company, Boston, MAFSN Capital Partners, Oslo, Norway Winton Capital, London, England
AQR Capital Management, Greenwich, CT Hoisington Investment Management, Austin, TXAlchemy Partners, London, England Pacific Investment Management Co., Newport Beach, CAAvenue Capital Group, New York, NY Portfolio Advisors, Darien, CTBlackRock, San Francisco, CA Related Fund Management, New York, NY Catterton Partners, Greenwich, CT RFE Investment Partners, New Canaan, CTEagle Private Capital, St. Louis, MO Russell, Seattle, WAEIG Global Energy Partners, Washington D.C. Sound Mark Partners, Greenwich, CTFidelity Institutional Asset Managerment, Smithfield, RI Stone Harbor, New York, New YorkGarrison Investment Group, New York, NY Tailwind Capital, New York, NYGlobal Infrastructure Partners, New York, NY
EQUITY
FIXED INCOME
ALPHA
AQR Capital Management, Greenwich, CT Wellington Management Company, Boston, MABridgewater Associates, Westport, CT Winton Capital, London, EnglandBlackRock, San Francisco, CA

Investment Section
63Missouri Local Government Employees Retirement System
CUSTODIANNorthern Trust Company, Chicago, IL
REAL ASSETS / RETURN
STRATEGIC
Avenue Capital Group, New York, NY Machine Investment Group, New York, NYBlackRock, San Francisco, CA Noble Investment Group, Atlanta, GABlue Vista Capital Management, Chicago, IL Pacific Investment Management Co., Newport Beach, CABridgewater Associates, Westport, CT Portfolio Advisors, Darien, CTCrow Holdings, Dallas, TX Prudential Real Estate Investors, Madison, NJEIG Global Energy Partners, Washington D.C. Related Fund Management, New York, NYEuropa Capital Partners, London, England Resource Capital Funds, Denver, COFireside Financial, Edwardsville, IL Sole Shipping, St Helier, JerseyGarrison Investment Group, New York, NY Sound Mark Partners, Greenwich, CTGlennmont Partners, London, England Stonepeak, Wilmington, DEGlobal Infrastructure Partners, New York, NY Timberland Investment Resources, Charlotte, NCI Squared Capital Advisors LLC, New York, NY
Allegro, Wilmington, DE Garrison Investment Group, New York, NYAvenue Capital Group, New York, NY Healthcare Royalty Partners, Stamford, CTBlackRock, San Francisco, CA Russell, Seattle, WADock Square Capital, Coral Gables, FL Sound Mark Partners, Greenwich, CT
Schedule of Advisors

Investment Section
64Missouri Local Government Employees Retirement System
Brokerage Schedule
Schedule of Brokerage Commissions Broker Name Shares Commissions Per Share Goldman, Sachs and Co. $ 3,458,568,777 $ 204,009 $ 0.00006 Instinet Investment Services Limited 37,502,541 195,149 0.00520 Morgan Stanley and Co., LLC 2,756,369,060 157,196 0.00006 J.P. Morgan Securities LLC 492,414,844 88,161 0.00018 Jeffries LLC 141,507,560 80,815 0.00057 Merrill Lynch International Limited 3,357,907,275 64,757 0.00002 Instinet Pacific Limited 178,925,155 49,113 0.00027 SG Securities (HK) Limited 156,752,246 44,033 0.00028 Credit Suisse AG, New York Branch 1,709,912,662 43,779 0.00003 Sanford C. Bernstein and Co., LLC 8,058,407 40,385 0.00501 Investment Technology Group Inc. 5,246,120 38,485 0.00734 Instinet Europe Limited 1,739,809,735 36,472 0.00002 Instinet, LLC 4,970,215 36,138 0.00727 J.P. Morgan Securities PLC 1,461,543,759 31,561 0.00002 Wall Street Access 4,829,882 31,341 0.00649 Barclays Capital Inc 4,332,046 29,502 0.00681 Barclays Capital 52,106,497 29,282 0.00056 Capital Institutional Services Inc-Equities 1,355,611 27,112 0.02000 RBC Capital Markets, LLC 11,278,107 24,768 0.00220 Credit Suisse Securities (USA) LLC 19,112,470,607 24,327 0.00000 Subtotal (20 largest) 34,695,861,106 1,276,385 0.00312 Remaining total 73,823,276,416 647,175 0.00669 Total commissions $108,519,137,522 $ 1,923,560 $ 0.00647
Brokerage commissions on purchases and sales are too numerous to list; therefore, only the top 20 brokers, by amount of commission paid are presented.

ActuarialSection 4:
Photo Credit: Local Government Hero Darold Donathan City of Branson Police Officer

Actuarial Section
66Missouri Local Government Employees Retirement System
Actuary’s Certification Letter
October 22, 2020
Board of TrusteesMissouri Local GovernmentEmployees Retirement SystemJefferson City, Missouri
The fundamental financial objective of LAGERS is to establish and receive contributions which:
• When expressed as percents of active member payroll, will remain approximately level from generation to generation of local citizens; and
• When combined with present assets and future investment return, will be sufficient to meet the financial obligations of LAGERS to present and future retirees and beneficiaries.
To test how well the fundamental objective is being achieved, annual actuarial valuations are made. These valuations adjust employer contribution rates, up or down as the case may be, for differences in the past year between assumed financial experiences and actual financial experiences. In addition, these valuations determine the reserve strength of each employer group.
Using data as of February 29, 2020, separate actuarial valuations were made for 1,207 employer groups and a compiled annual actuarial report was issued as of that date. The data was reviewed in the aggregate by the actuary for internal and year-to-year consistency and reasonableness prior to use in the actuarial valuation process, but was not audited. It was also summarized and tabulated in order to analyze trends. We are not responsible for the accuracy or completeness of the data. Summary information about the resulting new employer contribution rates is shown in the Comprehensive Annual Financial Report (CAFR).
Assumptions concerning future experience are needed for computing employer contribution rates. As time passes and actual experience develops, assumed and actual experience is compared. From time-to-time, one or more of the assumptions about the future are changed by the Board after consulting with the actuary. The last major changes were in economic assumptions and non-economic assumptions based upon an Experience Study covering the period March 1, 2010 through February 28, 2015. These assumptions were first used in the 2016 valuations. The assumptions comply with the Actuarial Standards of Practice and the applicable reporting requirements of the Governmental Accounting Standards Board (GASB).
In addition to the compiled annual actuarial valuation report, separate reports are issued to provide funding and financial reporting information for the LAGERS Staff Plans in accordance with GASB Statement Nos. 67 and 68 (pension benefits) and Statement Nos. 74 and 75 (retiree health benefits). Financial reporting information has been produced based upon a measurement date of June 30, 2020 for GASB Statement Nos. 67 and 68 and June 30, 2020 for GASB Statement Nos. 74 and 75.
September 29, 2017 Mr. Robert Wilson Executive Secretary Missouri Local Government Employees Retirement System P.O. Box 1665 Jefferson City, Missouri 65102 Dear Bob: Enclosed is a copy of the Actuary's Certification Letter for the Actuarial Section of the 2017 Comprehensive Annual Financial Report. Sincerely, Mita D. Drazilov, ASA, FCA, MAAA MDD:dj Enclosure

Actuarial Section
67Missouri Local Government Employees Retirement System
The following schedules in the Actuarial Section and Financial Section of the CAFR were prepared based upon certain information presented in the previously mentioned funding and financial reporting valuation reports:
Actuarial Section Summary of Actuarial Assumptions Actuarial Valuation Data Participating Employers and Active Members Retirant and Beneficiary Data Schedule of Funding Progress Short Condition Test Employer Contribution Rate Changes Employer Contribution Rates Schedule of Gains & LossesFinancial Section LAGERS Staff Retirement Plan Contributions Total and Net Pension Liability Sensitivity to Changes in the Discount Rate Pension Expense and Deferred Outflows/Inflows of Resources Related to Pensions Schedule of Changes in Net Pension Liability Schedule of Employer Contributions LAGERS Staff Postemployment Healthcare Supplement Contributions Total and Net OPEB Liability Sensitivity to Changes in the Discount Rate and Healthcare Trend Rates OPEB Expense and Deferred Outflows/Inflows of Resources Related to OPEBs Schedule of Changes in Net OPEB Liability Schedule of Employer Contributions
On the basis of the 2020 valuations, it is our opinion that LAGERS continues to satisfy the actuarial principles of level cost financing.
Future actuarial measurements may differ significantly from the current measurements presented in this report due to such factors as the following: plan experience differing from that anticipated by the economic or demographic assumptions; changes in economic or demographic assumptions; increases or decreases expected as part of the natural operation of the methodology used for these measurements (such as the end of an amortization period or additional cost or contribution requirements based on funded status); and changes in plan provisions or applicable law.
Mita D. Drazilov and Judith A. Kermans are Members of the American Academy of Actuaries (MAAA) and meet the Qualification Standards of the American Academy of Actuaries to render the actuarial opinions contained herein. The signing actuaries are independent of the plan sponsor.
Respectfully submitted,
Mita D. Drazilov, ASA, FCA, MAAA Judith A. Kermans, EA, FCA, MAAA

Actuarial Section
68Missouri Local Government Employees Retirement System
Summary of Actuarial Assumptions1. The investment return rate used in making the valuations was 7.25 percent per year, compounded annually. This
rate of return is not the assumed real rate of return. The real rate of return is the portion of total investment return which is more than the wage inflation rate. Considering wage inflation recognition of 3.25 percent, the 7.25 percent investment return rate translates to an assumed real rate of return of 4.00 percent. Adopted 2016.
2. The mortality table used to evaluate mortality among active members was the RP-2014 Employees Mortality Table for males and females, adjusted for mortality improvement back to observation period base year 2006. It was as-sumed that 50 percent of pre-retirement deaths would be duty related. Adopted 2016.
3. The mortality table used in evaluating allowances to be paid was the RP-2014 Healthy Annuitant mortality table for males and females, adjusted for mortality improvement back to observation period base year of 2006. Adopted 2016.
4. For both the post-retirement and pre-retirement tables, the base year for males was then established to be 2017. Mortality rates for a particular calendar year are determined by applying the MP-2015 mortality improvement scale to the above described tables. Adopted 2016.
5. The probabilities of withdrawal from service, together with individual pay increase assumptions, are shown in Schedule 1. Adopted 2016.
6. The probabilities of retirement with an age and service allowance are shown in Schedule 2. Adopted 2016.
7. Total active member payroll is assumed to increase 3.25 percent a year, which is the portion of the individual pay increase assumptions attributable to wage inflation. In effect, this assumes no change in the number of active mem-bers per employer. Adopted 2016.
8. An individual entry-age normal cost method of valuation was used in determining age and service allowance nor-mal costs and the allocation of actuarial present values between service rendered before and after the valuation date. Actuarial gains and losses reduce or increase the unfunded liability and are amortized over the remaining amortization period. Adopted 1987.
9. Present assets (cash and investments at February 29, 2016) are valued using smoothing techniques of fair value over a five-year period. Funding value is not permitted to deviate from fair value by more than 20 percent. Adopted 2003.
10. The data about persons now covered and about present assets were furnished by the system’s administrative staff. Although examined for general reasonableness, the data was not audited by the actuary.
11. The actuarial valuation computations were made by or under the supervision of a Member of the American Acad-emy of Actuaries (M.A.A.A.).

Actuarial Section
69Missouri Local Government Employees Retirement System
Schedule 1Withdrawal From Active Employment Before Age & Service Retirement
and Individual Pay Increase Assumptions
Percent of Active MembersSeparating Within Next Year
Percent Increase In Individual’s Sample Years of General Members Pay During Ages Service Men Women Police/Public Safety Fire Next Year#*
All 0 19.0 % 22.0 % 18.0 % 10.0% 1 17.0 20.0 17.0 8.0 2 15.0 17.0 16.0 7.0 3 13.0 14.0 13.0 6.0 4 11.0 13.0 12.0 6.0 25 5 & Over 7.3 10.8 9.8 5.0 6.55% 30 6.5 8.9 7.8 4.0 5.75 35 5.0 7.4 6.1 2.8 5.25 40 3.7 5.7 4.4 2.2 4.75 45 3.0 4.2 3.2 1.8 4.25 50 2.4 3.3 1.8 1.0 3.85 55 1.8 2.5 1.0 0.5 3.65 60 1.0 1.2 0.0 0.0 3.55 65 0.0 0.0 0.0 0.0 3.25
*Pay increase rates for fire employees differ slightly. #Individual pay increase rates relate to all years of service.
Withdrawal From Active Employment Before Age & Service Retirementdue to Death or Disability
Death* Disability General Members General Members Sample Ages Men Women Police/ Fire Men Women Police/ Fire Public Safety Public Safety
25 0.05% 0.01% 0.05% 0.05% 0.09% 0.02% 0.10% 0.06% 30 0.04 0.02 0.04 0.04 0.12 0.03 0.11 0.10 35 0.05 0.03 0.05 0.05 0.15 0.06 0.16 0.23 40 0.07 0.04 0.07 0.07 0.21 0.10 0.22 0.35 45 0.11 0.06 0.11 0.11 0.30 0.16 0.34 0.56 50 0.18 0.10 0.18 0.18 0.44 0.24 0.53 0.85 55 0.28 0.16 0.28 0.28 0.68 0.34 0.88 1.31 60 0.48 0.24 1.02 0.48 65 0.92 0.35
*Applicable to calendar year 2020. Rate in future years are determined by the above rates and the MP-2015 scale.

Actuarial Section
70Missouri Local Government Employees Retirement System
Schedule 2Percent of Eligible Active Members Retiring Within Next Year
Without Rule of 80 Eligibility Retirement General Members Retirement Police/ Ages Men* Women* Ages Public Safety* Fire* 55 3.0% 3.0 % 50 2.5% 2.5% 56 3.0 3.0 51 2.5 2.5 57 3.0 3.0 52 2.5 2.5 58 3.0 3.0 53 2.5 2.5 59 3.0 3.0 54 2.5 2.5 60 10.0 10.0 55 10.0 13.0 61 10.0 10.0 56 10.0 13.0 62 25.0 15.0 57 10.0 13.0 63 20.0 15.0 58 10.0 13.0 64 20.0 15.0 59 10.0 13.0 65 25.0 25.0 60 10.0 15.0 66 25.0 25.0 61 10.0 15.0 67 20.0 25.0 62 25.0 20.0 68 20.0 25.0 63 20.0 20.0 69 20.0 20.0 64 20.0 20.0 70 100.0 100.0 65 100.0 100.0
Retirement Ages Men Women Police/Public Safety Fire 50 15.0% 15.0% 25.0% 25.0% 51 15.0 15.0 25.0 20.0 52 15.0 15.0 15.0 20.0 53 15.0 15.0 15.0 20.0 54 15.0 15.0 15.0 20.0 55 15.0 15.0 15.0 20.0 56 15.0 15.0 15.0 20.0 57 15.0 15.0 15.0 25.0 58 15.0 15.0 15.0 25.0 59 15.0 15.0 15.0 25.0 60 15.0 15.0 15.0 35.0 61 15.0 15.0 25.0 35.0 62 30.0 15.0 30.0 45.0 63 30.0 15.0 30.0 45.0 64 30.0 20.0 30.0 45.0 65 30.0 25.0 100.0 100.0 66 30.0 25.0 67 30.0 25.0 68 30.0 25.0 69 30.0 25.0 70 100.0 100.0
*First 5 years of retirement only apply to early retirement.
Percent of Eligible Active Members Retiring Within Next YearWith Rule of 80 Eligibility
Summary of Actuarial Assumptions (continued)

Actuarial Section
71Missouri Local Government Employees Retirement System
Actuarial Valuation Data
Participating Employers and Active Members
Number of Active Members Inflation Valuation Participating Valuation Annual Average % Increase % Date Employers Groups Number Payroll Pay Increase (CPI)
2-29-20 789 1,207 35,248 $ 1,787,038,817 $ 50,699 4.0 % 2.3 % 2-28-19 730 1,141 34,523 1,682,772,357 48,744 2.7 1.5 2-28-18 704 1,116 34,053 1,616,895,524 47,482 2.7 2.2 2-28-17 681 1,078 33,633 1,555,729,666 46,256 2.3 2.7 2-29-16 667 1,067 33,335 1,507,588,470 45,225 2.4 1.0 2-28-15 663 1,062 33,104 1,462,218,216 44,170 0.7 0.0 2-28-14 654 1,055 33,205 1,456,008,487 43,849 3.2 1.1 2-28-13 640 1,031 32,840 1,395,261,077 42,487 2.2 2.0 2-29-12 618 1,007 32,690 1,359,655,784 41,592 1.2 2.9 2-28-11 608 995 32,851 1,350,646,560 41,114 1.8 2.1
Retirant and Beneficiary Data Added to Rolls Removed from Rolls Rolls End of Year % Increase Average Year Annual Annual Annual in Annual Annual Ended No. Allowances* No. Allowances No. Allowances Allowances Allowances 2-29-20 1,914 $ 30,831,382 762 $ 8,309,766 25,288 $ 322,165,724 7.5% $ 12,740 2-28-19 1,909 33,269,236 691 7,232,130 24,136 299,644,108 9.5 12,415 2-28-18 1,898 30,005,238 760 7,909,356 22,918 273,607,002 8.8 11,939 2-28-17 1,817 24,889,736 686 6,826,899 21,780 251,511,120 7.7 11,548 2-29-16 1,715 21,160,239 634 6,604,522 20,649 233,448,283 6.6 11,306 2-28-15 1,698 25,056,006 632 5,764,961 19,568 218,892,566 9.7 11,186 2-28-14 1,586 20,455,414 587 5,265,017 18,502 199,601,520 8.2 10,788 2-28-13 1,524 20,204,275 504 4,963,681 17,503 184,411,123 9.0 10,536 2-29-12 1,519 22,768,228 528 4,421,797 16,483 169,170,529 12.2 10,263 2-28-11 1,399 16,372,009 529 4,939,905 15,492 150,824,098 8.2 9,736 *Includes post-retirement adjustments.
Each employer participating in the system is financially responsible for its own liabilities. Accordingly, the aggregate numbers pre-sented on this and the following page are indicative only of the overall condition of the system and are not indicative of the status of any one employer.

Actuarial Section
72Missouri Local Government Employees Retirement System
Actuarial Valuation DataSchedule of Funding Progress (in thousands)
LAGERS Schedule of Funding Progress Entry Age Unfunded UAL as a Actuarial Actuarial Accrued Annual % of Valuation Value of Accrued Liability Funded Covered Covered Date Assets Liability (UAL) Ratio Payroll Payroll 2-29-20 $ 8,083,991 $ 8,630,842 $ 546,851 93.7% $ 1,787,039 30.6% 2-28-19 7,698,245 8,113,101 414,856 94.9 1,682,772 24.7 2-28-18 7,297,700 7,631,703 334,003 95.6 1,616,896 20.7 2-28-17 6,764,626 7,135,950 371,324 94.8 1,555,730 23.9 2-29-16 6,320,171 6,671,352 351,181 94.7 1,507,588 23.3 2-28-15 5,972,471 6,324,109 351,638 94.4 1,462,218 24.0 2-28-14 5,388,199 5,873,911 485,712 91.7 1,456,008 33.4 2-28-13 4,692,219 5,423,684 731,465 86.5 1,395,261 52.4 2-29-12 4,274,440 5,120,274 845,834 83.5 1,359,656 62.2 2-28-11 3,945,086 4,837,423 892,337 81.6 1,350,647 66.1
As of February 29, 2020, the most recent actuarial valuation date, the plan on an aggregated basis was 93.7% funded on an actuarial basis. The actuarial accrued liability for benefits was $8.6 billion, and the actuarial value of assets was $8.0 billion, resulting in an unfunded actuarial accrued liability (UAAL) of $546.9 million. The covered payroll (annual payroll of active employees covered by the plan) was $1.8 billion, and the ratio of the UAAL to the covered payroll was 30.6%
Each employer participating in the System is financially responsible for its own obligation. Accordingly, the aggregated numbers presented on this page are indicative only of the overall condition of the System and are not indicative of any one employer.
The schedule of funding process present multi-year trend information about whether the actuarial values of plan assets are increasing or decreasing over time relative to the actuarial accrued liability for benefits.
Additional Information as of the Latest Actuarial Valuation Follows:
Valuation date 02-29-20Actuarial Cost Method Individual Entry AgeAmortization method Closed, level percent of payrollRemaining amortization period Varies between 0 and 30 years, by employerAsset valuation method 5–year smoothed market, 20% corridor
Actuarial Assumptions:Investment rate of return 7.25 % Projected salary increases 3.25% to 6.55% including wage inflationAssumed wage inflation rate 3.25%Post-retirement increases 2.5%
Mortality: The healthy retiree mortality tables, for post-retirement mortality, were the RP-2014 Healthy Annuitant mortality tables for males and females. The disabled retiree mortality tables, for post-retirement mortality, were the RP-2014 disabled mortality table for males and females. The pre-retirement mortality tables used were the RP-2014 employees mortality tables for males and females.
Both the post-retirement and pre-retirement tables were adjusted for mortality improvement back to the observation period base year of 2006. The base year for males was then established to be 2017. Mortality rates for a particular calendar year are determined by applying the MP-2015 mortality improvement scale to the above described tables.
(continued)

Actuarial Section
73Missouri Local Government Employees Retirement System
Short Condition TestThe LAGERS funding objective is to meet long term benefit promises through contributions that remain approximately level from year to year as a percent of member payroll. If the contributions to the system are level in concept and soundly executed, the system will pay all promised benefits when due — the ultimate test of financial soundness. Testing for level contribution rates is the long-term test.
A short condition test is one means of checking a system’s progress under its funding program. In a short condition test, the plan’s present assets (cash and investments) are compared with actuarial accrued liabilities for: (1) active member contributions on deposit; (2) future benefits to present retired lives; (3) service already rendered by active members. In a system that has been following the discipline of level percent of payroll financing, the liabilities for active member contributions on deposit and the future benefits to present retired lives will be fully covered by present assets (except in rare circumstances). In addition, the liabilities for service already rendered by active members will be at least partially covered by the remainder of present assets. The larger the funded portion of liability (3), the stronger the condition of the system.
The schedule below illustrates the most recent 10 year history of the system’s actuarial accrued liabilities and is indicative of the LAGERS policy of following the discipline of level percent of payroll financing.
*There are sixty-five groups presently without active members for which dollar contribution rates were computed.They are not included in the totals.
Valuation Date Decreases Increases Unchanged Total* 2-29-20 342 771 94 1,207 2-28-19 385 651 105 1,141 2-28-18 494 487 135 1,116 2-28-17 397 576 105 1,078 2-29-16 255 759 53 1,067 2-28-15 738 244 80 1,062 2-28-14 772 231 52 1,055 2-28-13 595 359 77 1,031 2-29-12 507 439 61 1,007 2-28-11 230 724 41 995
Entry Age Accrued Liability For (1) (2) (3) Portion of Active Retirants Active Members Actuarial Accrued Liability Valuation Member and (Employer Financed Value Covered by Assets Date Contributions Beneficiaries* Portion) of Assets (1) (2) (3) 2-29-20 $ 169,100,962 $ 4,121,913,291 $ 4,339,827,890 $ 8,083,990,980 100 100 87 2-28-19 162,317,487 3,840,475,375 4,110,307,786 7,698,244,648 100 100 90 2-28-18 150,947,222 3,548,016,100 3,932,739,323 7,297,699,793 100 100 92 2-28-17 144,754,979 3,195,680,396 3,795,514,878 6,764,626,389 100 100 90 2-29-16 137,652,896 2,896,669,106 3,637,030,335 6,320,171,438 100 100 90 2-28-15 133,985,740 2,797,401,342 3,392,722,109 5,972,471,342 100 100 90 2-28-14 129,399,490 2,401,194,322 3,343,317,147 5,388,198,677 100 100 85 2-28-13 107,120,593 2,132,575,405 3,183,988,245 4,692,218,862 100 100 77 2-29-12 102,637,353 1,954,579,782 3,063,057,063 4,274,440,345 100 100 72 2-28-11 98,127,911 1,737,107,211 3,002,188,189 3,945,085,880 100 100 70 *Includes reserve for future benefit increases.
Employer Contribution Rate ChangesAnnual actuarial valuations are conducted by the system to determine employer contribution rates for the ensuing fiscal year of the employer. As of February 29, 2020, there were 1,207 separate contribution rates determined for the 789 participating political subdivisions in the system. Of these new employer contribution rates, 771 were increases over the previous year and 342 were decreases from the previous year’s rate. A 10 year comparative schedule of contribution rate adjustments is shown below:

Actuarial Section
74Missouri Local Government Employees Retirement System
Employer Contribution RatesLife Benefit Program Number of Valuation Groups
Contributory Groups Non-Contributory Groups Under 2.00- 5.00- Over Under 2.00- 5.00- Over 2.00% 4.99% 7.99% 8.00% 2.00% 4.99% 7.99% 8.00% Totals*Benefit Program L-1 General 12 23 21 35 7 11 14 15 138Police 4 13 9 2 2 4 6 3 43Fire 0 2 3 5 0 0 1 1 12Public Safety 0 0 0 1 0 0 0 0 1Total: 16 38 33 43 9 15 21 19 194 Benefit Program L-3 General 11 6 17 22 11 8 14 20 109Police 3 8 1 3 4 8 7 7 41Fire 0 2 2 1 1 1 1 4 12Public Safety 0 0 0 0 0 0 0 1 1Total: 14 16 20 26 16 17 22 32 163Benefit Program L-6 General 1 1 6 53 3 0 3 99 166Police 1 4 6 18 1 1 4 45 80Fire 1 1 0 15 1 1 0 20 39Public Safety 0 0 0 0 0 0 0 0 0Total: 3 6 12 86 5 2 7 164 285Benefit Program L-7 General 6 6 26 29 4 17 43 95 226Police 4 6 9 9 3 10 16 19 76Fire 0 1 2 7 2 2 3 6 23Public Safety 0 0 0 0 0 0 0 0 0Total: 10 13 37 45 9 29 62 120 325Benefit Program L-9 General 1 1 1 3 2 1 1 3 13Police 0 1 0 0 1 0 2 0 4Fire 0 0 0 0 0 0 0 0 0Public Safety 0 0 0 0 0 0 0 0 0Total: 1 2 1 3 3 1 3 3 17Benefit Program L-11 General 0 0 0 1 0 0 0 3 4Police 0 0 0 3 0 0 0 2 5Fire 0 0 0 3 0 0 0 4 7Public Safety 0 0 0 0 0 0 0 0 0Total: 0 0 0 7 0 0 0 9 16Benefit Program L-12 General 0 0 2 10 3 3 8 29 55Police 0 0 1 4 2 3 6 12 28Fire 0 0 1 1 3 1 0 6 12Public Safety 0 0 0 0 0 0 0 1 1Total: 0 0 4 15 8 7 14 48 96
Totals* 44 75 107 225 50 71 129 395 1,096
*There are twenty-nine contributory groups and thirty-six non-contributory groups without active members for which dollar contribution rates were computed. They are not included in the totals.

Actuarial Section
75Missouri Local Government Employees Retirement System
Employer Contribution Rates (continued)
Life and Temporary Number of Valuation Groups
Benefit Program Contributory Groups Non-Contributory Groups Under 2.00- 5.00- Over Under 2.00- 5.00- Over 2.00% 4.99% 7.99% 8.00% 2.00% 4.99% 7.99% 8.00% Totals*Benefit Program LT-4(65) General 1 2 1 1 0 0 0 1 6Police 0 0 0 0 0 0 1 0 1Fire 0 0 0 0 0 0 0 0 0Public Safety 0 0 0 0 0 0 0 0 0Total: 1 2 1 1 0 0 1 1 7 Benefit Program LT-5(62) General 0 0 0 0 1 0 0 0 1Police 0 0 0 0 0 0 0 0 0Fire 0 0 0 0 0 0 0 0 0Public Safety 0 0 0 0 0 0 0 0 0Total: 0 0 0 0 1 0 0 0 1Benefit Program LT-5(65) General 0 0 0 0 0 1 1 1 3Police 0 0 0 0 1 0 1 2 4Fire 0 0 0 0 1 0 1 1 3Public Safety 0 0 0 0 1 0 0 0 1Total: 0 0 0 0 3 1 3 4 11Benefit Program LT-8(62) General 0 1 0 0 0 1 0 1 3Police 0 0 0 1 0 0 0 1 2Fire 0 0 0 0 0 0 0 1 1Public Safety 0 0 0 0 0 0 0 0 0Total: 0 1 0 1 0 1 0 3 6Benefit Program LT-8(65) General 1 0 2 3 0 2 11 7 26Police 1 1 1 0 1 1 3 10 18Fire 0 0 0 1 3 0 1 6 11Public Safety 0 0 0 0 0 0 0 1 1Total: 2 1 3 4 4 3 15 24 56Benefit Program LT-10(65) General 0 0 0 2 1 0 2 5 10Police 0 0 0 0 1 0 0 1 2Fire 0 0 0 0 0 0 0 0 0Public Safety 0 0 0 0 0 0 0 0 0Total: 0 0 0 2 2 0 2 6 12Benefit Program LT-14(65) General 0 0 0 1 0 0 2 7 10Police 0 0 0 0 1 0 1 3 5Fire 0 0 0 0 0 0 0 3 3Public Safety 0 0 0 0 0 0 0 0 0Total: 0 0 0 1 1 0 3 13 18
Totals* 3 4 4 9 11 5 24 51 111
*There are twenty-nine contributory groups and thirty-six non-contributory groups without active members for which dollar contribution rates were computed. They are not included in the totals.

Actuarial Section
76Missouri Local Government Employees Retirement System
Type of ActivityGain or (Loss)For Year Ended
2/29/2020% of Liability
Age & Service Retirements. If members retire at older ages or with lower final average pay than assumed, there is a gain. If younger ages or higher average pays, a loss.
$ (3,308,768) (0.04)%
Death-in-Service Benefits. If survivor claims are less than assumed, there is a gain. If more claims, there is a loss.
281,930 0.00
Withdrawal From Employment. If more liabilities are released by withdrawals than assumed, there is a gain. If smaller releases, a loss.
6,678,461 0.08
Disability Benefits. If more liabilities are released by disabilities than assumed, there is a gain. If smaller, a loss.
(302,208) 0.00
Pay Increases. If there are smaller pay increases than assumed, there is a gain. If greater increases, a loss.
(56,685,606) (0.70)
Investment Income. If there is greater investment return on assets than assumed, there is a gain. If less return, a loss. (55,859,330) (0.69)
New Active Members. Includes the hiring of existing LAGERS members by other employers. (16,875,548) (0.21)
Benefit Reserve Fund. Release of reserve for future experience and other retiree experience on system-wide UAAL.
28,035,470 0.35
Other. Miscellaneous gains and losses resulting from data adjustments, timing of financial transactions, valuation methods, etc.
(18,830,586) (0.23)
Gain or (Loss) During Year From Experience $ (116,866,185) (1.44)%
Schedule of Gains & Lossesin Accrued Liabilities for the Year Ended February 29, 2020
Actuarial Section
77Missouri Local Government Employees Retirement System
Summary of Plan ProvisionsPurposeThe Missouri Local Government Employees Retirement System (LAGERS) is a body corporate created and governed by the State of Missouri to provide retirement, survivors and disability benefits to the state’s local government employees in the most efficient and economical manner possible. As such, LAGERS is a non-profit entity which has the responsibility of administering the law in accor-dance with the expressed intent of the General Assembly and bears a fiduciary obligation to the State of Missouri, the taxpayers and the public employees who are its beneficiaries.
This summary of LAGERS plan provisions is included for informational purposes only. System eligibility requirements and benefits provisions are determined pursuant to Chapter 70, RSMo. and LAGERS Administrative Rules, 16 CSR 20. Accordingly, members, retirees, beneficiaries, and participating political subdivisions are urged to contact LAGERS before making any decisions related to matters included in the following summary.
AdministrationThe statutes provide that the administration of LAGERS be vested in a seven member Board of Trustees. Three of these trustees are “Member Trustees” who must be participating members of the system. Three members of the Board are “Employer Trustees” who must be members of the governing body of a member subdivision, but who do not personally participate in LAGERS. The statutes which govern LAGERS require that an Annual Meeting be held in the last calendar quarter of each year. Each participating political subdivision is to conduct a secret ballot election allowing each member in that subdivision to vote to elect a “member” delegate to the Annual Meeting. The governing body may then select one of their own, or another person acting in their behalf, to serve as “employer” delegate for the subdivision. All Member and Employer Trustees are elected by their respective delegates at the LAGERS Annual Meeting. The remaining Board member is a “Citizen Trustee” appointed by the governor, who can be neither a member nor employer. A complete listing of the current Board of Trustees is included on page 14.
The management of LAGERS is vested in an Executive Director who is appointed by the Board and serves at their pleasure. The Executive Director acts as advisor to the Board on all matters pertaining to the system and, with the approval of the Board, contracts for professional services and employs the remaining staff needed to operate the system. A listing of the LAGERS team is included on page 15 and advisors is included on page 8.
Normal RetirementA member may retire with an age and service allowance after completing: 1.) at least five years of credited service, and 2.) attaining his minimum service retirement age. This minimum service retirement age is 60 for general members and 55 for law enforcement or fire personnel.
A participating LAGERS subdivision may, by a majority vote of the governing body, select an alternate unreduced retirement for employees whose age and service total 80 or more. This provision also requires five years of credited service.
Final Average SalaryFinal average salary is the average of a member’s monthly pay during the period of 60 consecutive months of credited service producing the highest monthly average, which is contained within the 120 consecutive months of credited service immediately preceding retirement. For most members, this is the last five years of employment. A participating LAGERS subdivision may, by majority vote of the governing body, elect to have their future retirants’ bene fits calculated using a 36 month final average salary period.
Credited ServiceCredited service is a combination of the prior service a member accrued prior to his employer joining LAGERS and the membership service he accrues after that date. Because LAGERS is a state-wide retirement system with hundreds of member subdivisions, credited service can be a combination of service with several employers.

Actuarial Section
78Missouri Local Government Employees Retirement System
Age and Service AllowanceThis is the normal retirement benefit and is payable monthly for the lifetime of a member. It equals a specified percent of a member’s final average salary multiplied by his number of years of credited service. Each employer elects the percent applicable to his members from 10 available programs: L-1 (1% for life); L-3 (1.25% for life); LT-4(65) (1% for life, 1% to age 65); LT-5(65) (1.25% for life, .75% to age 65); L-6 (2% for life); L-7 (1.5% for life); LT-8(65) (1.5% for life, .5% to age 65); L-12 (1.75% for life); LT-14(65) (1.75% for life, .25% to age 65); and L-11 (2.5% for life – non-OASDI coverage only). All LT programs denoted LT(62) extend temporary benefits to age 62, rather than age 65. These benefit programs can be changed by majority vote of the subdivision’s governing body, but not more often than biennially.
Early RetirementA member in service may retire with an early retirement benefit after completing: 1.) at least five years of credited service, and 2.) attaining age 55 if a general member or age 50 for a law enforcement or fire member. The early retirement benefit is computed in the same manner as an age and service allowance but reduced by ½ of 1 percent for each month the retirant is younger than his minimum service retirement age.
Deferred RetirementIf a member leaves LAGERS covered employment before attaining his early retirement age, but after completing five or more years of service, he becomes eligible for a deferred allowance; provided he lives to his early retirement age and does not withdraw his accumulated contributions, if applicable. Deferred members with less than 10 years of credited service and greater than 10 years until their minimum service retirement age may be eligible for a lump-sum payment. Any deferred benefit paid prior to the member attaining his minimum service retirement age will be reduced ½ of 1 percent for each month the retirant is younger than his minimum service retirement age.
Non-Duty Disability BenefitA member with five or more years of credited service who becomes totally and permanently disabled from performing his job from other than duty connected causes is eligible for a non-duty disability benefit computed in the same manner as an age and service allowance, based upon his service and salary to time of disability.
Duty Disability BenefitA member who becomes totally and permanently disabled from performing his job from a duty related injury or disease is eligible for a duty disability benefit computed in the same manner as an age and service allowance, but based upon the years of service the member would have completed had he continued in LAGERS covered employment to age 60. Continuing medical examinations are required to confirm the disability once per year for the first five years and once every three years thereafter until reaching the minimum service retirement age.
Survivors Benefit, Non-Duty DeathUpon the death of a member who had completed at least five years of credited service, an eligible spouse will receive a non-duty death benefit computed upon the deceased member’s service and salary to time of death. The surviving spouse receives an allowance equal to the Option A allowance (joint and 75 percent survivor benefits). If no spouse benefit is payable, the dependent children under age 18 (23 if they are full-time students) each receive an equal share of 60 percent of the Life allowance computed for the deceased. In the event there are no surviving spouse or dependent children, any member contributions will be distributed to the named beneficiary of record.
Survivors Benefit, Duty DeathIf a member’s death was the natural and proximate result of a personal injury or disease arising out of and in the course of his actual performance of duty as an employee, the spouse is eligible for a duty death benefit computed in the same manner as an age and service allowance, but based upon the years of service the member would have completed had he continued in LAGERS covered employment to age 60. The surviving spouse receives an allowance equal to the Option A allowance (joint and 75 percent survivor benefits). If no spouse benefit is payable, the dependent children under age 18 (23 if they are full-time students) each receive an equal share of 60 percent of the life allowance computed for the deceased. In the event there are no surviving spouse or dependent children, any member contributions will be distributed to the named beneficiary of record.
Summary of Plan Provisions (continued)
Actuarial Section
79Missouri Local Government Employees Retirement System
Post Retirement AdjustmentAll retired members are eligible for an annual post retirement adjustment beginning the October first twelve months after the effective date of their allowance. The adjustment is based on the increase in the Consumer Price Index and is limited to 4 percent per year. The Board of Trustees determines annually the amount of the post retirement adjustment subject to the 4 percent maximum or the increase in the Consumer Price Index.
Optional Forms of PaymentWhen a LAGERS member makes application for retirement, his benefits are calculated in several optional forms and he selects the one that best fits his retirement needs. This election of an optional form of payment is made immediately prior to the receipt of the first benefit check and once the election is made, it is irrevocable. The options are as follows:
Life Option: This is the largest payment available to a retirant. Upon the death of the retirant monthly payments cease. If the member has not withdrawn at least his accumulated contributions before death, a refund of the balance of his account is made to his beneficiary of record.
Option A: This is a continuing spouse option which allows the retirant to receive less (85 percent if spouse age is the same) of the Life Option with the provision that the surviving spouse will receive 75 percent of the member’s benefit for the remainder of his or her lifetime.
Option B: This option is also a continuing spouse option similar to Option A except the percentages are slightly changed. Under Option B, the retirant would receive a higher benefit (90 percent of the Life Option if spouse is the same age) with the surviving spouse receiving 50 percent of the member’s benefit for the remainder of his or her lifetime.
Option C: The final of the four options is referred to as a “ten-year certain” option. As with the other options, the benefit (95 percent of the Life Option) is payable for the lifetime of the member but with an added provision that the system will make at least 120 monthly payments. If the employee lives over 10 years after retirement, monthly payments will cease upon his death.
Partial Lump Sum Feature (PLUS): This feature provides the option to elect a partial lump sum distribution of the monthly retirement benefit, coupled with a reduced future monthly benefit. The lump sum distribution would be equal to 24 monthly payments of the life allowance amount (does not include any temporary allowance payable under a Life and Temporary plan) at time of retirement. The lump sum payment would result in a reduction (approximately 16 percent) of the retiree’s future monthly benefit adjusted for age. All the current options (Life, Option A, Option B and Option C) still apply and may be elected with or without the partial lump sum feature.
Member ContributionsPolitical subdivisions may participate in LAGERS under either a contributory or non-contributory plan. If the subdivision participates under the contributory plan, each member contributes 4 percent of his gross salary, beginning after he has completed sufficient employment for six months of credited service. If a member leaves LAGERS covered employment before an allowance is payable upon his behalf, his accumulated contributions are refunded to him. If he dies prior to accruing five or more years of credited service, his accumulated contributions are refunded to his designated beneficiary(s) unless a duty-related death benefit is payable. If the subdivision participates under the non-contributory plan, the employing political subdivision pays the entire cost, while the members make no contributions.
Local governments participating in LAGERS are permitted, if the governing body elects, to grant refunds of members’ contributions after two years of participation in the system under the non-contributory option. The cost of this option would be borne by the governmental unit.
Employer ContributionsThe statutes require each employer to contribute the remaining amounts above that contributed by their members to finance the benefits that political subdivision has promised their employees through their participation in LAGERS. These employer contributions are determined annually by the system’s retained actuary and are based upon level-percent-of-payroll funding principles so that the contribution rates do not have to increase over decades of time. A chart showing the employer contribution rates for all LAGERS employers is included on pages 74-75 of this report.

StatisticalSection 5:
Photo Credit: LAGERS Retiree Keith Trader

Statistical Section
81Missouri Local Government Employees Retirement System
Statistical SummaryThe objectives of the statistical section are to provide additional historical perspective, context, and relevant details to assist readers in using information in the financial statements, notes to the financial statements, and required supplementary information in order to understand and assess LAGERS overall financial condition.
The schedules beginning on page 81 show financial trend information about the change in LAGERS’ assets for the past 10 years. These schedules provide detailed information about the trends of key sources of asset additions and deductions, which assist in providing a context framing how LAGERS financial position has changed over time. The financial trend schedules presented are:
• Change in Fiduciary Net Position
• Interest Credits to Reserve Accounts
The schedules beginning on page 83 show demographic and economic information. This information is designed to assist in under-standing the environment in which LAGERS operates. The demographic and economic information and the operating information presented include:
• Retired Member Data
• Benefit Expenses by Type
• Average Monthly Benefit Payments
• Participants by Classification
• Participating Political Subdivisions
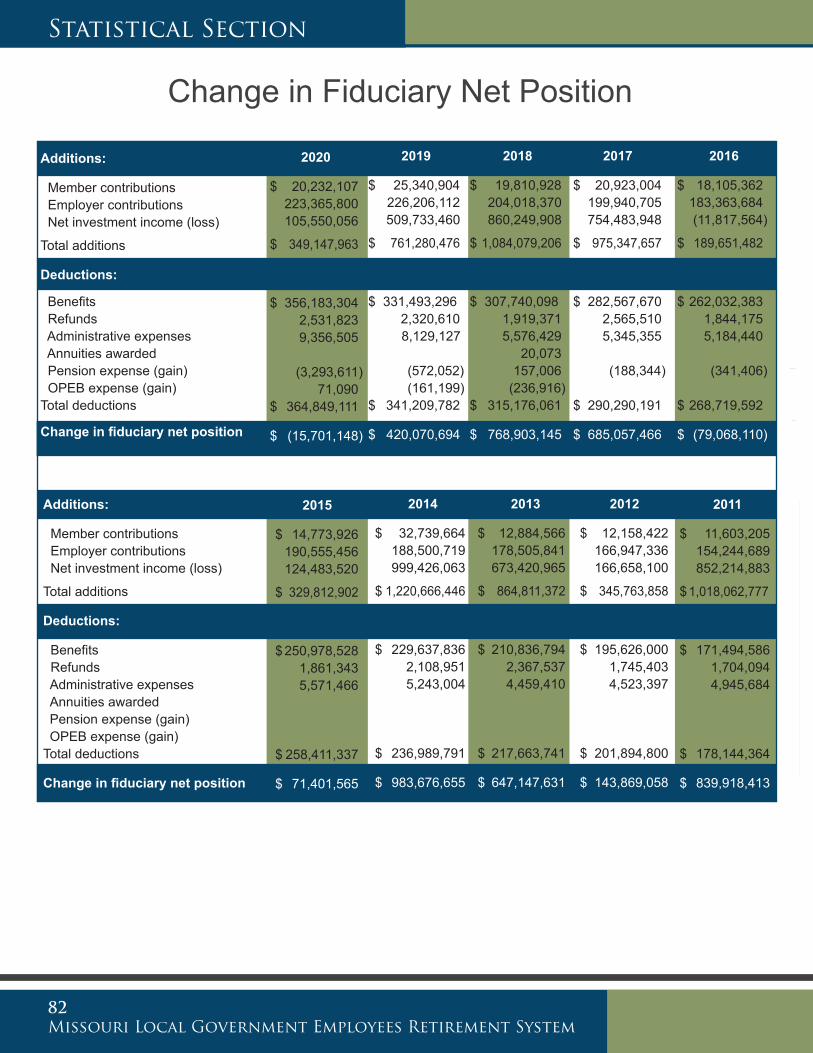
Statistical Section
82Missouri Local Government Employees Retirement System
Change in Fiduciary Net Position
Additions:
Member contributions Employer contributions Net investment income (loss)
Total additions
Deductions:
Benefits Refunds Administrative expenses Annuities awarded Pension expense (gain) OPEB expense (gain)Total deductions
Change in fiduciary net position
2012
$ 12,158,422 166,947,336 166,658,100
$ 345,763,858
$ 195,626,000 1,745,403 4,523,397
$ 201,894,800
$ 143,869,058
2011
$ 11,603,205 154,244,689 852,214,883
$ 1,018,062,777
$ 171,494,586 1,704,094 4,945,684
$ 178,144,364
$ 839,918,413
2015
$ 14,773,926 190,555,456 124,483,520
$ 329,812,902
$ 250,978,528 1,861,343 5,571,466
$ 258,411,337
$ 71,401,565
Additions:
Member contributions Employer contributions Net investment income (loss)
Total additions
Deductions:
Benefits Refunds Administrative expenses Annuities awardedPension expense (gain)OPEB expense (gain)
Total deductions
Change in fiduciary net position
2013
$ 12,884,566 178,505,841 673,420,965
$ 864,811,372
$ 210,836,794 2,367,537 4,459,410
$ 217,663,741
$ 647,147,631
2016
$ 18,105,362 183,363,684 (11,817,564)
$ 189,651,482
$ 262,032,383 1,844,175 5,184,440
(341,406)
$ 268,719,592
$ (79,068,110)
2017
$ 20,923,004 199,940,705 754,483,948
$ 975,347,657
$ 282,567,670 2,565,510 5,345,355 (188,344)
$ 290,290,191
$ 685,057,466
2018
$ 19,810,928 204,018,370 860,249,908
$ 1,084,079,206
$ 307,740,098 1,919,371 5,576,429 20,073 157,006 (236,916) $ 315,176,061
$ 768,903,145
2014
$ 32,739,664 188,500,719 999,426,063
$ 1,220,666,446
$ 229,637,836 2,108,951 5,243,004
$ 236,989,791
$ 983,676,655
2019
$ 25,340,904 226,206,112 509,733,460
$ 761,280,476
$ 331,493,296 2,320,610 8,129,127 (572,052) (161,199) $ 341,209,782
$ 420,070,694
2020
$ 20,232,107 223,365,800
105,550,056
$ 349,147,963
$ 356,183,304 2,531,823 9,356,505
(3,293,611) 71,090 $ 364,849,111
$ (15,701,148)

Statistical Section
83Missouri Local Government Employees Retirement System
A retirement system acquires and invests assets as the result of following the financial objective of level contribution rates. The Board of Trustees of LAGERS has the responsibility for seeing that the assets are invested effectively and within the limits imposed by law. The Board retains professional money managers to assist in the investment process and reviews their activities throughout the year.
The investment process continues to be volatile because of major disturbances in the economic environment.
Following is a table showing investment credits to the various reserves of the system for the last 5 years.
(A) Casualty Reserve assets are for the non-accrued service portion of disability benefits to future retired lives and service related deaths. The investment percent is the rate set for actuarial purposes.
(B) Member Deposit assets are the contributions of non-retired members. The investment percent, set by the Board, affects amounts payable to members who request a refund. The percent does not affect the monthly benefit of a retiring member.
(C) Benefit Reserve assets are for benefits to present retired lives. The investment credit is the remainder of net investment return after crediting the Casualty Reserve assets. This revised allocation of investment credits is intended to provide the resources for additional benefit increases after retirement. The investment credit to the Benefit Reserve is limited if the funded ratio of the reserve exceeds 125 percent. In addition, interest credits to the Employer Reserve are limited if the funded ratio of the Benefit Reserves is below 75 percent.
(D) Employer Reserve assets are for benefits to future retired lives including the accrued service portion of disability benefits. The investment credit is the remainder of the net investment return after crediting the Casualty Reserve assets, followed by a further adjustment for the investment credit to the Member Deposit assets. The Employer Reserve is responsible for covering liability increases resulting from inflation losses.
Interest Credits to Reserve Accounts
(A) (B) (C) (D) Inflation Year Ended Casualty Member Benefit Employer Percent June 30 Reserve Reserves Reserve Reserve (CPI) 2020 7.25% 0.5% 1.3% 1.3% 0.6% 2019 7.25 0.5 6.6 6.8 1.6 2018 7.25 0.5 12.4 12.9 2.9 2017 7.25 0.5 12.0 12.5 1.6 2016 7.25 0.5 (0.4) (0.4) 1.0 5-Year Compound Average 6.4 6.5 1.5
Rate of Investment Return AllocatedInvestment Credits as a Percent of Fund Balance

Statistical Section
84Missouri Local Government Employees Retirement System
Retired Member Data
Employee Classification *Type of Retirement Option Selected Amount of Monthly Benefit General Police Fire #40 #60 #71 #72 #73 #81 #82 #83 Life Opt. A Opt. B Opt. C
Deferred 5,884 1,908 340 8,132 $ 1 - $ 100 1,235 487 80 114 42 40 16 788 639 163 801 534 212 255 $ 101 - $ 200 2,151 536 52 139 30 63 25 1,388 858 236 1,317 746 239 437 $ 201 - $ 300 2,020 385 55 102 22 69 32 1,335 713 187 1,237 632 254 337 $ 301 - $ 400 1,619 293 50 68 16 66 26 1,174 462 150 1,010 469 213 270 $ 401 - $ 500 1,371 284 49 64 19 47 31 1,020 392 131 826 410 232 236$ 501 - $ 600 1,190 237 38 53 24 45 29 873 325 116 727 394 169 175 $ 601 - $ 700 1,011 208 49 49 23 44 20 785 249 98 621 328 172 147 $ 701 - $ 800 842 156 40 35 14 42 24 681 172 70 515 257 151 115$ 801 - $ 900 763 142 39 25 18 34 12 611 169 75 444 238 151 111 $ 901 - $1000 725 125 36 29 37 29 11 566 150 64 404 215 161 106 $ 1001 - $1100 622 95 40 17 31 25 11 498 117 58 354 195 128 80 $ 1101 - $1200 590 80 39 12 22 33 6 482 104 50 332 173 135 69 $ 1201 - $1300 541 97 28 11 36 24 7 452 84 52 297 177 116 76$ 1301 - $1400 428 82 32 17 22 23 4 374 69 33 232 150 94 66 $ 1401 - $1500 436 75 38 15 27 21 7 396 55 28 234 149 106 60$ 1501 - $1600 352 73 44 8 29 15 3 329 62 23 194 131 91 53 $ 1601 - $1700 334 82 39 7 28 13 3 334 45 25 210 140 71 34 $ 1701 - $1800 303 76 40 11 14 10 3 324 45 12 172 125 87 35 $ 1801 - $1900 296 56 30 5 14 10 1 295 39 18 170 100 75 37$ 1901 - $2000 265 62 29 9 16 6 1 276 36 12 151 92 77 36 OVER - $2000 2,806 729 561 43 244 57 8 3,397 273 74 1,892 1,013 946 245
SUBTOTALS 25,784 6,268 1,748 8,132 833 728 716 280 16,378 5,058 1,675 12,140 6,668 3,880 2,980 TOTALS 33,800 33,800 25,668
*See Summary of Plan Provisions for description of retirement and benefit options.#40—Deferred Retirement #73—Survivor Payment-Disability Retirement#60—Deceased & Monthly Benefit Payable #81—Normal Retirement#71—Duty Disability Retirement #82—Early Retirement#72—Non-Duty Disability Retirement #83—Survivor Payment-Normal Retirement

Statistical Section
85Missouri Local Government Employees Retirement System
Benefit Expenses by TypeBenefit Expenses by Type:
Normal benefitsSurvivor benefits
Total benefits
Total refunds
Benefit Expenses by Type:
Normal benefitsSurvivor benefits
Total benefits
Total refunds
2014
$220,127,1549,510,682
$229,637,836$ 2,108,951
2013
$201,911,2358,925,559
$210,836,794$ 2,367,537
2012
$187,148,9058,477,095
$195,626,000$ 1,745,403
2011
$163,723,3827,771,204
$171,494,586$ 1,701,094
2020
$340,903,75115,279,553
$356,183,304$ 2,531,823
2015
$240,601,32110,377,207
$250,978,528$ 1,861,343
2016
$250,998,83611,033,547
$262,032,383$ 1,844,175
2017
$270,803,039 11,764,631
$282,567,670 $ 2,565,510
2018
$295,021,094 12,719,004
$307,740,098 $ 1,919,371
2019
$317,431,967 14,061,329
$331,493,296 $ 2,320,610

Statistical Section
86Missouri Local Government Employees Retirement System
Average Monthly Benefit Payments
Retirement Effective Dates Years of Credited Service by CategoryFor Fiscal Years Ended June 30: 5-10 11-15 16-20 21-25 26-30 31 +
2020 Average Monthly Benefit $ 306 $ 727 $ 1,276 $ 1,654 $ 2,516 $ 3,327 Average Final Average Salary 3,765 3,899 4,714 4,671 5,622 6,171 Number of Active Retirants 596 243 219 187 138 202
2019 Average Monthly Benefit $ 320 $ 734 $ 1,168 $ 1,502 $ 2,304 $ 3,123 Average Final Average Salary 3,758 3,980 4,329 4,347 5,603 5,653 Number of Active Retirants 637 267 235 196 154 226
2018 Average Monthly Benefit $ 299 $ 747 $ 1,087 $ 1,554 $ 2,475 $ 3,106 Average Final Average Salary 3,694 3,940 3,961 4,468 5,549 5,657 Number of Active Retirants 623 263 225 161 162 200
2017 Average Monthly Benefit $ 301 $ 685 $ 1,061 $ 1,541 $ 2,154 $ 3,139 Average Final Average Salary 3,624 3,762 4,104 4,720 5,095 5,786 Number of Active Retirants 576 319 233 167 137 182
2016 Average Monthly Benefit $ 292 $ 668 $ 995 $ 1,508 $ 2,118 $ 2,905 Average Final Average Salary 3,553 3,761 3,932 4,603 4,960 5,436 Number of Active Retirants 566 257 188 167 166 166
2015 Average Monthly Benefit $ 272 $ 649 $ 961 $ 1,440 $ 2,156 $ 3,005 Average Final Average Salary 3,318 3,533 3,810 4,247 5,069 5,493 Number of Active Retirants 547 261 205 189 150 200
2014 Average Monthly Benefit $ 268 $ 630 $ 984 $ 1,420 $ 2,008 $ 2,789 Average Final Average Salary 3,225 3,398 3,832 4,171 4,831 5,362 Number of Active Retirants 569 261 180 144 127 162
2013 Average Monthly Benefit $ 278 $ 624 $ 915 $ 1,418 $ 2,098 $ 2,699 Average Final Average Salary 3,176 3,444 3,642 4,166 4,652 5,162 Number of Active Retirants 540 241 188 144 128 151
2012 Average Monthly Benefit $ 276 $ 632 $ 978 $ 1,335 $ 1,961 $ 2,712 Average Final Average Salary 3,128 3,302 3,729 3,941 4,522 4,922 Number of Active Retirants 520 269 191 149 107 171
2011 Average Monthly Benefit $ 277 $ 590 $ 993 $ 1,392 $ 1,784 $ 2,585 Average Final Average Salary 3,081 3,206 3,724 4,049 4,063 4,701 Number of Active Retirants 452 213 166 158 110 149From July 1, 2010 through June 30, 2020Average Monthly Benefit $ 289 $ 669 $ 1,042 $ 1,476 $ 2,157 $ 2,939Average Final Average Salary 3,432 3,623 3,978 4,338 4,997 5,435Number of Active Retirants 5,626 2,594 2,030 1,662 1,379 1,809

Statistical Section
87Missouri Local Government Employees Retirement System
Employee Members
Health Special Water Road Fire Emergency Soil & Water Year Cities Counties Agencies Districts Districts Districts Districts Services Libraries Cons. Dist. Total
2020 19,262 8,919 1,594 2,366 233 87 1,030 1,068 1,106 145 35,810 2019 19,063 8,711 1,637 2,293 216 79 946 1,027 1,089 69 35,130 2018 18,743 8,677 1,610 2,283 209 83 899 948 981 34,433 2017 18,544 8,546 1,621 2,303 210 84 820 910 961 33,999 2016 18,388 8,548 1,662 2,380 204 81 712 850 956 33,781 2015 18,289 8,311 1,726 2,321 204 84 684 777 914 33,310 2014 18,336 8,421 1,754 2,312 207 84 685 730 909 33,438 2013 17,959 8,336 1,855 2,272 202 82 657 680 878 32,921 2012 17,944 8,508 1,811 2,305 212 83 596 572 894 32,925 2011 18,148 8,637 1,852 2,269 211 86 572 544 922 33,241
Participants by Classification
Political Subdivisions
Health Special Water Road Fire Emergency Soil & Water Year Cities Counties Agencies Districts Districts Districts Districts Services Libraries Cons. Dist. Total
2020 315 60 70 61 42 28 55 66 48 61 806 2019 314 60 68 58 41 28 51 62 48 28 758 2018 309 60 68 57 40 27 49 58 47 7152017 302 60 66 53 39 27 46 56 46 695 2016 299 60 66 50 39 27 43 53 45 682 2015 296 60 65 49 38 27 40 48 45 668 2014 295 60 65 48 38 27 39 47 44 6632013 288 60 65 47 39 26 36 41 42 644 2012 285 60 62 46 39 25 32 34 39 622 2011 281 60 60 43 39 26 30 32 39 610

Statistical Section
88Missouri Local Government Employees Retirement System
City or Municipality Name: Employee Benefit Rule Final Average Employee Non-Contrib. Membership Members Program† of 80 Salary Period Contrib. Refund Date
Advance 8 L-1 no 5 no no 10-2005 Airport Drive 1 L-7 no 3 no no 05-2000 Albany 19 L-7 yes 3 yes no 07-1989 Anderson 12 L-3 no 5 yes no 06-1990 Annapolis 2 L-7 no 3 yes no 07-2001 Arcadia 3 L-1 no 5 yes no 08-2015 Arnold 72 L-6 yes 3 no no 01-1984 Ash Grove 10 L-7 no 3 yes no 04-1972 Ashland 17 L-7 no 5 yes no 06-1970 Aurora 47 L-12 no 3 no yes 07-1972 Auxvasse 5 L-7 yes 5 no no 01-1994 Ava 46 L-6 yes 3 no no 09-1997 Ballwin 127 L-12 no 3 yes no 11-1969 Belle 5 L-7 no 5 yes no 05-1987 Bellefontaine Neighbors 48 L-6 no 3 no no 07-1968 Bellflower 1 L-6 no 3 yes no 08-1990 Bel-Ridge 17 L-1 no 5 yes no 02-2002 Belton 196 L-6 no 3 no yes 02-1974 Berkeley 46 LT-10 (Age 65) yes 3 no no 07-1968 Bernie 16 L-3 no 3 no no 08-1978 Bethany 23 L-6 no 5 yes no 01-1976 Beverly Hills 1 L-1 no 5 yes no 07-1991 Bevier 3 L-1 no 5 yes no 07-1999 Bland 2 L-1 yes 5 no no 09-1994 Bloomfield 11 L-1 no 5 no no 10-2001 Blue Springs 266 L-7 no 3 no yes 09-1973 Bolivar 88 L-7 no 3 yes no 02-1973 Boonville 68 L-12 no 3 no yes 05-1971 Bourbon 6 L-3 no 3 no no 01-2000 Bowling Green 16 L-12 no 5 no yes 01-1979 Branson 257 L-6 yes 3 yes no 01-1978 Braymer 4 LT-8 (Age 62) no 3 yes no 12-1970 Breckenridge Hills 22 L-1 no 3 yes no 05-2020 Brentwood 59 L-7 no 3 no yes 04-1969 Brookfield 39 L-3 no 5 no no 02-1989 Buckner 13 L-1 no 3 yes no 10-1987 Buffalo 22 L-7 yes 3 yes no 01-1974 Butler 49 LT-5 (Age 65) yes 3 no no 06-1993 Cabool 31 L-12 no 3 no yes 10-1969 Camdenton 39 L-7 no 3 no no 07-2008 Cameron 61 L-6 no 3 no no 07-1968 Campbell 11 L-3 no 5 yes no 02-2005 Canton 14 L-7 no 3 no yes 07-1979 Cape Girardeau 375 LT-14 (Age 65) no 3 no yes 02-1973
Participating Political Subdivisions
†See Summary of Plan Provisions for benefit program description.*Charter Member

Statistical Section
89Missouri Local Government Employees Retirement System
Carl Junction 31 L-6 no 5 yes no 06-1971 Carthage 51 L-6 no 3 no no 07-1982 Caruthersville 36 L-3 no 5 no yes 01-1979 Cassville 31 L-7 no 5 yes no 02-2010 Centralia 36 L-7 yes 5 no yes 07-1972 Charleston 32 L-1 no 5 no no 05-1980 Chillicothe 67 L-12 no 3 no yes 05-1978 Clarksville 4 L-3 no 5 no no 10-1974 Claycomo 24 L-12 no 5 no no 04-2007 Cleveland 4 L-3 no 5 yes no 04-2007 Clever 9 L-1 yes 5 yes no 07-1998 Clinton 68 L-12 no 5 yes no 02-1972 Columbia 1,019 L-6 no 3 no yes 02-1969 Concordia 18 L-3 no 3 yes no 05-1978 Cool Valley 3 L-7 no 5 no no 07-1972 Cottleville 19 L-7 yes 5 yes no 06-2010 Crestwood 84 L-7 no 3 no yes 07-1968 Creve Coeur 64 LT-8 (Age 65) no 5 yes no 08-2017 Crocker 9 L-1 no 5 no no 09-1988 Crystal City 51 L-6 no 5 no yes 04-1970 Cuba 43 L-6 yes 3 no yes 04-1971 Dardenne Prairie 9 L-7 yes 5 no no 11-2006 Dellwood 6 L-12 no 3 no no 01-1975 De Soto 52 L-7 no 5 no no 01-1983 Dexter 66 L-6 yes 3 no no 08-1973 Dixon 7 L-7 no 5 yes no 12-2000 Doniphan 21 L-7 no 5 yes no 01-1993 Drexel 3 L-7 no 5 no no 06-1998 Edmundson 14 L-7 no 5 yes no 01-2012 El Dorado Springs 34 L-6 no 3 no yes 07-1975 Eldon 42 L-1 no 5 yes no 05-2005 Ellington 5 L-1 no 5 yes no 07-2009 Ellisville 59 L-12 no 3 no no 08-1971 Elsberry 3 L-3 yes 5 no no 01-1998 Eminence 4 L-3 no 5 no yes 09-1996 Eureka 70 L-6 yes 3 no no 11-1973 Excelsior Springs 114 L-7 no 5 no yes 12-1972 Fair Grove 9 L-1 no 5 yes no 09-2005 Farmington 134 LT-8 (Age 65) yes 3 no no 02-1969 Fayette 18 L-7 yes 5 no yes 07-1970 Fenton 30 LT-8 (Age 65) no 3 no yes 01-1971* Festus 94 L-6 no 5 no yes 04-1968 Foristell 9 L-3 no 3 no no 10-2003 Forsyth 15 L-6 no 5 yes no 07-1985 Fredericktown 48 LT-8 (Age 65) yes 5 no no 05-1968
City or Municipality Name: Employee Benefit Rule Final Average Employee Non-Contrib. Membership Members Program† of 80 Salary Period Contrib. Refund Date

Statistical Section
90Missouri Local Government Employees Retirement System
Frontenac 52 LT-8 (Age 65) no 3 no yes 08-1972Fulton 174 L-6 yes 5 yes no 08-1968Gainesville 2 L-1 no 5 yes no 12-1984Garden City 4 L-1 no 5 yes no 04-1993Gerald 6 L-1 no 3 yes no 04-2003Gideon 4 L-3 yes 5 yes no 10-1970Gladstone 166 L-6 no 5 no no 09-1968Glasgow 6 L-3 no 5 no no 10-1974Glendale 8 LT-8 (Age 62) no 5 no yes 02-1971Golden City 4 L-1 no 5 yes no 01-2012Gower 5 L-7 no 5 no no 01-2010Grain Valley 61 L-7 no 5 no no 01-1999Granby 13 L-1 no 5 yes no 02-2014Grandview 182 LT-5 (Age 65) no 3 no no 07-1971Grant City 6 L-1 no 5 yes no 05-1999Green City 5 L-1 no 5 no yes 04-1988Hale 2 L-7 no 3 no no 06-1998Hannibal 65 LT-14 (Age 65) yes 5 no yes 11-1969Hardin 4 L-1 no 3 yes no 02-1997Harrisonville 107 LT-14 (Age 65) no 3 no no 08-1972Hartville 5 L-7 no 3 yes no 07-2001Hayti 24 L-3 no 5 yes no 01-1994Henrietta 0 L-1 no 3 yes no 02-2009Herculaneum 26 L-1 no 5 yes no 11-2013Hermann 40 L-1 no 3 no no 09-1980Higginsville 69 LT-10 (Age 65) yes 3 no yes 08-1970Hillsboro 21 L-7 no 5 no no 07-1980Holden 6 L-9 no 5 no no 04-1974Hollister 44 L-6 yes 3 yes no 05-1998Holts Summit 24 L-3 no 5 no no 01-1998Hopkins 2 L-1 no 3 yes no 02-2013Houston 30 L-6 yes 3 no yes 05-1971Humansville 4 L-1 yes 5 yes no 06-2006Huntsville 10 L-12 no 5 no no 05-2001Independence 967 L-6 no 3 yes no 11-1968Indian Point 4 L-7 yes 5 yes no 11-2017Ironton 9 L-1 no 5 no no 10-2008Jackson 124 L-6 no 3 no yes 04-1968Jamesport 3 L-1 no 5 yes no 12-2016Jefferson City 414 L-6 yes 3 no yes 01-1970Jefferson City (Legacy) 0 - no - no no 05-2017Jennings 50 L-12 no 3 no no 09-1968Jennings (Legacy) 0 - no - no no 12-2017
City or Municipality Name: Employee Benefit Rule Final Average Employee Non-Contrib. Membership Members Program† of 80 Salary Period Contrib. Refund Date
*
†See Summary of Plan Provisions for benefit program description.*Charter Member
Participating Political Subdivisions (continued)

Statistical Section
91Missouri Local Government Employees Retirement System
Jonesburg 5 L-7 no 3 no no 01-1997Joplin 332 L-6 no 5 no no 01-1973Kearney 41 L-7 no 3 no no 04-1992Kennett 56 L-7 no 3 no yes 07-1968Kimberling City 12 LT-8 (Age 65) no 3 no no 03-1994King City 3 L-1 no 5 yes no 03-2018Kingdom City 2 L-1 no 5 no no 04-2011Kirksville 143 L-12 no 5 no yes 01-1977Knob Noster 15 LT-4 (Age 65) yes 5 no no 02-1999La Grange 13 L-12 no 3 no yes 02-1977La Plata 12 L-7 no 5 no yes 11-1972Lake Lotawana 10 L-1 yes 5 no no 08-2002Lake Ozark 33 L-3 no 3 no no 05-2000Lake Saint Louis 85 LT-8 (Age 65) yes 3 no yes 11-1985Lake Winnebago 9 L-1 no 3 yes no 04-1999Lamar 67 L-7 no 5 no no 09-1998Lathrop 9 L-3 no 5 no no 07-1996Lawson 14 L-1 no 5 no no 08-2000Lebanon 151 L-7 no 5 no no 11-1984Lee's Summit 643 L-6 no 5 no yes 04-1970Lexington 33 L-1 no 5 yes no 08-2013Liberty 226 L-6 no 5 yes no 07-1970Licking 12 L-12 no 3 no no 01-1985Lincoln 5 L-1 no 5 no no 02-2012Linn 7 L-1 yes 5 no no 05-2003Lockwood 6 L-9 no 3 no no 04-1968Lone Jack 15 L-3 yes 3 yes no 01-2018Louisiana 25 L-3 no 5 no no 07-1968Macon 74 LT-8 (Age 65) yes 3 no no 06-1968Malden 53 L-6 no 5 yes no 07-1976Mansfield 13 L-1 no 3 yes no 04-2003Maplewood 72 L-6 no 3 yes no 04-1970Marceline 32 L-6 no 5 yes no 04-1981Marionville 5 L-7 no 3 yes no 12-1988Marshall 175 L-12 no 5 no no 04-1971Marshfield 36 L-6 no 5 yes no 01-1990Maryland Heights 189 L-6 no 5 no no 01-2004Maryville 73 L-6 no 3 no no 01-1973Matthews 7 L-1 yes 5 no no 08-2006Memphis 26 L-6 yes 3 yes no 01-1972Mercer 2 L-3 no 3 yes no 06-1988Merriam Woods 2 L-1 no 5 yes no 11-2006Mexico 74 L-6 yes 3 no no 04-1968Milan 15 L-1 no 3 no yes 01-1987Miner 17 L-6 yes 3 no no 03-1995
City or Municipality Name: Employee Benefit Rule Final Average Employee Non-Contrib. Membership Members Program† of 80 Salary Period Contrib. Refund Date
*

Statistical Section
92Missouri Local Government Employees Retirement System
Moberly 116 LT-8 (Age 65) yes 3 no yes 08-1968Moline Acres 11 LT-5 (Age 65) no 5 no no 04-1974Monett 122 L-6 yes 3 yes no 03-1978Montgomery City 19 L-3 no 3 no yes 03-1971Moscow Mills 13 L-3 no 5 yes no 11-2018Mound City 5 L-6 no 3 yes no 04-1971Mount Vernon 33 L-7 yes 5 no yes 09-1972Mountain Grove 45 LT-8 (Age 62) no 5 no no 07-1987Mountain View 42 L-7 no 5 no yes 07-1989Neosho 101 LT-8 (Age 65) yes 3 no yes 07-1971Nevada 74 LT-8 (Age 65) yes 5 no no 11-1968New Haven 18 L-1 no 5 yes no 01-2013New London 5 L-3 no 5 yes no 01-2011New Madrid 36 L-6 no 3 no no 08-1968Nixa 135 L-6 no 5 yes no 01-1990Norborne 4 L-3 no 5 yes no 09-1969Normandy 36 L-7 no 5 no no 06-1969North Kansas City 76 L-6 yes 3 no no 11-1969Northwoods 32 L-6 no 5 no no 07-1972Oak Grove 44 L-7 no 3 no no 08-1969Oak Grove Village 1 L-1 no 5 yes no 02-2012Oakland 0 LT-8 (Age 65) no 5 no no 04-2004Oakview 4 L-1 no 5 yes no 05-2009Odessa 33 L-7 yes 3 no yes 07-1975O'Fallon 426 LT-8 (Age 65) no 5 no yes 02-1975Osceola 7 L-1 no 3 yes no 09-2001Owensville 19 L-6 yes 5 no no 05-1972Ozark 105 L-12 no 3 no yes 07-1990Pacific 42 L-6 yes 5 no yes 04-1987Pagedale 23 L-3 no 5 no no 03-1972Palmyra 34 LT-14 (Age 65) yes 3 no no 04-1968Paris 13 L-7 no 3 no no 02-1969Parkville 37 L-12 no 5 yes no 08-2009Parkway 3 L-6 no 5 yes no 01-2014Pattonsburg 3 L-1 no 5 yes no 06-1975Peculiar 27 L-6 yes 3 no yes 10-1986Perry 7 L-6 no 3 yes no 01-1971Perryville 96 L-6 no 3 no yes 03-1969Pevely 38 L-7 no 5 yes no 10-2015Piedmont 17 LT-5 (Age 65) yes 3 no yes 08-1974Pilot Knob 4 L-7 no 3 yes no 06-1992Pine Lawn 5 L-1 no 5 no no 07-1970Pineville 8 L-1 no 5 yes no 09-2018Platte City 30 L-7 no 5 yes no 05-1987
City or Municipality Name: Employee Benefit Rule Final Average Employee Non-Contrib. Membership Members Program† of 80 Salary Period Contrib. Refund Date
†See Summary of Plan Provisions for benefit program description.*Charter Member
Participating Political Subdivisions (continued)

Statistical Section
93Missouri Local Government Employees Retirement System
Platte Woods 3 L-6 no 5 no no 02-2018Plattsburg 16 L-3 no 5 no yes 02-1972Pleasant Hill 39 L-6 yes 3 no yes 05-1978Poplar Bluff 235 L-6 no 5 no yes 02-1971Portageville 31 L-3 no 5 no no 09-1996Potosi 29 L-7 no 3 no yes 04-1973Princeton 8 L-6 no 5 yes no 01-1973Purdy 6 L-1 no 5 no no 02-2017Puxico 4 L-7 no 5 yes no 07-2007Ravenwood 1 L-1 no 3 yes no 11-2000Raymore 95 L-6 no 3 no no 01-1990Raytown 96 L-12 no 5 yes no 07-2003Republic 110 L-3 no 3 no no 03-2009Richland 16 L-3 no 5 no yes 07-1988Richmond 54 L-3 no 3 no no 12-1990Richmond Heights 55 L-6 no 3 yes no 05-1968Riverside 78 L-6 no 5 no no 01-1997Riverview 13 L-3 no 5 yes no 08-1989Rock Hill 32 L-3 no 5 no no 04-1968Rogersville 18 L-1 no 3 yes no 07-2017Rolla 199 LT-14 (Age 65) yes 3 no yes 01-1969Russellville 1 L-7 no 3 no no 05-1999Salem 55 L-6 yes 3 yes no 12-1984Salisbury 16 L-6 yes 5 yes no 07-2016Savannah 25 L-12 no 5 no yes 07-1976Scott City 31 L-7 no 5 yes no 01-1993Sedalia 176 L-6 no 3 no yes 08-1972Sedalia (Legacy) 0 - no - no no 06-2019Seneca 12 L-3 no 3 no no 05-1975Seymour 25 L-9 no 3 no no 04-1996Shelbina 22 L-6 yes 3 yes no 11-1969Shelbyville 3 L-1 no 5 yes no 12-2006Sheldon 2 LT-4 (Age 65) yes 3 yes no 01-2008Shrewsbury 54 LT-8 (Age 65) no 3 no yes 04-1968Sikeston 116 LT-8 (Age 65) no 3 no yes 04-1968Slater 16 L-7 no 5 no no 02-1969Smithton 1 L-1 no 5 yes no 07-2017Smithville 55 L-7 no 3 yes no 01-2004Sparta 7 L-7 no 3 no no 07-2007Springfield 1,581 L-6 no 3 no no 06-1968St. Ann 100 L-6 yes 3 yes no 06-1968St. Charles 432 LT-8 (Age 65) yes 3 no yes 04-1968St. Clair 31 L-6 no 5 no yes 05-1980St. James 43 L-6 no 3 yes no 06-1974St. John 45 L-7 no 5 no yes 03-1970
City or Municipality Name: Employee Benefit Rule Final Average Employee Non-Contrib. Membership Members Program† of 80 Salary Period Contrib. Refund Date
**
*

Statistical Section
94Missouri Local Government Employees Retirement System
St. Joseph 647 L-6 no 3 yes no 04-1970St. Mary 2 L-1 no 5 yes no 11-2007St. Peters 412 L-6 yes 3 yes no 01-1976St. Robert 75 L-7 no 3 yes no 04-1983Stanberry 9 L-3 no 5 yes no 01-2015Ste. Genevieve 21 LT-8 (Age 65) no 5 yes no 10-1984Steelville 18 L-7 no 3 no no 03-1997Stockton 9 L-1 no 5 yes no 10-1988Strafford 16 L-7 no 3 no no 02-2009Sugar Creek 53 L-12 no 3 no yes 05-1968Sullivan 60 L-6 yes 3 no yes 03-1972Sunrise Beach 5 L-3 no 3 no no 06-2005Sunset Hills 71 L-7 no 3 no yes 10-1972Sweet Springs 8 L-3 yes 5 no yes 04-1973Thayer 24 L-1 no 5 yes no 01-1997Tipton 12 L-7 yes 3 yes no 04-1981Town And Country 49 LT-14 (Age 65) no 3 no no 02-2007Trenton 37 L-6 no 5 no yes 05-1979Troy 52 L-3 no 5 no no 08-2008Twin Oaks 3 L-7 no 3 yes no 01-2007Union 71 L-6 no 3 no yes 01-1974Unionville 17 L-6 yes 5 yes no 10-1982Valley Park 21 L-6 no 5 yes no 11-1972Van Buren 11 L-1 no 5 no no 01-2003Vandalia 24 L-7 no 5 no no 05-1988Verona 3 L-1 no 5 yes no 01-2013Vienna 5 L-1 no 5 no no 09-2002Vinita Park 40 L-6 no 3 no no 08-1971Warrensburg 120 L-7 no 5 no yes 07-1968Warrenton 68 L-1 no 5 yes no 08-2015Warsaw 20 L-7 no 5 no no 05-1999Washington 118 LT-10 (Age 65) yes 3 no no 01-1971Waverly 4 L-3 no 5 yes no 10-1986Waynesville 54 L-6 no 3 no yes 09-1985Webb City 101 L-7 no 3 no no 03-1975Webster Groves 149 L-12 no 5 yes no 07-2013Wellston 1 L-1 no 5 no no 07-1971Wentzville 241 L-7 no 5 no no 02-1973West Plains 171 L-6 yes 3 no no 02-1973Weston 12 L-3 no 3 yes no 07-1997Willard 33 L-7 no 5 yes no 04-2004Willow Springs 30 L-7 no 5 no no 06-1993Winchester 3 LT-5 (Age 62) no 5 no no 10-1982
City or Municipality Name: Employee Benefit Rule Final Average Employee Non-Contrib. Membership Members Program† of 80 Salary Period Contrib. Refund Date
†See Summary of Plan Provisions for benefit program description.*Charter Member
Participating Political Subdivisions (continued)

Statistical Section
95Missouri Local Government Employees Retirement System
County Name: Employee Benefit Rule Final Average Employee Non-Contrib. Membership Members Program† of 80 Salary Period Contrib. Refund Date
Windsor 11 L-9 no 3 yes no 08-1973Winfield 7 L-1 no 5 yes no 05-2003Winona 6 L-1 no 3 yes no 11-2013Wood Heights 2 L-3 no 3 yes no 01-1999Woodson Terrace 30 L-7 no 5 no yes 12-1969Wright City 24 L-1 no 5 yes no 02-2014
City or Municipality Name: Employee Benefit Rule Final Average Employee Non-Contrib. Membership Members Program† of 80 Salary Period Contrib. Refund Date
Adair County 72 L-6 no 5 no yes 03-1977Andrew County 65 L-6 no 3 no no 03-1976Atchison County 43 L-12 no 3 no no 01-1974Audrain County 83 L-12 no 3 no no 04-1968Buchanan County 223 L-6 no 5 no yes 06-1971Butler County 115 L-6 yes 3 no yes 04-1968Caldwell County 69 L-1 no 5 yes no 01-1984Callaway County 153 L-7 no 5 no yes 01-1977Camden County 274 L-6 yes 5 no yes 02-1969Cape Girardeau County 186 L-6 no 3 no yes 01-1985Cass County 251 L-3 no 3 no yes 01-1991Chariton County 36 L-7 no 3 yes no 01-1988Christian County 190 L-9 no 3 no yes 03-1989Clark County 34 L-1 no 5 yes no 01-1980Clay County 508 L-9 no 3 no yes 11-1975Clinton County 43 L-3 no 5 yes no 01-1986Cole County 292 L-7 no 5 no yes 04-1968Dekalb County 37 L-3 no 3 no no 12-1983Dunklin County 88 L-7 no 3 yes no 01-1969Franklin County 315 L-6 yes 3 no yes 01-1970Gasconade County 42 L-7 no 5 no yes 01-1974Greene County 858 L-7 no 3 no yes 01-1972Holt County 35 L-3 no 3 yes no 01-1974Howard County 40 L-7 no 5 no no 06-1976Howell County 105 L-6 yes 3 no yes 01-1974Iron County 46 L-7 no 5 yes no 01-1970Jasper County 281 L-6 no 3 no yes 01-1983Jefferson County 609 L-12 no 3 no yes 03-1969Lafayette County 90 L-12 no 3 yes no 01-1970Lawrence County 88 L-7 no 3 yes no 01-1973Lewis County 40 LT-8 (Age 65) no 3 no yes 11-1974Livingston County 38 L-3 no 3 no yes 12-1988Macon County 59 L-3 no 5 yes no 01-1990Marion County 88 L-6 no 3 no yes 02-1972Miller County 111 L-6 no 5 yes no 01-1976Mississippi County 48 L-6 no 5 yes no 02-1973
*

Statistical Section
96Missouri Local Government Employees Retirement System
Monroe County 46 L-7 no 3 no no 02-1980Montgomery County 73 LT-8 (Age 65) no 3 yes no 02-1973New Madrid County 69 L-6 yes 5 no yes 04-1968Nodaway County 59 L-7 no 5 yes no 07-1973Pemiscot County 93 L-7 no 3 no yes 04-1968Perry County 88 L-12 no 3 no yes 05-1968Pettis County 129 L-12 no 3 no no 10-1971Phelps County 145 L-6 yes 3 yes no 01-1969Pike County 68 L-6 yes 3 yes no 12-1971Platte County 247 L-12 no 3 no no 01-1974Ralls County 46 L-7 no 5 no yes 01-1973Randolph County 88 L-9 no 3 yes no 04-1969Ray County 75 L-7 no 3 no no 04-1969Scott County 92 L-7 no 3 no yes 05-1969Shannon County 39 L-1 no 5 yes no 02-1978St. Charles County 987 LT-8 (Age 65) no 3 no yes 08-1973St. Clair County 79 L-3 no 5 yes no 07-1979St. Francois County 183 L-6 no 3 yes no 10-1969Ste. Genevieve County 120 L-7 no 3 yes no 05-1970Stoddard County 67 L-7 no 5 no no 01-1969Taney County 275 L-6 no 5 no yes 08-1985Texas County 59 L-12 yes 3 no yes 09-1975Vernon County 75 L-7 no 3 no yes 01-1969Wright County 62 L-12 yes 3 no no 12-1981
County Name Employee Benefit Rule Final Average Employee Non-Contrib. Membership Members Program† of 80 Salary Period Contrib. Refund Date
Health Department Name: Employee Benefit Rule Final Average Employee Non-Contrib. Membership Members Program† of 80 Salary Period Contrib. Refund Date
Adair County Health Department 13 L-1 no 5 yes no 07-1981Andrew County Health Department 4 L-3 no 3 yes no 01-2011Audrain County Health Department 12 L-1 no 5 no no 01-2013Bates County Health Center 7 L-3 no 5 no no 08-1992Benton County Health Department 52 L-1 no 3 no no 01-2018Butler County Health Department 19 L-6 yes 5 no yes 08-1968Caldwell County Health Department 5 LT-8 (Age 65) yes 5 yes no 01-1984Cape Girardeau County Health Department 31 L-7 no 3 no yes 01-1985Carter County Health Center 7 L-1 no 5 no no 06-1978Chariton County Health Department 4 L-1 yes 5 yes no 05-2006Clark County Health Department 13 L-6 no 3 no yes 01-1981Clay County Health Department 51 L-9 no 3 no yes 11-1975Clinton County Health Department 6 L-3 no 5 yes no 01-1986Cooper County Health Center 6 L-1 no 5 yes no 01-2013Dallas County Health Department 7 L-1 no 5 yes no 01-1991
*
*
†See Summary of Plan Provisions for benefit program description.*Charter Member
Participating Political Subdivisions (continued)

Statistical Section
97Missouri Local Government Employees Retirement System
Health Department Name: Employee Benefit Rule Final Average Employee Non-Contrib. Membership Members Program† of 80 Salary Period Contrib. Refund Date
Daviess County Health Department 7 L-7 no 3 yes no 07-2003Dent County Health Center 7 L-3 no 3 yes no 02-1991Douglas County Health Department 11 L-7 no 3 yes no 06-2010Dunklin County Health Department 14 LT-10 (Age 65) no 3 yes no 02-1969Gasconade County Health Department 6 L-1 no 5 no yes 04-1981Grundy County Nursing Home District 60 L-1 no 5 no no 07-2005Henry County Health Department 11 L-1 yes 3 yes no 01-2009Iron County Health Department 5 L-3 yes 5 yes no 03-1973Jefferson County Health Department 68 L-7 yes 3 no no 10-1987Laclede County Health Center 13 L-7 no 5 yes no 08-1991Lafayette County Health Department 10 L-12 no 3 no no 01-1982Lewis County Health Department 11 L-12 no 3 no yes 05-1974Lincoln County Health Department 23 L-7 no 3 yes no 01-2002Linn County Health Department 7 L-7 no 3 yes no 05-1993Livingston County Health Department 8 L-7 yes 3 yes no 12-1988Macon County Health Department 10 L-7 yes 5 no no 08-1974Madison County Health Department 13 L-1 no 5 yes no 03-1998Madison Medical Center 199 L-1 no 5 no no 10-1972Marion County Health Department 6 L-9 no 3 yes no 02-1972Miller County Health Department 11 L-3 yes 5 no no 01-1976Mississippi County Health Department 13 L-7 no 5 no yes 07-1977Moniteau County Health Center 6 L-3 no 5 no no 11-1990Monroe County Health Department 5 L-7 no 5 no no 04-1981Montgomery County Health Department 10 L-3 no 3 yes no 02-1973Nevada City Hospital 248 L-1 no 5 no yes 09-1970Nevada City Nursing Home 78 L-3 no 5 no yes 10-1978New Madrid County Health Department 11 L-6 yes 5 no yes 06-1968Nodaway County Health 4 L-1 no 3 yes no 03-2018Pemiscot County Health Department 8 L-7 yes 3 no yes 10-1968Pemiscot County Memorial Hospital 190 L-7 yes 3 yes no 02-1981Pettis County Health Center 18 L-9 no 3 yes no 01-1987Pike County Health Department 27 L-11 yes 3 yes no 12-1971Platte County Health Department 25 L-7 no 3 no no 01-1974Polk County Health Center 16 L-1 no 3 yes no 02-1991Pulaski County Health Department 12 L-3 yes 3 yes no 01-1979Putnam County Health Department 4 L-7 yes 3 no no 03-1995Ralls County Health Department 7 L-12 no 3 no yes 04-1973Randolph County Health Department 14 L-7 no 5 yes no 04-1981Ray County Public Health Department 6 L-6 yes 3 yes no 01-1988Saline County Health Department 12 L-1 no 3 yes no 03-2005Scotland County Health Department 0 L-1 no 3 no no 06-2020Scott County Health Department 14 L-7 yes 3 no yes 10-1970Shannon County Health Center 13 L-1 no 5 yes no 07-1982St. Clair County Health Department 6 L-3 no 5 no no 01-1981

Statistical Section
98Missouri Local Government Employees Retirement System
Special District Name: Employee Benefit Rule Final Average Employee Non-Contrib. Membership Members Program† of 80 Salary Period Contrib. Refund Date
Abilities First Greene County Senate Bill 40 115 L-6 no 3 no no 01-2001Adair County Senate Bill 40 DD Board 18 L-7 no 5 no no 10-2010Andrew County Senate Bill 40 (Sunshine Factory) 2 L-1 no 3 no no 09-2017Audrain Developmental Disability Services 62 L-12 no 5 no no 04-1996Boone County Family Resources 114 L-12 no 3 yes no 07-2004Boonslick Regional Planning Commission 12 L-3 yes 5 yes no 07-2006Bootheel Regional Planning Commission 4 LT-4 (Age 65) yes 5 yes no 01-2005Callaway County Special Services 6 L-6 yes 3 no no 07-1996Camden County Senate Bill 40 18 L-1 no 3 no no 01-2008Carthage Utilities 72 L-6 no 3 no no 07-1982Chariton County Sheltered Workshop 1 L-1 no 5 yes no 02-2000Chillicothe Township 3 L-7 no 3 yes no 08-1995Chillicothe Utilities 46 L-12 no 3 no yes 05-1978Christian Co. Bd. For The Developmental Disabled 19 L-6 no 3 no no 02-2013Clay County Childrens Service Fund 1 L-7 no 3 no no 02-2020Daviess/Dekalb County Regional Jail 37 L-7 no 3 yes no 11-2007DD Resource Board of Jasper County 43 L-7 no 3 no no 01-2001Duckett Creek Sanitary District 45 L-7 no 3 yes no 07-2019Gasconade County Senate Bill 40 2 L-1 no 5 no no 07-2001Green Hills Regional Planning Commission 4 L-7 no 3 yes no 02-2011Hannibal Public Works 68 LT-14 (Age 65) yes 5 no yes 11-1969Harry S. Truman Coordinating Council 1 L-12 no 3 yes no 07-2005Howell County Sheltered Workshop 9 L-6 no 3 no no 08-2013Independence Township 3 L-1 no 3 no no 07-2006Jackson County Community Childrens Service 4 L-6 no 3 yes no 05-2020Jefferson County Public Sewer District 4 L-3 no 5 yes no 02-2015Kaysinger Basin Regional Planning Commission 5 L-1 yes 5 no no 01-2012Kennett Utilities 65 L-7 yes 3 no yes 07-1968Lawrence Co. Board For Developmental Disabled 7 L-7 no 3 no no 01-2017
St. Francois County Health Department 22 L-7 yes 3 yes no 01-1983Ste. Genevieve County Health Department 9 L-7 no 3 yes no 09-1982Stoddard County Public Health Center 13 L-7 no 5 no no 07-1989 Stone County Health Department 13 L-1 no 5 yes no 06-2016Sullivan County Memorial Hospital 0 L-1 no 5 yes no 01-2013Sullivan County Health Department 5 LT-8 (Age 65) no 3 no no 04-1995Texas County Health Department 10 L-12 no 5 no yes 07-1987Vernon County Health Department 8 L-6 yes 3 no yes 05-1987Washington County Health Department 12 L-3 yes 3 no no 01-1991Wayne County Health Center 5 L-12 yes 3 no no 05-1996Webster County Health Unit 13 L-1 no 5 yes no 07-1999
Health Department Name: Employee Benefit Rule Final Average Employee Non-Contrib. Membership Members Program† of 80 Salary Period Contrib. Refund Date
†See Summary of Plan Provisions for benefit program description.*Charter Member
Participating Political Subdivisions (continued)

Statistical Section
99Missouri Local Government Employees Retirement System
Liberty Township 12 L-6 yes 3 no no 06-1995Madison Co. Council For Developmental Disabled 6 L-3 no 5 no no 04-1998Mark Twain Regional Council of Governments 4 LT-4 (Age 65) no 5 yes no 04-2017Mid-Missouri Regional Planning Commission 4 L-7 no 5 yes no 09-2007Missouri Joint Municipal Electric Utility Comm. 34 L-6 no 3 no no 01-1990Mokan Regional Council 8 L-7 no 5 yes no 09-2017Moniteau County Senate Bill 40 Board 17 L-1 no 5 no no 02-2009Montgomery County Senate Bill 40 16 L-7 no 5 no no 08-2001Northeast Missouri Regional Planning 6 L-1 no 5 yes no 10-2004Ozark Transportation Organization 4 L-6 no 5 no no 01-2019Pemiscot County Port Authority 2 L-1 no 5 yes no 08-2017Pike County Senate Bill 40 46 LT-14 (Age 65) yes 3 no no 10-1998Pike Creek Common Sewer District 4 L-1 no 3 no no 08-2009Platte County Regional Sewer District 6 L-3 no 5 yes no 05-2012Progressive Community Services 35 L-12 no 3 no no 04-2000Pulaski County Sewer District # 1 15 L-12 no 5 yes no 03-2016Randolph County DD Services 17 L-7 no 5 no no 01-2018Rock Creek Public Sewer 12 L-6 yes 3 no no 03-2000Rolla Municipal Utilities 53 L-6 no 3 no yes 01-1969Salisbury Township 2 L-1 no 3 yes no 04-1989Sedalia Water Department 15 L-6 no 3 no yes 08-1972Sikeston Utilities 136 L-6 no 3 no yes 04-1968South Central Ozark Council Of Governments 6 L-6 no 3 yes no 11-2005Southeast Missouri Regional Planning 6 L-7 no 5 no no 01-2005Springfield Utilities 906 L-6 no 3 no yes 06-1968St. Charles County Development Handicapped 57 L-7 no 3 no no 03-1996St. Francois County Joint Commission Center 31 L-6 yes 3 yes no 06-2007St. Francois County Board For DD 38 L-3 no 5 yes no 07-2005St. Louis MR DD Resources 31 L-3 no 5 no no 05-1996Taney County Regional Sewer District 14 L-6 yes 3 no no 02-2012Trenton Municipal Utilities 28 L-6 no 5 no yes 05-1979Webster County Senate Bill 40 5 L-6 no 3 no no 04-2017
Special District Name: Employee Benefit Rule Final Average Employee Non-Contrib. Membership Members Program† of 80 Salary Period Contrib. Refund Date
Water District Name: Employee Benefit Rule Final Average Employee Non-Contrib. Membership Members Program† of 80 Salary Period Contrib. Refund Date
Adair County PWSD No. 1 7 L-3 no 3 no yes 01-1992Audrain County PWSD No. 2 3 L-7 yes 3 no no 01-2008Boone County Public Water District No. 4 6 L-7 no 3 no no 08-1984Boone County PWSD No. 10 5 L-12 no 5 yes no 01-1998Butler County PWSD No. 1 10 L-6 no 3 yes no 07-1995Butler County PWSD No. 3 2 L-7 yes 3 yes no 03-1995Callaway 2 Water District 14 L-12 yes 3 no yes 02-1985Callaway County PWSD No. 1 8 L-11 no 3 no no 01-1994Camden County PWSD No. 4 9 L-1 no 3 no no 01-2007Carroll County PWSD No. 1 0 L-1 no 3 yes no 06-2008

Statistical Section
100Missouri Local Government Employees Retirement System
Clarence Cannon Wholesale Water Commission 4 L-7 no 3 no no 10-2004Clark County PWSD No. 1 6 L-3 no 3 no no 07-2000Clay County Water District No. 2 5 L-3 no 3 yes no 12-1984Cole County Water District No. 2 6 L-6 no 5 no no 02-1974Cole County PWSD No. 4 4 L-7 no 5 no no 02-2001Daviess Co. PWSD No. 1 3 L-3 no 5 no no 06-2000Greene County PWSD No. 5 1 L-6 no 3 yes no 08-1991Harrison Co. PWSD No. 2 4 LT-10 (Age 65) no 3 no no 08-1998Jackson County Public Water District No. 1 17 L-6 no 3 no yes 03-1969Jasper County Public Water No. 1 3 L-3 no 5 yes no 01-2002Jefferson Co. PWSD No. 3 12 L-7 no 3 yes no 01-2020Jefferson Co. PWSD No. 6 6 L-3 no 3 yes no 08-1997Jefferson Co. PWSDNo. 12 4 L-1 no 5 no no 06-2000Jefferson County Water District No. 1 11 L-6 no 5 yes no 04-1972Jefferson County Water District No. 2 15 L-6 no 5 yes no 01-1983Jefferson County Water District No. 5 6 L-7 no 3 no no 01-1987Jefferson County Water District No. 7 6 L-12 no 3 no yes 06-1975Jefferson County Water District No. 10 3 L-3 no 5 yes no 02-1989Laclede Co. PWSD No. 3 6 L-1 yes 5 yes no 03-2016Lewis County PWSD No. 1 2 L-9 no 5 yes no 09-1997Linn-Livingston PWSD No. 3 2 L-3 no 3 yes no 08-1999Livingston Co. PWSD No. 2 3 L-3 no 5 no no 09-2007Livingston Co. PWSD No. 3 3 L-7 no 3 no no 05-1991Macon County PWSD No. 1 8 LT-8 (Age 65) yes 5 no no 11-1990Madison Co. PWSD No. 1 2 L-7 no 3 no no 07-2002Monroe Co. PWSD No. 2 5 L-3 no 5 no no 02-2008North Central MO Regional Water Commission 4 L-1 no 3 no no 06-2007Platte County PWSD No. 4 6 L-7 no 5 no no 07-2003Putnam Co. PWSD No. 1 5 L-3 no 3 yes no 02-2001Southwest Rural Water Supply District No. 1 2 L-6 no 5 yes no 03-2019Stoddard Co. PWSD No. 1 2 L-1 no 5 yes no 07-2009Wayne & Butler Co. PWSD No. 4 3 L-7 yes 5 yes no 05-2009
Water District Name: Employee Benefit Rule Final Average Employee Non-Contrib. Membership Members Program† of 80 Salary Period Contrib. Refund Date
Road District Name: Employee Benefit Rule Final Average Employee Non-Contrib. Membership Members Program† of 80 Salary Period Contrib. Refund Date
Audrain County Special Road District No. 13 2 L-7 no 5 yes no 01-2013Cameron Special Road District 2 L-12 yes 5 no no 11-2000Cape Special Road District 10 L-6 no 5 no yes 09-1981Carl Junction Special Road District 1 L-1 no 5 yes no 04-2001Carthage Special Road District 8 L-3 no 3 yes no 05-2000Eldorado Springs Special Road District 2 L-1 no 5 no no 04-1982Farley Special Road District 2 L-3 yes 3 no no 07-1999Festus Special Road District 4 L-6 no 3 no yes 02-1969
†See Summary of Plan Provisions for benefit program description.*Charter Member
Participating Political Subdivisions (continued)

Statistical Section
101Missouri Local Government Employees Retirement System
Fire District Name: Employee Benefit Rule Final Average Employee Non-Contrib. Membership Members Program† of 80 Salary Period Contrib. Refund Date
Antonia Fire Protection District (Legacy) 0 no no no 01-2019Antonia Fire Protection District 21 L-6 no 3 no no 07-2012Battlefield Fire Protection District 38 L-7 no 5 yes no 01-2013Boles Fire Protection District 27 L-1 no 3 yes no 05-2018Boone County Fire Protection District 23 L-6 no 5 no no 02-2012Butler County Fire Protection District 7 LT-8 (Age 65) no 3 yes no 11-1994Central Crossing Fire Protection District 8 L-6 no 5 yes no 01-2014Central Jackson County Fire District No. 5 132 L-6 no 3 no yes 09-1973Desoto Rural Fire Protection District 15 L-12 no 3 no no 04-2014Ebenezer Fire Protection District 13 L-6 no 5 yes no 01-2013Fair Grove Fire Protection District 8 L-3 no 3 yes no 06-2016Fort Osage Fire Protection District 29 L-6 no 3 no yes 04-1983Goldman Fire Protection District 7 L-3 no 5 no no 01-2012Gravois Fire Protection District 17 L-3 yes 5 yes no 11-2017Hematite Fire Protection District 4 L-1 no 3 no no 04-2017Hillsboro Fire Protection District 9 L-7 yes 5 no no 02-2011Holt Community Fire Protection District 7 L-7 yes 5 yes no 01-2019Jefferson R-7 Fire Protection District 8 L-6 no 3 yes no 07-2019Johnson County Fire Protection District 5 L-7 yes 5 no no 05-2006Johnson Co Fire Protection District No. 2 1 LT-8 (Age 65) yes 3 no no 01-2015Kearney Fire & Rescue Protection District 28 L-6 yes 3 no no 01-1997Lake Ozark Fire Protection District 45 L-6 no 5 no no 10-2016
Higginsville Special Road District 1 L-7 no 3 no no 05-1970Horseshoe Bend Special Road District No. 1 10 L-1 no 5 yes no 05-2008Hudson Township Special Road District 2 LT-10 (Age 65) yes 5 no no 04-1990La Plata Township Special Road District 1 L-1 no 5 yes no 10-1991Lexington Special Road District 2 L-1 no 5 yes no 06-2000Marshall Special Road District 3 L-7 no 3 yes no 09-1998Moberly Special Road District 3 L-3 no 5 yes no 01-2001Monett Special Road District 2 L-7 no 3 yes no 05-2014Neosho Special Road District 6 LT-10 (Age 65) no 3 no no 04-1997Odessa Special Road District 4 L-7 no 3 no no 09-1999Osceola Special Road District 1 L-1 no 5 yes no 03-2002Parkville Special Road District 8 L-7 no 3 no no 06-2019Platte City Special Road District 4 L-6 no 5 no no 01-1998Plattsburg Special Road District 1 L-3 no 3 yes no 02-1991Richmond Special Road District 1 L-9 no 5 yes no 03-2001Slater Special Road District 1 L-7 yes 3 no no 11-2006Ste. Genevieve Special Road District A 3 L-3 no 3 yes no 07-1990Union Special Road District 1 L-7 no 5 yes no 09-1978Washington Special Road District 0 L-3 yes 3 no no 05-1974Weston Special Road District 2 L-3 no 5 yes no 07-1997
Road District Name: Employee Benefit Rule Final Average Employee Non-Contrib. Membership Members Program† of 80 Salary Period Contrib. Refund Date

Statistical Section
102Missouri Local Government Employees Retirement System
Adair County Ambulance District 30 L-6 no 5 yes no 02-2009Audrain Ambulance District 18 L-6 yes 5 no no 03-2010Audrain County Emergency Services 11 L-7 yes 5 no no 01-2011Barry County E-911 Emergency Services 18 L-12 yes 5 yes no 01-2013Barry-Lawrence County Ambulance District 12 L-6 yes 5 yes no 01-2014Barton County Ambulance District 14 L-3 yes 5 no no 10-1998Big River Ambulance District 14 L-7 no 5 no no 01-2011
Lawson Fire & Rescue Protection District 12 L-3 no 5 yes no 05-2008Little Dixie Fire Protection District 2 L-1 yes 3 no no 01-2003Logan-Rogersville Fire Protection District 26 L-1 no 3 yes no 06-2016Lotawana Fire Protection District 4 L-3 yes 3 no no 01-2009Mid-County Fire Protection District 19 L-6 no 5 yes no 05-2010New Melle Fire Protection District 13 L-6 no 3 no no 05-2010Nixa Fire Protection District 37 L-12 no 3 no no 01-2005Odessa Fire & Rescue Protection District 8 L-6 no 5 no no 01-2010Osage Beach Fire Protection District 31 L-6 no 5 no no 07-2006Ozark Fire Protection District 32 L-12 no 5 no no 02-2009Pleasant Hill Fire Protection District 14 L-6 no 3 no no 11-2008Prairie Township Fire Protection District 14 L-3 no 3 no no 01-2009Raytown Fire Protection District 50 L-6 no 5 yes no 09-1992Redings Mill Fire Protection District 19 L-3 no 5 yes no 01-2007Rocky Mount Fire Protection District 2 L-7 no 5 yes no 08-2007Savannah Fire Protection District 1 L-1 yes 5 yes no 06-2006Smithville Fire Protection District 14 L-7 no 5 no no 04-2004Sni Valley Fire Protection District 30 L-11 no 3 no no 07-1986South Metro Fire Protection District 42 L-11 no 3 no no 11-1981Southern Platte Fire Protection District 41 L-6 no 5 yes no 08-2010Southern Stone County Fire Protection District 11 L-7 no 5 yes no 01-2013St. James Fire Protection District 1 L-12 no 3 yes no 05-2007Strafford Fire Protection District 16 L-1 no 5 yes no 10-2009Sullivan Fire Protection District 10 L-1 no 5 yes no 01-2020Sunrise Beach Fire Protection District 17 L-1 no 5 yes no 01-2017Union Fire Protection District 21 L-6 no 3 no no 11-2006Warrenton Fire Protection District 9 L-1 no 5 yes no 12-2017Waynesville Rural Fire Protection District 13 L-7 no 3 no no 07-2008West Overland EMS & Fire Protection District 19 L-6 no 5 yes no 04-2016West Peculiar Fire Protection District 11 L-6 no 5 no no 09-2006Western Taney County Fire Protection District 10 L-6 no 5 yes no 07-1993Willard Fire Protection District 17 L-7 no 5 yes no 09-2013Wright City Fire Protection District 12 L-1 no 3 yes no 01-2020
Emergency Services District Name: Employee Benefit Rule Final Average Employee Non-Contrib. Membership Members Program† of 80 Salary Period Contrib. Refund Date
Fire District Name: Employee Benefit Rule Final Average Employee Non-Contrib. Membership Members Program† of 80 Salary Period Contrib. Refund Date
†See Summary of Plan Provisions for benefit program description.*Charter Member
Participating Political Subdivisions (continued)
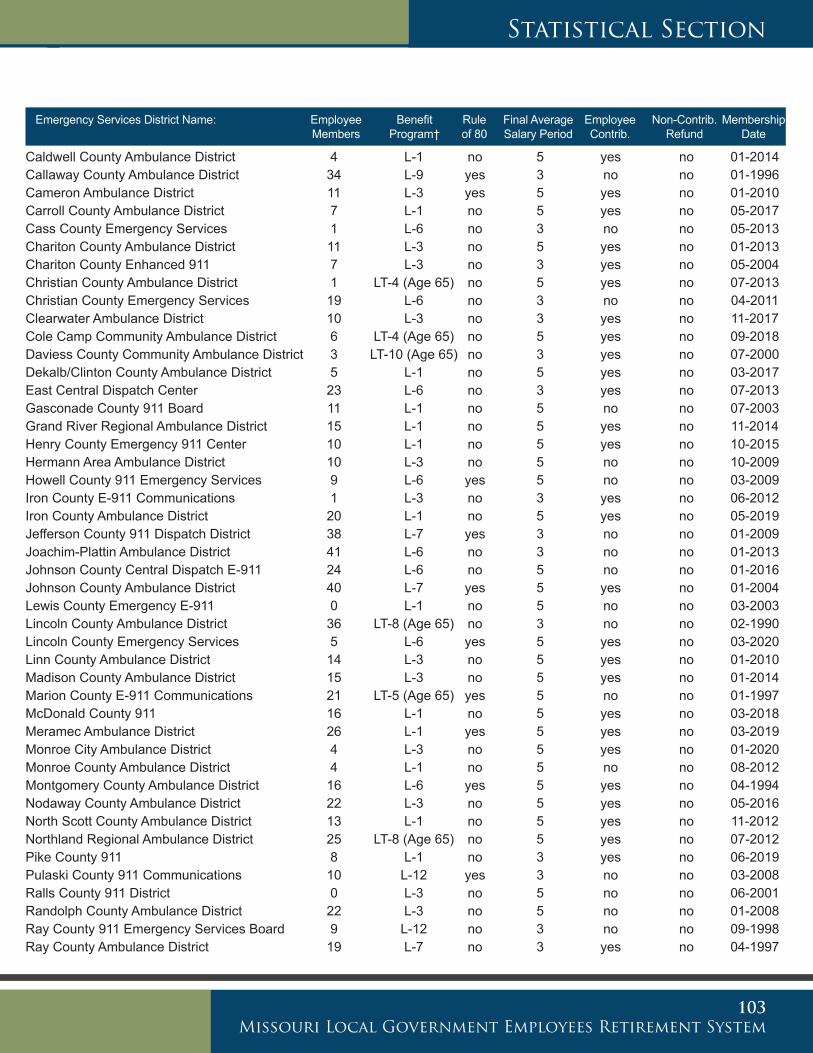
Statistical Section
103Missouri Local Government Employees Retirement System
Caldwell County Ambulance District 4 L-1 no 5 yes no 01-2014Callaway County Ambulance District 34 L-9 yes 3 no no 01-1996Cameron Ambulance District 11 L-3 yes 5 yes no 01-2010Carroll County Ambulance District 7 L-1 no 5 yes no 05-2017Cass County Emergency Services 1 L-6 no 3 no no 05-2013Chariton County Ambulance District 11 L-3 no 5 yes no 01-2013Chariton County Enhanced 911 7 L-3 no 3 yes no 05-2004Christian County Ambulance District 1 LT-4 (Age 65) no 5 yes no 07-2013Christian County Emergency Services 19 L-6 no 3 no no 04-2011Clearwater Ambulance District 10 L-3 no 3 yes no 11-2017Cole Camp Community Ambulance District 6 LT-4 (Age 65) no 5 yes no 09-2018Daviess County Community Ambulance District 3 LT-10 (Age 65) no 3 yes no 07-2000Dekalb/Clinton County Ambulance District 5 L-1 no 5 yes no 03-2017East Central Dispatch Center 23 L-6 no 3 yes no 07-2013Gasconade County 911 Board 11 L-1 no 5 no no 07-2003Grand River Regional Ambulance District 15 L-1 no 5 yes no 11-2014Henry County Emergency 911 Center 10 L-1 no 5 yes no 10-2015Hermann Area Ambulance District 10 L-3 no 5 no no 10-2009Howell County 911 Emergency Services 9 L-6 yes 5 no no 03-2009Iron County E-911 Communications 1 L-3 no 3 yes no 06-2012Iron County Ambulance District 20 L-1 no 5 yes no 05-2019Jefferson County 911 Dispatch District 38 L-7 yes 3 no no 01-2009Joachim-Plattin Ambulance District 41 L-6 no 3 no no 01-2013Johnson County Central Dispatch E-911 24 L-6 no 5 no no 01-2016Johnson County Ambulance District 40 L-7 yes 5 yes no 01-2004Lewis County Emergency E-911 0 L-1 no 5 no no 03-2003Lincoln County Ambulance District 36 LT-8 (Age 65) no 3 no no 02-1990Lincoln County Emergency Services 5 L-6 yes 5 yes no 03-2020Linn County Ambulance District 14 L-3 no 5 yes no 01-2010Madison County Ambulance District 15 L-3 no 5 yes no 01-2014Marion County E-911 Communications 21 LT-5 (Age 65) yes 5 no no 01-1997McDonald County 911 16 L-1 no 5 yes no 03-2018Meramec Ambulance District 26 L-1 yes 5 yes no 03-2019Monroe City Ambulance District 4 L-3 no 5 yes no 01-2020Monroe County Ambulance District 4 L-1 no 5 no no 08-2012Montgomery County Ambulance District 16 L-6 yes 5 yes no 04-1994Nodaway County Ambulance District 22 L-3 no 5 yes no 05-2016North Scott County Ambulance District 13 L-1 no 5 yes no 11-2012Northland Regional Ambulance District 25 LT-8 (Age 65) no 5 yes no 07-2012Pike County 911 8 L-1 no 3 yes no 06-2019Pulaski County 911 Communications 10 L-12 yes 3 no no 03-2008Ralls County 911 District 0 L-3 no 5 no no 06-2001Randolph County Ambulance District 22 L-3 no 5 no no 01-2008Ray County 911 Emergency Services Board 9 L-12 no 3 no no 09-1998Ray County Ambulance District 19 L-7 no 3 yes no 04-1997
Emergency Services District Name: Employee Benefit Rule Final Average Employee Non-Contrib. Membership Members Program† of 80 Salary Period Contrib. Refund Date
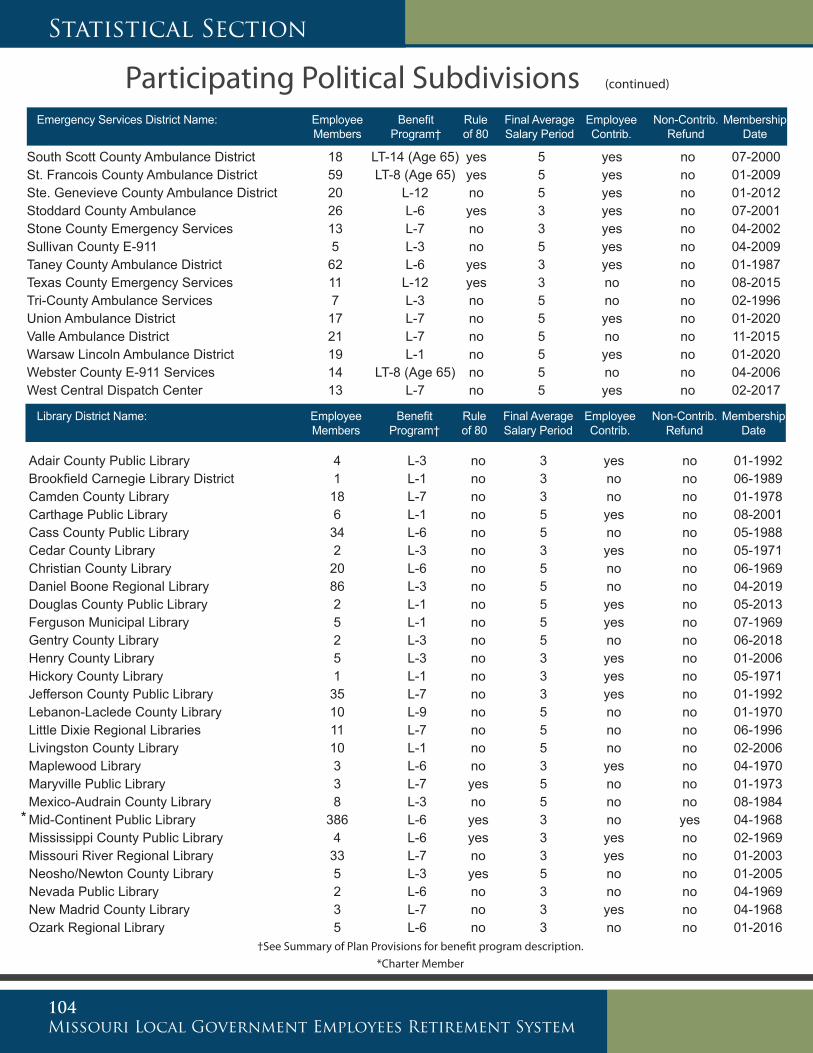
Statistical Section
104Missouri Local Government Employees Retirement System
Adair County Public Library 4 L-3 no 3 yes no 01-1992Brookfield Carnegie Library District 1 L-1 no 3 no no 06-1989Camden County Library 18 L-7 no 3 no no 01-1978Carthage Public Library 6 L-1 no 5 yes no 08-2001Cass County Public Library 34 L-6 no 5 no no 05-1988Cedar County Library 2 L-3 no 3 yes no 05-1971Christian County Library 20 L-6 no 5 no no 06-1969Daniel Boone Regional Library 86 L-3 no 5 no no 04-2019Douglas County Public Library 2 L-1 no 5 yes no 05-2013Ferguson Municipal Library 5 L-1 no 5 yes no 07-1969Gentry County Library 2 L-3 no 5 no no 06-2018Henry County Library 5 L-3 no 3 yes no 01-2006Hickory County Library 1 L-1 no 3 yes no 05-1971Jefferson County Public Library 35 L-7 no 3 yes no 01-1992Lebanon-Laclede County Library 10 L-9 no 5 no no 01-1970Little Dixie Regional Libraries 11 L-7 no 5 no no 06-1996Livingston County Library 10 L-1 no 5 no no 02-2006Maplewood Library 3 L-6 no 3 yes no 04-1970Maryville Public Library 3 L-7 yes 5 no no 01-1973Mexico-Audrain County Library 8 L-3 no 5 no no 08-1984Mid-Continent Public Library 386 L-6 yes 3 no yes 04-1968Mississippi County Public Library 4 L-6 yes 3 yes no 02-1969Missouri River Regional Library 33 L-7 no 3 yes no 01-2003Neosho/Newton County Library 5 L-3 yes 5 no no 01-2005Nevada Public Library 2 L-6 no 3 no no 04-1969New Madrid County Library 3 L-7 no 3 yes no 04-1968Ozark Regional Library 5 L-6 no 3 no no 01-2016
Library District Name: Employee Benefit Rule Final Average Employee Non-Contrib. Membership Members Program† of 80 Salary Period Contrib. Refund Date
*
South Scott County Ambulance District 18 LT-14 (Age 65) yes 5 yes no 07-2000St. Francois County Ambulance District 59 LT-8 (Age 65) yes 5 yes no 01-2009Ste. Genevieve County Ambulance District 20 L-12 no 5 yes no 01-2012Stoddard County Ambulance 26 L-6 yes 3 yes no 07-2001Stone County Emergency Services 13 L-7 no 3 yes no 04-2002Sullivan County E-911 5 L-3 no 5 yes no 04-2009Taney County Ambulance District 62 L-6 yes 3 yes no 01-1987Texas County Emergency Services 11 L-12 yes 3 no no 08-2015Tri-County Ambulance Services 7 L-3 no 5 no no 02-1996Union Ambulance District 17 L-7 no 5 yes no 01-2020Valle Ambulance District 21 L-7 no 5 no no 11-2015Warsaw Lincoln Ambulance District 19 L-1 no 5 yes no 01-2020Webster County E-911 Services 14 LT-8 (Age 65) no 5 no no 04-2006West Central Dispatch Center 13 L-7 no 5 yes no 02-2017
Emergency Services District Name: Employee Benefit Rule Final Average Employee Non-Contrib. Membership Members Program† of 80 Salary Period Contrib. Refund Date
†See Summary of Plan Provisions for benefit program description.*Charter Member
Participating Political Subdivisions (continued)

Statistical Section
105Missouri Local Government Employees Retirement System
Soil and Water Conservation District Name: Employee Benefit Rule Final Average Employee Non-Contrib. Membership Members Program† of 80 Salary Period Contrib. Refund Date
Andrews County Soil & Water Conservation District 3 L-7 no 3 no no 07-2019Atchison County Soil & Water Conservation District 3 L-7 no 3 no no 04-2020Audrain County Soil & Water Conservation District 3 L-7 no 3 no no 11-2018Bates County Soil & Water Conservation District 2 L-7 no 3 no no 07-2019Benton County Soil & Water Conservation District 3 L-7 no 3 no no 01-2019Callaway Co. Soil & Water Conservation District 3 L-7 no 3 no no 01-2019Camden County Soil & Water Conservation District 1 L-7 no 3 no no 01-2020Carroll County Soil & Water Conservation District 3 L-7 no 3 no no 01-2020Carter County Soil & Water Conservation District 2 L-7 no 3 no no 07-2019Cass County Soil & Water Conservation District 2 L-7 no 3 no no 07-2019Cedar County Soil & Water Conservation District 2 L-7 no 3 no no 04-2019Chariton County Soil & Water Conservation District 2 L-7 no 3 no no 01-2020Clark County Soil & Water Conservation District 2 L-7 no 3 no no 01-2020Cole County Soil & Water Conservation District 3 L-7 no 3 no no 10-2018Crawford County Soil & Water Conservation District 2 L-7 no 3 no no 07-2019Dade County Soil & Water Conservation District 2 L-7 no 3 no no 01-2019Dekalb County Soil & Water Conservation District 2 L-7 no 3 no no 04-2019Franklin County Soil & Water Conservation District 3 L-7 no 3 no no 01-2019Gasconade Co. Soil & Water Conservation District 2 L-7 no 3 no no 04-2019Gentry County Soil & Water Conservation District 2 L-7 no 3 no no 04-2020
Library District Name: Employee Benefit Rule Final Average Employee Non-Contrib. Membership Members Program† of 80 Salary Period Contrib. Refund Date
Polk County Library 10 L-1 no 3 no no 05-1971Poplar Bluff Public Library 8 L-7 no 5 yes no 01-2013Pulaski County Library 9 L-3 no 5 no no 01-1970Ray County Library 2 LT-10 (Age 65) no 5 no no 07-1970Riverside Regional Library 10 L-12 no 3 no no 08-1968Rock Hill Public Library 2 L-3 no 3 yes no 01-1989Rolla Free Public Library 3 L-6 no 3 yes no 05-1989Rolling Hills Consolidated Library 19 L-1 no 5 no no 07-2003Salem Public Library 2 L-7 no 3 yes no 07-1993Scenic Regional Library 30 L-6 no 5 yes no 01-1971Sedalia Public Library 6 L-6 no 3 no no 07-1987Springfield-Greene Co Library 102 L-7 no 3 no yes 07-1969St Charles City-County Library 106 L-7 no 3 no yes 08-1973St Joseph Public Library 28 L-1 no 5 no no 09-2013Stone County Library 6 L-1 no 5 yes no 02-1970Texas County Library 1 L-6 no 3 yes no 08-1982Trails Regional Library 34 L-7 no 3 no no 10-1970Washington County Library 5 L-1 no 5 no no 01-2017Webster County Library District 6 L-3 yes 3 no no 01-2007Webster Groves Municipal Library 11 L-7 no 5 yes no 10-2013Wright County Library 2 L-1 no 5 no no 05-1982

Statistical Section
106Missouri Local Government Employees Retirement System
Soil and Water Conservation District Name: Employee Benefit Rule Final Average Employee Non-Contrib. Membership Members Program† of 80 Salary Period Contrib. Refund Date
Henry County Soil & Water Conservation District 2 L-7 no 3 no no 10-2018Hickory County Soil & Water Conservation District 2 L-7 no 3 no no 01-2020Holt County Soil & Water Conservation District 2 L-7 no 3 no no 01-2019Howell County Soil & Water Conservation District 1 L-7 no 3 no no 04-2019Iron County Soil & Water Conservation District 3 L-7 no 3 no no 08-2019Jefferson Co. Soil & Water Conservation District 1 L-7 no 3 no no 01-2019Johnson County Soil & Water Conservation District 3 L-7 no 3 no no 10-2019Laclede County Soil & Water Conservation District 2 L-7 no 3 no no 08-2019Lafayette County Soil & Water Conservation District 2 L-7 no 3 no no 07-2019Lewis County Soil & Water Conservation District 2 L-7 no 3 no no 07-2019Lincoln County Soil & Water Conservation District 3 L-7 no 3 no no 01-2019Livingston County Soil & Water Conservation Dist. 1 L-7 no 3 no no 10-2019Maries County Soil & Water Conservation District 2 L-7 no 3 no no 07-2019McDonald County Soil & Water Conservation Dist. 2 L-7 no 3 no no 07-2019Miller County Soil & Water Conservation District 2 L-7 no 3 no no 04-2019Monroe County Soil & Water Conservation District 4 L-7 no 3 no no 04-2019Montgomery County Soil & Water Conservation Dist 3 L-7 no 3 no no 10-2019Morgan County Soil & Water Conservation District 3 L-7 no 3 no no 04-2019Newton County Soil & Water Conservation District 1 L-7 no 3 no no 07-2019Nodaway County Soil & Water Conservation District 4 L-7 no 3 no no 01-2020Osage County Soil & Water Conservation District 3 L-7 no 3 no no 04-2019Pettis County Soil & Water Conservation District 3 L-7 no 3 no no 01-2019Phelps County Soil & Water Conservation District 2 L-7 no 3 no no 04-2019Pike County Soil & Water Conservation District 2 L-7 no 3 no no 10-2019Randolph Co. Soil & Water Conservation District 3 L-7 no 3 no no 01-2019Ray County Soil & Water Conservation District 3 L-7 no 3 no no 01-2019Saline County Soil & Water Conservation District 3 L-7 no 3 no no 01-2020Schuyler County Soil & Water Conservation District 2 L-7 no 3 no no 07-2019Scotland Co. Soil & Water Conservation District 3 L-7 no 3 no no 01-2019Shelby County Soil & Water Conservation District 2 L-7 no 3 no no 01-2019St. Charles County Soil & Water Conservation Dist. 2 L-7 no 3 no no 07-2019St Clair County Soil & Water Conservation District 3 L-7 no 3 no no 01-2019Ste Genevieve Co. Soil & Water Conservation Dist. 2 L-7 no 3 no no 01-2019Stoddard County Soil & Water Conservation District 3 L-7 no 3 no no 07-2019Stone County Soil & Water Conservation District 2 L-7 no 3 no no 01-2019Sullivan County Soil & Water Conservation District 2 L-7 no 3 no no 07-2019Texas County Soil & Water Conservation District 3 L-7 no 3 no no 04-2019Vernon County Soil & Water Conservation District 4 L-7 no 3 no no 01-2020Warren County Soil & Water Conservation District 2 L-7 no 3 no no 10-2019Washington County Soil & Water Conservation Dist. 1 L-7 no 3 no no 07-2019Wright County Soil & Water Conservation District 3 L-7 no 3 no no 07-2019
†See Summary of Plan Provisions for benefit program description.*Charter Member
Participating Political Subdivisions (continued)


Missouri Local Government Employees Retirement System701 W. Main St. www.molagers.orgJefferson City, MO 65101 (800)-447-4334