Embed Size (px)
Citation preview

Mississippi River Pools 1 through 8:
Developing River, Pool, and Lake Pepin Eutrophication Criteria
(Update of July 2010 Report)
September 2012

Mississippi River Pools 1 through 8: Developing River, Pool and Lake Pepin Eutrophication Criteria
Prepared by: Steve Heiskary and Dennis Wasley, Environmental Analysis and Outcomes Division, MPCA
Draft date: September 2012 update to July 2010 draft document
Data for this assessment was provided by:
· Rob Burdis, Minnesota Department of Natural Resources, Long Term Resource Monitoring Program
· John Sullivan, Wisconsin Department of Natural Resources, Mississippi River Team, LaCrosse, WI
· Metropolitan Council Environmental Services Review and comment on the July 2010 draft document was provided by:
· Rob Burdis, Minnesota Department of Natural Resources, Long Term Resource Monitoring Program
· John Sullivan, Wisconsin Department of Natural Resources, Mississippi River Team, La Crosse WI
· Mark Tomasek and Howard Markus, EAO Division, MPCA · Norm Senjem, Lower Mississippi River Basin Coordinator, Regional Division
The MPCA is reducing printing and mailing costs by using the Internet to distribute reports and information to wider audience. Visit our website for more information.
MPCA reports are printed on 100 percent post-consumer recycled content paper manufactured without chlorine or chlorine derivatives.
520 Lafayette Road North | Saint Paul, MN 55155-4194 | www.pca.state.mn.us | 651-296-6300 Toll free 800-657-3864 | TTY 651-282-5332 This report is available in alternative formats upon request, and online at www.pca.state.mn.us
Document number: wq-s6-09
2

Foreword The approach to criteria development and draft criteria were shared with the Lake Pepin Total Maximum Daily Load Science Advisory Panel in spring 2010. Science Advisory Panel membership includes technical staff and representatives from Minnesota Department of Natural Resources, Wisconsin Department of Natural Resources, Metropolitan Council Environmental Services, and University of Minnesota. The University of Minnesota Water Resources Center coordinates the activities of the Science Advisory Panel. The purpose of the Science Advisory Panel is to provide technical review for the Lake Pepin Total Maximum Daily Load. The Science Advisory Panel did not provide a comprehensive written review of this document; however, comments from individual Science Advisory Panel members were considered in drafting the site-specific standards.
This update incorporates minor revisions to the July 2010 report. There was no change to the proposed site-specific criteria, with exception of the addition of total phosphorus criteria for Pools 2 and 5-8 and total phosphorus and chlorophyll-a criteria for Pool 3, as these criteria were not included in the July 2010 version of the document. In addition, pool residence time and aerial photos of Pools 1-3 were added to the Appendix to help the reader appreciate the nature and morphologic variability of the pools. This revision will serve as the formal technical support document for this aspect of the river eutrophication and site specific rulemaking.
In addition, a January 2013 update to the MPCA report, Minnesota Nutrient Criteria Development for Rivers, resulted in changes to draft eutrophication criteria for other rivers. Tables 1a, 1b, and 10 were updated to reflect these changes to maintain consistency in the reports describing nutrient (eutrophication) criteria development.

Contents
Executive Summary ............................................................................................................. 1
Introduction ........................................................................................................................ 4
Data and Methods .............................................................................................................. 5
Background and Description of Study Area ........................................................................ 8
Flow .............................................................................................................................. 14
Results and Discussion ...................................................................................................... 15
Overview ....................................................................................................................... 15
Upper Mississippi, Pool 1 and Upper Pool 2 (UM-871.6, UM-847.7, and UM-839) ..... 16
Lower Minnesota River (MI-39.4, MI-8.5, and MI-3.5) ................................................. 21
Lower St. Croix River sites (SC-23.3 and SC-0.3) ........................................................... 24
Lower Pool 2 (UM-831, UM-826, and UM-815.6) and Pool 3 (UM-796.9) .................. 27
Pools 4-8 ........................................................................................................................ 31
Longitudinal variation on a daily basis .......................................................................... 36
Comparability of datasets ............................................................................................. 38
Total phosphorus, chlorophyll, and biochemical oxygen demand relationships ......... 40
Diurnal dissolved oxygen flux ....................................................................................... 48
Phytoplankton composition .......................................................................................... 52
Total phosphorus and dissolved ortho-phosphorus relationships ............................... 58
Chlorophyll-a mass balance .......................................................................................... 62
Summary and Criteria Recommendations ........................................................................ 64
References ........................................................................................................................ 73
Appendix A ........................................................................................................................ 76
Laboratory methods summary ..................................................................................... 76
Spectrophotometric method ....................................................................................... 76
Fluorometric method ................................................................................................... 77
Reference ..................................................................................................................... 77
Appendix B ........................................................................................................................ 79
Appendix C ........................................................................................................................ 81

List of Tables Table 1a. Draft river nutrient criteria ranges by River Nutrient Region (RNR) for Minnesota (Heiskary et al. 2010)
Table 1b. Draft criteria ranges for main-stem rivers and Mississippi River Pools 1-8. Concentrations expressed as summer averages.
Table 2. Summer (June-September) mean flows (cfs) for the Mississippi, Minnesota, and St. Croix Rivers based on USGS records. Flow percentiles represent % of summers with a flow lower than that value based on the most recent 30 years as noted in LimnoTech (2009). Flows at Prescott sorted by percentile to provide relative ranking of flow-years.
Table 3. Long-term summer mean based on ~10 years or more of data. Pool 1 (MCES): 1993 – 2006, Pool 2 (MCES): 1993-2004 and Pools 3-8 (LTRMP): 1993-2008
Table 4. Long-term summer-mean and maximum data for major tributaries and Pools 1-2 based on MCES data from 1993-2009. Chl-a for period 2001-2009 only.
Table 5. Comparison of Pool 3 summer-mean TP and chlorophyll based on LTRMP and MCES monitoring programs. Absolute difference between respective means noted.
Table 6. Summer flows for 2000, 2006 and 2008 for Mississippi at St. Paul and Minnesota at Jordan.
Table 7. Diurnal dissolved oxygen and Chl-T summary for Mississippi and Minnesota river sites.
Table 8. LTI UMR-LP model runs for average to low flow summers used in model development and testing: 1987, 1990, 1992, 1998, 2000, and 2006.
Table 9. Lake Pepin 303(d) listing values, current and historical values and draft criteria ranges.
Table 10. Draft criteria ranges for main-stem rivers and Mississippi River Pools 1-8. Concentrations expressed as summer averages.
List of Figures Figure 1. Map of Mississippi River Pools 1-11 and assessment reaches as defined by EMAP. List of dams that form the pools and morphometric information.
Figure 2. MCES monitoring sites.
Figure 3. Example of the varied habitats in Mississippi River Pools based on Pool 8. Land cover maps from 2000. Source: USGS, Upper Midwest Environmental Sciences Center website
Figure 4. Examples of aquatic recreational uses in Pools 1-8.
Figure 5. Pools 7 and 8 August 2008 showing an array of aquatic areas.
Figure 6. Upper Mississippi River sites summer-mean comparison by year for a) TP, b) Chl-a, and c) Chl-T.

Figure 7. Upper Mississippi River sites summer-means ranked by flow at Anoka: a) TP, b) Chl-T and c) Chl-T: TP.
Figure 8. MPCA and MCES summer-mean data comparison for UM-872: a) TP and b) Chl-T.
Figure 9. Lower Minnesota River sites summer-means comparison by year for a) TP and b) Chl-T.
Figure 10. Lower Minnesota River sites summer-means ranked by flow at Jordan: a) TP, b) DOP, c) Chl-T and d) Chl-T: TP
Figure 11. St. Croix River sites summer-means comparison by year for a) TP, b) DOP, and c) Chl-T.
Figure 12. St. Croix River sites summer-means ranked by flow at St. Croix Falls: a) TP, b) DOP, c) Chl-T and d) Chl-T: TP.
Figure 13. Lower Pool 2 and 3 sites (UM-831, UM-826, UM-815.6 and UM-796.9) summer-means comparison by year for: a) TP b) DOP, and c) Chl-T.
Figure 14. Lower Pool 2 (UM-831, UM-826, and UM-815.6) and Pool 3 ( UM-796.9) sites summer-means ranked by flow at Prescott: a) TP, b) DOP, c) Chl-T and d) Chl-T:TP ratio.
Figure 15. Metro WWTF phosphorus loading over time.
Figure 16. Pools 3, Lake Pepin outlet and Pool 4 summer-mean LTRMP: a) TP, b) Chl-a, and c) Chl-T.
Figure 17. Pools 5, 7 and 8 summer-mean LTRMP: a) TP, b) Chl-a and c) Chl-T.
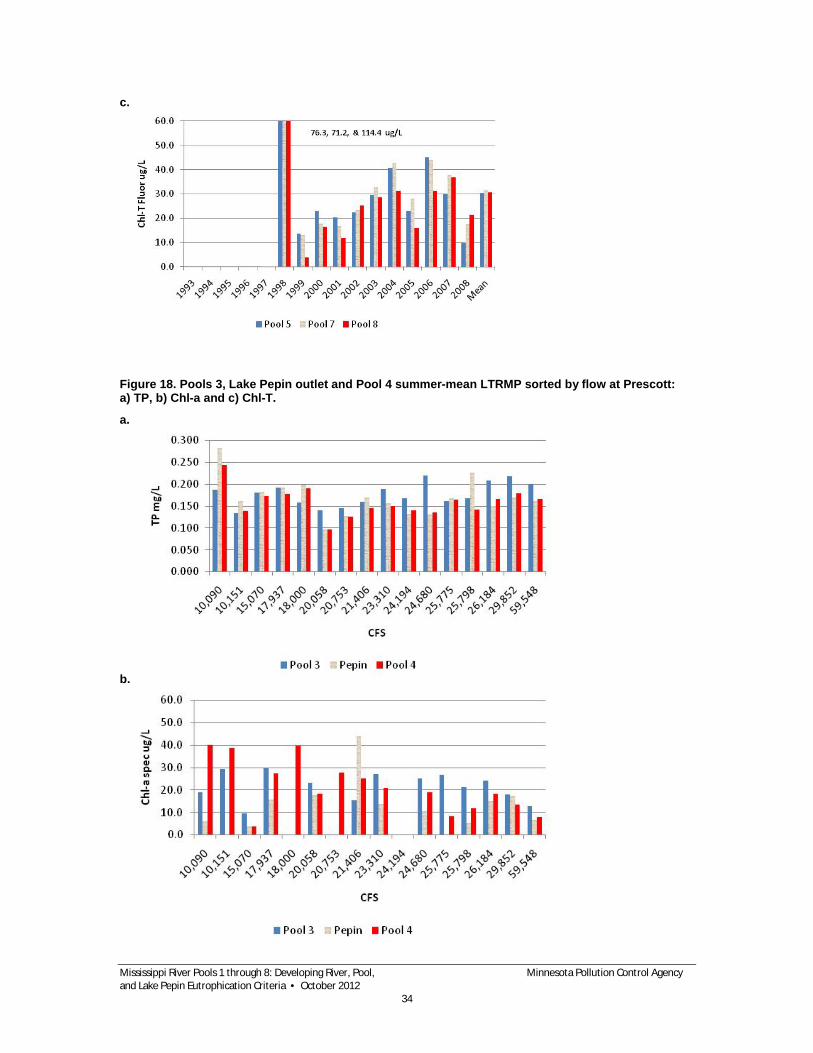
Figure 18. Pools 3, Lake Pepin outlet and Pool 4 summer-mean LTRMP sorted by flow at Prescott: a) TP, b) Chl-a, and c) Chl-T.
Figure 19. Pools 5, 7, and 8 summer-mean LTRMP sorted by flow at Prescott: a) TP, b) Chl-a and c) Chl-T.
Figure 20. Longitudinal chlorophyll-a and corresponding flow measurements for Pools 3-10. Data collected in conjunction with annual veliger surveys conducted by WDNR. Data sorted by pool number for three sample dates in each year.
Figure 21. Figure 21. Comparison of MCES, LTRMP and MPCA (MDH) data a) TP and b) Chl-a. These data were collected from Lake Pepin as a part of a quality assurance comparison in 2007.
Figure 22. TP and chlorophyll-a relationships based on Minnesota reference lakes and river nutrient data. Comparison made to data from upper and lower segments of Lake Pepin.
Figure 23. TP, Chl-T & Chl-a relationship for UM-871.6, MI-39 and SC-0.3 based on summer-mean MCES data.
Figure 24. TP and chlorophyll-a relationship for lower pools based on summer-mean LTRMP data. River regression as noted in Figure 22.
Figure 25. Summer-mean Chl-T (a) and Chl-T: TP (b) as a function of flow percentile for select river and pool sites.

Figure 26. Maximum Chl-a as a function of summer-mean chlorophyll-a. Based on a) MCES data for rivers & Pools1-3 and b) fixed station LTRMP data by spectrometry for Pools 3, 4, 5, 7 and 8.
Figure 27. Summer-mean BOD5 as a function of Chl-T. Based on MCES data for Minnesota, Mississippi and St. Croix River sites.
Figure 28. DO flux measurements (based on 4-day rolling mean) for July and August 2000 for Minnesota and Mississippi River sites. Summer-mean noted (MCES data).
Figure 29. Summer-mean and maximum DO flux as a function of summer-mean Chl-T. Data drawn from Table 6.
Figure 30. Summer-mean DO flux and Chl-T as a function of flow-year percentile. Data drawn from Table 7 (2000, 2006, & 2008).
Figure 31. Algal composition (based on numeric counts) below LD 8 at Genoa WI in 1974. Data courtesy of John Thiel, Dairyland Cooperative.
Figure 32. MI-3.5 phytoplankton a) composition for 2003-2006 and b) blue-green biomass relative to river flow.
Figure 33. Phytoplankton composition for pool and river sites for 1996.
Figure 34. TP and OP as a function of time for period 2004-2009 for sites MI-39 and UM-847 based on MCES data.
Figure 35. DOP as a function of TP for sites: UM-872, UM-847, UM-815, UM-796, SC-0.3, & MI-39.
Figure 36. Observed and predicted summer-mean Chl-a based on comparisons for select sites in the study area
Figure 37. Suspended solids balances based on UMR-LP model. Based on scenario 2 for period: 1985-2006 and summer 2006.
Figure 38. SC-23, UM-872, and MI-39 summer-mean TP and Chl-a relationships expressed as a function of river flow percentile.
Figure 39. SC-23, UM-872, and MI-39 summer-mean DOP expressed as a function of river flow percentile.

Acronyms, Abbreviations, and Commonly Used Terms in this Report ALUS benthic algae BOD5 CDF
Aquatic Life Use Standard algae that live attached to substrates in stream; also referred to as periphyton 5-day biochemical oxygen demand cumulative distribution function (also referred to as frequency distribution)
CHF North Central Hardwood Forests ecoregion cfs Cubic feet per second Chl-a chlorophyll-a, corrected for pheophytin Chl-T total chlorophyll-a, which includes chlorophyll-a +pheophytin CI confidence interval DA diel
Driftless Area ecoregion A chronological day (24 hours)
DO EPA
dissolved oxygen U.S. Environmental Protection Agency
HUC IBI
hydrologic unit code Index of biotic Integrity
ISS Inorganic suspended solids LAP Lake Agassiz Plain, another name for RRV ecoregion LTRMP Long Term Resource Monitoring Program m meters max maximum MCES Metropolitan Council Environmental Services MDH Minnesota Department of Health med median metric used to refer to a biological measurement or class of organisms mg/L, mgL-1 milligrams per liter; equivalent to parts per million mg/m2 milligram per meter squared; an areal-based measure commonly used to express
periphyton biomass or chlorophyll-a min Minn. Miss. MPCA
Minimum Minnesota River Mississippi river Minnesota Pollution Control Agency
NGP Northern Glaciated Plains ecoregion NLF Northern Lakes and Forests ecoregion NMW Northern Minnesota Wetlands ecoregion NPS NTU P Quantile
Nonpoint Source Nephelometric turbidity units Phosphorus Division of ordered data into equally sized portions. For example, quartiles are the division of data into 4 equal portions and percentiles are the division of data into 100 equally sized portions

quartile r2 RNR RRV RTAG sestonic algae
STORET TALU TKN TMDL
a distribution that subdivides population into four equal portions, whereby first quartile represents lowest 25% of population…fourth quartile represents upper 25% r squared, correlation coefficient River Nutrient Region Red River Valley ecoregion Regional Technical Assistance Group algae suspended in the water; also referred to as phytoplankton EPA's data system - STOrage and RETrieval Tiered Aquatic Life Use total Kjeldahl nitrogen Total Maximum Daily Load
TN total nitrogen; equivalent to sum of TKN +nitrate-N TP total phosphorus TSS total suspended solids µg/L micrograms per liter, equivalent to parts per billion USACE United States Army Corps of Engineers USFWS United States Fish and Wildlife Service USGS United States Geological Survey WCP WWTF WWTP
Western Corn Belt Plains ecoregion wastewater treatment facility wastewater treatment plant

Executive Summary Minnesota promulgated lake eutrophication standards in 2008 and is currently developing river eutrophication criteria as a part of the U.S. Environmental Protection Agency (EPA) nation-wide effort to develop nutrient criteria for lakes, rivers, wetland and estuaries. Data from representative medium to large rivers has shown strong, reproducible relationships among total phosphorus (TP), sestonic chlorophyll-a (Chl-a), and biochemical oxygen demand (BOD5) (Heiskary and Markus 2001). Subsequent advancements established linkages among these variables, diurnal dissolved oxygen (DO) flux, and fish and invertebrate metrics (Heiskary 2008 and Heiskary et al. 2010). Relationships among these variables, combined with statistical analysis of biologically-based thresholds, resulted in draft criteria (Table 1a). The criteria were developed in a regional context that is somewhat similar to aggregated (EPA) Level III ecoregions. The draft criteria and technical documentation have undergone initial review by (EPA) Region V and (EPA) Headquarters. The Minnesota Pollution Control Agency (MPCA) is updating that work and reviewing the draft criteria based on comments received.
As a part of the Lake Pepin Total Maximum Daily Load (TMDL), the MPCA proposed site specific criteria for Lake Pepin. This work was done in concert with Lake Pepin TMDL Science Advisory Panel (SAP). Members of the SAP, including the Minnesota Department of Natural Resources (MDNR), Wisconsin DNR (WDNR), Metropolitan Council Environmental Services (MCES) and others, provided review and comment on the proposed criteria. The criteria were developed based on long-term data collections, modeling conducted by Limno Tech Int. (LTI) and a variety of research in support of the Lake Pepin TMDL. As work on this complex system progressed it became evident to staff and the SAP that site specific criteria for Lake Pepin needed to be linked with criteria for the Mississippi River navigation pools and criteria for the major rivers that drive the water quality of Lake Pepin and the pools: Upper Mississippi, Minnesota, and St. Croix Rivers. Also, low flow summers (e.g. 2006) and dramatic reductions in TP loading from the MCES Metro Plant to Pool 2 provided further insights into this system. As a result, the SAP recommended the MPCA move forward with an analysis of data for this overall system with the intent of developing eutrophication criteria for the rivers, pools, and Lake Pepin. This report provides an analysis of data for the navigation pools and major tributaries based on available data from MCES and MDNR’s Long Term Resource Monitoring Program (LTRMP), complements previous analysis for Lake Pepin (Heiskary and Wasley 2010), and contributes to development of eutrophication criteria for the Upper Mississippi River navigational pools.
Mississippi River navigation Pools 1-8 represent a “transitional” waterbody type between free flowing rivers and true reservoirs. Similar to rivers, water residence time is quite short in all pools, with the exception of Pool 4 (Lake Pepin). Navigation is a very important component of these pools and considerable effort has been expended to create and maintain a navigational channel, which conveys the majority of water through the pools. These channels are really a “deep” river that is a relatively poor area for algal growth as compared to other rivers and lakes. The rivers, pools, and Lake Pepin, exhibit varying relationships between TP and Chl-a. The Minnesota, Upper Mississippi, St. Croix Rivers, and Pool 1 produce more Chl-a per unit TP than do Pools 2, 3, and Lake Pepin and all rivers and pools produce more Chl-a during low flow as compared to high flow. Downstream Pools 5-8 exhibit highly variable relationships between TP and Chl-a because of the dominance of upstream TP and Chl-a loads and the overall biological
Mississippi River Pools 1 through 8: Developing River, Pool, Minnesota Pollution Control Agency and Lake Pepin Eutrophication Criteria • October 2012
1

and physical complexity of these pools. Though we are currently unable to establish the distinct linkages among aquatic life and nutrients in these pools, (as we can for rivers or lakes), recent fishery survey information for the pools and Lake Pepin indicates a diverse and relatively healthy assemblage of fish is present.
The proposed criteria are designed to protect aquatic life in rivers and pools (Table 1b), while also protecting aquatic recreation in Lake Pepin and protecting downstream aquatic life uses in Pools 5-8. They are consistent with criteria for large rivers and Lake Pepin developed by Wisconsin. Proposed criteria consider linkages among rivers, pools, and Lake Pepin, downstream transport of TP and algae, TP and Chl-a relationships, and desire to minimize the frequency of nuisance blooms (Chl-a > 50 µg/L). Related considerations include LTI Upper Mississippi River –Lake Pepin mechanistic model projections for the Lake Pepin TMDL and existing upstream TMDLs (e.g. Minnesota River low DO and Lake St. Croix TMDLs).
Based on data compiled for this report, for the Mississippi at Anoka and Minnesota River at Jordan, both sites are likely to be deemed impaired based on these criteria. Total Maximum Daily Loads for these rivers would provide the roadmap for needed upstream reductions. Meeting the criteria in these two rivers is expected to result in downstream pool and Lake Pepin criteria to be met also. Based on recent LTRMP data, lower Pools 5-8 are at or below the draft Chl-a criterion and would likely be deemed to meet aquatic recreational uses. All tributaries downstream of Lake Pepin will have 100 µg/L TP (75 µg/L for wadeable streams in Wisconsin) standards based on the promulgated Wisconsin standards and Minnesota’s proposed river nutrient standards. Phosphorus loads to Pools 5-8 will continue to be reduced as upstream nutrient TMDLs are implemented. These reductions will provide additional protection for the pools just as the reductions in watersheds upstream of Lake Pepin will protect the pools upstream of Lake Pepin. Based on conversations to date with Wisconsin, these draft criteria fit their vision for these shared border waters as well.
Table 1a. Draft river eutrophication criteria by River Nutrient Region for Minnesota (Heiskary et al. 2010, Revised January 2013)
Region TP µg/L Chl-a µg/L DO flux mg/L BOD5 mg/L
North 50 <7 <3.0 <1.5
Central 100 <18 <3.5 <2.0
South 150 <35 <4.5 <3.0
Mississippi River Pools 1 through 8: Developing River, Pool, Minnesota Pollution Control Agency and Lake Pepin Eutrophication Criteria • October 2012
2
Table 1b. Draft criteria for main-stem rivers, Mississippi River pools, and Lake Pepin. Concentrations expressed as summer averages. Source of data for assessment noted. Assumes aquatic recreational and aquatic life uses are maintained if TP and Chl-a are at or below criteria levels.
River/Pool Site Data source TP µg/L Chl-a µg/L
Rivers
Miss. @Anoka1 UM-872 MCES 100 18
Lake St. Croix3 SC-0.3 MCES 40 14
Minn. @Jordan1 MI-39 MCES 150 35
Pools & Lake Pepin
Pool 12 UM-847 MCES 100 35
Pool 24 UM-815 MCES 125 35
Pool 34 UM-796 MCES 100 35
Lake Pepin (Pool 4)5 4 fixed sites LTRMP 100 28
Pools 5-86 Near-dam LTRMP 100 35 1 River eutrophication criteria-based. Based on modeling UM-872 & MI-3.5 criteria will meet Lake Pepin requirements. 2 Minimize frequency of severe blooms. Upstream criteria provide additional protection for Pool 1. 3 MN lake eutrophication criteria-based. Based on modeling St. Croix outlet (SC-0.3) would meet Lake Pepin requirements. 4 Minimize frequency of severe blooms & meet Lake Pepin requirements 5. TP consistent with Wisconsin standard. Lake Pepin criteria assessed based on lake-wide mean from 4 monitoring sites. 6 Minimize frequency of severe blooms; upstream P requirements benefit lower pools. Assumes Wisconsin standard of 100 µg/L applies to Pools 5-8
Mississippi River Pools 1 through 8: Developing River, Pool, Minnesota Pollution Control Agency and Lake Pepin Eutrophication Criteria • October 2012
3

Introduction Minnesota promulgated lake eutrophication standards in 2008 and is currently developing river eutrophication criteria as a part of EPA nation-wide effort to develop nutrient criteria for lakes, rivers, wetlands, and estuaries. Data from representative medium to large rivers has shown strong, reproducible relationships among TP, sestonic Chl-a, and biochemical oxygen demand (BOD5) (Heiskary and Markus 2001). Advancements since this original work have established linkages among these variables, diurnal DO flux, and fish and invertebrate metrics (Heiskary 2008 and Heiskary et al. 2010). Relationships among these variables combined with statistical analysis of thresholds have resulted in draft ranges of criteria (Table 1a). The criteria have been developed in a regional context that is somewhat similar to aggregated EPA Level III ecoregions. The draft criteria and technical documentation have undergone initial review by EPA Region V and EPA Headquarters. The MPCA is updating that work and reviewing the draft ranges based on comments received.
In a related effort, the MPCA, in conjunction with numerous collaborators, including MDNR, WDNR, MCES, and others, has been developing site specific criteria for Lake Pepin as a part of the Lake Pepin TMDL. This effort has made use of modeling conducted by LTI and a variety of research in support of the Lake Pepin TMDL. As this work progressed, it became evident that site specific criteria for Lake Pepin needed to be linked with criteria for the Mississippi River pools and the criteria for the major rivers that drive the water quality of Lake Pepin and the pools: Upper Mississippi, Minnesota, and St. Croix Rivers. This current analysis, combined with previous analysis for Lake Pepin (Heiskary and Wasley 2010), is intended to provide a basis for developing eutrophication criteria for the Upper Mississippi River pools and Lake Pepin in Minnesota.
Mississippi River Pools 1 through 8: Developing River, Pool, Minnesota Pollution Control Agency and Lake Pepin Eutrophication Criteria • October 2012
4

Data and Methods This report will describe phosphorus and chlorophyll concentrations in the major rivers and pools with a focus on longitudinal changes, change over time, and variation relative to flow. We will also describe interrelationships among the primary variables for which eutrophication criteria are being drafted: TP, corrected Chl-a, total chlorophyll (Chl-T), and BOD5. Comparisons among mean and maximum Chl-a and Chl-T will be made. Algal composition, based on some pre-existing work, will be described as well and compared to typical composition in lakes and rivers.
The two primary sources of data for this analysis are drawn from routine and long-term monitoring conducted by MCES in the Twin Cities Metropolitan Area (TCMA) and MDNR as a part of the LTRMP that is conducted on pools in the Mississippi and its tributaries in conjunction with the United States Army Corps of Engineers (USACE) (Figure 1). The MCES sites used in this analysis include sites on the Mississippi, Minnesota, and St. Croix Rivers, and includes sites in Pools 1, 2 and 3 (Figure 2). The LTRMP data used in this analysis includes data from the fixed station network in Pools 3-8 (Figure 1). Sites used in this analysis are generally located along the thalweg of the pool and are often located at or immediately below the dam for each pool. Pools 3 through 8 were drawn from fixed station data from the LTRMP data as provided by Rob Burdis, MDNR. Long Term Resource Monitoring Program monitoring sites for many of these pools (as used in this report) are based on transects at the downstream dam (i.e. L&D 8 is basis for Pool 8 summary).
The data selected for this analysis are summer data (June –September) from 1993-2009. This timeframe represents initiation of LTRMP sampling in this area, includes a wide range of flows (1993 among the highest flows of record and 2006 and 2009 among the lowest flows of recent decades), and covers a time period where substantial reductions in point source phosphorus (P) were made at the MCES Metro Wastewater Treatment Facility (WWTF), as well as other major WWTFs.
Since data from three (includes MPCA statewide river nutrient data) monitoring programs is incorporated into the analysis, there are some quality assurance, methodological, and related concerns that need be addressed. All three programs have detailed methods and quality assurance descriptions and we will not reiterate that information here; rather we will direct the reader to quality assurance documents and websites where this information may be found. In addition, there were some previous inter-laboratory quality assurance testing done and data from that is summarized in the Appendix. Some specific comparisons of data will be made later in the context of this report.
Mississippi River Pools 1 through 8: Developing River, Pool, Minnesota Pollution Control Agency and Lake Pepin Eutrophication Criteria • October 2012
5

Figure 1. Map of Mississippi River Pools 1-11 and assessment reaches as defined by EMAP. Pool morphometry and residence time noted below.
Dams that form Pools 1-8 on Upper Mississippi River. Drawn from Soballe et al. (2002) and Mississippi River System Dam specifications (supplied by USACE based on WEST consultants, Inc. 2000). Mean depth from various sources. Pools 1-4 residence times estimated based on LTR UMR model framework and average to 25 percent of average flow. Pools 5-8 based on USACE volumes and summer average to low flow conditions. Lock Name or Number
River Mile
Pool Length
(mi)
Drainage Area
(sq mi)
City Began Operation
Mean depth
m
Res. Time days
Lower St. Anthony Falls
854.1 0.6 19,680 Minneapolis MN 1958
1 847.7 6.4 19,684 St. Paul, MN Rebuilt 1938
6.0 <1-2
2 815.2 32.5 36,990 Hastings, MN 1931 2.5 2-8 3 796.9 18.3 45,170 Red Wing, MN 1938 2.7 1-4 4 752.8 44.1 57,100 Alma, WI 1935 5.2 7-28 5 738.1 14.7 58,845 Minneiska, MN 1935 0.8-1.7 5A 728.3 9.8 59,105 Winona, MN 1936 0.4 – 0.9 6 714.2 14.1 60,030 Trempealeau, WI 1936 0.5 – 1.1 7 702.5 11.7 62,340 Dresbach, MN 1937 0.9-1.9 8 679.1 23.4 64,770 Genoa, WI 1937 1.8 1-2
Mississippi River Pools 1 through 8: Developing River, Pool, Minnesota Pollution Control Agency and Lake Pepin Eutrophication Criteria • October 2012
6

Figure 2. MCES river monitoring network: a) river-mile designated monitoring sites (Supplied by Kent Johnson, MCES) and overall map from MCES website. Aerial photos of Pools 1-3 included in Appendix C.
Mississippi River Pools 1 through 8: Developing River, Pool, Minnesota Pollution Control Agency and Lake Pepin Eutrophication Criteria • October 2012
7

Both monitoring programs have extensive quality assurance and detailed laboratory and field methods are available for each program. Descriptions for MCES may be found in various reports on their website (http://www.metrocouncil.org/environment/RiversLakes/index.htm ) and as summarized in Larson (2010). Long Term Resource Monitoring Program methods and quality assurance are summarized in Soballe et al. (2002 and 2004).
Primary parameters addressed in this analysis include TP, dissolved ortho-phosphorus (DOP), (Chl-a, corrected for pheophytin), total chlorophyll (Chl-T, Chl-a + pheophytin) and BOD5. Chlorophyll analysis at MCES is conducted by spectrophotometry using two methods. In this report, MCES "Chl-a" represents chlorophyll-a measured with the modified monochromatic method and corrected for pheophytin-a, while MCES "Chl-T" represents total chlorophyll-a measured with the trichromatic method and not corrected for pheophytin-a. Long Term Resource Monitoring Program chlorophyll analysis is conducted both by spectrophotometry (subset of samples) and by fluorometry (all samples). Long Term Resource Monitoring Program fluorometric measures were used to represent Chl-T. Where fluorometric values are corrected to estimate Chl-a, this will be noted. Summary notes on methods are included in the Appendix. Some among-laboratory comparisons will be made in the context of this report.
Background and Description of Study Area Just as rivers are different from reservoirs and lakes, the man-made navigation pools on the Mississippi River (Figure 1) alter the otherwise free-flowing nature of the river, resulting in potentially different relationships among nutrients, chlorophyll-a and biota as a result of increased mixing depth, light limitation, wind-induced mixing, short retention time, habitat alteration, and related factors. Within the pools, there are varieties of aquatic areas ranging from navigation channels on the thalweg of the main channel, to contiguous backwaters along the pool margins, to isolated backwater lakes. Spring Lake, a shallow floodplain lake in Pool 2 is one example of a waterbody that was formed because of the damming of the river. In pre-European times, it was a floodplain forest and marsh. The damming of its outlet creek in the 1800s allowed for development of the lake, and the installation of Lock and Dam 2 in 1931 resulted in relatively stable water levels. Today, the stump-field from the floodplain forest serves as a reminder of its origin.
Pool morphometry, water quality, and habitat vary among the pools as well. Morphometry and residence time varies from the “river-like” Pool 1 (Figure 1 and Appendix C), to “lake-like” Pool 4, to the extensive backwaters and braided channels that characterize Pools 5-8 (e.g. Figure 3). However, because of the very large upstream watersheds, residence time is very short, generally one-two days or less in each pool, with the exception of Pools 2 and 4 (Figure 1). One of the more significant transitions in this series of navigational pools occurs as water flows through Lake Pepin. Lake Pepin efficiently settles suspended sediment, which when combined with the flow from major Wisconsin tributaries (e.g. Chippewa, Black, and Wisconsin) that are low in suspended sediment, results in increased transparency in downstream pools allowing for increased submerged aquatic vegetation (SAV) in contiguous backwaters and other portions of the pools with appropriate substrate and other characteristics necessary for SAV. Processes
Mississippi River Pools 1 through 8: Developing River, Pool, Minnesota Pollution Control Agency and Lake Pepin Eutrophication Criteria • October 2012
8
within Lake Pepin allow particulate TP to be effectively trapped in the system; however, internal recycling allows for conversion of particulate P to DOP (Heiskary and Walker 1988) that may promote downstream algal and SAV growth.
The Mississippi River navigations pools offer abundant opportunity for hunting, wildlife observation, and a host of water-based activities, including swimming, fishing, and pleasure boating (MDNR 2004 and St. Mary’s University 2007). Much of the river in Minnesota below Lake Pepin is part of the Upper Mississippi River National Wildlife and Refuge system, which allows for a wide variety of uses. A recreational boating study conducted by the MDNR, WDNR, USFWS, and USACE in 2003 provides some insights into recreational uses of the pools. MDNR (2004) notes that the reach from Pool 4 to Pool 9 contains nearly 130,000 acres of boating water and a substantial number of facilities (public and private) that help support water-based recreation on the pools. It has been estimated that the quantity of usage exceeds one-million-boat hours during the summer period. This is a very high level of usage and boating intensity (boats per acre of water) on the Mississippi River is at a level similar to Minnesota’s non-metropolitan lake regions. One of the findings of the study was that boaters spend about equal amounts of time in the main channel area, side channel, and backwater areas. As an activity group, anglers spend most of their time in side channels and backwaters, while pleasure boaters spend most of their time in the main channel (MDNR 2004). In summary, Pools 1 to 8 on the Mississippi are highly used by a variety of people for a wide variety of purposes, and many of these uses are enhanced by good water quality (Figure 4).
Extensive fishery studies have been conducted in these pools and in general indicate a very robust and healthy fishery. Dietermann (2009) in an assessment of Pools 3-9 notes, “Fish populations between Hastings, Minnesota and the Iowa border were generally healthy. Generally, good recruitment and growth of most game-fish species has occurred since 1994.” In reference to Pool 5, he notes, “Aquatic habitat conditions were generally good to excellent throughout the pool. Dense and diverse beds of SAV were widespread and prevalent in most aquatic areas surveyed. This was the first year since monitoring began in 1993 that SAV was observed growing in portions of the lower pool in depths greater than nine feet (personal observation).” Similar notes on good habitat and extensive beds of submerged aquatic vegetation are noted for Pools 6 and 7 as well. In summary he notes “Aquatic habitat conditions were again very poor in the Lower Vermilion River; improving into the “good” range in Pool 3; and generally excellent from the lower portion of Pool 4 including the foot of Lake Pepin through Pools 5, 5A, 6, 7, 8, and upper Pool 9. Depth of observed SAV, in some pools, increased to levels (10 feet) not seen during the 16 years of this monitoring program. Even Pool 3 aquatic habitat conditions improved to the best condition measured during this program.” Fish populations were described as generally healthy and stable.
Meerbeek (2008) reporting on conditions in Pool 4 and Lake Pepin shares similar observations “They have also found submerged aquatic vegetation to be scarce in and above Lake Pepin and along the main and secondary channels; however, since 2004, LTRMP biologists have documented increasing trends of percent frequency of occurrence of submersed, floating-leaf, and emergent vegetation in upper and lower Pool 4. The isolated and contiguous backwaters below Lake Pepin are generally rich in submergent species.”
Mississippi River Pools 1 through 8: Developing River, Pool, Minnesota Pollution Control Agency and Lake Pepin Eutrophication Criteria • October 2012
9

There are fewer survey reports for Pool 1 and the Mississippi River at Anoka. A 2009 standard lake survey report for Pool 1 (MDNR 2009) notes “Compared to the previous population assessment conducted in 1995, smallmouth bass abundance has increased significantly.” The report goes on to note, “Looking at the number of gamefish sampled compared to the total number of fish sampled, the proportion of gamefish has increased. In 2009, six gamefish species comprised 68.9 percent of the total number of fish sampled. In 1995, smallmouth bass and walleye represented 11.6 percent of all fish sampled. Northern pike, channel catfish, flathead catfish and white bass were not sampled in 1995, while they were seen in 2009.” Survey information and anecdotal information for the reach from the Coon Rapids Dam to the Crow River mouth suggests a good smallmouth bass fishery based on increased numbers of sampled fish, angler usage and monitoring of tournaments. As with the other surveys reviewed and noted in this report, MDNR fishery managers caution that valid statistical comparisons cannot be made among surveys over time in a given pool or among pools for a variety of reasons associated with sampling technique, location etc. (e.g. Dodds 2010, personal communication). Overall, a consistent theme emerges that suggests improvements in the fishery over time and high usage by anglers.
In view of the differences among free-flowing rivers and these managed navigation pools and wide array of usage (aquatic recreation) the pools receive, it was decided that site specific eutrophication criteria should be developed for Pools 1-8 (St. Anthony Falls in Minneapolis to the Iowa border on the southern edge of the state). The assessment-reaches roughly correspond to river segments previously established by the five states of the Upper Mississippi River Basin Association and are segmented based on major tributary inflows (Figure 1). The reaches defined in this work: Upper Mississippi River (Pool 1), Minnesota River to St. Croix (Pool 2), St. Croix to Lake Pepin (Pools 3 and Upper Pool 4 - Lake Pepin), Chippewa River to Black River (Lower Pool 4, 5, 6, Black River to Minnesota state line (Pools 7 and 8) provide a reasonable framework for developing the criteria and conducting assessments. Appendix C provides aerial photos of Pools 1-3.
Habitats within the pools are quite variable. Using Pool 8 as an example (Figure 3) it is evident that depth may vary substantially among the various habitats, whereby channel areas are somewhat deeper while backwaters may be quite shallow. For Pool 8, 75 percent of the pool is 2 m or less in depth. Given the wide array of aquatic areas in the pools (Figure 3) and that each area provides one or more forms (opportunities) for aquatic recreation, it was difficult to decide on the specific focus for the criteria and which data should be used to develop the criteria and ultimately assess the pools. Upon review of various data sets and monitoring site locations from MCES, LTRMP, WDNR, and the MPCA, it was decided that the criteria should focus on the water quality as measured in the main river channel and near-dam area of each pool. Data collected near the dam (e.g. MCES site at UM-815.6 immediately above Lock and Dam 2) or the various LTRMP or WDNR sites located at or immediately below the dam serve to integrate the upstream water quality of the pool (e.g. Lock and Dam 8 in Figure 5b). As such, these sites provide a reasonable basis for evaluating water quality relationships, characterizing pool water quality, establishing the criteria, and eventually assessing compliance with the criteria. The focus for nutrient criteria development for the pools is on aquatic recreation with a strong emphasis on minimizing the frequency and magnitude of algal blooms in the pools. Figures 5a and b provides an example of what constitutes a severe nuisance bloom.
Mississippi River Pools 1 through 8: Developing River, Pool, Minnesota Pollution Control Agency and Lake Pepin Eutrophication Criteria • October 2012
10

Figure 3. Example of the varied habitats in Mississippi River pools based on Pool 8. Land cover maps from 2000. Source: USGS, Upper Midwest Environmental Sciences Center website
Mississippi River Pools 1 through 8: Developing River, Pool, Minnesota Pollution Control Agency and Lake Pepin Eutrophication Criteria • October 2012
11
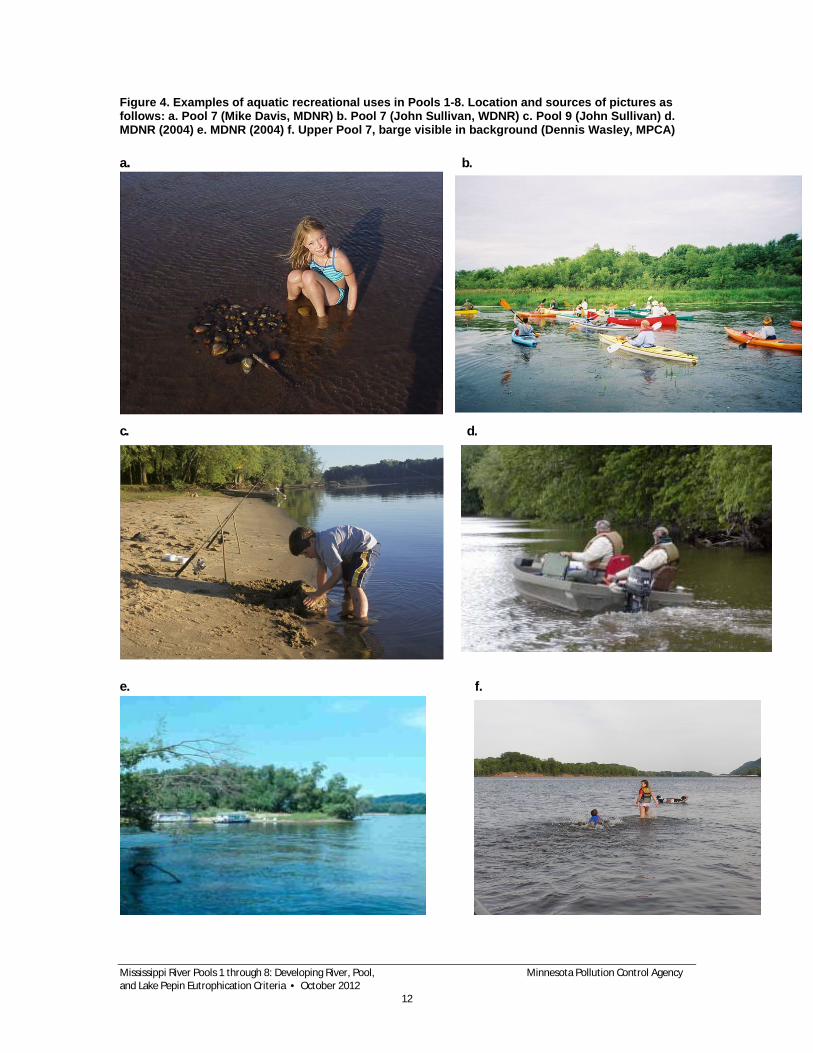
Figure 4. Examples of aquatic recreational uses in Pools 1-8. Location and sources of pictures as follows: a. Pool 7 (Mike Davis, MDNR) b. Pool 7 (John Sullivan, WDNR) c. Pool 9 (John Sullivan) d. MDNR (2004) e. MDNR (2004) f. Upper Pool 7, barge visible in background (Dennis Wasley, MPCA) a. b.
c. d.
e. f.
Mississippi River Pools 1 through 8: Developing River, Pool, Minnesota Pollution Control Agency and Lake Pepin Eutrophication Criteria • October 2012
12

Figure 5. Pools 7 and 8 August 2008 showing an array of aquatic areas. Photo a. is from Pool 7 and shows Lake Onalaska. The eastern portion of this photo shows blue-green algae bloom on August 8, 2008. The western portion of this photo is from August 24, 2008. The source of this photo is from the USDA National Agriculture Imagery Program (NAIP). Photo b. was taken on August 8, 2008 and was obtained from NAIP. [Based on an August 13, 2008 sample at LD 8 tailwater Chl-a was 62 µg/L]. Photo c. Lake Onalaska in Pool 7 – filamentous algae (photo supplied by John Sullivan). a.
b.
c.
Mississippi River Pools 1 through 8: Developing River, Pool, Minnesota Pollution Control Agency and Lake Pepin Eutrophication Criteria • October 2012
13

Flow The period of record addressed in this report (1993-2009) includes a wide and representative range of flows for the Upper Mississippi, Minnesota, and St. Croix Rivers (Table 2), and provides an excellent opportunity to examine the role of flow. This record includes a summer with the highest flow on record (1993) as well as several recent summers with 10th percentile or lower flows (e.g. 2006, 2007, and 2009). This summary also demonstrates variation in flow-years among the major rivers in a given summer. For example, 2006 and 2007 were less than 10th percentile flows for the Mississippi at Anoka and the St. Croix; however, the Minnesota River was near the 25th percentile in both years. The relative differences in flow among the various rivers will influence not only their percentage contribution to flow at downstream sites, but can also influence phosphorus and chlorophyll concentrations. Flows in Table 2 will be used to demonstrate the role of flow on phosphorus and chlorophyll concentrations and provide a basis for flow-related rankings among the study years.
Table 2. Summer (June-September) mean flows (cfs) for the Mississippi, Minnesota and St. Croix Rivers based on USGS records. Flow percentiles represent percentage of summers with a flow lower than that value based on the most recent 30 years as noted in LimnoTech (2009). Flows at Prescott sorted by percentile to provide relative ranking of years.
River Miss. Minn. Miss. SC Miss. Miss.Site Anoka Jordan St. Paul SC Falls Prescott Prescott (sorted by %)Year Flow %ile Flow %ile Flow %ile Flow %ile Flow %ile Flow %ile Year
1993 18,063 100% 30,055 100% 49,965 100% 6,388 93% 59,413 100% 59,413 100% 19931994 9,032 55% 9,052 79% 18,455 62% 4,431 55% 23,300 59% 29,790 86% 20021995 9,570 59% 10,364 86% 20,588 79% 5,378 76% 26,165 83% 26,165 83% 19951996 7,370 38% 7,295 66% 15,152 52% 4,651 59% 20,086 48% 25,912 76% 20011997 11,322 79% 8,575 76% 20,690 83% 3,453 38% 24,565 69% 25,810 72% 19991998 8,463 48% 4,886 34% 13,706 41% 2,780 21% 17,918 31% 24,565 69% 19971999 12,345 86% 6,873 62% 19,973 72% 5,177 72% 25,810 72% 24,345 66% 20042000 5,443 24% 4,886 38% 10,574 24% 3,132 28% 15,063 24% 23,300 59% 19942001 11,293 76% 7,532 69% 20,302 76% 3,963 52% 25,912 76% 21,406 55% 20052002 15,083 90% 5,615 45% 21,015 86% 5,801 83% 29,790 86% 20,712 52% 20032003 9,823 62% 3,432 17% 13,455 34% 5,390 79% 20,712 52% 20,086 48% 19962004 7,606 45% 9,810 83% 17,885 59% 5,044 66% 24,345 66% 18,319 34% 20082005 11,259 72% 6,368 59% 18,553 66% 3,418 34% 21,406 55% 17,918 31% 19982006 3,678 3% 3,605 28% 7,353 10% 1,861 3% 10,201 14% 15,063 24% 20002007 3,700 7% 3,530 24% 7,379 14% 1,878 7% 10,144 10% 10,201 14% 20062008 7,089 31% 5,997 52% 13,677 38% 3,703 45% 18,319 34% 10,144 10% 20072009 4,619 14% 2,045 10% 6,811 7% 2,154 10% 9,576 7% 9,576 7% 2009
Mississippi River Pools 1 through 8: Developing River, Pool, Minnesota Pollution Control Agency and Lake Pepin Eutrophication Criteria • October 2012
14

Results and Discussion
Overview Following is a summary of summer (June through September) TP and Chl-a for Pools 1 through 8. As there are differences in results between these two analytical techniques, results are presented separately at this point (Table 3). These data provide a coarse backdrop for the analysis that follows. In general, the data suggest that TP is relatively low in Pool 1 (as compared to the downstream pools); however Chl-a is high by comparison. TP almost doubles in Pool 2 with the addition of the Minnesota River and the Metro WWTF; however Chl-a is not significantly different from Pool 1. Pool 3 TP and Chl-a are lower because of dilution from the St. Croix and limited processing within the Pool. Chl-a is much reduced at the outlet of Lake Pepin. Lake Pepin serves to reset the system by effectively settling solids; however, minimal reduction in TP is observed as DOP increases because of in-lake processes. Mean TP and Chl-a are similar among Pools 5-8.
The subsequent analysis will begin at the major tributaries to this system: Upper Mississippi, Minnesota, and St. Croix Rivers and allows for a detailed examination of longitudinal patterns, changes over time, and changes as a function of flow. It will also allow for an analysis of interrelationships among TP, Chl-a, Chl-T and related factors. This analysis will demonstrate the linkages among the major rivers and pools in this system and help guide the selection of appropriate eutrophication criteria that would be protective of the rivers, pools and Lake Pepin.
Table 3a. Long-term summer means for Pools 3-8: 1993-2008 based on LTRMP data. Corrected Chl-a by spectrometry and fluorometric Chl-a. Spec. Chl-a data minimal after 1998.
Pool R mile TP Chl-spec Chl-fluor mg/L µg/L µg/L Pool 3 M786.2 0.177 21.7 26.0 Lake Pepin M764.3 0.169 14.2 20.7 Pool 4 M752.9 0.160 21.3 24.9 Pool 5 M738.2 0.165 21.2 30.4 Pool 7 M701.1 0.157 26.0 31.3 Pool 8 M679.2 0.146 25.1 30.6
Mississippi River Pools 1 through 8: Developing River, Pool, Minnesota Pollution Control Agency and Lake Pepin Eutrophication Criteria • October 2012
15

Table 3b. Long-term summer-mean and maximum data for major tributaries and Pools 1-2 based on MCES data from 1993-2009. Chlorophyll by spectrometry with corrected Chl-a for period 2001-2009 only. Chl-T is uncorrected and based on trichromatic method. Site TP mean
mg/L DOP mean1
mg/L Chl-a mean
µg/L Chl-a max.
µg/L Chl-T mean
µg/L Chl-T max.
µg/L UM-871.6 0.124 0.056 38 100 38 95 UM-847.7 0.104 0.030 46 92 44 96 UM-839.1 0.167 0.057 49 120 48 140 UM-831.0 0.216 0.104 45 93 46 100 UM-826.7 0.206 0.105 41 83 42 98 UM-815.6 0.213 0.100 45 110 45 100 UM-769.9 0.178 0.081 40 100 42 110 MI-39.4 0.249 0.078 95 270 84 290 MI-8.5 0.265 0.082 73 190 69 200 MI-3.5 0.258 0.104 61 180 60 190 SC-23.3 0.062 0.015 28 74 27 74 SC-0.3 0.048 0.016 18 66 16 81 1Detection limit for DOP ranged from 0.005-0.011. Reported values were not adjusted when calculating means.
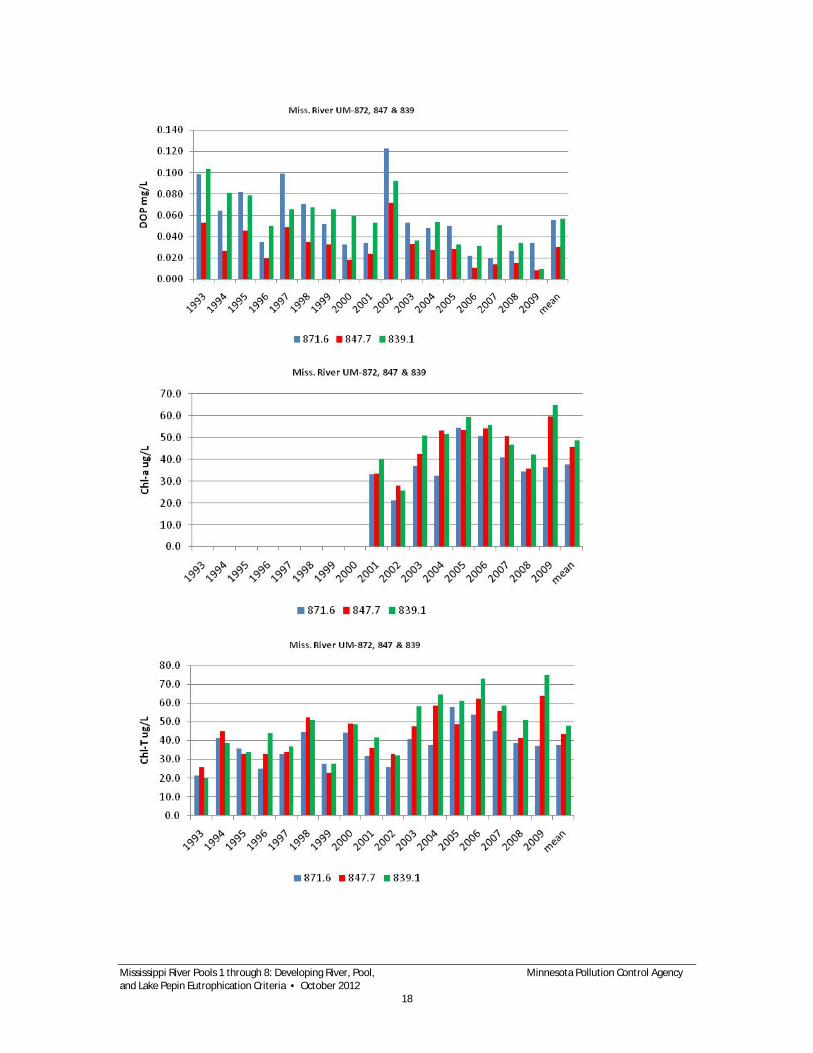
Upper Mississippi, Pool 1 and Upper Pool 2 (UM-871.6, UM-847.7, and UM-839) The monitoring site at Anoka (UM-871.6) on the Mississippi represents one of three major inputs for this overall study reach. There is extensive data from MCES for this site, long-term MPCA data, and was one of the original river nutrient study sites (Heiskary and Markus 2001). The second site (UM-847.7) is located within Pool 1 and has extensive data. The third site (UM-839) is located in Pool 2 and is downstream from the confluence with the Minnesota River.
Total phosphorus at UM-871 averages about 0.125 mg/L and ranges between about 0.075 – 0.150 mg/L in most summers (Figure 6a). Total phosphorus at UM-847 is slightly lower at 0.100 mg/L and ranges between 0.070-0.100 mg/L in most summers. The reduction in TP is presumably due to settling in the pool and behind the Coon Rapids Dam upstream. Total phosphorus increases at UM-839 with an average of 0.170 mg/L and ranges from about 0.110-0.220 mg/L. There is not a significant overall trend in TP and DOP for the period 1993-2009; however TP and DOP, have been lower in recent summers (2005-2009) as compared to prior summer of record (Figure 6a). Dissolved ortho-phosphorus is rather high at UM-871 as it enters the Metro reach of the river (Figure 6b). Dissolved ortho-phosphorus declines in Pool 1, presumably due to algal uptake, and then increases at UM-839 with the influx of the Minnesota River.
Chlorophyll-a averages about 36 µg/L and ranges from 20-52 µg/L at UM-871 (Figure 6b). Chlorophyll-a is higher at UM-847 averaging 45 µg/L and ranging from 28-60 µg/L. This suggests this reach is more efficient per unit TP as compared to UM-871. Chlorophyll-a at UM-839 is slightly higher at 48 µg/L and ranging from 25-64 µg/L. The increase at UM-839 is a reflection of
Mississippi River Pools 1 through 8: Developing River, Pool, Minnesota Pollution Control Agency and Lake Pepin Eutrophication Criteria • October 2012
16

elevated TP and Chl-a from the Minnesota River. This pattern of increasing Chl-a from UM-872 through UM-839 has been previously observed by several investigators (e.g. Megard 1981 and Meyer and Schellhaass 2002).
Total chlorophyll was available for the entire period (Figure 5c). Again a downstream increase in Chl-T is evident with averages for the three sites of: 37, 43, and 48 µg/L (Figure 5c). Total chlorophyll appears to be somewhat higher in recent years (2004-2009) as compared to the 1990s (Figure 5c). Flow has a strong influence on TP, DOP and chlorophyll at these sites. In general, an increase in TP is evident across the three sites (Figure 7a); however, it is not a strictly linear increase. Dissolved ortho-phosphorus increases with flow as well and the overall trend seems most pronounced for UM-871 (Figure 7b). Total chlorophyll exhibits a very strong relationship with flow at all three sites and is quite reduced as flow increases above about 12,000 cfs at Anoka (Figure 7c). Decreased residence time and increased turbidity contribute to lower chlorophyll production.
Chl-T: TP ratios provide a measure of the efficiency of chlorophyll production per unit TP. Pool 1 (UM-847) is clearly the most productive of these three sites (Figure 7d). As anticipated, efficiency declines as flow increases. At lower flows, UM-871 is more productive than UM-839; however as flow increases the difference in Chl-T: TP between the two sites is minimal (Figure 7d). The efficiency at UM-839 does not reflect an inability to produce chlorophyll, but an excess of TP beyond the requirements of algae in this reach of river.
The Mississippi River at Anoka (UM-872) was monitored as a part of MPCA’s river nutrient dataset development (~6-7 times per summer) in 1999, 2000, 2001 and 2006 (Heiskary et al. 2010). Based on a comparison with MCES data for the same summers mean TP (±standard error) is quite similar between the two datasets (Figure 8a). Mean Chl-T is similar in two summers, while MCES values are slightly higher in two summers. These differences do not indicate one dataset should be favored over the other; rather it does suggest that differences in summer mean concentration can vary because of monitoring frequency, laboratory technique and related factors. This may need to be addressed more fully in assessment guidance that would be developed relative to the river and pool eutrophication criteria.
Figure 6. Upper Mississippi River sites summer-mean comparison by year for a) TP, b) Chl-a, and c) Chl-T.
Mississippi River Pools 1 through 8: Developing River, Pool, Minnesota Pollution Control Agency and Lake Pepin Eutrophication Criteria • October 2012
17
Mississippi River Pools 1 through 8: Developing River, Pool, Minnesota Pollution Control Agency and Lake Pepin Eutrophication Criteria • October 2012
18

Figure 7. Upper Mississippi summer-means ranked by Anoka flow: a) TP, b) Chl-T & c) Chl-T: TP.
a.
b.
c.
Mississippi River Pools 1 through 8: Developing River, Pool, Minnesota Pollution Control Agency and Lake Pepin Eutrophication Criteria • October 2012
19

d.
Figure 8. MPCA and MCES summer-mean data comparison for UM-872: a) TP and b) Chl-T.
a.
b.
Mississippi River Pools 1 through 8: Developing River, Pool, Minnesota Pollution Control Agency and Lake Pepin Eutrophication Criteria • October 2012
20

Lower Minnesota River (MI-39.4, MI-8.5, and MI-3.5) The lower reach of the Minnesota River from Jordan to the mouth near Fort Snelling is a highly studied and modeled reach because of a variety of water quality impairments, including low dissolved oxygen and turbidity. Exceedance of the DO standard has been a major issue for this reach and the MPCA completed a TMDL report in 2004 and an implementation plan in 2006 (MPCA 2004; MPCA 2006) to address this. The report attributed BOD loads at Jordan to upstream phosphorus loads and resulting phytoplankton production (Larson 2010). Point source reductions are underway because of the TMDL. Larson (2010) provides a comprehensive overview of the monitoring and modeling in this reach relative to this TMDL.
Three sites on the lower Minnesota River are routinely monitored by MCES: MN-39.4 near Jordan, MN-8.5, MN-8.5 immediately downstream of the Black Dog Power plant cooling water intake, and MN-3.5 near Fort Snelling and the outlet of the river (Figure 2). There are two major WWTFs in this reach: Blue Lake MN-20.5 and Seneca at MN-6.5. Both plants are designed to optimize P removal and annual average concentrations have been below 1.8 mg/L, with bio-P removal to 1 mg/L fully implemented as of 2008 (Larson 2010).
In general, there is minimal difference in summer-mean TP among the three Minnesota River sites with an approximate average of 0.250 mg/L (Table 4). Dissolved ortho-phosphorus increases through the reach (Table 4), presumably because of discharges in the reach and internal recycling. There is no distinct trend in TP over time; however, TP at all three sites declined markedly in 2008 and 2009 (Figure 9a). There is a distinct decline in DOP over this time and DOP reached very low levels in 2009 (Figure 9b). There is a distinct difference in chlorophyll concentrations among the three sites as evidenced by long-term mean and maximum Chl-a and Chl-T (Table 3). Chlorophyll-a and Chl-T are consistently higher at the upstream MN-39.4 site as compared to the two downstream sites (Figure 9c). Previous studies (e.g. Larson 2010) note that between RM 25 and the mouth algae increasingly die and decompose. Overall mean and maximum Chl-T values from the Minnesota River sites are not only the highest of all sites included in this study (Table 4) but are among the highest recorded in a world-wide study that was conducted by Van Nieuwenhuyse and Jones (1996).
There is a general trend toward increasing TP and DOP with increasing flow (Figure 10a &b). This suggests DOP is a significant portion of the TP during average to high flow summers. Total chlorophyll-a exhibits an inverse pattern with flow (Figure 10c). In general, Chl-T remains above 40 µg/L until flow exceeds about 8,000-9,000 cfs. Flow (residence time) is one of the primary factors that influences the efficiency of algal production as expressed by the Chl-T: TP ratio (Figure 10d). Chl-T: TP is highest at Jordan and declines at the two downstream sites.
Mississippi River Pools 1 through 8: Developing River, Pool, Minnesota Pollution Control Agency and Lake Pepin Eutrophication Criteria • October 2012
21

Figure 9. Lower Minnesota River sites summer-means comparison by year for a) TP and b) Chl-T.
a.
b.
c.
Mississippi River Pools 1 through 8: Developing River, Pool, Minnesota Pollution Control Agency and Lake Pepin Eutrophication Criteria • October 2012
22

Figure 10. Lower Minnesota River sites summer-means ranked by flow at Jordan: a) TP, b) DOP, c) Chl-T and d) Chl-T: TP.
a.
b.
c.
Mississippi River Pools 1 through 8: Developing River, Pool, Minnesota Pollution Control Agency and Lake Pepin Eutrophication Criteria • October 2012
23

d.
Lower St. Croix River sites (SC-23.3 and SC-0.3) There has been extensive monitoring of the St. Croix River and Lake St. Croix because of MCES’s long-term program as well as the TMDL study on Lake St. Croix. The upper site (SC-23.3) is within Lake St. Croix and the lower site is near the outlet to the Mississippi River.
Total phosphorus concentrations in the St. Croix are the lowest of the entire study area (Table 4). On average, TP is lower at SC-0.3 as compared to the upstream site, though the difference varies among years (Figure 11a). Dissolved ortho-phosphorus is variable among years with recent years being a somewhat lower than the earlier years (Figure 11b). Chlorophyll is higher at SC-23.3 as compared to SC-0.3, with SC-23.3 values about 50 percent higher than downstream. The reductions in TP and chlorophyll point toward sedimentation in the lake and lower reach of the river.
There is a slight increase in TP and DOP with increasing flow (Figure 12a&b). As with other sites in the study area, Chl-T declines as flow increases (Figure 12c). Chl-T: TP is variable between the two sites but it is generally higher at SC-23.3 and tends to decline as flow increases (Figure 12d).
Mississippi River Pools 1 through 8: Developing River, Pool, Minnesota Pollution Control Agency and Lake Pepin Eutrophication Criteria • October 2012
24

Figure 11. St. Croix River sites summer-means comparison by year for a) TP, b) DOP and c) Chl-T.
a.
b.
c.
Mississippi River Pools 1 through 8: Developing River, Pool, Minnesota Pollution Control Agency and Lake Pepin Eutrophication Criteria • October 2012
25

Figure 12. St. Croix River sites summer-means ranked by flow at St. Croix Falls: a) TP, b) DOP, c) Chl-T and d) Chl-T: TP.
a.
b.
c.
Mississippi River Pools 1 through 8: Developing River, Pool, Minnesota Pollution Control Agency and Lake Pepin Eutrophication Criteria • October 2012
26
d.
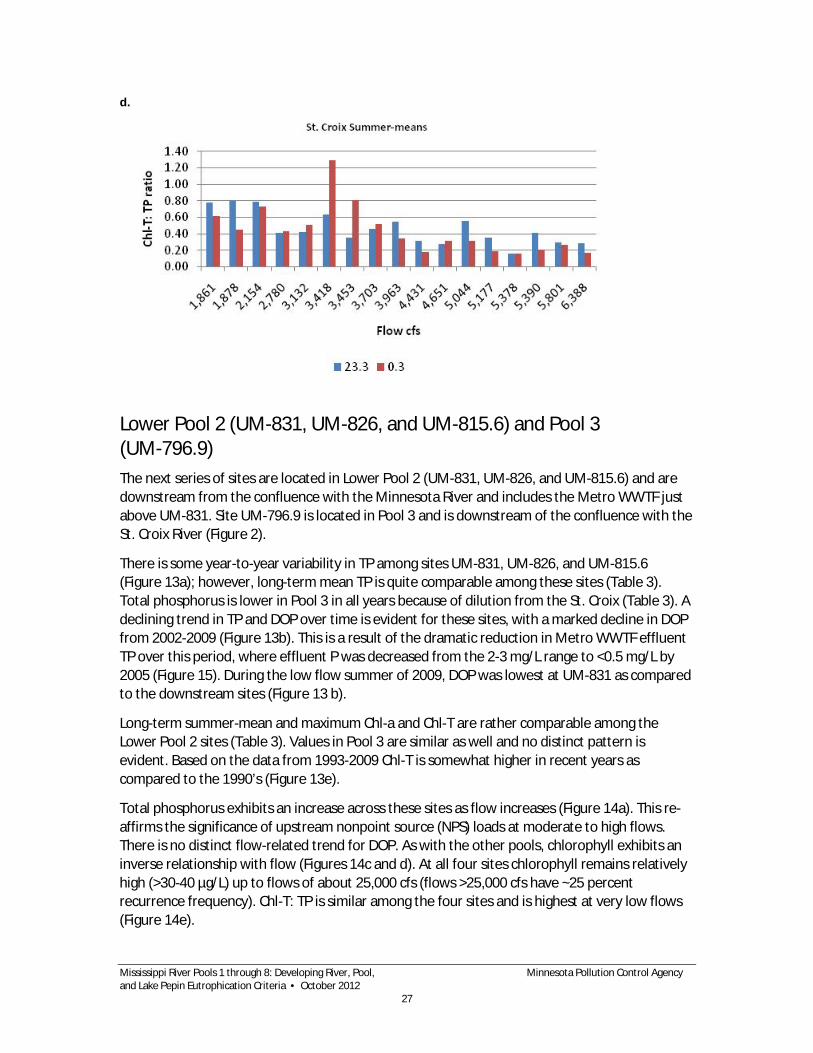
Lower Pool 2 (UM-831, UM-826, and UM-815.6) and Pool 3 (UM-796.9) The next series of sites are located in Lower Pool 2 (UM-831, UM-826, and UM-815.6) and are downstream from the confluence with the Minnesota River and includes the Metro WWTF just above UM-831. Site UM-796.9 is located in Pool 3 and is downstream of the confluence with the St. Croix River (Figure 2).
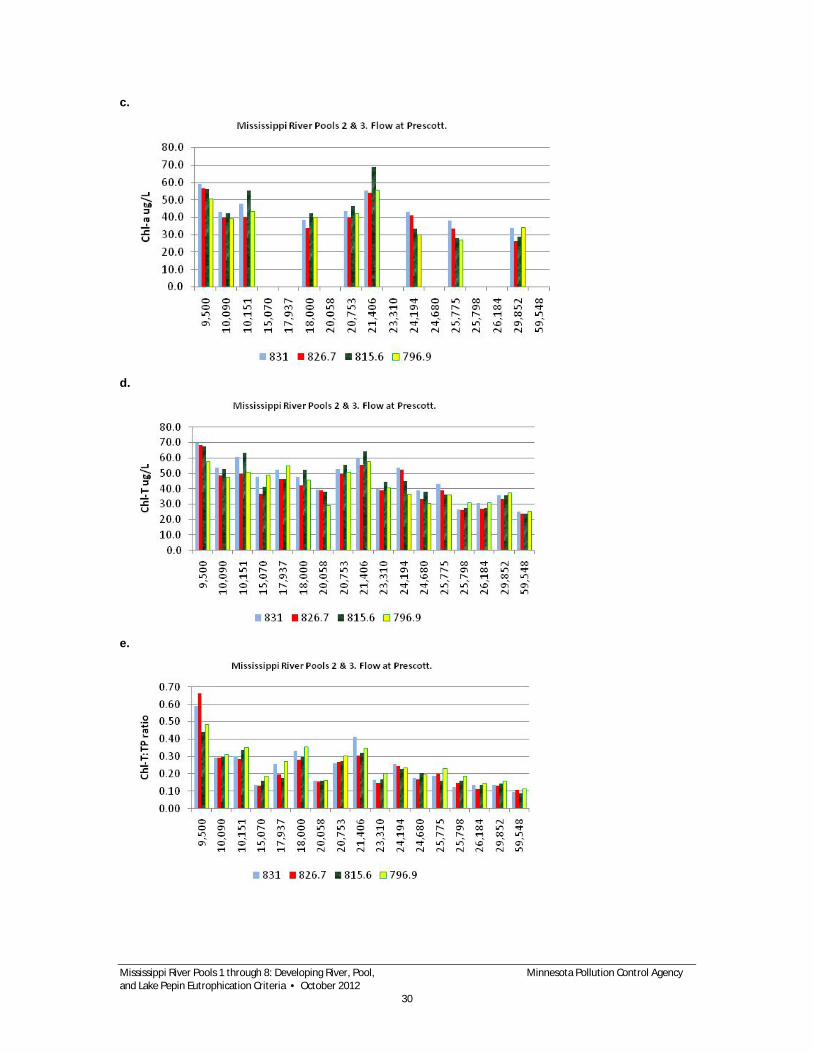
There is some year-to-year variability in TP among sites UM-831, UM-826, and UM-815.6 (Figure 13a); however, long-term mean TP is quite comparable among these sites (Table 3). Total phosphorus is lower in Pool 3 in all years because of dilution from the St. Croix (Table 3). A declining trend in TP and DOP over time is evident for these sites, with a marked decline in DOP from 2002-2009 (Figure 13b). This is a result of the dramatic reduction in Metro WWTF effluent TP over this period, where effluent P was decreased from the 2-3 mg/L range to <0.5 mg/L by 2005 (Figure 15). During the low flow summer of 2009, DOP was lowest at UM-831 as compared to the downstream sites (Figure 13 b).
Long-term summer-mean and maximum Chl-a and Chl-T are rather comparable among the Lower Pool 2 sites (Table 3). Values in Pool 3 are similar as well and no distinct pattern is evident. Based on the data from 1993-2009 Chl-T is somewhat higher in recent years as compared to the 1990’s (Figure 13e).
Total phosphorus exhibits an increase across these sites as flow increases (Figure 14a). This re-affirms the significance of upstream nonpoint source (NPS) loads at moderate to high flows. There is no distinct flow-related trend for DOP. As with the other pools, chlorophyll exhibits an inverse relationship with flow (Figures 14c and d). At all four sites chlorophyll remains relatively high (>30-40 µg/L) up to flows of about 25,000 cfs (flows >25,000 cfs have ~25 percent recurrence frequency). Chl-T: TP is similar among the four sites and is highest at very low flows (Figure 14e).
Mississippi River Pools 1 through 8: Developing River, Pool, Minnesota Pollution Control Agency and Lake Pepin Eutrophication Criteria • October 2012
27

Figure 13. Lower Pool 2 and 3 sites (UM-831, UM-826, UM-815.6 and UM-796.9) summer-means comparison by year for: a) TP b) DOP, and c) Chl-T.
a.
b.
c.
Mississippi River Pools 1 through 8: Developing River, Pool, Minnesota Pollution Control Agency and Lake Pepin Eutrophication Criteria • October 2012
28

d.
Figure 14. Lower Pool 2 (UM-831, UM-826, and UM-815.6) and Pool 3 ( UM-796.9) sites summer-means ranked by flow at Prescott: a) TP, b) DOP, c) Chl-T and d) Chl-T:TP ratio.
a.
b.
Mississippi River Pools 1 through 8: Developing River, Pool, Minnesota Pollution Control Agency and Lake Pepin Eutrophication Criteria • October 2012
29
c.
d.
e.
Mississippi River Pools 1 through 8: Developing River, Pool, Minnesota Pollution Control Agency and Lake Pepin Eutrophication Criteria • October 2012
30
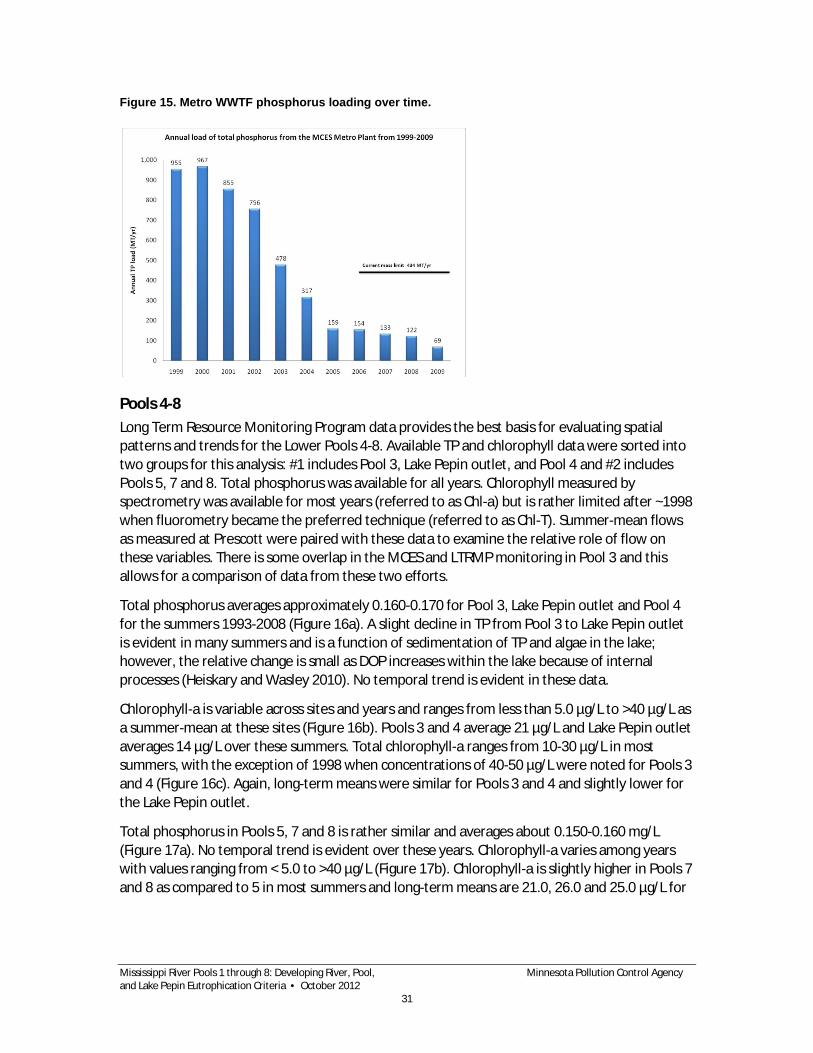
Figure 15. Metro WWTF phosphorus loading over time.
Pools 4-8 Long Term Resource Monitoring Program data provides the best basis for evaluating spatial patterns and trends for the Lower Pools 4-8. Available TP and chlorophyll data were sorted into two groups for this analysis: #1 includes Pool 3, Lake Pepin outlet, and Pool 4 and #2 includes Pools 5, 7 and 8. Total phosphorus was available for all years. Chlorophyll measured by spectrometry was available for most years (referred to as Chl-a) but is rather limited after ~1998 when fluorometry became the preferred technique (referred to as Chl-T). Summer-mean flows as measured at Prescott were paired with these data to examine the relative role of flow on these variables. There is some overlap in the MCES and LTRMP monitoring in Pool 3 and this allows for a comparison of data from these two efforts.
Total phosphorus averages approximately 0.160-0.170 for Pool 3, Lake Pepin outlet and Pool 4 for the summers 1993-2008 (Figure 16a). A slight decline in TP from Pool 3 to Lake Pepin outlet is evident in many summers and is a function of sedimentation of TP and algae in the lake; however, the relative change is small as DOP increases within the lake because of internal processes (Heiskary and Wasley 2010). No temporal trend is evident in these data.
Chlorophyll-a is variable across sites and years and ranges from less than 5.0 µg/L to >40 µg/L as a summer-mean at these sites (Figure 16b). Pools 3 and 4 average 21 µg/L and Lake Pepin outlet averages 14 µg/L over these summers. Total chlorophyll-a ranges from 10-30 µg/L in most summers, with the exception of 1998 when concentrations of 40-50 µg/L were noted for Pools 3 and 4 (Figure 16c). Again, long-term means were similar for Pools 3 and 4 and slightly lower for the Lake Pepin outlet.
Total phosphorus in Pools 5, 7 and 8 is rather similar and averages about 0.150-0.160 mg/L (Figure 17a). No temporal trend is evident over these years. Chlorophyll-a varies among years with values ranging from < 5.0 to >40 µg/L (Figure 17b). Chlorophyll-a is slightly higher in Pools 7 and 8 as compared to 5 in most summers and long-term means are 21.0, 26.0 and 25.0 µg/L for
Mississippi River Pools 1 through 8: Developing River, Pool, Minnesota Pollution Control Agency and Lake Pepin Eutrophication Criteria • October 2012
31

Pools 5, 7 and 8 respectively. Total chlorophyll-a values exhibit a similar range to Chl-a; however 1998 Chl-T was particularly high in all three pools (Figure 17c). Long-term summer-mean Chl-T is quite comparable among the three pools.
Flow and TP do not appear to be strongly related in Pools 3-8 (Figure 18a and 19a).
No consistent relationship among flow and Chl-a is evident for Pools 3-4 (Figure 18b). Pool 4 did exhibit some higher Chl-a at lower flows; however, there was not a consistent pattern over the range of flows. This was also the case for Chl-T (Figure 18c).
No distinct flow-related trends were evident for TP, Chl-a, or Chl-T for Pools 5-8, (Figure 19a, b, and c). Over the range of flow encountered, Chl-a and Chl-T was often highest in Pool 8; however there was no consistent pattern among these three pools over the range of flows for the 1993-2008 timeframe.
Figure 16. Pools 3, Lake Pepin outlet and Pool 4 summer-mean LTRMP: a) TP, b) Chl-a, and c) Chl-T.
a.
b.
.
Mississippi River Pools 1 through 8: Developing River, Pool, Minnesota Pollution Control Agency and Lake Pepin Eutrophication Criteria • October 2012
32

c.
Figure 17. Pools 5, 7 and 8 summer-mean LTRMP: a) TP, b) Chl-a and c) Chl-T.
a.
b.
Mississippi River Pools 1 through 8: Developing River, Pool, Minnesota Pollution Control Agency and Lake Pepin Eutrophication Criteria • October 2012
33
c.
Figure 18. Pools 3, Lake Pepin outlet and Pool 4 summer-mean LTRMP sorted by flow at Prescott: a) TP, b) Chl-a and c) Chl-T.
a.
b.
Mississippi River Pools 1 through 8: Developing River, Pool, Minnesota Pollution Control Agency and Lake Pepin Eutrophication Criteria • October 2012
34

c.
Figure 19. Pools 5, 7, and 8 summer-mean LTRMP sorted by flow at Prescott: a) TP, b) Chl-a, and c) Chl-T.
a.
b.
Mississippi River Pools 1 through 8: Developing River, Pool, Minnesota Pollution Control Agency and Lake Pepin Eutrophication Criteria • October 2012
35

c.
Longitudinal variation on a daily basis Chlorophyll-a samples collected in conjunction with longitudinal zebra mussel veliger surveys (John Sullivan, personal communication) provide another basis for assessing longitudinal patterns in Chl-a among the pools, changes over the summer and changes as a function of river flow (Figure 20). Water quality samples are vertically mixed and taken immediately below the dams, which is somewhat similar to LTRMP collections at the dams. Three years were selected to provide some perspective on this: 2004, 2006, and 2008. Summer 2004 with a summer-mean flow of 24,194 cfs based on Miss. at Prescott was a 72nd percentile flow (28 percent of summers of record exceed this value), while 2006 was a relatively low flow summer at 10,151 cfs (24th percentile flow; 76 percent exceed). The relative contribution from the Minnesota River differed between the two summers with about 40 percent of the flow attributable to the Minnesota in 2004 and about 35 percent in 2006. Relative to the long-term record for the Minnesota, 2004 was at the 93rd percentile (very high flow) and 2006 was at the 49th percentile (median flow).
On July 14, 2004, under high flows, Chl-a remained <40µg/L in most pools and declined in the lower pools, concurrent with higher flows (Figure 20a). By August 19, 2004, flow was markedly lower and Chl-a was in the 40-70 µg/L range in many of the pools. Flows were similarly low on September 19, 2004, and the range of Chl-a was similar to August. On July 13, 2006, flows were very low. Chlorophyll-a in Pools 3 and 4 was relatively low; however Chl-a in the lower pools was about 70-120 µg/L (Figure 20b). Chl-a concentrations were somewhat lower in August and September 2006 but generally increased in a downstream fashion. Peak Chl-a among all pools often occurred in Pool 8. On July 9, 2008, flows were relatively high as compared to July 2006 but lower than July 2004 (Figures 20a, b, and c). Chlorophyll-a Chl-a was suppressed throughout the pools in July 2008, with concentrations that were much lower than July 2004, which had much higher flow. As flow declined in August 2008 Chl-a increased; however under similar low flows in September, Chl-a was rather low in all pools (Figure 20c). Zebra mussel filtering activity may have been more important in 2008 and may help explain some of the patterns observed in 2008 (John Sullivan, personal communication).
76.3, 71.2 & 114.4
Mississippi River Pools 1 through 8: Developing River, Pool, Minnesota Pollution Control Agency and Lake Pepin Eutrophication Criteria • October 2012
36

Figure 20. Longitudinal Chl-a and corresponding flow for Pools 3-10. Data collected in during annual WDNR veliger surveys. Data sorted by pool number for three sample dates in each year.
a.
b.
c.
Longitudinal survey: Chl-a and flow for 2004
0102030405060708090
100110120130
3 4 55.5 6 7 8 9 10 3 4 55.5 6 7 8 9 10 3 4 55.5 6 7 8 9 10Pool
ug/L
0
5000
10000
15000
20000
25000
30000
35000
40000
45000
50000
cfs
Chla Flow
July 14 Aug 19 Sept. 19
Longitudinal survey: Chl-a and flow for 2006
0102030405060708090
100110120130
3 4 5 5.5 6 7 8 9 10 3 4 5 5.5 6 7 8 9 10 3 4 5 5.5 6 7 8 9 10Pool
ug/L
0
5000
10000
15000
20000
25000
30000
35000
40000
45000
50000
cfs
Chla Flow
July 13 Aug 16 Sept. 6
Longitudinal survey: Chl-a and flow for 2008
0102030405060708090
100110120130
3 4 5 5.56 7 8 9 10 3 4 5 5.56 7 8 9 10 3 4 5 5.56 7 8 9 10Pool
ug/L
0
5000
10000
15000
20000
25000
30000
35000
40000
45000
50000
cfs
Chla Flow
July 9 Aug 13 Sept. 10
Mississippi River Pools 1 through 8: Developing River, Pool, Minnesota Pollution Control Agency and Lake Pepin Eutrophication Criteria • October 2012
37

Comparability of datasets Another important factor, as data is incorporated from several different monitoring efforts and programs, is collection mode and frequency and analytical method differences. Previous split samples (conducted in conjunction with Lake Pepin TMDL) among MCES, MDH, WDNR and USACE (LTRMP) indicated a high variation in Chl-a results. Some differences can be attributed to use of spectrophotometric vs. fluorometric analysis (e.g. LTRMP employs both methods) while some may be attributed to sample collection and other factors. Before criteria and assessment methodologies for the rivers and pools can be finalized these differences must be taken into account and a defined approach on how to use the various datasets must be developed.
Datasets summarized in this report provide some insight into this issue. Figures 8a and b provide a comparison of summer-mean TP and Chl-T based on MPCA and MCES for four summers. Based on this comparison summer-mean TP from the two independent monitoring efforts yielded comparable results, when mean ± standard error of the mean was considered. Chl-T was quite comparable in two of four summers. In two summers, MCES Chl-T was greater than the MPCA summer-mean. In the case of Chl-T, there are actual laboratory differences in how it is measured. For MPCA Chl-a and pheophytin-a are measured by spectrophotometry and then summed. In this report MCES uncorrected Chl-a measured by the trichromatic method is used to represent Chl-T.
Metropolitan Council Environmental Services and LTRMP data for Pool 3 allow similar comparisons to be made (Table 5). A comparison of TP values indicates no significant difference in the long-term means between the two programs. The maximum variation was 0.079 mg/L; however on average, the difference was 0.023 mg/L or 13 percent of the measured values.
Table 5. Pool 3 Summer-mean TP (mg/L) from LTRMP and MCES monitoring programs. Absolute difference between means noted.
Year LTRMP TP MCES TP Abs diff. 1993 0.200 0.223 0.024 1994 0.188 0.203 0.014 1995 0.208 0.213 0.005 1996 0.141 0.181 0.040 1997 0.220 0.155 0.065 1998 0.192 0.203 0.011 1999 0.167 0.168 0.000 2000 0.181 0.260 0.079 2001 0.162 0.156 0.005 2002 0.219 0.233 0.015 2003 0.145 0.168 0.023 2004 0.168 0.156 0.011 2005 0.160 0.166 0.006 2006 0.134 0.144 0.010 2007 0.187 0.153 0.034 2008 0.158 0.128 0.030
Mean 0.177 0.182 0.023
SE 0.007 0.009
Mississippi River Pools 1 through 8: Developing River, Pool, Minnesota Pollution Control Agency and Lake Pepin Eutrophication Criteria • October 2012
38

A 2007 split sampling effort in Lake Pepin provides additional insight and comparisons of TP and Chl-a data from the MCES, LTRMP, and MPCA labs. Laboratory methods for each are summarized in the Appendix. There was very good agreement in TP concentrations among labs for the July sample and between the MPCA and MCES labs for the August sample (Figure 21a). Total phosphorus concentrations in the August sample, as analyzed by the LTRMP lab, were high relative to TP concentrations generated by the other two labs. In a comparison of seven samples between MCES and LTRMP (Figure 21a), mean difference was 32 µg/L, which is a 10 percent difference relative to the MCES measurements. The large difference between the LTRMP lab and the other two labs in August was unexplained; however it was noted that soluble reactive P (SRP) concentrations were very high on that date. Based upon LTRMP analyses, SRP accounted for about 70 percent of the TP as compared to about 35 percent of the TP in the July sample.
There were some distinct differences among laboratory methods for Chl-a analysis (Appendix) and these differences contribute to the differences in reported Chl-a concentrations (Figure 21b). As expected, MCES total Chl-a concentrations were consistently higher than corrected (viable) Chl-a. Long Term Resource Monitoring Program fluorometric Chl-a concentrations were consistently lower than the other two labs. The mean and percentage differences for MCES (total and viable) and MPCA viable Chl-a relative to LTRMP are as follows:
· MCES total vs. LTRMP: 21 µg/L (55 percent) and MCES viable vs. LTRMP: 14 µg/L (43 percent).
· MPCA viable vs. LTRMP: 5 µg/L (25 percent) relative to the LTRMP measurements. MPCA was typically intermediate between the MCES and LTRMP viable concentrations.
Figure 21. Comparison of MCES, LTRMP and MPCA (MDH) data a) TP and b) Chl-a. These data were collected from Lake Pepin as a part of a quality assurance comparison in 2007.
a.
Mississippi River Pools 1 through 8: Developing River, Pool, Minnesota Pollution Control Agency and Lake Pepin Eutrophication Criteria • October 2012
39

b.
Total phosphorus, chlorophyll, and biochemical oxygen demand relationships Total phosphorus and Chl-a regressions provide an empirical basis for describing relationships among nutrients and algal biomass and a basis for predicting changes in Chl-a (algal biomass) as a function of changes in TP. Numerous equations exist for lakes, including a Minnesota specific equation (Heiskary and Wilson 2008). A similar equation was developed for Minnesota rivers based on studies of a range of Minnesota rivers in 1999 and 2000 (Heiskary and Markus 2001) and a similar relationship was developed for Wisconsin rivers as well (Appendix B; John Sullivan, personal communication). The Minnesota-based equations were previously used to place the response of Lake Pepin in perspective (Figure 22a; Heiskary and Wasley 2010) and may be useful for providing some perspective for the major tributaries and Mississippi pools as well (Figure 22 b and c).
Mississippi River Pools 1 through 8: Developing River, Pool, Minnesota Pollution Control Agency and Lake Pepin Eutrophication Criteria • October 2012
40

Figure 22. TP and chlorophyll-a relationships based on Minnesota reference lakes and river nutrient (RNR) data. Comparison as follows: a) upper and lower segments of Lake Pepin; b) MCES main-stem Miss. @ Anoka, Minn. @ Jordan & St. Croix Rivers & RNR Loess-based regression; and c) all MCES river and pool data and RNR with quantile-based regression.
a.
b.
Mississippi River Pools 1 through 8: Developing River, Pool, Minnesota Pollution Control Agency and Lake Pepin Eutrophication Criteria • October 2012
41
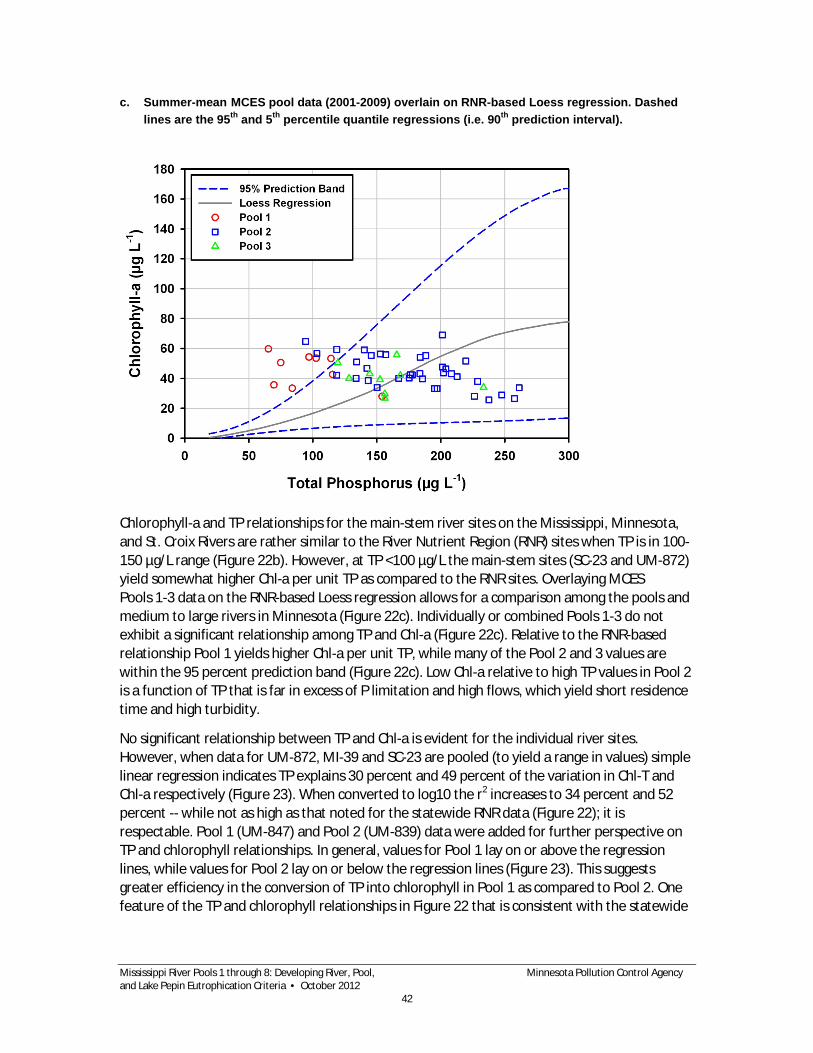
c. Summer-mean MCES pool data (2001-2009) overlain on RNR-based Loess regression. Dashed lines are the 95th and 5th percentile quantile regressions (i.e. 90th prediction interval).
Chlorophyll-a and TP relationships for the main-stem river sites on the Mississippi, Minnesota, and St. Croix Rivers are rather similar to the River Nutrient Region (RNR) sites when TP is in 100-150 µg/L range (Figure 22b). However, at TP <100 µg/L the main-stem sites (SC-23 and UM-872) yield somewhat higher Chl-a per unit TP as compared to the RNR sites. Overlaying MCES Pools 1-3 data on the RNR-based Loess regression allows for a comparison among the pools and medium to large rivers in Minnesota (Figure 22c). Individually or combined Pools 1-3 do not exhibit a significant relationship among TP and Chl-a (Figure 22c). Relative to the RNR-based relationship Pool 1 yields higher Chl-a per unit TP, while many of the Pool 2 and 3 values are within the 95 percent prediction band (Figure 22c). Low Chl-a relative to high TP values in Pool 2 is a function of TP that is far in excess of P limitation and high flows, which yield short residence time and high turbidity.
No significant relationship between TP and Chl-a is evident for the individual river sites. However, when data for UM-872, MI-39 and SC-23 are pooled (to yield a range in values) simple linear regression indicates TP explains 30 percent and 49 percent of the variation in Chl-T and Chl-a respectively (Figure 23). When converted to log10 the r2 increases to 34 percent and 52 percent -- while not as high as that noted for the statewide RNR data (Figure 22); it is respectable. Pool 1 (UM-847) and Pool 2 (UM-839) data were added for further perspective on TP and chlorophyll relationships. In general, values for Pool 1 lay on or above the regression lines, while values for Pool 2 lay on or below the regression lines (Figure 23). This suggests greater efficiency in the conversion of TP into chlorophyll in Pool 1 as compared to Pool 2. One feature of the TP and chlorophyll relationships in Figure 22 that is consistent with the statewide
Mississippi River Pools 1 through 8: Developing River, Pool, Minnesota Pollution Control Agency and Lake Pepin Eutrophication Criteria • October 2012
42

river nutrient data is the increasingly wide variation in chlorophyll as TP increases. In the statewide data this was deemed a function of a variety of factors including: lack of P limitation at high TP, influence of flow (residence time) and turbidity (Heiskary et al. 2010) and is the case at sites in the study area as well (Figure 23).
Figure 23. TP, Chl-T & Chl-a relationship for pooled data from UM-871.6, MI-39 and SC-0.3 based on summer-mean MCES data.
a.
b.
Long Term Resource Monitoring Program data for Pools 3-8 provide a basis for visualizing the TP and Chl-a relationship for the lower pools (Figure 24). In general, based on this dataset there is no strong relationship between TP and Chl-a for these pools, which is in part due to the lack of TP values <0.100 mg/L (Figure 24). Pools 5 and 7 Chl-a are in the range of the river nutrient data
Mississippi River Pools 1 through 8: Developing River, Pool, Minnesota Pollution Control Agency and Lake Pepin Eutrophication Criteria • October 2012
43

and lie both above and below the regression line. River flow (residence time) is likely an important factor in these pools. Pool 8 Chl-a exhibits a very wide range and does not correspond well with the regression equation or the river nutrient data. Pool 8 is quite large and windswept. Frequent wind mixing may have an effect upon algal production (Chl-a) and algal-nutrient dynamics in this pool. Also for Pools 5-8 interactions among main channels, side channels, backwaters and SAV (e.g. Figure 3) may also influence Chl-a production and Chl-a: TP relationships (as measured in the main channel).
It is important to further characterize the relative role of TP, flow and turbidity on the TP and chlorophyll relationships in the major rivers, Lake Pepin and pools in this overall area. Figure 25 examines Chl-T and Chl-T: TP ratio as a function of flow percentile for several sites. Flow influences Chl-T production at all sites in Figure 25; however its relative importance varies among sites. At MI-39 flow percentile explains 71 percent of the variation in Chl-T over the 1993-2009 period. Similar, but less significant, relationships are evident for the other rivers, pools and Lake Pepin. In general the efficiency in conversion of TP to Chl-T is highest at low flows and decline as flow increases, because of reduced residence time, increased turbidity and increased TP (Figure 25b).
Figure 24. TP and chlorophyll-a relationship for lower pools based on summer-mean LTRMP data. River regression as noted in Figure 22.
Mississippi River Pools 1 through 8: Developing River, Pool, Minnesota Pollution Control Agency and Lake Pepin Eutrophication Criteria • October 2012
44

Figure 25. Summer-mean Chl-T (a) and Chl-T: TP (b) as a function of flow percentile for select river and pool sites.
a.
b.
Mississippi River Pools 1 through 8: Developing River, Pool, Minnesota Pollution Control Agency and Lake Pepin Eutrophication Criteria • October 2012
45

Aquatic recreation in the main channel and sandy shorelines of these pools consists of boating, fishing, water skiing, tubing, wading, and related activities (Figure 4). As such, an emphasis on minimizing the intensity of sestonic nuisance algal blooms may be appropriate and would be consistent with the approach for site specific criteria development for Lake Pepin (Heiskary and
Wasley 2010). This emphasis is a bit different from that proposed for backwaters where sustaining SAV for waterfowl and fish propagation is emphasized, in contrast to boating and waterskiing. With respect to these uses, Sullivan (2008) emphasized reduction of metaphyton mats (attached filamentous algae; e.g. Figure 3c), which impair habitat and could potentially lead to reductions in SAV, in these shallow backwater areas. Johnson and Hagerty (2008) concur with Sullivan (2008) that high nutrient concentrations can promote elevated filamentous algae.
If minimizing nuisance blooms are an emphasis one must describe what constitutes a “nuisance” bloom. Based on previous user perception surveys in Lake Pepin and Spring Lake (Pool 2) a Chl-a of >50 µg/L has been deemed a “nuisance” bloom for these systems. Since we are unaware of similar work conducted elsewhere in Pools 1-8, 50 µg/L was used as a basis for defining “nuisance” blooms. Metropolitan Council Environmental Services and LTRMP data provide a basis for relating mean and maximum Chl-a (Figure 26). Based on these comparisons a summer-mean Chl-a of 30 µg/L or less all but ensures that Chl-a would not exceed 50 µg/L (<5 percent chance of maximum >50 µg/L based on LTRMP). In contrast, at a summer-mean of 40 µg/L the risk increases to ~10-15 percent (Figure 26). This relationship is similar to that demonstrated for Lake Pepin where a summer-mean Chl-a of 32 µg/L resulted in a <10 percent chance of exceeding a Chl-a of 50 µg/L (Heiskary and Wasley 2010).
Figure 26. Maximum Chl-a as a function of summer-mean chlorophyll-a. Based on a) MCES data for rivers and Pools1-3 and b) fixed station LTRMP data by spectrometry for Pools 3, 4, 5, 7 and 8.
a.
Mississippi River Pools 1 through 8: Developing River, Pool, Minnesota Pollution Control Agency and Lake Pepin Eutrophication Criteria • October 2012
46

b.
Another relationship used in development of the river eutrophication criteria was predicting BOD5 as a function of Chl-T. Heiskary and Markus (2001) demonstrated that BOD could be readily predicted based on Chl-T. More recent work (Heiskary et al. 2010) has advanced this concept and further demonstrated linkages among TP, Chl-T, BOD5 and fish and invertebrate indices. The river nutrient data exhibited an r2 of 0.95 for Chl-T and BOD based on the statewide data (Heiskary et al. 2010). The r2 based on the MCES data (Figure 27) is quite strong and the slope is similar as well. This indicates a strong linkage between BOD and Chl-T in the rivers and pools in the current study that is comparable to that found in other medium to large rivers across Minnesota.
Figure 27. Summer-mean BOD5 as a function of Chl-T. Based on MCES data for Minnesota, Mississippi and St. Croix River sites.
Mississippi River Pools 1 through 8: Developing River, Pool, Minnesota Pollution Control Agency and Lake Pepin Eutrophication Criteria • October 2012
47

Diurnal dissolved oxygen flux Diurnal DO flux, also referred to as diel flux, has been shown to be strongly related to summer-mean TP and Chl-T for medium to large rivers based on measurements made on 35 rivers over the course of three summers: 2000, 2006, and 2008 (Heiskary et al. 2010). Dissolved oxygen flux has been defined as the difference between the daily maximum DO minus the minimum DO as measured by a continuous monitor. In most of our previous work probes were deployed for a minimum of 3-4 days (72-96 hours) and up to 2 weeks at some sites (Heiskary et al. 2010). Daily DO flux was averaged over this period and that value was used in subsequent comparisons with TP and Chl-T.
Metropolitan Council Environmental Services employs submersible probes at several monitoring sites and has an extended record for these sites. These data provide an opportunity to examine DO flux for an extended period and for multiple years. Diurnal DO data from four sites that are addressed in this report: MI-3.5, UM-831, UM-826, and UM-815 were selected for this analysis. Data from July and August 2000, 2006, and 2008, which is consistent with the summers and months when our DO flux measures were made elsewhere in the state, were selected for this purpose. These three summers exhibit a range of flows characteristic of low to average flow summers (Table 6).
Based on our previous monitoring we recommend a minimum of 4 days (96 hours) as the deployment period for assessing DO flux for purpose of eutrophication criteria assessment (Heiskary et al. 2010). As such, we calculated 4-day rolling means for the MCES data to see how DO flux varies over an extended period and relative to changes in flow. A summary of mean, minimum and maximum DO flux, summer-mean Chl-T and summer-mean flow are summarized in Table 7.
Table 6. Monthly mean flows for June-September for Mississippi at St. Paul and Minnesota at Jordan for: 2000, 2006, and 2008.
River Loc. Summer June July August Sept. mean
Miss. St. Paul 2000 17,740 14,910 5,776 3,868 10,574
2006 16,490 5,715 3,661 3,547 7,353
2008 34,030 12,460 4,709 3,507 13,677
Minn. Jordan 2000 9,939 7,018 1,863 726 4,886
2006 8,900 2,880 1,724 918 3,605
2008 15,590 5,826 1,801 772 5,997
Mississippi River Pools 1 through 8: Developing River, Pool, Minnesota Pollution Control Agency and Lake Pepin Eutrophication Criteria • October 2012
48

Table 7. Diurnal DO flux summary for four MCES sites based on continuous measurements made during July and August: 2000, 2006 and 2008. Rolling 4-day mean, minimum, and maximum for each year. Summer-mean Chl-T noted. Summer-mean flow and flow percentile based on USGS data for Mississippi River at St. Paul and Minnesota River at Jordan.
Site Year flow %ile Chl-T DO flux
mean min mean max
MI-3.5 2000 4,886 38 63 0.4 1.4 3.6
2006 3,605 28 100 1.2 2.6 5.3
2008 5,997 52 64 0.6 1.6 2.8
UM-831 2000 10,574 24 48 0.4 1.0 1.7
2006 7,353 10 61 1.3 2.4 3.8
2008 13,677 38 48 0.7 1.7 3.5
UM-826 2000 10,574 24 37 0.4 1.2 2.3
2006 7,353 10 50 0.9 1.8 3.5
2008 13,677 38 42 0.8 1.5 3.1
UM-815 2000 10,574 24 41 0.4 2.0 5.1
2006 7,353 10 63 1.6 4.2 7.3
2008 13,677 38 52 1.3 2.9 8.2
Dissolved oxygen flux varies over the summer at all four sites (Figure 28). The range of minimum, mean and maximum measurements for these four sites is comparable to the range exhibited by 35 medium to high order streams (Heiskary et al. 2010) in 2000, 2006 and 2008. In general, DO flux increases from July through August, most likely as the combined effect of declining flow (Table 6), increased temperatures and increased algal productivity (Figure 29). While DO flux and Chl-T for these four sites does not exhibit a high correlation, as did the rivers that were previously examined (r2=0.66; Heiskary et al. 2010), there is a general trend toward increased mean and maximum DO flux as Chl-T increases (Figure 29).
The relative magnitude of the mean and maximum DO flux and Chl-T varied among sites and years as well. At each site DO flux and Chl-T was highest during the low flow summer of 2006 (Figure 30). This is consistent with a comparison that was made for the Mississippi at Anoka, Rum and Crow Rivers, where diurnal DO was measured in 2000 and 2006. DO flux and Chl-T was greater in 2006 as compared to 2000 at all three sites (Heiskary et al. 2010). In the case of the three sites on the Mississippi (Figure 30) a downstream increase in DO flux from UM-831 to UM-815 was noted.
Mississippi River Pools 1 through 8: Developing River, Pool, Minnesota Pollution Control Agency and Lake Pepin Eutrophication Criteria • October 2012
49

Figure 28. DO flux measurements (based on 4-day rolling mean) for July and August 2000 for Minnesota and Mississippi River sites. Summer-mean noted (MCES data).
Mississippi River Pools 1 through 8: Developing River, Pool, Minnesota Pollution Control Agency and Lake Pepin Eutrophication Criteria • October 2012
50

Figure 29. Summer-mean and maximum DO flux as a function of summer-mean Chl-T. Data drawn from Table 6.
Figure 30. Summer-mean DO flux and Chl-T as a function of flow-year percentile. Data drawn from Table 7 (2000, 2006, & 2008).
Mississippi River Pools 1 through 8: Developing River, Pool, Minnesota Pollution Control Agency and Lake Pepin Eutrophication Criteria • October 2012
51

Phytoplankton composition River phytoplankton often includes a variety of forms but is commonly dominated by diatoms. Rojo et al. (1994), based on a world-wide dataset for rivers, demonstrated that a typical temperate river would exhibit a balanced community with diatoms and greens as the most abundant forms. In their work they found blue-greens to be somewhat uncommon. In previous work on Minnesota rivers, diatoms and greens were found to be abundant at many river sites with blue-greens being increasingly abundant at several nutrient-rich sites (Heiskary and Markus 2003). Work in Lake Pepin has shown likewise that diatoms are commonly the most abundant algal form; however blue-greens become more abundant during periods of warm temperatures and low flows (Heiskary and Wasley 2010).
There have been periodic collections of phytoplankton throughout the study area but there is minimal synthesis of that data. These data can provide some insights into phytoplankton composition for the rivers and pools of the study area. Baker and Baker (1981), in a study on seasonal succession of phytoplankton in the Mississippi (near Prairie Island and LD3) in 1975 and 1976, noted diatoms were the most abundant form throughout much of the year and that algal biomass was much higher during the dry year (1976) as compared to the wetter year (1975). “During 1975 the diatoms remained above 60 percent of the total biomass. In 1976 the diatom decrease occurred at the same time as an increase in blue-green algae (34 percent and 44 percent of the standing crop in July and August respectively).” Data collected by Dairyland Cooperative, just below LD8 in 1974, present a somewhat similar picture showing diatom dominance throughout three seasons (Figure 31) and an increase in blue-greens in late summer.
Mississippi River Pools 1 through 8: Developing River, Pool, Minnesota Pollution Control Agency and Lake Pepin Eutrophication Criteria • October 2012
52
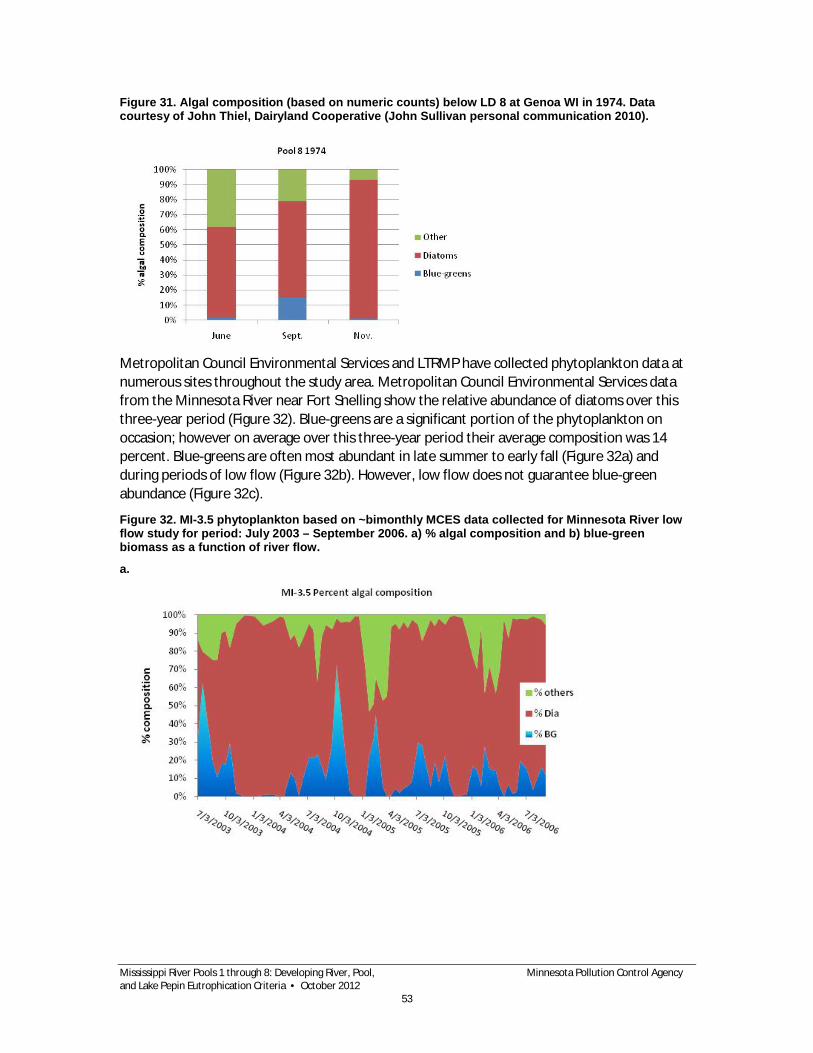
Figure 31. Algal composition (based on numeric counts) below LD 8 at Genoa WI in 1974. Data courtesy of John Thiel, Dairyland Cooperative (John Sullivan personal communication 2010).
Metropolitan Council Environmental Services and LTRMP have collected phytoplankton data at numerous sites throughout the study area. Metropolitan Council Environmental Services data from the Minnesota River near Fort Snelling show the relative abundance of diatoms over this three-year period (Figure 32). Blue-greens are a significant portion of the phytoplankton on occasion; however on average over this three-year period their average composition was 14 percent. Blue-greens are often most abundant in late summer to early fall (Figure 32a) and during periods of low flow (Figure 32b). However, low flow does not guarantee blue-green abundance (Figure 32c).
Figure 32. MI-3.5 phytoplankton based on ~bimonthly MCES data collected for Minnesota River low flow study for period: July 2003 – September 2006. a) % algal composition and b) blue-green biomass as a function of river flow.
a.
Mississippi River Pools 1 through 8: Developing River, Pool, Minnesota Pollution Control Agency and Lake Pepin Eutrophication Criteria • October 2012
53
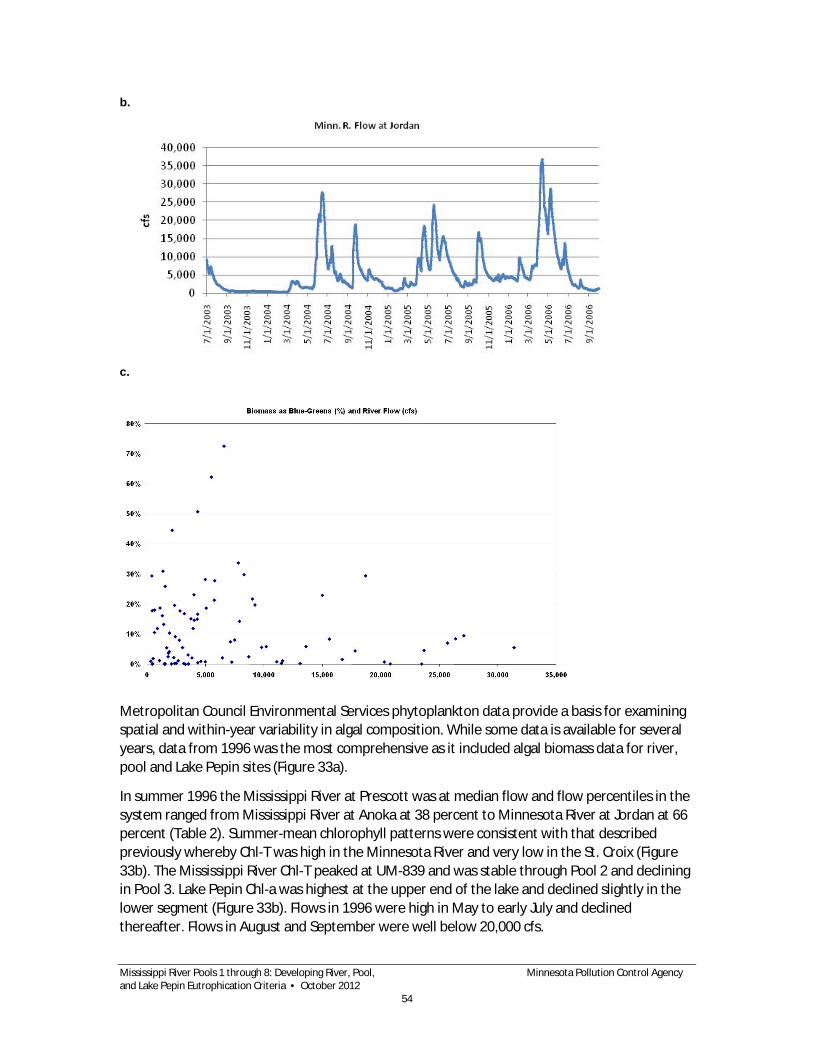
b.
c.
Metropolitan Council Environmental Services phytoplankton data provide a basis for examining spatial and within-year variability in algal composition. While some data is available for several years, data from 1996 was the most comprehensive as it included algal biomass data for river, pool and Lake Pepin sites (Figure 33a).
In summer 1996 the Mississippi River at Prescott was at median flow and flow percentiles in the system ranged from Mississippi River at Anoka at 38 percent to Minnesota River at Jordan at 66 percent (Table 2). Summer-mean chlorophyll patterns were consistent with that described previously whereby Chl-T was high in the Minnesota River and very low in the St. Croix (Figure 33b). The Mississippi River Chl-T peaked at UM-839 and was stable through Pool 2 and declining in Pool 3. Lake Pepin Chl-a was highest at the upper end of the lake and declined slightly in the lower segment (Figure 33b). Flows in 1996 were high in May to early July and declined thereafter. Flows in August and September were well below 20,000 cfs.
Mississippi River Pools 1 through 8: Developing River, Pool, Minnesota Pollution Control Agency and Lake Pepin Eutrophication Criteria • October 2012
54
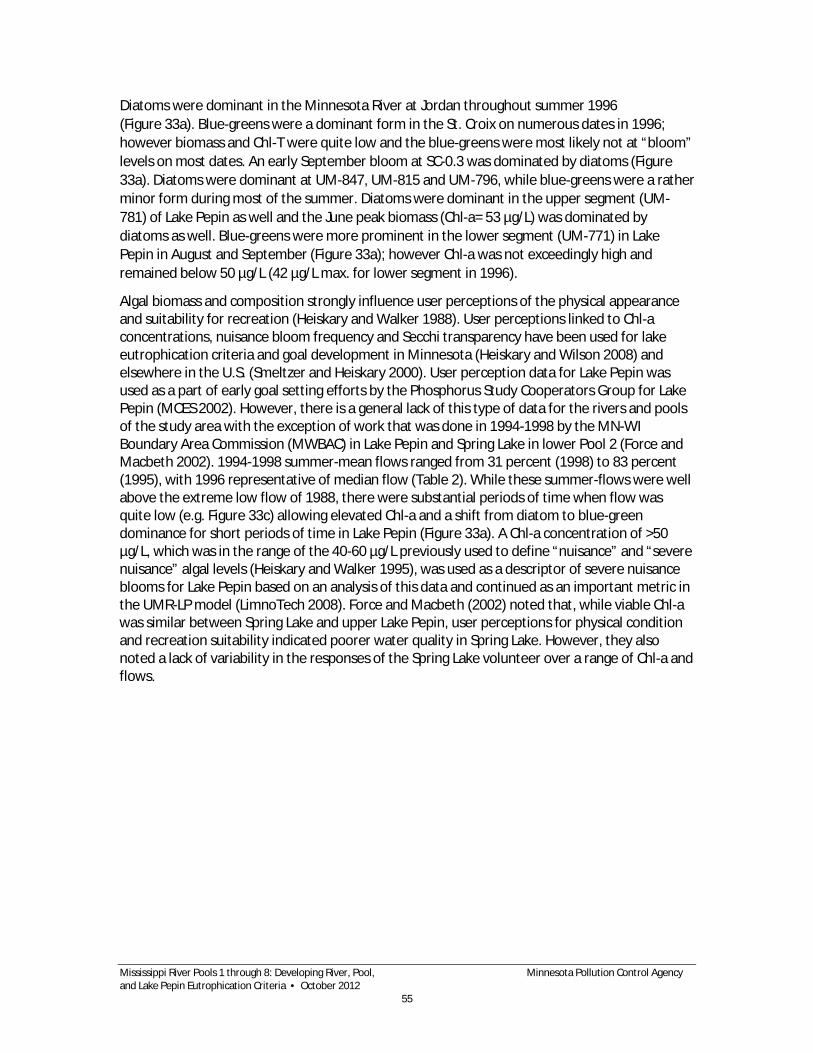
Diatoms were dominant in the Minnesota River at Jordan throughout summer 1996 (Figure 33a). Blue-greens were a dominant form in the St. Croix on numerous dates in 1996; however biomass and Chl-T were quite low and the blue-greens were most likely not at “bloom” levels on most dates. An early September bloom at SC-0.3 was dominated by diatoms (Figure 33a). Diatoms were dominant at UM-847, UM-815 and UM-796, while blue-greens were a rather minor form during most of the summer. Diatoms were dominant in the upper segment (UM-781) of Lake Pepin as well and the June peak biomass (Chl-a= 53 µg/L) was dominated by diatoms as well. Blue-greens were more prominent in the lower segment (UM-771) in Lake Pepin in August and September (Figure 33a); however Chl-a was not exceedingly high and remained below 50 µg/L (42 µg/L max. for lower segment in 1996).
Algal biomass and composition strongly influence user perceptions of the physical appearance and suitability for recreation (Heiskary and Walker 1988). User perceptions linked to Chl-a concentrations, nuisance bloom frequency and Secchi transparency have been used for lake eutrophication criteria and goal development in Minnesota (Heiskary and Wilson 2008) and elsewhere in the U.S. (Smeltzer and Heiskary 2000). User perception data for Lake Pepin was used as a part of early goal setting efforts by the Phosphorus Study Cooperators Group for Lake Pepin (MCES 2002). However, there is a general lack of this type of data for the rivers and pools of the study area with the exception of work that was done in 1994-1998 by the MN-WI Boundary Area Commission (MWBAC) in Lake Pepin and Spring Lake in lower Pool 2 (Force and Macbeth 2002). 1994-1998 summer-mean flows ranged from 31 percent (1998) to 83 percent (1995), with 1996 representative of median flow (Table 2). While these summer-flows were well above the extreme low flow of 1988, there were substantial periods of time when flow was quite low (e.g. Figure 33c) allowing elevated Chl-a and a shift from diatom to blue-green dominance for short periods of time in Lake Pepin (Figure 33a). A Chl-a concentration of >50 µg/L, which was in the range of the 40-60 µg/L previously used to define “nuisance” and “severe nuisance” algal levels (Heiskary and Walker 1995), was used as a descriptor of severe nuisance blooms for Lake Pepin based on an analysis of this data and continued as an important metric in the UMR-LP model (LimnoTech 2008). Force and Macbeth (2002) noted that, while viable Chl-a was similar between Spring Lake and upper Lake Pepin, user perceptions for physical condition and recreation suitability indicated poorer water quality in Spring Lake. However, they also noted a lack of variability in the responses of the Spring Lake volunteer over a range of Chl-a and flows.
Mississippi River Pools 1 through 8: Developing River, Pool, Minnesota Pollution Control Agency and Lake Pepin Eutrophication Criteria • October 2012
55

Figure 33. Algal composition, biomass, and chlorophyll for rivers and pools in study area for 1996: a. Algal composition and biomass as supplied by MCES; b. summer-mean chlorophyll (Chl-T; MCES data for river and pool sites and Chl-a; LTRMP data for Lake Pepin); and c. flow at Prescott based on USGS data.
a.
Mississippi River Pools 1 through 8: Developing River, Pool, Minnesota Pollution Control Agency and Lake Pepin Eutrophication Criteria • October 2012
56

Mississippi River Pools 1 through 8: Developing River, Pool, Minnesota Pollution Control Agency and Lake Pepin Eutrophication Criteria • October 2012
57

b.
c.
Total phosphorus and dissolved ortho-phosphorus relationships Seasonal and spatial patterns in TP and DOP can provide insight into the extent and timing of P limitation across the various sites in this system. The relationship between these two variables can provide an indication of the TP that might be necessary to allow for P limitation. Recent MCES data (2004-2009) representative of average to low flow summers (Table 2) were used for these purposes. P limitation, for purposes of this discussion, is defined as DOP at or below the detection limit (0.005 mg/L) and concentrations of <0.010 mg/L are defined as “approaching” P limitation.
Mississippi River Pools 1 through 8: Developing River, Pool, Minnesota Pollution Control Agency and Lake Pepin Eutrophication Criteria • October 2012
58
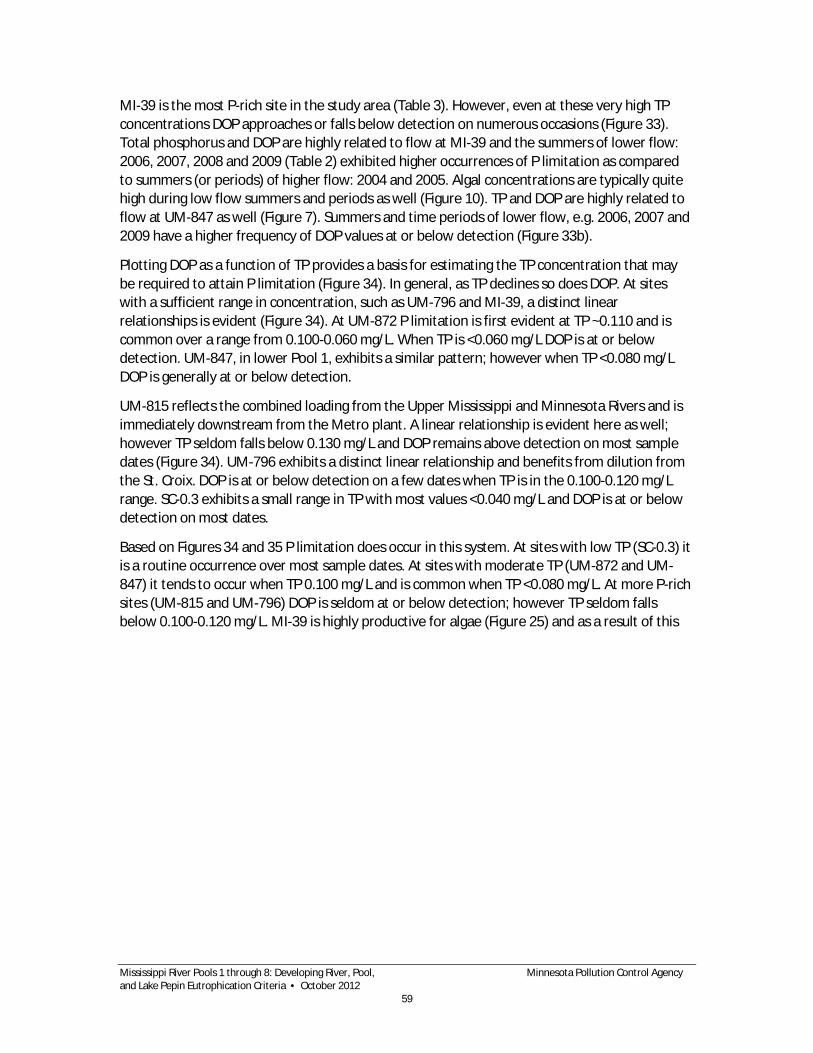
MI-39 is the most P-rich site in the study area (Table 3). However, even at these very high TP concentrations DOP approaches or falls below detection on numerous occasions (Figure 33). Total phosphorus and DOP are highly related to flow at MI-39 and the summers of lower flow: 2006, 2007, 2008 and 2009 (Table 2) exhibited higher occurrences of P limitation as compared to summers (or periods) of higher flow: 2004 and 2005. Algal concentrations are typically quite high during low flow summers and periods as well (Figure 10). TP and DOP are highly related to flow at UM-847 as well (Figure 7). Summers and time periods of lower flow, e.g. 2006, 2007 and 2009 have a higher frequency of DOP values at or below detection (Figure 33b).
Plotting DOP as a function of TP provides a basis for estimating the TP concentration that may be required to attain P limitation (Figure 34). In general, as TP declines so does DOP. At sites with a sufficient range in concentration, such as UM-796 and MI-39, a distinct linear relationships is evident (Figure 34). At UM-872 P limitation is first evident at TP ~0.110 and is common over a range from 0.100-0.060 mg/L. When TP is <0.060 mg/L DOP is at or below detection. UM-847, in lower Pool 1, exhibits a similar pattern; however when TP <0.080 mg/L DOP is generally at or below detection.
UM-815 reflects the combined loading from the Upper Mississippi and Minnesota Rivers and is immediately downstream from the Metro plant. A linear relationship is evident here as well; however TP seldom falls below 0.130 mg/L and DOP remains above detection on most sample dates (Figure 34). UM-796 exhibits a distinct linear relationship and benefits from dilution from the St. Croix. DOP is at or below detection on a few dates when TP is in the 0.100-0.120 mg/L range. SC-0.3 exhibits a small range in TP with most values <0.040 mg/L and DOP is at or below detection on most dates.
Based on Figures 34 and 35 P limitation does occur in this system. At sites with low TP (SC-0.3) it is a routine occurrence over most sample dates. At sites with moderate TP (UM-872 and UM-847) it tends to occur when TP 0.100 mg/L and is common when TP <0.080 mg/L. At more P-rich sites (UM-815 and UM-796) DOP is seldom at or below detection; however TP seldom falls below 0.100-0.120 mg/L. MI-39 is highly productive for algae (Figure 25) and as a result of this
Mississippi River Pools 1 through 8: Developing River, Pool, Minnesota Pollution Control Agency and Lake Pepin Eutrophication Criteria • October 2012
59

Figure 34. TP and OP as a function of time for period 2004-2009 for sites MI-39 and UM-847 based on MCES data.
a.
b.
Mississippi River Pools 1 through 8: Developing River, Pool, Minnesota Pollution Control Agency and Lake Pepin Eutrophication Criteria • October 2012
60

Figure 35. DOP as a function of TP for sites: UM-872, UM-847, UM-815, UM-796, SC-0.3, & MI-39. Based on MCES data from 2004-2009.
Mississippi River Pools 1 through 8: Developing River, Pool, Minnesota Pollution Control Agency and Lake Pepin Eutrophication Criteria • October 2012
61

Chlorophyll-a mass balance While we do not normally think about algal biomass (as estimated by Chl-a) as being “conservative” there is strong evidence that this may be the case across several reaches (sites) in this system (Figures 7-14) and this has direct application to criteria development. Two approaches were used to examine this further. The first employed MCES Chl-a data for the period 2001-2009 and the second employed model runs from the LTI UMR-LP model.
Summer-mean Chl-a at UM-839 can be reliably estimated based on flow-weighted means for UM-847 and MI-3.5 (Figure 36a). Combined flows from Mississippi at Anoka and Minnesota River at Jordan account for 97 percent of the flow measured at St. Paul on average for this period. The mean difference among predicted and observed was 4.8 µg/L or 10 percent of the observed mean. Based on means (±SE) the predicted Chl-a (45.6±4.2 µg/L) and observed (48.5±3.9 µg/L) were not significantly different.
A simple comparison of summer-means for UM-839 and UM-815 indicates the average difference was 6.6 µg/L or 15 percent of the UM-815 mean. There was no consistent pattern between these two sites, e.g. in five summers UM-839 Chl-a exceeded UM-815 Chl-a. Over this nine-year record the respective means, 48.5 (±3.9) and 44.7 (±4.6) µg/L, for UM-839 and UM-815 were not significantly different.
These mass-balances help demonstrate the interrelationships among and within these rivers and pools and the somewhat conservative nature of Chl-a in this system. In turn this argues for upstream reductions in order to realize downstream reductions in Pool 3, Lake Pepin and Pools 5-8.
Figure 36. Observed and predicted summer-mean Chl-a based on comparisons for select sites in the study area. Flow weighting used when two sites are combined to yield a predicted value.
a. b.
The UMR-LP model provides a model-based total suspended solids (algal) mass balance for Pool 2. Scenario 2, which approximates current condition for the period, was used as a basis for constructing mass balances for the 1985-2006 period and summer 2006 (Figure 37). In the 10-year summer budget for algal suspended solids, Upper Mississippi (Pool 1) has a higher mass of algal suspended solids than the Minnesota River. In the summer 2006 simulation, some algal suspended solids are lost to sedimentation, but the majority is sent downstream. Both scenarios point to the significance of upstream sources: Upper Mississippi and Minnesota Rivers and the relative conservation of mass as we move downstream.
Mississippi River Pools 1 through 8: Developing River, Pool, Minnesota Pollution Control Agency and Lake Pepin Eutrophication Criteria • October 2012
62

Figure 37. Suspended solids balances based on UMR-LP model. Based on scenario 2 for period: 1985-2006 and summer 2006
Load In: 576,348 kg/d
- Algal: 86,265- Zoo: 5,529- POC: 77,118- TIS: 407,436
UMR (Lock & Dam #1)
Load Out: 3,198,721 kg/d
- Algal: 135,314- Zoo: 9,956- POC: 309,648- TIS: 2,743,803
Lock & Dam #2
Tributary Loads: 2,883,536 kg/d- Algal: 65,304- Zoo: 4,676- POC: 261,760- TIS: 2,551,797
Minnesota River WWTP Loads: 4,890 kg/d- POC: 2,386- TIS: 2,504
MetroEagles PointEmpireUrban/suburban
Deposition: 674,806 kg/d- Algal: 12,797- POC: 62,294- TIS: 599,714
Resuspension: 387,465 kg/d- POC: 26,221- TIS: 361,245
Diffusion: 0 kg/d
Mass Rate: -3,288 kg/d- Algal: 159- Zoo: -21- POC: -394- TIS: -3,032
Kinetic Rate: 21,288 kg/d- Algal: -3,457- Zoo: -249- POC: 4,457- TIS: 20,536
Trapping Efficiency: 8.3%Net Burial Rate: 0.46 cm/yr
02: Historical Trib Loads, WWTP perm
Select Scenario: Select Variable:
Select Zone:
Total Susp. Solids
Pool 2
Select Year(s): 1985 2006
Select Month(s): Jun Sep
Load In: 167,131 kg/d
- Algal: 52,354- Zoo: 2,122- POC: 20,066- TIS: 92,588
UMR (Lock & Dam #1)
Load Out: 1,019,071 kg/d
- Algal: 100,283- Zoo: 4,968- POC: 105,991- TIS: 807,830
Lock & Dam #2
Tributary Loads: 1,257,883 kg/d- Algal: 65,400- Zoo: 2,291- POC: 129,048- TIS: 1,061,143
Minnesota River WWTP Loads: 4,890 kg/d- POC: 2,386- TIS: 2,504
MetroEagles PointEmpireUrban/suburban
Deposition: 663,150 kg/d- Algal: 27,336- POC: 64,926- TIS: 570,887
Resuspension: 223,196 kg/d- POC: 15,852- TIS: 207,344
Diffusion: 0 kg/d
Mass Rate: -2,650 kg/d- Algal: 420- Zoo: -20- POC: -70- TIS: -2,980
Kinetic Rate: 29,122 kg/d- Algal: 9,864- Zoo: 555- POC: 3,565- TIS: 15,137
Trapping Efficiency: 30.8%Net Burial Rate: 0.70 cm/yr
02: Historical Trib Loads, WWTP perm
Select Scenario: Select Variable:
Select Zone:
Total Susp. Solids
Pool 2
Select Year(s): 2006 2006
Select Month(s): Jun Sep
Mississippi River Pools 1 through 8: Developing River, Pool, Minnesota Pollution Control Agency and Lake Pepin Eutrophication Criteria • October 2012
63

Summary and Criteria Recommendations Mississippi River navigation pools 1-8 represent a unique waterbody with a blend of characteristics found in free flowing rivers, navigational canals, shallow lakes and shallow reservoirs. The previous analysis employs readily available data from LTRMP, MCES and WDNR monitoring on Pools 1-8 for the purpose of trying to define pool-specific nutrient criteria. These data demonstrate the range of TP, Chl-a and interrelationships of these variables for the main-stem rivers and Pools 1-8. Mean TP in these pools ranges from ~0.099 mg/L (Pool 1) to 0.223 (Pool 2) and mean Chl-a ranges from 14 µg/L (outlet of Lake Pepin) to 37 µg/L (Pool 2) (Table 3).
Flow, water residence time and non-algal turbidity have a strong influence on Chl-a production in medium to large rivers (Heiskary and Markus 2001) and are significant in Lake Pepin as well (Heiskary and Wasley 2010). The Mississippi River pools are no different in this regard. Soballe et al. (2002) note in their examination of LTRMP data from 1993-1996 “…chlorophyll-a concentrations were highest in summers of 1994-95, when river stage was near the seasonal norm. Slower water velocities and longer retention times may have increased phytoplankton productivity during that period of time.” Johnson and Hagerty (2008) further reinforce these concepts noting “Chl-a concentration in large rivers are generally determined by light availability (largely determined by TSS), nutrient availability, and current velocity.” Light availability is tied directly to depth, which is highly managed in this system to maintain navigation. They go on to state the difficulty in predicting Chl-a because the relations among these factors are not well understood. In addition, we cannot dismiss the potential impact from zebra mussels and Asian carp in the future (Johnson and Hagerty 2008).
Summer-mean TP and Chl-a data from the rivers and pools were compared to the standard lake and river nutrient regressions (Figures 22-24). Pool 1, with low amounts of non-algal turbidity exhibits somewhat higher Chl-a per unit TP as compared to the river nutrient regression and is in the range of the lake regression (Figure 23). Pool 2, with higher non-algal turbidity is slightly lower. Lake Pepin, as previously demonstrated (Heiskary and Wasley 2010), also yields lower Chl-a per unit TP as compared to the lake and river regressions (Figure 22). The response in other pools is rather variable and is likely driven more by residence time, mixing depth, light limitation, interactions with contiguous backwaters, zooplankton grazing (Burdis et al. 2007), and SAV (e.g. Pool 8, Figures 24).
Longitudinal surveys indicate that Chl-a varies among sites, over time and is strongly influenced by flow (Figure 20). In general, Chl-a is higher during low flow periods as compared to high flow. During a low flow summer (e.g. 2006) extremely elevated Chl-a may be observed over much of the summer (Figure 20b). In summers with variable flow (e.g. 2008, Figure 20c) Chl-a may vary dramatically over the summer with flow, residence time and turbidity as major drivers. Increasingly, zebra mussel filtering may be quite important as well (Sullivan personal communication 2009).
The influence of flow and factors related to flow, e.g. turbidity, on TP and Chl-a relationships is summarized in Figure 38 based on summer-mean data for SC-23, UM-872 and MI-39 expressed as a function of flow percentile. The strength of the relationship (r2) and slope varies as a function of flow percentile – with flow percentiles of 0-50 percent exhibiting higher r2 as
Mississippi River Pools 1 through 8: Developing River, Pool, Minnesota Pollution Control Agency and Lake Pepin Eutrophication Criteria • October 2012
64

compared to higher flow percentiles. Figure 38 also demonstrates that low nutrient rivers (SC-23) exhibit a relatively small range of Chl-a as compared to a very high nutrient site (MI-39). A river with intermediate TP (UM-872) is in between these two extremes. Flow of any given tributary contributing flow to Pools 1-8 varies annually and thus Chl-a and TP loads vary. This further adds to the complexity of Chl-a production in all of the pools. The patterns described in these three large tributaries represent patterns in the highly diverse watersheds of each pool.
We see from Figure 38 that flow is the most important factor limiting algal production for each individual river. Lower flow conditions result in reduced velocity, depth and TSS, all of which limit algal production during higher flows. Total phosphorus does not appear to be limiting at any individual river until the lowest flow percentiles when DOP starts to approach 0.01 mg/L (0.005 – 0.010 mg/L detection limit for the MCES) (Figure 39). The St. Croix River has low levels of DOP during most years. In summary, it seems that TP reductions during the low to moderate flow years (0.0-0.25 percentile) will have the most impact on algal levels in these rivers and downstream pools.
Figure 38. SC-23, UM-872 and MI-39 TP and Chl-a relationships expressed as a function of river flow percentile. Based on MCES summer-mean data and flow percentiles for period from 1993-2009.
Mississippi River Pools 1 through 8: Developing River, Pool, Minnesota Pollution Control Agency and Lake Pepin Eutrophication Criteria • October 2012
65

Figure 39. SC-23, UM-872, and MI-39 DOP as a function of flow percentile. Based on MCES summer-mean data and flow percentiles for period from 1993-2009.Detection limit is 0.010 mg/L.
There is a very significant relationship between mean and maximum Chl-a based on MCES and LTRMP data (Figure 26). A Chl-a concentration of >50 µg/L has previously been used to characterize “nuisance blooms” for Lake Pepin and Spring Lake (Heiskary and Wasley 2010). This presumes blue-green algae are the dominant form contributing to the “bloom.” Based on data from Pools 1-8 the risk of encountering nuisance blooms can be minimized if summer-mean Chl-a remains <30-35 µg/L (Figure 26).
Pool 1 exhibits the highest Chl-a: TP response of any of the pools and is most similar to the main-stem rivers in its response (Figure 23). The other pools, including Lake Pepin, are generally much less responsive (Figure 25) than the main-stem rivers. In all instances Chl-a: TP varies as a function of river flow and the Minnesota River at Jordan exhibits the highest Chl-a and highest Chl-a: TP of any of the rivers and pools in this system (Figure 25).
The lower pools (5-8) do not exhibit a strong relationship between TP and Chl-a, in part because summer-mean TP remains above 0.100 mg/L (Figure 24). In general, Chl-a is quite variable in Pools 5, 7 and 8 and about 2/3rds are <30 µg/L (Figure 24). Summer-mean Chl-a is <30 µg/L based on recent data. Given the lower Chl-a in these pools and lack of a relationships among TP and Chl-a it seems appropriate to focus attention (nutrient reduction) on the main-stem rivers and upper pools, which exhibit much stronger relationships and where a majority of the excess algal biomass is produced. Ideally, criteria that result in reductions of Chl-a and are protective of aquatic recreational uses in the main-stems and the upper pool(s) of this system will be protective of Lake Pepin and the downstream pools. The LTI model projections serve to support this approach and indicate that if TP criteria are met in Lake Pepin the outlet TP and Chl-a should be sufficiently low to ensure that downstream pool 5-8 criteria are met (Table 8b).
Mississippi River Pools 1 through 8: Developing River, Pool, Minnesota Pollution Control Agency and Lake Pepin Eutrophication Criteria • October 2012
66
River flow is a major driver in this system (Figures 7, 10, 12, 14, 18, 25, 38, and 39) and Chl-a criteria protective at low-average flow will be protective at high flow as well. There have been various approaches proposed that suggest specific flow ranges should be targeted for criteria setting and assessment. However, our typical approach to 303(d) assessment has been to ensure that adequate data (minimum number of observations) is collected, data is summarized the most recent 10 years and then compared to the applicable water quality standards (e.g. lake eutrophication, dissolved oxygen standards, etc.). Since we cannot control flow in this system and the rivers, pools, and Lake Pepin are used for aquatic recreation and must support aquatic life every year, it is appropriate to establish criteria that are generally protective of the overall system and yield acceptable water quality over a range of flows (e.g. Table 8b). With this in mind, we will revisit the range of information available for helping to establish eutrophication criteria for the rivers, pools, and lake that comprise this system.
Lake Pepin has long been a focal point for assessing eutrophication impacts, establishing goals and most recently developing a TMDL. Recent Chl-a data for Lake Pepin are in the range of the various draft Chl-a criteria (goals) that have been put forth at various points in the assessment of Lake Pepin (Table 9). The criteria (goals) have varied as new information was made available or as our understanding of Lake Pepin improved. Total phosphorus has declined from the original value that resulted in the listing of the lake and the 2009 data was below the recent 10-year mean. This is a direct result of reductions in the Metro WWTF P loading (Figure 15) and other facilities in and tributary to the overall system.
Mississippi River Pools 1 through 8: Developing River, Pool, Minnesota Pollution Control Agency and Lake Pepin Eutrophication Criteria • October 2012
67

Table 8. LTI UMR-LP model runs for: a) average to low flow summers used in model development and testing: 1987, 1990, 1992, 1998, 2000 and 2006 and b) all years: 1985-2006. All results are modeled, see footnotes for scenario details. Model details available in LTI (2008).
a. Average to low flow years
b. All years
Scen 02, Historical tributary loads, Direct point sources at permitted (AWWDF x 1.0 mg/L); Scen 04, Direct point sources at permitted (AWWDF x 1.0 mg/L), Cannon and Minnesota 50% reduction for TP,TSS and Chl-a, St. Croix and Upper Miss 20% reduction for TP,TSS and chlorophyll-a; Scen 17, Direct point sources at reduced (AWWDF x 0.3 mg/L), Nonpoint same as 04; Scen 20, Same as 04 but MN River response based on HSPF model for Lower MN (see Larson 2010 for HSPF details) Scen 21, Same as 17 but MN River response based on HSPF model for Lower MN
Total phosphorus
Scen. St. Croix Minn LD1 LD2 LD3upper
LPlower
LPoverall
LPoutlet
LP2 0.036 0.293 0.118 0.227 0.175 0.161 0.160 0.160 0.1674 0.029 0.145 0.095 0.173 0.133 0.120 0.113 0.116 0.11417 0.029 0.145 0.095 0.127 0.102 0.095 0.093 0.094 0.09620 0.029 0.147 0.094 0.163 0.127 0.117 0.115 0.116 0.12021 0.029 0.140 0.094 0.124 0.100 0.096 0.098 0.097 0.103Chlorophyll-a (mean)
Scen. St. Croix Minn LD1 LD2 LD3upper
LPlower
LPoverall
LPoutlet
LP2 15 64 51 44 35 39 28 33 204 12 32 41 38 32 37 28 32 2117 12 32 41 36 30 33 25 29 1920 12 48 41 41 34 40 30 34 2221 12 48 41 39 32 36 28 31 21
Chl-a Days > 50
Scen. St. Croix Minn LD1 LD2 LD3upper
LPlower
LPoverall
LPoutlet
LP2 1 64 54 41 13 28 5 10 04 0 21 30 31 12 27 3 8 017 0 21 30 26 4 9 0 0 020 0 43 30 25 7 22 4 7 021 0 43 30 20 7 9 1 2 0
Total phosphorus
Scen. St. Croix Minn LD1 LD2 LD3upper
LPlower
LPoverall
LPoutlet
LP2 0.045 0.285 0.110 0.215 0.170 0.158 0.152 0.154 0.1554 0.036 0.141 0.088 0.161 0.126 0.116 0.110 0.112 0.11017 0.036 0.141 0.088 0.122 0.100 0.095 0.092 0.093 0.09320 0.036 0.148 0.088 0.152 0.121 0.113 0.109 0.111 0.11121 0.036 0.139 0.088 0.120 0.099 0.095 0.093 0.094 0.096
Chlorophyll-a
Scen. St. Croix Minn LD1 LD2 LD3upper
LPlower
LPoverall
LPoutlet
LP
2 13 45 38 34 27 31 23 26 174 11 22 31 29 25 29 22 25 1717 11 22 31 28 23 26 20 23 1620 11 40 31 35 29 33 25 28 1921 11 40 31 34 27 30 24 26 18
Days > Chl-a 50
Scen. St. Croix Minn LD1 LD2 LD3upper
LPlower
LPoverall
LPoutlet
LP2 2 38 29 19 6 16 2 4 0
4 0 8 14 16 5 17 1 3 017 0 8 14 13 2 7 0 0 020 0 35 14 18 5 14 2 3 021 0 35 14 14 4 9 1 1 0
Mississippi River Pools 1 through 8: Developing River, Pool, Minnesota Pollution Control Agency and Lake Pepin Eutrophication Criteria • October 2012
68

To achieve reductions in TP and Chl-a in Lake Pepin and be protective of lower pools 5-8, reductions must be made at the major inflows to this system. LTI UMR-LP model runs for all years (Table 8b) places potential reductions in perspective. As noted previously, through efforts by the Phosphorus Cooperators Group and as a part of the Lake Pepin TMDL, a primary focus for protecting aquatic recreational use in Lake Pepin has been to minimize the frequency of nuisance blooms. Over the history of working on this issue nuisance blooms have been defined in terms of various levels of Chl-a ranging from >40 µg/L to >60 µg/L (Heiskary and Walker 1995 and MCES 2002). In more recent work on the Lake Pepin TMDL, a level of >50 µg/L was adopted as a level for defining nuisance blooms and used as a metric in the UMR-LP model (LTI 2008). Previously proposed in-lake goals to achieve this are ~100 µg/L TP and ~30 µg/L Chl-a (expressed as summer-means; Table 9). Based on the UMR-LP model: scenarios 4 and 17 for Mississippi (UM-847) and St. Croix (SC-0.3) and scenarios 20 and 21 for the Minnesota (MI-3.5) (Table 8) inflows to the system need be on the order of TP ~90-100 µg/L and Chl-a ~20-30 µg/L for the Mississippi, TP ~30 µg/L and Chl-a ~12 St. Croix, and TP ~140-150 µg/L and Chl-a ~30-40 µg/L for the Minnesota.
Table 9. Lake Pepin 303(d) listing, current and historical values and draft criteria ranges
TP µg/L 198 171 152 80-120 ~110-140
Chl-a µg/L 25 30 32 28-32 1. 1991-2000 2. 2000-2009 3. Represents draft values discussed or proposed at various points in overall process. 4. Estimate #1 (Engstrom and Almendinger 2000) For further perspective, the state of Wisconsin has promulgated a100 µg/L TP water quality standard for medium to large rivers, which would include the Mississippi River. For Minnesota, the Mississippi River at Anoka is considered part of the Central RNR and Minnesota’s draft criteria ranges are 100 µg/L for TP and <20 µg/L for Chl-a. Minnesota’s draft TP criteria appear to be in the LTI UMR-LP model-predicted range of what may be required (Table 8b), while the proposed Chl-a is actually lower than the model projection. This suggests that Minnesota’s draft river criteria should be protective of both the Mississippi and Minnesota Rivers and downstream resources (e.g. Lake Pepin) as well.
The requirements for the St. Croix River are very close to the values required by the Lake St. Croix TMDL. In that TMDL the endpoints are consistent with Minnesota’s lake eutrophication criteria for the NCHF ecoregion: TP <40 µg/L and Chl-a <14 µg/L. Given there is a reduction in both TP and Chl-a from Lake St. Croix to the mouth of the river (Figure 11), the Lake St. Croix TMDL will be adequately protective for Pool 3 and Lake Pepin.
The model-predicted reductions (Table 8) for the Minnesota River are quite large given the long-term mean TP is ~250 µg/L and chlorophyll ~85-95 µg/L (Table 3). However, model-predicted TP is in the range of the draft criteria for the South RNR (Table 1a). Likewise the model-predicted Chl-a (32 µg/L) is in the range of the Chl-a draft criteria (Table 1a). The Minnesota River at Jordan did achieve a TP on the order of 150 µg/L during the low flow summers of 2008 and 2009 (Figure 9); however chlorophyll values were well above the model-predicted values (Table 8) [scenarios assume reductions in TP, TSS and Chl-a for the various sites].
Mississippi River Pools 1 through 8: Developing River, Pool, Minnesota Pollution Control Agency and Lake Pepin Eutrophication Criteria • October 2012
69

These reductions are somewhat consistent with the values required to meet the Lower Minnesota River Low DO TMDL. Work on the Lower Minnesota River began in 1985 when a wasteload allocation (WLA) study established biochemical oxygen demand (BOD) limits for the facilities in the lower 22 miles of the Minnesota River. The WLA Study also established a 40 percent BOD reduction goal for the Minnesota River upstream of Shakopee. A TMDL report completed in 2004 targeted the 40 percent reduction by reducing high phosphorus loading upstream of the metropolitan area. Phosphorus was targeted because the nutrient causes excessive algal growth, which in turn produces BOD as a result of algal decomposition. High BOD leads to low dissolved oxygen during low flow conditions in this reach of river. Based on scenario 7 in the Minnesota River HSPF model the recommended low flow goals for this reach were: TP = 0.131 mg/L, Chl-a = 56 µg/L and BOD (total) = 3.61 mg/L (Gunderson and Klang 2004). [Note: Chl-a of 56 at MI-39 translates to ~40 µg/L at MI-3.5 because of settling loses].
The emphasis of the Lower Minnesota TMDL report is on wastewater treatment facilities, although agriculture, noncompliant subsurface treatment systems and stormwater each play a role in the reduction efforts. A watershed permit dealing exclusively with phosphorus was issued in 2005 for continuously discharging wastewater treatment facilities. It requires a 51 percent reduction in total phosphorus by 2015. Options for achieving this include phosphorus trading between point sources or a five-month seasonal concentration-based (e.g. 1 mg/L) or mass-based limit. The wastewater treatment facilities have met their 2010 interim target of a 35 percent reduction in total phosphorus.
Proposed criteria consider draft river eutrophication criteria (Table 1a), linkages among rivers, pools, and Lake Pepin, downstream transport of TP and algae, TP and Chl-a relationships, and desire to minimize the frequency of nuisance blooms (Chl-a > 50 µg/L). Related considerations include LTI model projections for the Lake Pepin TMDL, existing upstream TMDLs (e.g. Minnesota River low DO and Lake St. Croix TMDLs), and Wisconsin’s promulgated water quality standards. The criteria for the pools and Lake Pepin have an aquatic recreation use focus (Table 10), while the river criteria (Table 1a) have an aquatic life use focus. The Mississippi, Minnesota and St. Croix criteria (Table 10) have a downstream protection focus as well, which is increasingly important from EPA’s viewpoint.
Mississippi River Pools 1 through 8: Developing River, Pool, Minnesota Pollution Control Agency and Lake Pepin Eutrophication Criteria • October 2012
70

Table 10. Draft criteria for main-stem rivers, Mississippi River navigational pools, and Lake Pepin. Concentrations expressed as summer averages. Source of data for assessment noted. Assumes aquatic recreational and aquatic life uses are maintained if TP and Chl-a are at or below criteria.
River/Pool Site Data source TP µg/L Chl-a µg/L
Rivers
Miss. @Anoka1 UM-872 MCES 100 18
Lake St. Croix3 SC-0.3 MCES 40 14
Minn. @Jordan1 MI-39 MCES 150 35
Pools & Lake Pepin
Pool 12 UM-847 MCES 100 35
Pool 24 UM-815 MCES 125 35
Pool 34 UM-796 MCES 100 35
Lake Pepin (Pool 4)5 4 fixed sites LTRMP 100 28
Pools 5-86 Near-dam LTRMP 100 35 1 River eutrophication criteria-based. Based on modeling UM-872 & MI-3.5 criteria will meet Lake Pepin requirements. 2 Minimize frequency of severe blooms. Upstream criteria provide additional protection for Pool 1. 3 MN lake eutrophication criteria-based. Based on modeling St. Croix outlet (SC-0.3) would meet Lake Pepin requirements. 4 Minimize frequency of severe blooms & meet Lake Pepin requirements 5. TP consistent with WI standard. Lake Pepin criteria assessed based on lake-wide mean from 4 monitoring sites. 6 Minimize frequency of severe blooms; upstream P requirements benefit lower pools. Assumes WI standard of 100 µg/L applies to Pools 5-8 These criteria (Table 10) are deemed supportive of aquatic recreational and aquatic life uses in these rivers, navigational pools, and Lake Pepin. Consistent with lake eutrophication criteria, both the causative (TP) and response variable (Chl-a) need to be exceeded for the pool (assessment reach) to be listed on the 303(d) list. While we have not examined the relationship between Chl-a and pH in the pools, there is adequate information for rivers to suggest that elevated Chl-a may result in elevated pH. Thus, consistent with the draft river eutrophication criteria (Heiskary et al. 2010), elevated pH could be used as an additional response variable for pool eutrophication standard assessment. Since pH is an existing ambient water quality standard in Minnesota Ch 7050, the method for applying that standard is already documented in rule.
Navigational pool eutrophication assessments should be consistent with other 303(d) assessments; whereby the most recent 10 years of data would be used in the assessment. This should minimize the effect of any extreme high or low flow year and allow for a more comprehensive assessment of each assessment reach. A summary of MCES and LTRMP data for the most recent eight- nine years (Table 11) provides perspective on the current status of river and pool sites in this system and allows for a comparison with the draft criteria. Based on this comparison values for UM-872 and MI-39 are above the proposed criteria and would be deemed impaired. SC-0.3 is slightly above the criteria; however, the Lake St. Croix TMDL would address this. Lake Pepin values for the most recent 10 years are above the criteria as well (Table 9). Pool 2 is above the draft criteria; however this will be addressed by meeting upstream TP and
Mississippi River Pools 1 through 8: Developing River, Pool, Minnesota Pollution Control Agency and Lake Pepin Eutrophication Criteria • October 2012
71

Chl-a criteria in the Minnesota and Upper Mississippi Rivers. Pools 5-8 are currently below the Chl-a criteria and meeting criteria upstream will benefit these pools.
The Chl-a concentrations noted in Table 10 refer to measures done by spectrometry. Given that both spectrometric and fluorometric methods are used in the two primary monitoring programs, correction factors would be applied to allow the use of fluorometric data when spectrophotometric is not available. Since this issue has been previously addressed by LTRMP we will build on that experience. Inter-laboratory comparisons and quality assurance, among the three laboratories that provide data to be used in assessments, will be addressed in a later effort and reinforced in assessment guidance. Assessment guidance will provide further details on monitoring sites and networks (e.g. LTRMP fixed site) that would be used to conduct the assessments and measure progress.
Table 11a. Summer-means for period 2001-2009 based on MCES data. Chlorophyll measured by spectrometry. Chl-a represents viable chlorophyll (corrected for pheophytin) and Chl-T is uncorrected chlorophyll as measured by trichromatic method.
TP mean DOP mean
Chl-a mean
Chl-a max.
Chl-T mean
Chl-T max.
mg/L mg/L µg/L µg/L µg/L µg/L
UM-871.6 0.115 0.046 38 100 41 95
UM-847.7 0.097 0.026 46 92 50 96
UM-839.1 0.153 0.044 49 120 57 140
UM-831.0 0.188 0.078 45 93 53 100
UM-826.7 0.181 0.078 41 83 49 98
UM-815.6 0.197 0.081 45 110 53 100
UM-796.9 0.158 0.065 40 100 49 110
MI-39.4 0.221 0.053 95 270 104 290
MI-8.5 0.256 0.063 73 190 86 200
MI-3.5 0.239 0.075 61 180 73 190
SC-23.3 0.053 0.010 28 74 30 74
SC-0.3 0.039 0.013 18 66 18 81
Table 11b. Summer means for Pools 5, 7 and 8: 2001-2008 based on LTRMP data. Chl-a by fluorometric method. Spectrophotometric corrected and fluorometric Chl-a values noted.
Pool R mile TP Chl-spec Chl-fluor
mg/L µg/L µg/L
Pool 5 M738.2 0.169 32 31
Pool 7 M701.1 0.163 35 34
Pool 8 M679.2 0.157 23 23
Mississippi River Pools 1 through 8: Developing River, Pool, Minnesota Pollution Control Agency and Lake Pepin Eutrophication Criteria • October 2012
72

References Baker, K. K. and A.L. Baker. 1981. Seasonal succession of the phytoplankton in the upper Mississippi River. Hydrobiolgia 83:295-301
Burdis, R.M. and J.K. Hirsch. 2007. Summary of Zooplankton in Lake Pepin Upper Mississippi River System 1993-2006. Completion Report 2006D7 prepared for the U.S. Geological Survey, Upper Midwest Environmental Sciences Center, La Crosse, Wisconsin. July 2007.
Dietermann, D. 2009. Major River Stream Survey Report: Survey of Mississippi River Pools 3, 4, 5, 5a, 7, upper 9 and Lower Vermilion River. Section of Fisheries. Minnesota Department of Natural Resources.
Dodds, R. 2010. MDNR fisheries manager, personal communication.
Engstrom, D.R., and J.E. Almendinger. 2000. “Historical Changes in Sediment and Phosphorus Loading to the Upper Mississippi River: Mass-balance Reconstructions from the Sediments of Lake Pepin.” Final Report to MCES. St. Croix Watershed Research Station, Science Museum of Minnesota, Marine on St. Croix, Minnesota.
Force, G. and E. Macbeth. 2002. Volunteer Water-quality Monitoring of Lake Pepin and Spring Lake: A Citizen Lake-Monitoring Network on the Mississippi river: 1994-1998 Five-Year Summary. MWBAC report for MCES St. Paul MN
Gunderson, L and J. Klang.2004.Lower Minnesota River Dissolved Oxygen Total Maximum Daily Load Report. MPCA St. Paul MN May 2004
Heiskary, S. 2008. Relation of nutrient concentrations and biological responses in Minnesota streams: applications for river nutrient criteria development. A report based on work conducted as a part of USEPA nutrient criteria grant. MPCA St. Paul MN
Heiskary, S. and W.W. Walker, Jr. 1988. Developing phosphorus criteria for a run-of-the river reservoir. Lake and Reserv. Manage.
Heiskary, S. and H. Markus. 2001. Establishing relationships among nutrient concentrations, phytoplankton abundance, and biochemical oxygen demand in Minnesota USA, river. Lake and Reserv. Manage. 17(4):251-262.
Heiskary, S. and H. Markus. 2003. Establishing relationships among nutrient concentrations, phytoplankton and periphyton abundance and composition, fish and macroinvertebrate indices,, and biochemical oxygen demand in Minnesota USA, river. MPCA St. Paul MN July 2003.
Heiskary, S. and D. Wasley. 2010. Site specific eutrophication criteria for Lake Pepin. MPCA St. Paul 28 pp
Heiskary, S. and B. Wilson. 2008. Minnesota’s approach to lake nutrient criteria development. Lake and Reserv. Manage. 24:282-297.
Heiskary, S., R.W. Bouchard and H. Markus. 2010. Minnesota nutrient criteria development for rivers. MPCA. St. Paul MN
Mississippi River Pools 1 through 8: Developing River, Pool, Minnesota Pollution Control Agency and Lake Pepin Eutrophication Criteria • October 2012
73

Johnson, B. and K. Hagerty (eds.). 2008. Status and trends of selected resources of the Upper Mississippi River System. A synthesis report of the Long Term Resources Monitoring Program. USGS, Upper Midwest Sciences Center. LaCrosse WI
Larson, C. 2010. Lower Minnesota River Study Monitoring and Modeling Water Quality from Jordan, Minnesota, to the Mouth. MCES. St. Paul MN http://www.metrocouncil.org/environment/water/LMRM/documents.htm
LTI. 2008. Upper Mississippi River-Lake Pepin Quality Model. Development, Calibration and Application. Prepared for MPCA. LimnoTech Ann Arbor MI
Meerbeek. J. 2008. Large Lake Monitoring Program Annual Completion Report: Lake Pepin 2008. MDNR. Section of Fisheries.
Megard, R.O. 1981. Effects of planktonic algae on water quality in impoundments of the Mississippi River in Minnesota. In Proceedings of the Symposium on Surface Water Impoundments. June 2-5, 1980 Minneapolis, Minnesota. ASCE.
Metropolitan Council Environmental Services. 2002. Lake Pepin Phosphorus Study, 1994-1998. Metropolitan council, St. Paul MN
Meyer, M. and S. Schellhaass. 2002. Sources of phosphorus, chlorophyll, and sediment to the Mississippi River upstream of Lake Pepin: 1976-1996. Final report by MCES, St. Paul MN 74 pages.
MDNR. 2004. Recreational Boating Study of the Mississippi River Pools 4 to 9, Summer 2003. Office of Management and Office Service, MDNR in collaboration with WDNR, U.S. Fish and Wildlife Service, U.S. Army Corps of Engineers.
MDNR. 2009. Standard lake survey report: U.S. Lock and Dam Pool 1. MDNR August 10, 2009.
Minnesota Pollution Control Agency (2004) Lower Minnesota River Dissolved Oxygen Total Maximum Daily Load Report; St. Paul, Minnesota.
Minnesota Pollution Control Agency (2006) Lower Minnesota River Dissolved Oxygen Total Maximum Daily Load Implementation Plan; St. Paul, Minnesota.
Rojo, C., A. Cobelas, and M. Arauzo.1994. An elementary, structural analysis of river phytoplankton. Hydrobiol. 289:43-55.
St. Mary’s University of Minnesota. 2007. 2007 Recreational boating study of the Lower St. Croix National Scenic Riverway, Minnesota River from Carver Rapids to fort Snelling, and the Mississippi River from Dayton to Lock and Dam 10. For USACE, MDNR and WDNR.
Smeltzer, E. and S. Heiskary. 1990. Analysis and application of lake user survey data. Lake Reserv. Manage. 6:109-118.
Soballe, D. J. Fischer, L. Hodge-Richardson, T. Clemment. 2002. Limnological monitoring on the Upper Mississippi River system, 1993-1996: Long Term Resource Monitoring Program Onalaska Field Station. USGS Upper Midwest Environmental Sciences Center. La Crosse WI.
Mississippi River Pools 1 through 8: Developing River, Pool, Minnesota Pollution Control Agency and Lake Pepin Eutrophication Criteria • October 2012
74
Soballe, D. and J. Fischer. 2004. Long Term Resource Monitoring Program Procedures: water Quality Monitoring. Tech. Report 2004-T002-01. Onalaska Field Station. USGS Upper Midwest Environmental Sciences Center. La Crosse WI.
Sullivan, J. 2008. The use of metaphyton to evaluate nutrient impairment and proposed nutrient criteria for wetlands and backwaters in the Upper Mississippi River. Mississippi River Team, Wisconsin DNR. La Crosse WI
Sullivan, J. 2009 & 2010. WI Department of Natural Resources. Personal communication
Van Nieuwenhuyse, E.E. and J.R. Jones. 1996. Phosphorus-chlorophyll relationship in temperate streams and its variation with stream catchment size. Can. J. Fish. Aquat. Sci. 53:99-105.
Mississippi River Pools 1 through 8: Developing River, Pool, Minnesota Pollution Control Agency and Lake Pepin Eutrophication Criteria • October 2012
75

Appendix A Laboratory methods summary The following summaries describe laboratory methods for MCES, LTRMP and MDH laboratories with a special emphasis on chlorophyll-a and TP. These notes were compiled from quality assurance comparisons and discussions that were conducted as a part of data compilation efforts to assist in development of LTI UMR-LP model and overall efforts to assess condition of Lake Pepin and Mississippi river navigational pools.
Table 1. Laboratory methods for the three laboratories. As summarized in a 2007 memorandum from Steve Heiskary to Norm Senjem.
Lab (agency) Parameter
Total Phosphorus Chlorophyll-a
MPCA (MDH) EPA Method # 365.2; reporting limit 2 µg/L, precision as mean difference 4.8 µg/L 1
EPA Method 446.0; spectrophotometric; reporting limit 0.16 µg/L, precision 1.7 µg/L
MCES EPA Method # 365.1, Revision 2.0
Minimum PQL (Reporting Limit) = 0.05 mg/l (50 µg/L )
ASTM Method 802.0-03; spectrophotometric
Reporting Limit = 1.0 µg/L
LTRMP Persulfate digestion EPA Method 445.0 Fluorometric 1. Based on quality assurance information previously reported in Heiskary and Markus (2001). a. Summary of LTRMP WQ laboratory spectrophotometric and fluorometric methods for
12/13/07 Conference Call (not a formal Operating Procedure).
Field sample collection methods are described in detail in the LTRMP WQ Procedures manual, which can be found here: http://www.umesc.usgs.gov/documents/reports/2004/04t00201.pdf
Within the LTRMP Stratified Random Sampling Program, fluorometric chlorophyll a is determined at all sampled sites and spectrophotometric Chl-a is determined at 10 percent of the sampled sites for the purpose of calibrating the fluorometer. This sampling approach has been followed since the beginning of SRS sampling in 1993. Below are brief summaries of the spectrophotometric and fluorometric laboratory methods.
Spectrophotometric method 1. Place the filter into test tube and cover with 2 to 3 mL 90 percent aqueous acetone
solution into a test tube. 2. Thoroughly grind the filter (in very dim light). Avoid generating excessive heat. 3. Adjust total volume to 10 mL with 90 percent aqueous acetone. 4. Allow the extraction to proceed at least two hours in refrigerated darkness. 5. Centrifuge for 20 min at 500g. 5. Read the absorption on a spectrophotometer at 750 and 664 nm using a 1-cm cuvette. 6. Acidify sample with 0.1mL 0.1N HCL and read absorption at 750 and 665 nm to
determine Chl-a in the presence of pheophytin.
Mississippi River Pools 1 through 8: Developing River, Pool, Minnesota Pollution Control Agency and Lake Pepin Eutrophication Criteria • October 2012
76

Fluorometric method 1. Add 5 mL 1:1 Acetone: DMSO (dimethyl sulfoxide) to test tubes that contain filters.
Invert sample several times. Allow extraction to proceed for four – eight hours in total darkness at room temperature for four – eight hours.
2. Read fluorescence on a Turner Designs 10 AU digital Fluorometer.
NOTE: The output from the fluorometer is the sample fluorescence multiplied by an approximate multiplier that produces a number that is close to actual Chl-a. This is the value that appears in the LTRMP database. As is noted in the LTRMP data documentation, determining a final Chl-a concentration requires that this output be calibrated using the data from sites where both spectrophotometric and fluorometric Chl-a were determined. The attached document explains that in some detail.
NOTE: Until 1995 the (now obsolete) acidification method was used to correct fluorometrically determined Chl-a concentrations. Beginning1996, a single reading of sample fluorescence has been used to determine Chl-a (following the Turner Designs method based on Welschmeyer 1994). In this method the filters and lamp used in the fluorometer are configured such that the measured response is due almost entirely to Chl-a. This method has a number of benefits over the acidification method including the fact that it eliminates the need for acidification and the errors that are well known to occur with that method (Welschmeyer 1994). The specifications for the fluorometer, lamp and filters are as follows: Model 10-AU digital Fluorometer with 13mm cuvette holder, 436 nm excitation filter, 680 nm emission filter, 1 ND reference filter, F4T4.5B2 equivalent blue lamp.
Reference Welschmeyer, N.A. 1994. Fluorometric analysis of chlorophyll a in the presence of chlorophyll b and pheopigments. Limnology and Oceanography 39(8):1985-1992.
b. Cathy Larson (11/08/01) provided the following notes on MCES chlorophyll methods and terminology as a part of efforts to merge data sources for development of the UMR-LP model. These notes provide additional perspective on chlorophyll-a data referenced in this report.
Since the mid-1970s, MCES has routinely analyzed and reported two measures of chlorophyll-a from samples collected in the river-monitoring program:
- Chlorophyll-a (trich “Chlorophyll-a” or “Total Chlorophyll-a” (µg/L) measured with the trichromatic method, which corrects for interferences by chlorophyll-b and chlorophyll-c but does not correct for pheophytin. Pheophytin is a degradation product of chlorophyll and indicates the amount of dead algae.
- “Percent viable chlorophyll-a” (%) measured with the modified monochromatic method, which corrects for the presence of pheophytin and indicates the amount of living algae.
Chlorophyll-a (trichromatic method) was also analyzed for the lake-monitoring program. In some modeling and assessment work, we multiplied these two values together to estimate “viable chlorophyll-a (µg/L).” In hindsight, we should not have combined values from these different analytical tests.
Mississippi River Pools 1 through 8: Developing River, Pool, Minnesota Pollution Control Agency and Lake Pepin Eutrophication Criteria • October 2012
77

Both trichromatic and monochromatic methods yield additional information that may be valuable for assessing water quality. Some information is preferred over others. This past year, MCES staff evaluated the methods and recommended that the following variables be stored in the water-quality Oracle database and Environmental Information Management System (EIMS) warehouse (field names are in bold face):
From the modified monochromatic method:
- “Chlorophyll-a, Pheo-Corrected” (µg/L) or pheophytin-corrected chlorophyll-a. This is the chlorophyll-a measurement most commonly reported by other agencies and groups that use spectrophotometric methods. We recommend that you use this value when reporting chlorophyll-a. It indicates the amount of living algae.
- “Pheophytin-a” (µg/L). This value is used less often and indicates the amount of dead algae. You can add pheophytin-a and pheophytin-corrected chlorophyll-a to get an estimate of the total amount of algae (living and dead).
- “Chlorophyll-a, % Pheo-Corrected” (%) or percent pheophytin-corrected chlorophyll-a. It is equivalent to “percent viable chlorophyll-a” reported in the past. t is simply the percentage of pheophytin-corrected chlorophyll-a to the sum of pheophytin-a and pheophytin-corrected chlorophyll-a. It is sometimes used as an indicator of the “health” of the algal community, or the percent living.
- “Chlorophyll-a/Pheophytin-a Abs. Ratio” (unitless) or the ratio of the absorbance of specific wavelengths before and after acidification. Acidification converts all the chlorophyll-a to pheophytin-a. Similar to the previous measure, the absorbance ratio is sometimes used to indicate the health of the algal community: a ratio of 1.7 indicates the absence of pheophytin-a (i.e., excellent physiological condition) and a ratio of 1.0 indicates the absence of chlorophyll-a (i.e., dead and decaying algae).
From the trichromatic method:
- “Chlorophyll-a, Trichromatic Uncorrected” (µg/L) or chlorophyll-a from the trichromatic method, uncorrected for pheophytin. This is equivalent to “chlorophyll-a,” reported in the past. The trichromatic method corrects for interferences by chlorophyll-b and chlorophyll-c but does not correct for pheophytin-a. We recommend against using this value for chlorophyll-a, unless you need to make comparisons with historical data.
- “Chlorophyll-b” (µg/L). Sometimes used to distinguish different groups of algae.
- “Chlorophyll-c” (µg/L). Sometimes used to distinguish different groups of algae.
The preferred measurement is pheophytin-corrected chlorophyll-a (µg/L), as advised in Standard Methods (1985):
“The determination of chlorophylls by the trichromatic method is of questionable value. It tends to overestimate chlorophyll-a when no correction is made for the presence of the degradation product, pheophytin-a. Chlorophyll b and c values are calculated from readings taken on the slope of the chlorophyll a curve and are unreliable. For routine work in fresh water, determination of chlorophyll-a and pheophytin-a by spectrophotometry is the most valuable technique.”
Mississippi River Pools 1 through 8: Developing River, Pool, Minnesota Pollution Control Agency and Lake Pepin Eutrophication Criteria • October 2012
78

For users of historical chlorophyll data, we did a comparison of pheophytin-corrected chlorophyll-a to “viable chlorophyll-a”--the latter using the old definition of “total chlorophyll-a” (uncorrected, trichromatic) times “percent viable” (% pheo-corrected, modified monochromatic). The average percent difference of the paired values was 8%, and the majority (± one standard deviation) was within 20%. For comparisons of post-2001 to pre-2001 data, use of uncorrected, trichromatic chlorophyll-a is preferred.
Appendix B Comparison of river TP and Chl-a relationships based on Minnesota and Wisconsin data. Provided by John Sullivan MDNR. Graphs based on a) WDNR data, b) MPCA data and c) LTRMP data for Pools 4 (1), 8 (2) and 9&10 (7)
a.
b.
Mississippi River Pools 1 through 8: Developing River, Pool, Minnesota Pollution Control Agency and Lake Pepin Eutrophication Criteria • October 2012
79

c.
Mississippi River Pools 1 through 8: Developing River, Pool, Minnesota Pollution Control Agency and Lake Pepin Eutrophication Criteria • October 2012
80

Appendix C Aerial photos of MCES monitoring sites for UM-872 Mississippi River at Anoka (note Rum River enters from the north); UM-847 (Pool 1); UM-839, UM-826, and UM-815 (Pool 2), UM-796 (Pool 3). Photos provided by MCES.
Mississippi River Pools 1 through 8: Developing River, Pool, Minnesota Pollution Control Agency and Lake Pepin Eutrophication Criteria • October 2012
81

Mississippi River Pools 1 through 8: Developing River, Pool, Minnesota Pollution Control Agency and Lake Pepin Eutrophication Criteria • October 2012
82

Mississippi River Pools 1 through 8: Developing River, Pool, Minnesota Pollution Control Agency and Lake Pepin Eutrophication Criteria • October 2012
83