Embed Size (px)
Citation preview

Mississippi Department of Environmental
Quality
2017
Air Quality Data Summary

2
Table of Contents
Introduction……..………………………………..…………..……………...3
MDEQ Air Monitoring Network Information…………...…………….….4-5
NAAQS Table……………………………………………………………….6
Ground-Level Ozone…...……………………….…………..………….....7-8
Particulate Matter………..…………………………..………........................9
PM2.5..………..……………………………….........................................10-11
PM10....………..……………………………….............................................12
Carbon Monoxide..........................................................................................13
Nitrogen Dioxide…….…………………………………….... ………...14-15
Sulfur Dioxide…….…...…………………………….…..………..….....16-19
Appendix 1 – 10 Year Data Trends by County……….….…………..…20-76
Appendix 2 – Data Completeness by Pollutant…...……….……….…..77-84

3
Introduction
Under the Clean Air Act, the U.S. Environmental Protection Agency (EPA) establishes
primary air quality standards to protect public health, including the health of “sensitive
populations such as people with asthma, children, and older adults”. EPA also sets
secondary standards to protect public welfare. This includes protecting ecosystems,
including plants and animals, from harm, as well as protecting against decreased visibility
and damage to crops, vegetation, and buildings.
EPA has set national ambient air quality standards (NAAQS) for six principal air
pollutants (also called criteria pollutants): Ground-Level Ozone (O3), Particulate Matter
(PM), Nitrogen Dioxide (NO2), Sulfur Dioxide (SO2), Carbon Monoxide (CO), and Lead
(Pb). The Mississippi Department of Environmental Quality (MDEQ) monitors all of
these pollutants with the exception of lead (Pb) as MDEQ ceased lead monitoring, June
30th, 2016.
This report looks at the reported levels of the criteria pollutants in 2017 at various
monitoring sites located in Mississippi. It compares these levels to the NAAQS to
determine how the state is doing in meeting these standards. As it is stated, Mississippi is
meeting all of the NAAQS.
In July 2012, due to its proximity to the Memphis area, part of DeSoto County was
designated as part of the Memphis Nonattainment Area by EPA. EPA re-designated
DeSoto County to Attainment in May of 2016. In October 2015, EPA lowered the
primary and secondary ozone standards from 75 ppb to 70 ppb. Although Mississippi is
meeting this standard for the 2014-2016 period, EPA designated
attainment/nonattainment areas based on 2014-2016 ozone data.
In March 2015, Jackson Metro (Hinds Co. 28.049.0010) FS-19 site was shut down and
relocated in April 2015 (Jackson Metro Hinds Co. 28.049.0021) with EPA approval to
Hinds Community College, located at latitude 32.346722 and longitude -90.225667.
MDEQ restarted operation of its multi-pollutant site (N-CORE) in July 2013.

4
2017 MDEQ Air Monitoring Network

5
Monitoring Network Information
County City Monitoring
Site ID
Pollutants
Monitored
Latitude Longitude
Deg. Min. Sec. Deg. Min. Sec. Bolivar Cleveland 28-011-0001 Ozone 33 44 45 -90 43 23
DeSoto Hernando 28-033-0002 Ozone, PM2.5
3-Day, PM2.5
Continuous
34 49 14 -89 59 16
Forrest Hattiesburg 28-035-0004
PM2.5 3-Day,
PM2.5
Continuous
31 19 23 -89 17 15
Grenada Grenada 28-043-0001 PM2.5 3-Day 33 50 04 -89 47 34
Hancock Waveland 28-045-0003 Ozone, PM2.5
3-Day 30 18 3 -89 23 45
Harrison Gulfport 28-047-0008 Ozone, PM2.5
3-Day, PM2.5
Continuous
30 23 24 -89 02 59
Hinds CC Jackson 28-049-0021 Ozone, PM2.5
3-Day, PM2.5
Continuous
32 20 48 -90 13 32
Hinds Jackson
N-CORE
28-049-0020 Ozone, PM2.5
3-Day, PM2.5
Continuous,
Speciated
PM2.5, PM10-
2.5, CO, NOy,
SO2
32 19 45 -90 10 58
Jackson Pascagoula 28-059-0006 Ozone, PM2.5
3-Day, NO,
NO2, NOx,
SO2
30 22 42 -88 32 03
Lauderdale Meridian 28-075-0003 Ozone 32 21 52 -88 43 53
Lee Tupelo 28-081-0005 Ozone 34 15 54 -88 45 58

6
NAAQS Table
Pollutant
[links to historical tables
of NAAQS reviews]
Primary/
Secondary
Averaging
Time Level Form
Carbon Monoxide (CO) primary
8 hours 9 ppm Not to be exceeded more than once per
year 1 hour 35 ppm
Lead (Pb)
primary
and
secondary
Rolling 3 month
average 0.15 μg/m3 (1) Not to be exceeded
Nitrogen Dioxide (NO2)
primary 1 hour 100 ppb
98th percentile of 1-hour daily
maximum concentrations, averaged
over 3 years
primary
and
secondary
1 year 53 ppb (2) Annual Mean
Ozone (O3)
primary
and
secondary
8 hours 0.070 ppm (3)
Annual fourth-highest daily maximum
8-hour concentration, averaged over 3
years
Particle Pollution
(PM)
PM2.5
primary 1 year 12.0 μg/m3 annual mean, averaged over 3 years
secondary 1 year 15.0 μg/m3 annual mean, averaged over 3 years
primary
and
secondary
24 hours 35 μg/m3 98th percentile, averaged over 3 years
PM10
primary
and
secondary
24 hours 150 μg/m3 Not to be exceeded more than once per
year on average over 3 years
Sulfur Dioxide (SO2)
primary 1 hour 75 ppb (4)
99th percentile of 1-hour daily
maximum concentrations, averaged
over 3 years
secondary 3 hours 0.5 ppm Not to be exceeded more than once per
year

7
Ground-Level Ozone (O3)
Ozone is a gas composed of three atoms of oxygen. Ozone occurs both in the Earth’s
upper atmosphere and at ground level. Ozone can be good or bad, depending on where it
is found. It occurs naturally in the stratosphere approximately 6 to 30 miles above the
Earth’s surface where it forms a protective layer that shields us from the sun’s harmful
ultraviolet rays. In the Earth’s lower atmosphere, near ground level, ozone occurs
naturally in lower amounts and additional ozone is formed when nitrogen oxides (NOx)
and volatile organic compounds (VOCs) emitted by cars, power plants, industrial boilers,
refineries, chemical plants, and other sources react chemically in the presence of sunlight.
Because this reaction takes time to occur, ozone is usually formed downwind of emission
sources.

8
Ozone Standard
There is one primary and secondary ozone standard – the 8-hour average. MDEQ
monitors ozone continuously from March 1 through October 31 each year at the
monitoring sites listed below. Ozone is monitored year around at our N-CORE site
located in the Jackson MSA.
Primary and Secondary 8-Hour Ozone Standard
The 8-hour standard is met when the 3-year average of the annual fourth highest daily
maximum 8-hour average concentration (also known as the design value) is less than or
equal to 0.070 parts per million (ppm) or 70 parts per billion (ppb). O3 NAAQS
8-Hour Ozone Design Values
Standard – 70 ppb
County City
2017 Design
Values
(ppb)
Bolivar County Cleveland 62
DeSoto County Hernando 62
Hancock County Waveland 60
Harrison County Gulfport 64
Hinds County Jackson 61
Hinds County Jackson/N-CORE 60
Jackson County Pascagoula 63
Lauderdale County Meridian 56
Lee County Tupelo 58
Yalobusha County Coffeeville EPA Site 55

9
Particulate Matter
In general, particulate matter consists of a mixture of larger materials, called “coarse
particles”, and smaller particles, called “fine particles”. Coarse particles have diameters
ranging from 2.5 micrometers (µm) to more than 40 µm, while fine particles, also known
as PM2.5, include particles with diameters equal to or smaller than 2.5 µm. MDEQ also
monitors PM10, which refers to particles less than or equal to 10 µm in diameter.
These tiny particles come in many shapes and sizes and can be made up of hundreds of
different chemicals. Some particles are emitted directly from a source, while others form
in complicated chemical reactions in the atmosphere.

10
PM2.5 Standards
There are two primary and secondary PM2.5 standards: (1) Annual Average and (2) 24-
Hour Average. MDEQ monitors PM2.5 every 3rd day at the monitoring sites listed below.
Primary and Secondary Annual Average Standard –
12.0 µg/m3 and 15.0 µg/m3
The annual average primary standard is met when the three-year average of the annual
averages does not exceed 12.0 micrograms per cubic meter (µg/m3). The annual average
secondary standard is met when the three-year average of the annual averages does not
exceed 15.0 micrograms per cubic meter (µg/m3). PM NAAQS
County City
2017
Annual
Average
Design
Value
(µg/m3)
DeSoto County Hernando 8.1
Forrest County Hattiesburg 8.9
Grenada County Grenada 7.2
Hancock County Waveland 8.1
Harrison County Gulfport 8.1
Hinds County Jackson 8.7
Hinds County Jackson/N-CORE 8.9
Jackson County Pascagoula 8.3

11
Primary and Secondary 24-Hour Average
Standard (98th Percentile) – 35 µg/m3
The 24-hour average standard is met when the three-year average of the annual 98th
percentiles of the 24-hour averages does not exceed 35 micrograms per cubic meter
(µg/m3).
County City
2017
24-Hour
Average
Design
Value
(µg/m3)
DeSoto County Hernando 16
Forrest County Hattiesburg 17
Grenada County Grenada 14
Hancock County Waveland 18
Harrison County Gulfport 17
Hinds County Jackson 18
Hinds County Jackson/N-CORE 18
Jackson County Pascagoula 18

12
PM10 Standards
Primary and Secondary 24-Hour Average
Standard – 3 Year Average of the Annual 2nd Max – 150 μg/ m3
The 24-hour average standard is met when the annual second max does not exceed 150
micrograms per cubic meter (µg/m3) over the average of three years. MDEQ monitors
PM10 every 6th day at the monitoring sites listed below.
County City
2017
24-Hour Average
Design Value
(µg/m3)
Hinds County Jackson/NCORE 42

13
Carbon Monoxide
Carbon monoxide (CO) is a colorless, odorless gas that is formed when carbon in fuel is
not burned completely. It is a component of motor vehicle exhaust, which contributes
about 56% of all CO emissions nationwide. Other non-road engines and vehicles (such as
construction equipment and boats) contribute about 22% of all CO emissions nationwide.
Other sources of CO emissions include industrial processes, residential wood burning,
and natural sources such as forest fires.
Carbon Monoxide Standards
There are two carbon monoxide standards: (1) 8-Hour Average and (2) 1-Hour Standard.
MDEQ monitors carbon monoxide continuously year-round at the monitoring site listed
below. CO NAAQS
Primary CO Standard – 8-Hour 9 ppm
1-Hour 35 ppm
The 8-hour average standard is met if the 8-hour average of 9 parts per million (ppm) is
not exceeded more than once per year. The 1-hour average standard is met if the 1-hour
average of 35 parts per million (ppm) is not exceeded more than once per year.
County City
2017 Annual
2nd Max (ppm)
Hinds County Jackson 8 - Hour: 1.2
NCORE 1 - Hour: 1.4
8-Hour Carbon
Monoxide
1-Hour Carbon
Monoxide

14
Nitrogen Dioxide
Nitrogen dioxide (NO2) can often be seen as a reddish-brown layer. Nitrogen dioxide
forms when fuel is burned at high temperatures, as in a combustion process. The primary
manmade sources of nitrogen dioxide are motor vehicles, electric utilities, and other
industrial, commercial, and residential sources that burn fuels. It can also be formed
naturally.
Nitrogen Dioxide Standards
There are two NO2 standards: (1) Annual Average (Primary and Secondary) and (2) 1-
Hour Average (Primary). MDEQ monitors nitrogen dioxide continuously year-round at
the monitoring site listed below. NO2 NAAQS
Primary and Secondary Annual Average Standard –
53 ppb
The annual average NO2 standard is met when the annual average does not exceed 53
parts per billion (ppb).
County City
2017
Annual
Average
(ppb)
Jackson County Pascagoula 4

15
Primary 1-Hour Average Standard –
100 ppb
The 1-hour average NO2 standard is met when the three-year average of the annual 98th
percentiles of the 24-hour averages does not exceed 100 parts per billion (ppb).
County City
2017
1-Hour
Average
Design
Value
(ppb)
Jackson County Pascagoula 29

16
Sulfur Dioxide
Sulfur dioxide (SO2) belongs to the family of sulfur oxide gases (SOx). These gases
dissolve easily in water. Sulfur is prevalent in all raw materials, including crude oil, coal,
and ore that contains common metals like aluminum, copper, zinc, lead, and iron. SOx
gases are formed when fuel containing sulfur, such as coal and oil is burned, and when
gasoline is extracted from oil and metals are extracted from ore. SO2 dissolves in water
vapor to form acid, and interacts with other gases and particles in the air to form sulfates
and other products that can be harmful to people and their environment.
Over 65% of SO2 released to the air comes from electric utilities, especially those that
burn coal. Other sources of SO2 are industrial facilities that derive their products from
raw materials like metallic ore, coal, and crude oil, or that burn coal or oil to produce
process heat. Examples are petroleum refineries, cement manufacturing, and metal
processing facilities.
Sulfur Dioxide Standards
There are three primary sulfur dioxide standards – the 1-Hour average, the annual, and
the 24-hour average. There is one secondary sulfur dioxide standard – the 3-Hour
average. MDEQ monitors sulfur dioxide continuously year-round at the monitoring site
listed below. SO2 NAAQS
Primary 1-Hour Average Standard –
75 ppb
The 1-hour average SO2 standard is met when the three-year average of the annual 99th
percentiles of the 1-hour averages does not exceed 75 parts per billion (ppb).
County City
2017
1-Hour
Average
Design Value
(ppb)
Hinds County Jackson/N-CORE 9
Jackson County Pascagoula 12

17
Primary Annual Standard –
0.03 ppm
Annual SO2 standard is met when the maximum annual average does not exceed 0.030
parts per million (ppm).
County City
2017
Annual
Average
(ppm)
2017
Number of
Exceedances
Hinds County Jackson/NCORE 0.00 0
Jackson County Pascagoula 0.00 0

18
Primary 24-Hour Standard –
0.14 ppm
24-Hour SO2 standard is met when the maximum annual average concentration of 0.14
parts per million (ppm) is not exceeded more than once per calendar year.
County City
2017
2nd
Maximum
24-Hour
(ppm)
2017 Number
of Exceedances
Hinds County Jackson/N-CORE 0.00 0
Jackson County Pascagoula 0.00 0
19
Secondary 3-Hour Average Standard –
0.5 ppm
The 3-hour average SO2 standard is met when the maximum 3-hour average
concentration of 0.5 parts per million (ppm) is not exceeded more than once per calendar
year.
County City
2017
2nd
Maximu
m 3-
Hour
Average
(ppm)
2017
Number of
Exceedances
Hinds County Jackson/N-CORE 0.0 0
Jackson County Pascagoula 0.0 0

20
Appendix 1
10-Year Data Trends
By County

21
Bolivar County

22
Bolivar County
Monitoring Site No. 28-011-0001
Location

23
Bolivar County
8-Hour Ozone (ppb)
3–Year
Period
2006-
2008
2007-
2009
2008-
2010
2009-
2011
2010-
2012
2011-
2013
2012-
2014
2013-
2015
2014-
2016
2015-
2017
Design
Value
73 69 68 70 74 71 67 62 62 62
60626466687072747678808284
2006-2008 2007-2009 2008-2010 2009-2011 2010-2012 2011-2013 2012-2014 2013-2015 2014-2016 2015-2017
DES
IGN
VA
LUES
(P
PB
)
YEAR
3 Year Design Value 8 Hour Ozone Average for Bolivar County
Design Value (ppb)
EPA Ozone Standard
586062646668707274767880828486
2008 2009 2010 2011 2012 2013 2014 2015 2016 2017
4TH
DA
ILY
MA
X 8
HO
UR
AV
ERA
GE
(PP
B)
YEAR
4th Daily Max 8 Hour Ozone Average for Bolivar County
4th Daily Max 8 Hour Average (ppb)
EPA Ozone Standard
Year 2008 2009 2010 2011 2012 2013 2014 2015 2016 2017
Annual 4th Max.
8-Hour Avg.
65 66 73 73 76 65 60 63 64 59

24
DeSoto County

25
DeSoto County
Monitoring Site No. 28-033-0002
Location

26
DeSoto County
8-Hour Ozone (ppb)
3-Year
Period
2006-
2008
2007-
2009
2008-
2010
2009-
2011
2010-
2012
2011-
2013
2012-
2014
2013-
2015
2014-
2016
2015-
2017
Design
Value
81 76 73 73 74 70 69 64 64 62
62646668707274767880828486
2006-2008 2007-2009 2008-2010 2009-2011 2010-2012 2011-2013 2012-2014 2013-2015 2014-2016 2015-2017
DES
IGN
VA
LUES
(P
PB
)
YEAR
3 Year Design Value 8 Hour Ozone Average for DeSoto County
Design Value (ppb)
EPA Ozone Standard
6062646668707274767880828486
2008 2009 2010 2011 2012 2013 2014 2015 2016 2017
4TH
DA
ILY
MA
X 8
HO
UR
AV
ERA
GE
(PP
B)
YEAR
4th Daily Max 8 Hour Ozone Average for DeSoto County
4th Daily Max 8 Hour Average (ppb)
EPA Ozone Standard
Year 2008 2009 2010 2011 2012 2013 2014 2015 2016 2017
Annual 4th Max.
8-Hour Avg.
74 71 76 72 75 65 67 61 66 60

27
DeSoto County
PM2.5
Annual Mean (µg/m3)
3-Year
Period
2006-
2008
2007-
2009
2008-
2010
2009-
2011
2010-
2012
2011-
2013
2012-
2014
2013-
2015
2014-
2016
2015-
2017
3-Year Average of
the Annual Means
11.9 11.3 10.5 9.9 9.8 9.6 9.6 9.3 8.7* 8.1*
*Incomplete Data
8
9
10
11
12
13
14
2006-08 2007-09 2008-10 2009-11 2010-12 2011-13 2012-14 2013-15 2014-16 2015-173 Y
EAR
AV
ERA
GE
(UG
/^3
)
YEAR
3 Year Annual Mean PM2.5 DeSoto County
3 Year Mean
Standard (12 ug/m^3)
7
8
9
10
11
12
13
2008 2009 2010 2011 2012 2013 2014 2015 2016 2017
AN
NU
AL
AV
ERA
GE
(UG
/M^3
)
YEAR
Annual Mean PM2.5 DeSoto County
Annual Mean (ug/m^3)
Standard (12 ug/m^3)
Year 2008 2009 2010 2011 2012 2013 2014 2015 2016 2017
Annual Mean 11.6 9.8 10.2 9.7 9.5 9.6 9.6 8.9 7.7* 7.6*

28
DeSoto County
PM2.5
24-Hour Average (µg/m3)
3-Year
Period
2006-
2008
2007-
2009
2008-
2010
2009-
2011
2010-
2012
2011-
2013
2012-
2014
2013-
2015
2014-
2016
2015-
2017
3-Year Average
of the Annual 98th
Percentiles
26 24 22 20 18 19 20 20 19* 16*
*Incomplete Data
16
21
26
31
36
2006-08 2007-09 2008-10 2009-11 2010-12 2011-13 2012-14 2013-15 2014-16 2015-17
98
TH P
ERC
ENTI
LE (
UG
/^3
)
YEAR
3 Year 98th Percentile Mean PM2.5 DeSoto County
3 Year 98th Percentile Mean (ug/m^3)
Standard (35 ug/m^3)
14
19
24
29
34
39
2008 2009 2010 2011 2012 2013 2014 2015 2016 2017
98
TH P
ERC
ENTI
LE (
UG
/^3
)
YEAR
Annual 98th Percentile PM2.5 DeSoto County
98th Percentile (ug/m^3)
Standard (35 ug/m^3)
Year 2008 2009 2010 2011 2012 2013 2014 2015 2016 2017
Annual 98th
Percentile
26 21 19 19 18 20 23 17 16* 15*

29
Forrest County

30
Forrest County
Monitoring Site No. 28-035-0004
Location

31
Forrest County
PM2.5
Annual Mean (µg/m3)
3-Year
Period
2006-
2008
2007-
2009
2008-
2010
2009-
2011
2010-
2012
2011-
2013
2012-
2014
2013-
2015
2014-
2016
2015-
2017
3-Year Average of
the Annual Means
13.7 12.8 12.0 11.6 11.6 11 10.5 10.0 9.6 8.9
8
9
10
11
12
13
14
15
2006-08 2007-09 2008-10 2009-11 2010-12 2011-13 2012-14 2013-15 2014-16 2015-17
3 Y
EAR
AV
ERA
GE
(UG
/^3
)
YEAR
3 Year Annual Mean PM2.5 Forrest County
3 Year Mean
Standard (12 ug/m^3)
8
9
10
11
12
13
14
2008 2009 2010 2011 2012 2013 2014 2015 2016 2017
AN
NU
AL
AV
ERA
GE
(UG
/^3
)
YEAR
Annual Mean PM2.5 Forrest County
Annual Mean (ug/m^3)
Standard (12 ug/m^3)
Year 2008 2009 2010 2011 2012 2013 2014 2015 2016 2017
Annual Mean 13.0 11.1 12.0 11.6 11.0 10.2 10.2 9.7 8.9 8.3

32
Forrest County
PM2.5
24-Hour Average (µg/m3)
3-Year
Period
2006-
2008
2007-
2009
2008-
2010
2009-
2011
2010-
2012
2011-
2013
2012-
2014
2013-
2015
2014-
2016
2015-
2017
3-Year Average of
the Annual 98th
Percentiles
29 25 24 22 22 21 20 20 18 17
16
21
26
31
36
2006-08 2007-09 2008-10 2009-11 2010-12 2011-13 2012-14 2013-15 2014-16 2015-17
98
TH P
ERC
ENTI
LE (
UG
/^3
)
YEAR
3 Year 98th Percentile Mean PM2.5 Forrest County
3 Year 98th Percentile Mean (ug/m^3)
Standard (35 ug/m^3)
14.0
19.0
24.0
29.0
34.0
39.0
2008 2009 2010 2011 2012 2013 2014 2015 2016 2017
98
TH P
ERC
ENTI
LE (
UG
/^3
)
YEAR
Annual 98th Percentile PM2.5 Forrest County
98th Percentile (ug/m^3)
Standard (35 ug/m^3)
Year 2008 2009 2010 2011 2012 2013 2014 2015 2016 2017
Annual 98th
Percentile
26 21 23 22 21 21 20 19 16 16

33
Grenada County
34
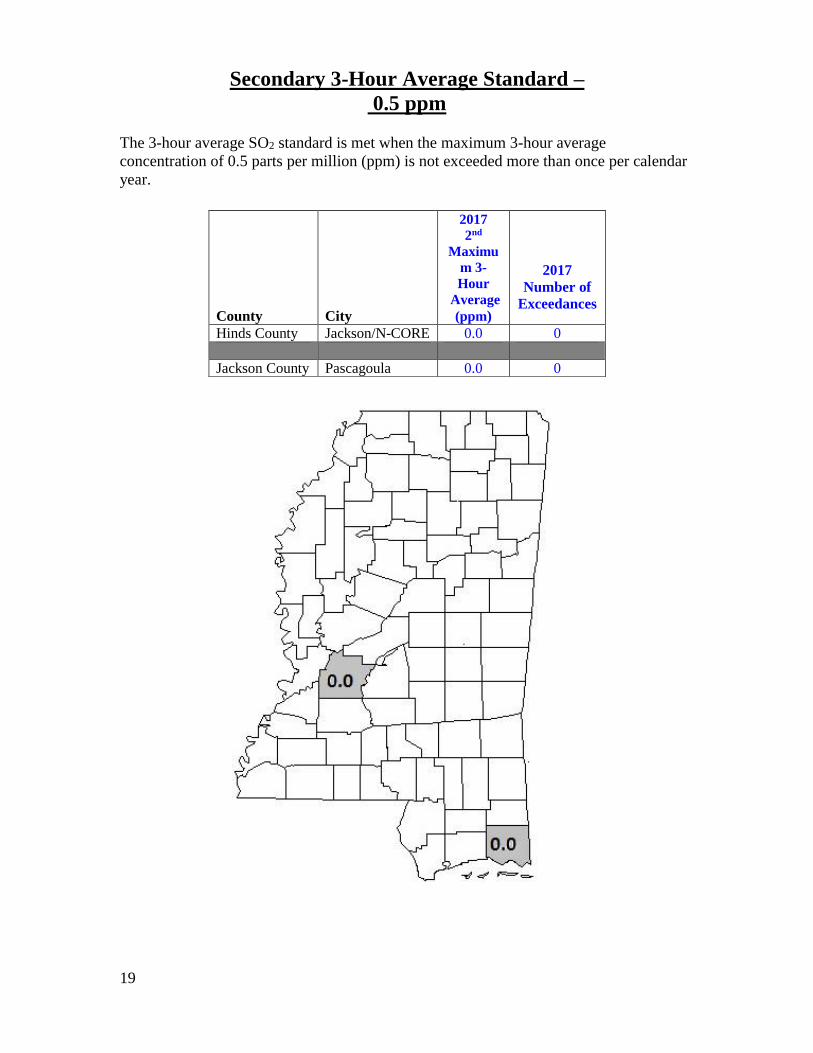
Grenada County
Monitoring Site No. 28-043-0001
Location

35
Grenada County
PM2.5
Annual Mean (µg/m3)
3-Year
Period
2006-
2008
2007-
2009
2008-
2010
2009-
2011
2010-
2012
2011-
2013
2012-
2014
2013-
2015
2014-
2016
2015-
2017
3-Year Average of
the Annual Means
* 10.4 9.8 9.4 9.5 9.3 9.0 8.1 7.5 7.2
*Incomplete Data
7
8
9
10
11
12
13
2007-09 2008-10 2009-11 2010-12 2011-13 2012-14 2013-15 2014-16 2015-17
3 Y
EAR
AV
ERA
GE
(UG
/^3
)
YEAR
3 Year Annual Mean PM2.5 Grenada County
3 Year Mean
Standard (12 ug/m^3)
6
7
8
9
10
11
12
13
2008 2009 2010 2011 2012 2013 2014 2015 2016 2017AN
NU
AL
AV
ERA
GE
(UG
/^3
)
YEAR
Annual Mean PM2.5 Grenada County
Annual Mean (ug/m^3)
Standard (12 ug/m^3)
Year 2008 2009 2010 2011 2012 2013 2014 2015 2016 2017
Annual Mean 10.3 9.2 9.8 9.2 9.4 9.3 8.4* 6.5 7.7* 7.3*

36
Grenada County
PM2.5
24-Hour Average (µg/m3)
3-Year
Period
2006-
2008
2007-
2009
2008-
2010
2009-
2011
2010-
2012
2011-
2013
2012-
2014
2013-
2015
2014-
2016
2015-
2017
3-Year Average of
the Annual 98th
Percentiles
23 23 20 20 19 20 20 18 17 14
*Incomplete Data
0
10
20
30
40
2006-08 2007-09 2008-10 2009-11 2010-12 2011-13 2012-14 2013-15 2014-16 2015-17
98
TH P
ERC
ENTI
LE (
UG
/^3
)
YEAR
3 Year 98th Percentile Mean PM2.5 Grenada County
3 Year 98th Percentile Mean (ug/m^3)Standard (35 ug/m^3)
13
18
23
28
33
38
2008 2009 2010 2011 2012 2013 2014 2015 2016 2017
98
TH P
ERC
ENTI
LE (
UG
/^3
)
YEAR
Annual 98th Percentile PM2.5 Grenada County
98th Percentile (ug/m^3)
Standard (35 ug/m^3)
Year 2008 2009 2010 2011 2012 2013 2014 2015 2016 2017
Annual 98th
Percentile
22 19 19 21 18 21 21* 14 16* 14*

37
Hancock County

38
Hancock County
Monitoring Site No. 28-045-0003
Location

39
Hancock County
8-Hour Ozone (ppb)
3–Year
Period
2006-
2008
2007-
2009
2008-
2010
2009-
2011
2010-
2012
2011-
2013
2012-
2014
2013-
2015
2014-
2016
2015-
2017
Design Value * * * 66 67 66 66 64 63 60
Year 2008 2009 2010 2011 2012 2013 2014 2015 2016 2017
Annual 4th Max. 8-
Hour Avg.
* 64 68 68 67 63 69 61 61 60
58
63
68
73
78
2009-2011 2010-2012 2011-2013 2012-2014 2013-2015 2014-2016 2015-2017
DES
IGN
VA
LUES
(P
PB
)
YEAR
3 Year Design Value 8 Hour Ozone Average for Hancock County
Design Value (ppb)
EPA Ozone Standard
60
62
64
66
68
70
72
74
76
2010 2011 2012 2013 2014 2015 2016 20174TH
DA
ILY
MA
X 8
HO
UR
AV
ERA
GE
(PP
B)
YEAR
4th Daily Max 8 Hour Ozone Average for Hancock County
4th Daily Max 8 Hour Average (ppb)
EPA Ozone Standard

40
Hancock County
PM2.5
Annual Mean (µg/m3)
3-Year
Period
2006-
2008
2007-
2009
2008-
2010
2009-
2011
2010-
2012
2011-
2013
2012-
2014
2013-
2015
2014-
2016
2015-
2017
3-Year Average of
the Annual Means
* * * 9.8 9.6 8.9 8.8 8.6 8.6 8.1
5
6
7
8
9
10
11
12
13
2009-11 2010-12 2011-13 2012-14 2013-15 2014-16 2015-17
3 Y
EAR
AV
ERA
GE
(UG
/^3
)
YEAR
3 Year Annual Mean PM2.5 Hancock County
3 Year Mean
Standard (12 ug/m^3)
7
8
9
10
11
12
13
2009 2010 2011 2012 2013 2014 2015 2016 2017
AN
NU
AL
AV
ERA
GE
(UG
/^3
)
YEAR
Annual Mean PM2.5 Hancock County
Annual Mean (ug/m^3)
Standard (12 ug/m^3)
Year 2008 2009 2010 2011 2012 2013 2014 2015 2016 2017
Annual Mean * 10.1 10.2 9.2 9.4 8.0 9.0 8.9 7.9 7.6

41
Hancock County
PM2.5
24-Hour Average (µg/m3)
3-Year
Period
2006-
2008
2007-
2009
2008-
2010
2009-
2011
2010-
2012
2011-
2013
2012-
2014
2013-
2015
2014-
2016
2015-
2017
3-Year Average of
the Annual 98th
Percentiles
* * 23 21 19 18 19 18 18 18
0
10
20
30
40
2008-10 2009-11 2010-12 2011-13 2012-14 2013-15 2014-16 2015-17
98
TH P
ERC
ENTI
LE (
UG
/^3
)
YEAR
3 Year 98th Percentile Mean PM2.5 Hancock County
3 Year 98th Percentile Mean (ug/m^3)
Standard (35 ug/m^3)
14161820222426283032343638
2009 2010 2011 2012 2013 2014 2015 2016 2017
98
TH P
ERC
ENTI
LE (
UG
/^3
)
YEAR
Annual 98th Percentile PM2.5 Hancock County
98th Percentile (ug/m^3)
Standard (35 ug/m^3)
Year 2008 2009 2010 2011 2012 2013 2014 2015 2016 2017
Annual 98th
Percentile
* 27 20 17 20 16 21 18 16 20
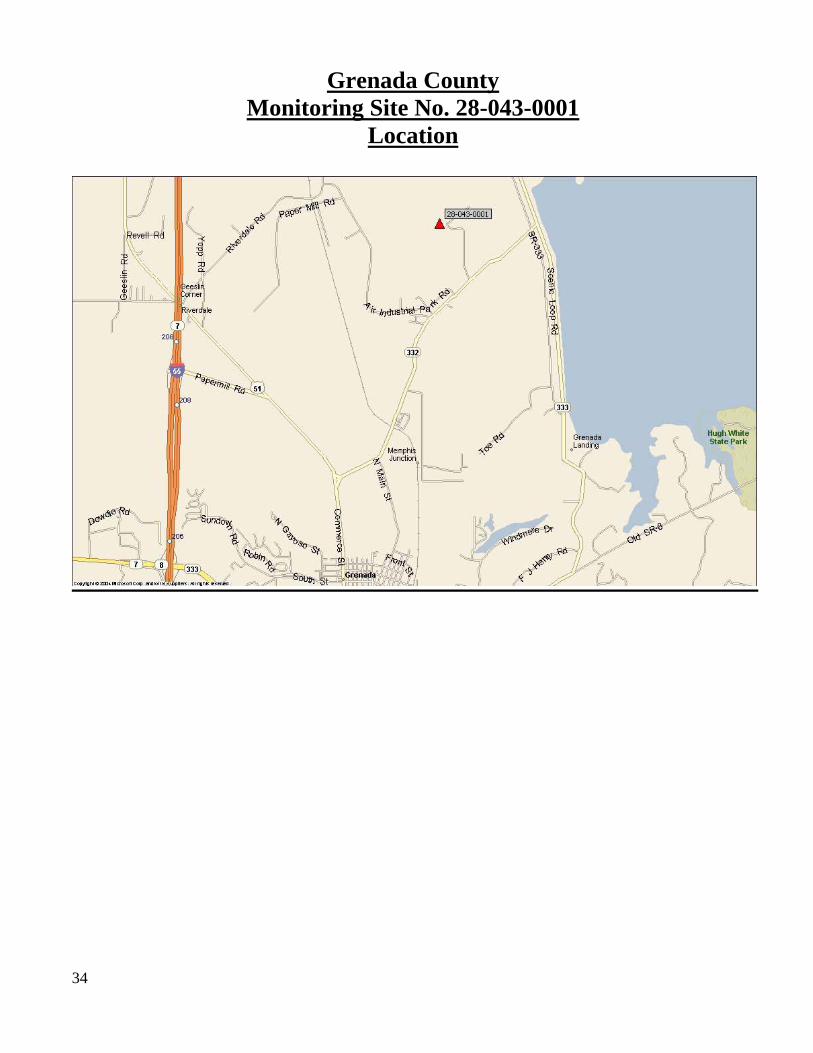
42
Harrison County

43
Harrison County
Monitoring Site No. 28-047-0008
Location

44
Harrison County
8-Hour Ozone (ppb)
3–Year
Period
2006-
2008
2007-
2009
2008-
2010
2009-
2011
2010-
2012
2011-
2013
2012-
2014
2013-
2015
2014-
2016
2015-
2017
Design Value 81 79 76 75 73 69 69 67 67 64
Year 2008 2009 2010 2011 2012 2013 2014 2015 2016 2017
Annual 4th Max.
8-Hour Avg.
78 79 73 74 73 62 73 67 63 64
60
65
70
75
80
85
2006-2008 2007-2009 2008-2010 2009-2011 2010-2012 2011-2013 2012-2014 2013-2015 2014-2016 2015-2017
DES
IGN
VA
LUES
(P
PB
)
YEAR
3 Year Design Value 8 Hour Ozone Average for Harrison County
Design Value (ppb)
EPA Ozone Standard
6062646668707274767880828486
2008 2009 2010 2011 2012 2013 2014 2015 2016 20174TH
DA
ILY
MA
X 8
HO
UR
AV
ERA
GE
(PP
B)
YEAR
4th Daily Max 8 Hour Ozone Average for Harrison County
4th Daily Max 8 Hour Average (ppb)
EPA Ozone Standard

45
Harrison County
PM2.5
Annual Mean (µg/m3)
3-Year
Period
2006-
2008
2007-
2009
2008-
2010
2009-
2011
2010-
2012
2011-
2013
2012-
2014
2013-
2015
2014-
2016
2015-
2017
3-Year Average of
the Annual Means
11.0 10.0 9.5 9.6 9.9 9.6 9.3 8.8 8.6 8.1
6
7
8
9
10
11
12
13
2006-08 2007-09 2008-10 2009-11 2010-12 2011-13 2012-14 2013-15 2014-16 2015-17
3 Y
EAR
AV
ERA
GE
(UG
/^3
)
YEAR
3 Year Annual Mean PM2.5 Harrison County
3 Year Mean
Standard (12 ug/m^3)
6
7
8
9
10
11
12
13
2008 2009 2010 2011 2012 2013 2014 2015 2016 2017
AN
NU
AL
AV
ERA
GE
(UG
/^3
)
YEAR
Annual Mean PM2.5 Harrison County
Annual Mean (ug/m^3)
Standard (12 ug/m^3)
Year 2008 2009 2010 2011 2012 2013 2014 2015 2016 2017
Annual Mean 9.8 9.0 9.6 10.1 9.9 8.8 9.2 8.4 8.1 7.8

46
Harrison County
PM2.5
24-Hour Average (µg/m3)
3-Year
Period
2006-
2008
2007-
2009
2008-
2010
2009-
2011
2010-
2012
2011-
2013
2012-
2014
2013-
2015
2014-
2016
2015-
2017
3-Year Average of
the Annual 98th
Percentiles
25 22 19 18 18 19 19 19 17 17
16
21
26
31
36
2006-08 2007-09 2008-10 2009-11 2010-12 2011-13 2012-14 2013-15 2014-16 2015-17
98
TH P
ERC
ENTI
LE (
UG
/^3
)
YEAR
3 Year 98th Percentile Mean PM2.5 Harrison County
3 Year 98th Percentile Mean (ug/m^3)
Standard (35 ug/m^3)
14.0
19.0
24.0
29.0
34.0
39.0
2008 2009 2010 2011 2012 2013 2014 2015 2016 2017
98
TH P
ERC
ENTI
LE (
UG
/^3
)
YEAR
Annual 98th Percentile PM2.5 Harrison County
98th Percentile (ug/m^3)
Standard (35 ug/m^3)
Year 2008 2009 2010 2011 2012 2013 2014 2015 2016 2017
Annual 98th
Percentile
21 19 16 18 21 18 20 18 14 20

47
Hinds County

48
Hinds County (CC)
Monitoring Site No. 28-049-0021

49
Hinds County (CC)
8-Hour Ozone (ppb)
3-Year
Period
2006-
2008
2007-
2009
2008-
2010
2009-
2011
2010-
2012
2011-
2013
2012-
2014
2013-
2015
2014-
2016
2015-
2017
Design
Value
* * * * * * * * * 61
*Incomplete Data
58
60
62
64
66
68
70
72
74
76
2015 2016 20174TH
DA
ILY
MA
X 8
HO
UR
AV
ERA
GE
(PP
B)
YEAR
4th Daily Max 8 Hour Ozone Average for Hinds County
4th Daily Max 8 Hour Average (ppb)
EPA Ozone Standard
Year 2008 2009 2010 2011 2012 2013 2014 2015 2016 2017
Annual 4th Max.
8-Hour Avg.
* * * * * * * 63 63 59

50
Hinds County (CC)
PM2.5
Annual Mean (µg/m3)
3-Year
Period
2006-
2008
2007-
2009
2008-
2010
2009-
2011
2010-
2012
2011-
2013
2012-
2014
2013-
2015
2014-
2016
2015-
2017
3-Year Average of
the Annual Means
* * * * * * * * * 8.7*
*Incomplete Data
4
6
8
10
12
2015 2016 2017
AN
NU
AL
AV
ERA
GE
(UG
/^3
)
YEAR
Annual Mean PM2.5 Hinds County
Annual Mean (ug/m^3)Standard (12 ug/m^3)
Year 2008 2009 2010 2011 2012 2013 2014 2015 2016 2017
Annual Mean * * * * * * * 9.5* 8.2 8.4*

51
Hinds County (CC)
PM2.5
24-Hour Average (µg/m3)
3-Year
Period
2006-
2008
2007-
2009
2008-
2010
2009-
2011
2010-
2012
2011-
2013
2012-
2014
2013-
2015
2014-
2016
2015-
2017
3-Year Average
of the Annual 98th
Percentiles
* * * * * * * * * 18*
*Incomplete Data
16
21
26
31
36
2015 2016 2017
98
TH P
ERC
ENTI
LE (
UG
/^3
)
YEAR
Annual 98th Percentile PM2.5 Hinds County CC
98th Percentile (ug/m^3)
Standard (35 ug/m^3)
Year 2008 2009 2010 2011 2012 2013 2014 2015 2016 2017
Annual 98th
Percentile
* * * * * * * 19.8* 16.1 17.7*

52
Hinds County (N-CORE)
Monitoring Site No. 28-049-0020

53
Hinds County (N-CORE)
8-Hour Ozone (ppb)
3-Year
Period
2006-
2008
2007-
2009
2008-
2010
2009-
2011
2010-
2012
2011-
2013
2012-
2014
2013-
2015
2014-
2016
2015-
2017
Design
Value
* * * * * * * 61* 61 60
*Incomplete Data
60
62
64
66
68
70
72
74
76
2013-2015 2014-2016 2015-2017
DES
IGN
VA
LUES
(P
PB
)
YEAR
3 Year Design Value 8 Hour Ozone Average for N-Core Hinds County
Design Value (ppb)
EPA Ozone Standard
56
58
60
62
64
66
68
70
72
74
76
2013 2014 2015 2016 20174TH
DA
ILY
MA
X 8
HO
UR
AV
ERA
GE
(PP
B)
YEAR
4th Daily Max 8 Hour Ozone Average for N-Core Hinds County
4th Daily Max 8 Hour Average (ppb)
EPA Ozone Standard
Year 2008 2009 2010 2011 2012 2013 2014 2015 2016 2017
Annual 4th Max.
8-Hour Avg.
* * * * * 60* 64 61 60 59

54
Hinds County (N-CORE)
PM2.5
Annual Mean (µg/m3)
3-Year
Period
2006-
2008
2007-
2009
2008-
2010
2009-
2011
2010-
2012
2011-
2013
2012-
2014
2013-
2015
2014-
2016
2015-
2017
3-Year Average of
the Annual Means
* * * * * * * 10.2* 9.2 8.9
*Incomplete Data
8
9
10
11
12
13
2013-15 2014-16 2015-17
3 Y
EAR
AV
ERA
GE
(UG
/^3
)
YEAR
3 Year Annual Mean PM2.5 N-Core Hinds County
3 Year Mean
Standard (12 ug/m^3)
8
8.5
9
9.5
10
10.5
11
11.5
12
12.5
2013 2014 2015 2016 2017
AN
NU
AL
AV
ERA
GE
(UG
/^3
)
YEAR
Annual Mean PM2.5 N-Core Hinds County
Annual Mean (ug/m^3)
Standard (12 ug/m^3)
Year 2008 2009 2010 2011 2012 2013 2014 2015 2016 2017
Annual Mean * * * * * 11.5* 9.7 9.4 8.4 8.8*

55
Hinds County (N-CORE)
PM2.5
24-Hour Average (µg/m3)
3-Year
Period
2006-
2008
2007-
2009
2008-
2010
2009-
2011
2010-
2012
2011-
2013
2012-
2014
2013-
2015
2014-
2016
2015-
2017
3-Year Average
of the Annual 98th
Percentiles
* * * * * * * 21* 19 18
*Incomplete Data
18
23
28
33
38
2013-15 2014-16 2015-17
98
TH P
ERC
ENTI
LE (
UG
/^3
)
YEAR
3 Year 98th Percentile Mean PM2.5 N-Core Hinds County
3 Year 98th Percentile Mean (ug/m^3)
Standard (35 ug/m^3)
151719212325272931333537
2013 2014 2015 2016 2017
98
TH P
ERC
ENTI
LE (
UG
/^3
)
YEAR
Annual 98th Percentile PM2.5 N-Core Hinds County
98th Percentile (ug/m^3)
Standard (35 ug/m^3)
Year 2008 2009 2010 2011 2012 2013 2014 2015 2016 2017
Annual 98th
Percentile
* * * * * 23* 22 18 17 19*

56
Hinds County (N-CORE)
PM10
3-Year Average of the Annual 2nd Max (µg/m3)
3-Year
Period
2006-
2008
2007-
2009
2008-
2010
2009-
2011
2010-
2012
2011-
2013
2012-
2014
2013-
2015
2014-
2016
2015-
2017
3-Year Ave of the
Annual 2nd Max
* * * * * * * 40* 46* 42*
*Incomplete Data
0
20
40
60
80
100
120
140
160
2013-15 2014-16 2015-17
3 Y
EAR
AV
E 2
ND
MA
X (
UG
/M^3
)
YEAR
3 Year 2nd Max PM10 Design Values
3 Year 2nd Max Design Value (ug/m^3)Standard (150 ug/m^3)
20
40
60
80
100
120
140
160
2013 2014 2015 2016 2017
AN
NU
AL
2N
D M
AX
(U
G/M
^3)
YEAR
Annual PM10 Second Max
Annual 2nd Max (ug/m^3
Standard (150 ug/m^3)
Year 2008 2009 2010 2011 2012 2013 2014 2015 2016 2017
Annual 2nd Max * * * * * 32* 41 48* 49* 28*
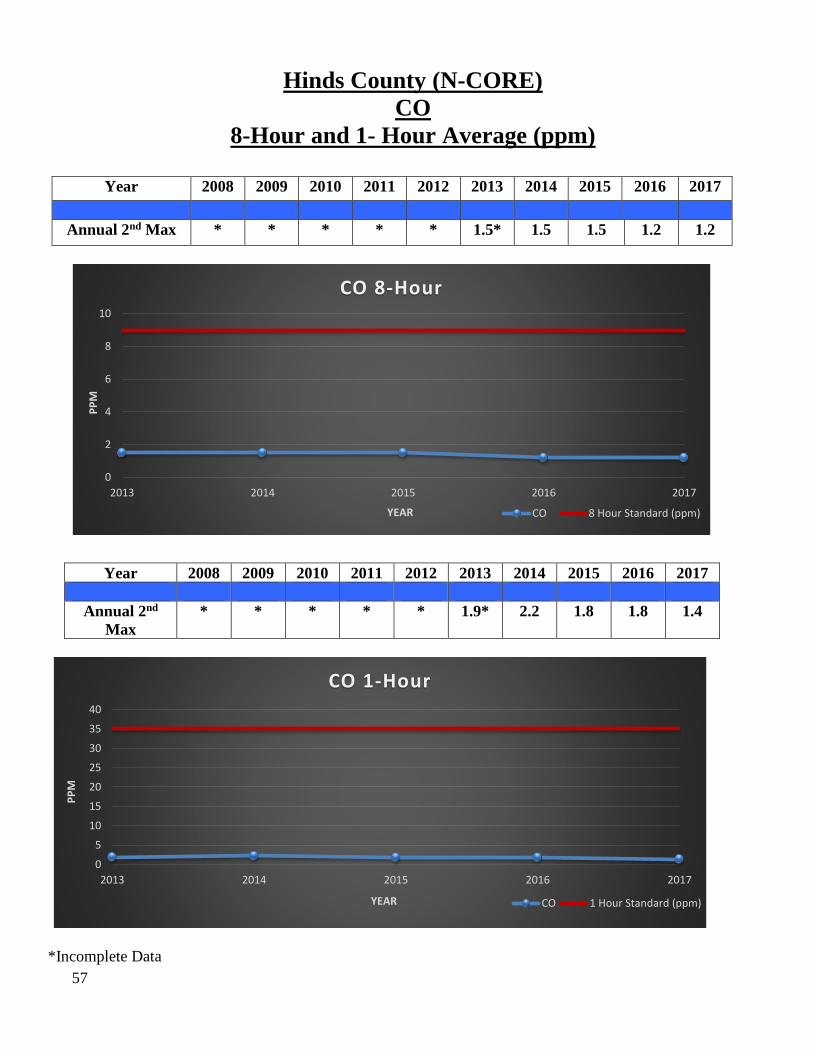
57
Hinds County (N-CORE)
CO
8-Hour and 1- Hour Average (ppm)
Year 2008 2009 2010 2011 2012 2013 2014 2015 2016 2017
Annual 2nd Max * * * * * 1.5* 1.5 1.5 1.2 1.2
*Incomplete Data
0
2
4
6
8
10
2013 2014 2015 2016 2017
PP
M
YEAR
CO 8-Hour
CO 8 Hour Standard (ppm)
0
5
10
15
20
25
30
35
40
2013 2014 2015 2016 2017
PP
M
YEAR
CO 1-Hour
CO 1 Hour Standard (ppm)
Year 2008 2009 2010 2011 2012 2013 2014 2015 2016 2017
Annual 2nd
Max
* * * * * 1.9* 2.2 1.8 1.8 1.4
58
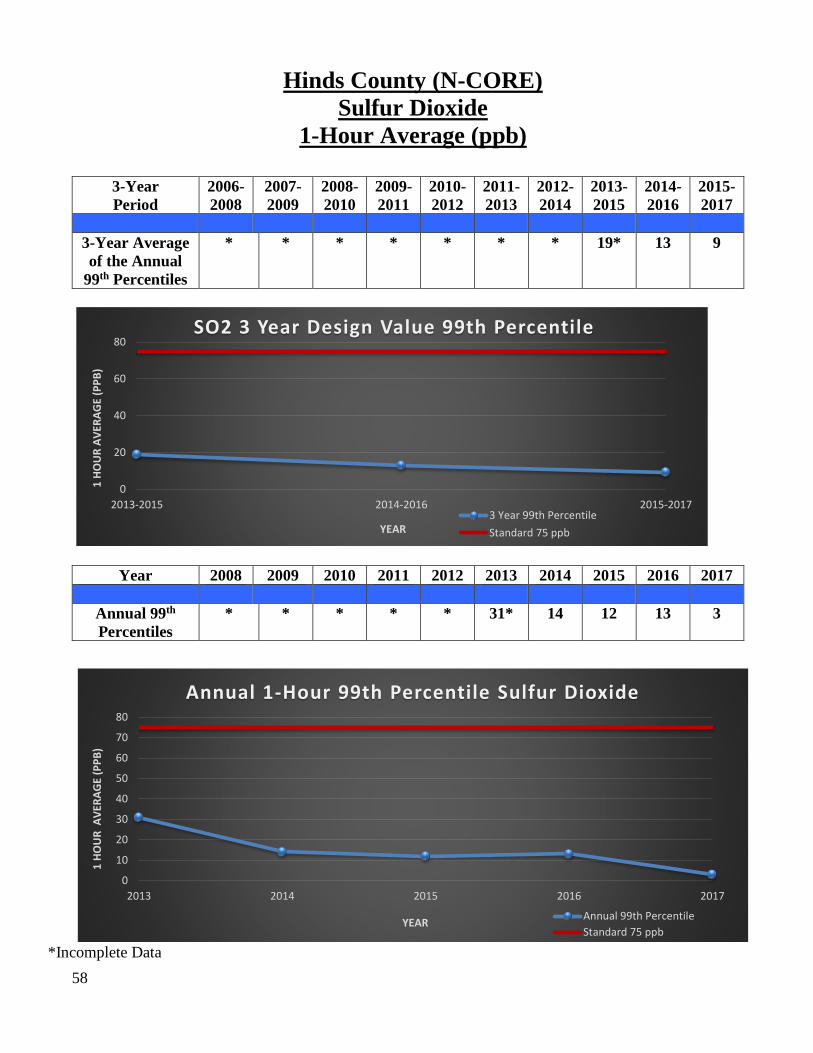
Hinds County (N-CORE)
Sulfur Dioxide
1-Hour Average (ppb)
3-Year
Period
2006-
2008
2007-
2009
2008-
2010
2009-
2011
2010-
2012
2011-
2013
2012-
2014
2013-
2015
2014-
2016
2015-
2017
3-Year Average
of the Annual
99th Percentiles
* * * * * * * 19* 13 9
Year 2008 2009 2010 2011 2012 2013 2014 2015 2016 2017
Annual 99th
Percentiles
* * * * * 31* 14 12 13 3
*Incomplete Data
0
20
40
60
80
2013-2015 2014-2016 2015-2017
1 H
OU
R A
VER
AG
E (P
PB
)
YEAR
SO2 3 Year Design Value 99th Percentile
3 Year 99th Percentile
Standard 75 ppb
0
10
20
30
40
50
60
70
80
2013 2014 2015 2016 2017
1 H
OU
R A
VER
AG
E (P
PB
)
YEAR
Annual 1-Hour 99th Percentile Sulfur Dioxide
Annual 99th Percentile
Standard 75 ppb

59
Hinds County (N-CORE)
Sulfur Dioxide
3-Hour Annual 2nd Max (ppm)
Hinds County (N-CORE)
Sulfur Dioxide
Annual Mean (ppm)
*Incomplete Data
0
0.2
0.4
0.6
2013 2014 2015 2016 2017
3 H
OU
R A
VER
AG
E (P
PM
)
YEAR
3-Hour Sulfur Dioxide
3 Hour Values
Standard 0.5ppm
0
0.01
0.02
0.03
0.04
2013 2014 2015 2016 2017
AN
NU
AL
MEA
N (
PP
M)
YEAR
Annual Mean Sulfur Dioxide
Annual Mean
Standard 0.03 ppm
Year 2008 2009 2010 2011 2012 2013 2014 2015 2016 2017
Annual 2nd
Max
* * * * * 0.0* 0.0 0.0 0.0 0.0
Year 2008 2009 2010 2011 2012 2013 2014 2015 2016 2017
Annual Mean * * * * * 0.00* 0.00 0.00 0.00 0.00

60
Hinds County (N-CORE)
Sulfur Dioxide
24-Hour 2nd Max (ppm)
*Incomplete Data
0
0.02
0.04
0.06
0.08
0.1
0.12
0.14
0.16
2013 2014 2015 2016 2017
24
HR
AV
ERA
GE
(PP
M)
YEAR
24-Hour Sulfur Dioxide
24 Hour Values
Standard 0.14 ppm
Year 2008 2009 2010 2011 2012 2013 2014 2015 2016 2017
Annual 2nd
Max
* * * * * 0.00* 0.00 0.00 0.00 0.00

61
Jackson County

62
Jackson County
Monitoring Site No. 28-059-0006
Location

63
Jackson County
8-Hour Ozone (ppb)
3-Year
Period
2006-
2008
2007-
2009
2008-
2010
2009-
2011
2010-
2012
2011-
2013
2012-
2014
2013-
2015
2014-
2016
2015-
2017
Design
Value
78 75 74 72 73 70 71 68 67 63
Year 2008 2009 2010 2011 2012 2013 2014 2015 2016 2017
Annual 4th Max. 8-
Hour Avg.
76 73 73 72 74 66 75 65 62 64
62
64
66
68
70
72
74
76
78
80
82
84
86
2006-2008 2007-2009 2008-2010 2009-2011 2010-2012 2011-2013 2012-2014 2013-2015 2014-2016 2015-2017
DES
IGN
VA
LUES
(P
PB
)
YEAR
3 Year Design Value 8 Hour Ozone Average for Jackson County
Design Value (ppb)
EPA Ozone Standard
60
62
64
66
68
70
72
74
76
78
80
82
84
2008 2009 2010 2011 2012 2013 2014 2015 2016 20174TH
DA
ILY
MA
X 8
HO
UR
AV
ERA
GE
(PP
B)
YEAR
4th Daily Max 8 Hour Ozone Average for Jackson County
4th Daily Max 8 Hour Average (ppb)
EPA Ozone Standard

64
Jackson County
PM2.5
Annual Mean (µg/m3)
3-Year
Period
2006-
2008
2007-
2009
2008-
2010
2009-
2011
2010-
2012
2011-
2013
2012-
2014
2013-
2015
2014-
2016
2015-
2017
3-Year Average of
the Annual Means
11.0 10.2 9.6 9.5 9.4 9.2 9.2 9.2 8.8 8.3
8
9
10
11
12
13
2006-08 2007-09 2008-10 2009-11 2010-12 2011-13 2012-14 2013-15 2014-16 2015-17
3 Y
EAR
AV
ERA
GE
(UG
/^3
)
YEAR
3 Year Annual Mean PM2.5 Jackson County
3 Year Mean
Standard (12 ug/m^3)
7
8
9
10
11
12
13
2008 2009 2010 2011 2012 2013 2014 2015 2016 2017
AN
NU
AL
AV
ERA
GE
(UG
/^3
)
YEAR
Annual Mean PM2.5 Jackson County
Annual Mean (ug/m^3)
Standard (12 ug/m^3)
Year 2008 2009 2010 2011 2012 2013 2014 2015 2016 2017
Annual Mean 10.0 9.3 9.5 9.6 9.2 8.9 9.6 9.0 7.8 8.0

65
Jackson County
PM2.5
24-Hour Average (µg/m3)
3-Year
Period
2006-
2008
2007-
2009
2008-
2010
2009-
2011
2010-
2012
2011-
2013
2012-
2014
2013-
2015
2014-
2016
2015-
2017
3-Year Average
of the Annual
98th Percentiles
25 23 23 21 20 20 20 19 17 18
16
21
26
31
36
2006-08 2007-09 2008-10 2009-11 2010-12 2011-13 2012-14 2013-15 2014-16 2015-17
98
TH P
ERC
ENTI
LE (
UG
/^3
)
YEAR
3 Year 98th Percentile Mean PM2.5 Jackson County
3 Year 98th Percentile Mean (ug/m^3
Standard (35 ug/m^3)
10
15
20
25
30
35
40
2008 2009 2010 2011 2012 2013 2014 2015 2016 2017
98
TH P
ERC
ENTI
LE (
UG
/^3
)
YEAR
Annual 98th Percentile PM2.5 Jackson County
98th Percentile (ug/m^3)
Standard (35 ug/m^3)
Year 2008 2009 2010 2011 2012 2013 2014 2015 2016 2017
Annual 98th
Percentile
21 25 19 20 22 19 20 19 14 20

66
Jackson County
Nitrogen Dioxide
Annual Average (ppb)
Year 2008 2009 2010 2011 2012 2013 2014 2015 2016 2017
Annual
Average
6 5 5 5 4 4 4 4 4* 4
*Incomplete Data
0
10
20
30
40
50
60
2008 2009 2010 2011 2012 2013 2014 2015 2016 2017
PP
B
YEAR
Annual Mean NO2
Annual Mean
Standard 53ppb

67
Jackson County
Nitrogen Dioxide
1-Hour Average (ppb)
3-Year
Period
2006-
2008
2007-
2009
2008-
2010
2009-
2011
2010-
2012
2011-
2013
2012-
2014
2013-
2015
2014-
2016
2015-
2017
3-Year Average
of the Annual
98th Percentiles
40 37 35 32 34 33 32 31 29* 29*
Year 2008 2009 2010 2011 2012 2013 2014 2015 2016 2017
Annual 98th
Percentiles
44 27 35 35 32 33 29 30 28* 30
*Incomplete Data
0
20
40
60
80
100
120
2008 2009 2010 2011 2012 2013 2014 2015 2016 2017
PP
B
YEAR
NO2 98th Percentile Design Value
98th Percentile DV
Standard 100ppb
0
20
40
60
80
100
120
2008 2009 2010 2011 2012 2013 2014 2015 2016 2017
PP
B
YEAR
NO2 Annual 98th Percentile
98th Percentile
Standard 100ppb

68
Jackson County
Sulfur Dioxide
1-Hour Average (ppb)
3-Year
Period
2006-
2008
2007-
2009
2008-
2010
2009-
2011
2010-
2012
2011-
2013
2012-
2014
2013-
2015
2014-
2016
2015-
2017
3-Year Average
of the Annual
99th Percentiles
46 37 35 29 27 23 27 28 21 12
Year 2008 2009 2010 2011 2012 2013 2014 2015 2016 2017
Annual 99th
Percentiles
39 27 38 21 21 27 32 24 6 5
0
20
40
60
80
2006-08 2007-09 2008-10 2009-11 2010-12 2011-13 2012-14 2013-15 2014-16 2015-17
1 H
OU
R A
VER
AG
E (P
PB
)
YEAR
SO2 3 Year Design Value 99th Percentile
3 Year 99th Percentile DV
Standard 75ppb
0
10
20
30
40
50
60
70
80
2008 2009 2010 2011 2012 2013 2014 2015 2016 2017
1 H
OU
R A
VER
AG
E (P
PB
)
YEAR
Annual 1-Hour 99th Percentile Sulfur Dioxide
Annual 99th Percentile
Standard 75ppb

69
Jackson County
Sulfur Dioxide
3-Hour Annual 2nd Max (ppm)
Jackson County
Sulfur Dioxide
Annual Mean (ppm)
0
0.1
0.2
0.3
0.4
0.5
0.6
2008 2009 2010 2011 2012 2013 2014 2015 2016 2017
3 H
OU
R A
VER
AG
E (P
PM
)
YEAR
3-Hour Sulfur Dioxide
3 Hour ValuesStandard 0.5 ppm
0
0.01
0.02
0.03
0.04
2008 2009 2010 2011 2012 2013 2014 2015 2016 2017
AN
NU
AL
MEA
N (
PP
M)
YEAR
Annual Mean Sulfur Dioxide
Annual Mean
Standard 0.03 ppm
Year 2008 2009 2010 2011 2012 2013 2014 2015 2016 2017
Annual 2nd
Max
0.0 0.0 0.0 0.0 0.0 0.0 0.0 0.0 0.0 0.0
Year 2008 2009 2010 2011 2012 2013 2014 2015 2016 2017
Annual Mean 0.00 0.00 0.00 0.00 0.00 0.00 0.00 0.00 0.00 0.00

70
Jackson County
Sulfur Dioxide
24-Hour 2nd Max (ppm)
0
0.02
0.04
0.06
0.08
0.1
0.12
0.14
0.16
2008 2009 2010 2011 2012 2013 2014 2015 2016 2017
24
HR
AV
ERA
GE
(PP
M)
YEAR
24-Hour Sulfur Dioxide
24 Hour Values
Standard 0.14 ppm
Year 2008 2009 2010 2011 2012 2013 2014 2015 2016 2017
Annual 2nd
Max
0.01 0.01 0.01 0.01 0.01 0.00 0.00 0.00 0.00 0.00

71
Lauderdale County

72
Lauderdale County
Monitoring Site No. 28-075-0003
Location

73
Lauderdale County
8-Hour Ozone (ppb)
3-Year
Period
2006-
2008
2007-
2009
2008-
2010
2009-
2011
2010-
2012
2011-
2013
2012-
2014
2013-
2015
2014-
2016
2015-
2017
Design Value 71 64 61 62 63 63 60 58 57 56
56586062646668707274767880828486
2006-2008 2007-2009 2008-2010 2009-2011 2010-2012 2011-2013 2012-2014 2013-2015 2014-2016 2015-2017
DES
IGN
VA
LUES
(P
PB
)
YEAR
3 Year Design Value 8 Hour Ozone Average for Lauderdale County
Design Value (ppb)
EPA Ozone Standard
5456586062646668707274767880828486
2008 2009 2010 2011 2012 2013 2014 2015 2016 2017
4TH
DA
ILY
MA
X 8
HO
UR
AV
ERA
GE
(PP
B)
YEAR
4th Daily Max 8 Hour Ozone Average for Lauderdale County
4th Daily Max 8 Hour Average (ppb)
EPA Ozone Standard
Year 2008 2009 2010 2011 2012 2013 2014 2015 2016 2017
Annual 4th Max.
8-Hour Avg.
64 58 62 66 63 61 58 56 58 55

74
Lee County

75
Lee County
Monitoring Site No. 28-081-0005
Location

76
Lee County
8-Hour Ozone (ppb)
3-Year
Period
2006-
2008
2007-
2009
2008-
2010
2009-
2011
2010-
2012
2011-
2013
2012-
2014
2013-
2015
2014-
2016
2015-
2017
Design Value 72 68 66 65 66 64 62 59 59 58
586062646668707274767880828486
2006-2008 2007-2009 2008-2010 2009-2011 2010-2012 2011-2013 2012-2014 2013-2015 2014-2016 2015-2017
DES
IGN
VA
LUES
(P
PB
)
YEAR
3 Year Design Value 8 Hour Ozone Average for Lee County
Design Value (ppb)
EPA Ozone Standard
5456586062646668707274767880828486
2008 2009 2010 2011 2012 2013 2014 2015 2016 20174TH
DA
ILY
MA
X 8
HO
UR
AV
ERA
GE
(PP
B)
YEAR
4th Daily Max 8 Hour Ozone Average for Lee County
4th Daily Max 8 Hour Average (ppb)
EPA Ozone Standard
Year 2008 2009 2010 2011 2012 2013 2014 2015 2016 2017
Annual 4th Max.
8-Hour Avg.
68 63 68 64 67 61 59 58 61 55

77
Appendix 2
Data Completeness
By Pollutant

78
8-Hour Ozone
Data Completeness
Standard
The standards for 8-hour ozone data completeness are:
The daily maximum 8-hour average concentrations are available for at least 75%, on
average, of the designated sampling days for any one year.
The daily maximum 8-hour average concentrations are available for at least 90%, on
average, of the designated sampling days for a three-year period.
Annual 3-Year
Data Completeness Data Completeness
County Standard 2015 2016 2017 Standard 2015-2017
Bolivar 75% 99% 98% 93% 90% 97%
DeSoto 75% 99% 88% 96% 90% 94%
Hancock 75% 96% 94% 97% 90% 96%
Harrison 75% 90% 98% 91% 90% 93%
Hinds CC 75% 83% 98% 98% 90% 93%
Hinds NC 75% 93% 94% 89% 90% 92%
Jackson 75% 98% 98% 83% 90% 93%
Lauderdale 75% 98% 86% 99% 90% 94%
Lee 75% 96% 97% 95% 90% 96%

79
PM2.5
Data Completeness
Standard
The standard for PM2.5 data completeness is:
A year meets the requirements when at least 75% of the scheduled sampling days for each
quarter have valid data.
2015 Quarterly PM2.5 Data Completeness
County Standard January - March April - June July - September October - December
DeSoto 75% 87% 93% 97% 100%
Forrest 75% 100% 100% 97% 93%
Grenada 75% 97% 97% 97% 93%
Hancock 75% 100% 100% 97% 93%
Harrison 75% 90% 100% 100% 100%
Hinds CC* * 83% 90% 100%
Hinds NC 75% 97% 87% 94% 100%
Jackson 75% 93% 97% 100% 100%
*Incomplete Data: Hinds CC Site not operational until April 2015.

80
2016 Quarterly PM2.5 Data Completeness
County Standard January - March April - June July - September October - December
DeSoto 75% 94% 87% 71% 87%
Forrest 75% 100% 90% 97% 97%
Grenada 75% 97% 87% 74% 100%
Hancock 75% 100% 93% 97% 100%
Harrison 75% 94% 93% 100% 93%
Hinds CC* 75% 94% 93% 84% 97%
Hinds NC 75% 94% 100% 100% 93%
Jackson 75% 93% 97% 100% 100%
2017 Quarterly PM2.5 Data Completeness
County Standard January - March April - June July - September October - December
DeSoto 75% 93% 67% 90% 94%
Forrest 75% 93% 90% 97% 90%
Grenada 75% 90% 71% 97% 81%
Hancock 75% 97% 90% 100% 87%
Harrison 75% 93% 90% 93% 77%
Hinds CC 75% 97% 74% 97% 81%
Hinds NC 75 73% 74% 97% 81%
Jackson 75% 90% 90% 97% 87%
*Incomplete Data: Hinds CC Site not operational until April 2015.

81
PM10
Data Completeness
Standard
The standard for PM10 data completeness is:
A year meets the requirements when at least 75% of the scheduled sampling days for each
quarter have valid data.
2015 Quarterly PM10 Data Completeness
County Standard January - March April - June July - September October - December
Hinds NC 75% 73% 67% 87% 100%
2016 Quarterly PM10 Data Completeness
County Standard January - March April - June July - September October - December
Hinds NC 75% 88% 93% 100% 73%
2017 Quarterly PM10 Data Completeness
County Standard January - March April - June July - September October - December
Hinds NC 75% 93% 69% 100% 67%

82
Carbon Monoxide
Data Completeness
Standard
The standard for CO data completeness is:
An 8-hour average shall be considered valid if at least 75% of the hourly averages for the 8-
hour period are available.
2017 Quarterly CO Data Completeness
County Standard January - March April - June July - September October - December
Hinds NC 75% 94% 92% 68% 94%
.

83
Nitrogen Dioxide
Data Completeness
Standards
The standards for nitrogen dioxide data completeness are:
An annual mean must be based upon hourly data that are at least 75% complete for the
scheduled sampling days in each year.
A 1-hour design value is valid if it encompasses three consecutive calendar years of
complete data. A year meets data completeness requirements when all 4 quarters are
complete. A quarter is complete when at least 75% of the sampling days for each quarter
have complete data. A sampling day has complete data if 75% of the hourly concentration
values are reported.
2017 Annual Mean Nitrogen Dioxide Data Completeness
County Standard 2017
Jackson 75% 90%
2015 Quarterly 1-Hour Nitrogen Dioxide Data Completeness
County Standard January - March April - June July - September October - December
Jackson 75% 94% 92% 94% 93%
2016 Quarterly 1-Hour Nitrogen Dioxide Data Completeness
County Standard January - March April - June July - September October - December
Jackson 75% 93% 93% 91% 38%
2017 Quarterly 1-Hour Nitrogen Dioxide Data Completeness
County Standard January - March April - June July - September October - December
Jackson 75% 92% 94% 89% 87%
84
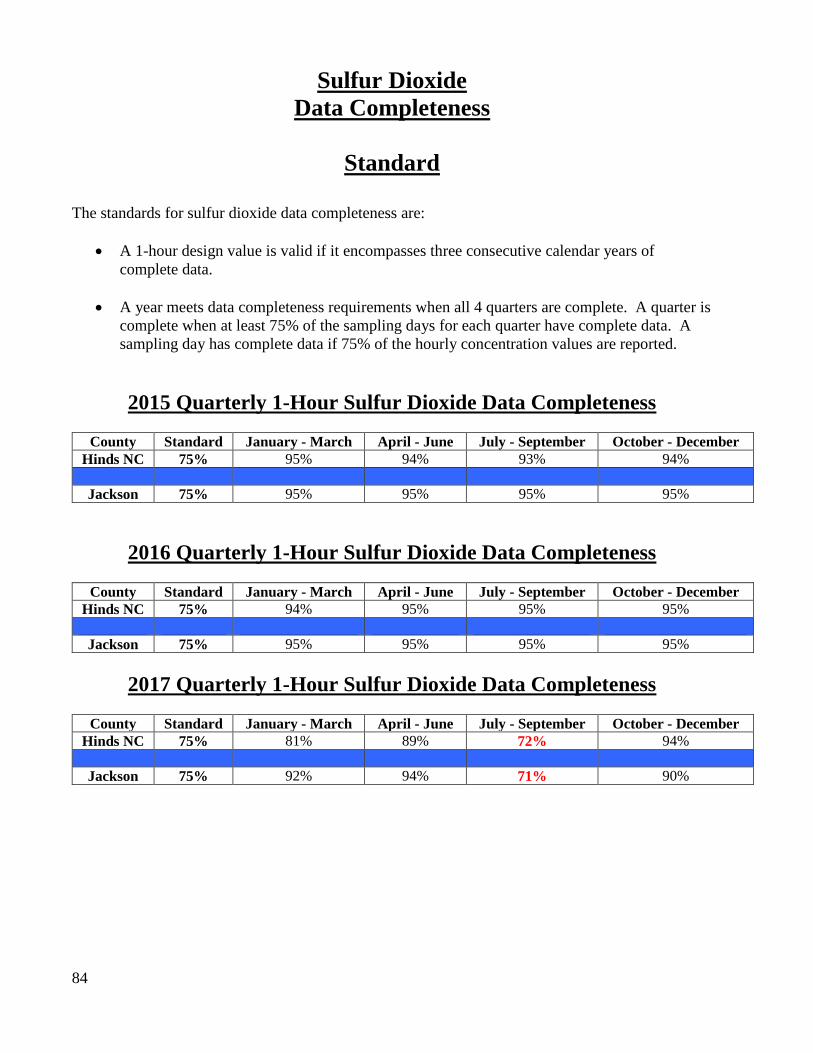
Sulfur Dioxide
Data Completeness
Standard
The standards for sulfur dioxide data completeness are:
A 1-hour design value is valid if it encompasses three consecutive calendar years of
complete data.
A year meets data completeness requirements when all 4 quarters are complete. A quarter is
complete when at least 75% of the sampling days for each quarter have complete data. A
sampling day has complete data if 75% of the hourly concentration values are reported.
2015 Quarterly 1-Hour Sulfur Dioxide Data Completeness
County Standard January - March April - June July - September October - December
Hinds NC 75% 95% 94% 93% 94%
Jackson 75% 95% 95% 95% 95%
2016 Quarterly 1-Hour Sulfur Dioxide Data Completeness
County Standard January - March April - June July - September October - December
Hinds NC 75% 94% 95% 95% 95%
Jackson 75% 95% 95% 95% 95%
2017 Quarterly 1-Hour Sulfur Dioxide Data Completeness
County Standard January - March April - June July - September October - December
Hinds NC 75% 81% 89% 72% 94%
Jackson 75% 92% 94% 71% 90%