Embed Size (px)
Citation preview
1
DPP February 2015 South
System Impact Study Report
09/26/2016
Prepared by
Resource Interconnection and Planning
Midcontinent Independent System Operator
Lakeway Two
3850 N. Causeway Blvd. Suite 442
Metairie, LA 70002
2
Table of Contents 1. Executive Summary .............................................................................................................................. 3
2. Adhoc Group Details ............................................................................................................................ 4
3. Model Development and Study Assumptions ....................................................................................... 4
A. Base Case Models ............................................................................................................................. 4
B. Monitored Elements .......................................................................................................................... 4
C. Contingencies .................................................................................................................................... 5
D. Study Methodology ........................................................................................................................... 6
E. Performance Criteria ......................................................................................................................... 6
4. Thermal Analysis Results ..................................................................................................................... 6
5. Voltage Analysis Results ...................................................................................................................... 6
6. Stability Analysis .................................................................................................................................. 6
7. Short Circuit Analysis ........................................................................................................................... 7
8. Deliverability Study .............................................................................................................................. 7
9. Shared Network Upgrades .................................................................................................................... 7
10. Impact on ANO thermal limits .......................................................................................................... 7
11. Affected System Analysis ................................................................................................................. 8
12. HIS /SSTI (Harmonic Impedance Scanning /Sub-synchronous Torsional Interaction) study .......... 8
Appendix ....................................................................................................................................................... 9
Appendix A Stability Analysis Reports ........................................................................................................ 9
Appendix B SPP Affected System Study ..................................................................................................... 9
Appendix C HIS /SSTI (Harmonic Impedance Scanning /Sub-synchronous Torsional Interaction) study.. 9
Table 1 Project Details .................................................................................................................................. 3
Table 2 Monitored Elements ......................................................................................................................... 5
3
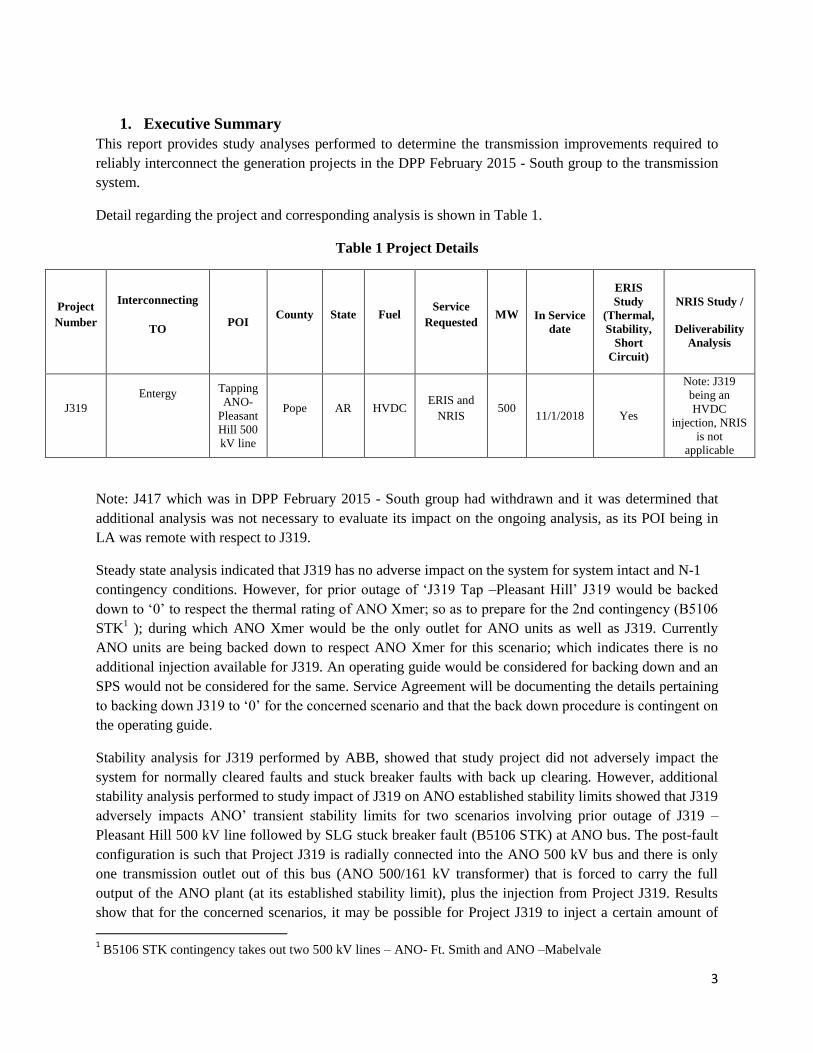
1. Executive Summary
This report provides study analyses performed to determine the transmission improvements required to
reliably interconnect the generation projects in the DPP February 2015 - South group to the transmission
system.
Detail regarding the project and corresponding analysis is shown in Table 1.
Table 1 Project Details
Project
Number
Interconnecting
TO POI
County State Fuel Service
Requested MW In Service
date
ERIS
Study
(Thermal,
Stability,
Short
Circuit)
NRIS Study /
Deliverability
Analysis
J319
Entergy
Tapping
ANO-
Pleasant
Hill 500
kV line
Pope AR HVDC ERIS and
NRIS 500
11/1/2018 Yes
Note: J319
being an
HVDC
injection, NRIS
is not
applicable
Note: J417 which was in DPP February 2015 - South group had withdrawn and it was determined that
additional analysis was not necessary to evaluate its impact on the ongoing analysis, as its POI being in
LA was remote with respect to J319.
Steady state analysis indicated that J319 has no adverse impact on the system for system intact and N-1
contingency conditions. However, for prior outage of ‘J319 Tap –Pleasant Hill’ J319 would be backed
down to ‘0’ to respect the thermal rating of ANO Xmer; so as to prepare for the 2nd contingency (B5106
STK1 ); during which ANO Xmer would be the only outlet for ANO units as well as J319. Currently
ANO units are being backed down to respect ANO Xmer for this scenario; which indicates there is no
additional injection available for J319. An operating guide would be considered for backing down and an
SPS would not be considered for the same. Service Agreement will be documenting the details pertaining
to backing down J319 to ‘0’ for the concerned scenario and that the back down procedure is contingent on
the operating guide.
Stability analysis for J319 performed by ABB, showed that study project did not adversely impact the
system for normally cleared faults and stuck breaker faults with back up clearing. However, additional
stability analysis performed to study impact of J319 on ANO established stability limits showed that J319
adversely impacts ANO’ transient stability limits for two scenarios involving prior outage of J319 –
Pleasant Hill 500 kV line followed by SLG stuck breaker fault (B5106 STK) at ANO bus. The post-fault
configuration is such that Project J319 is radially connected into the ANO 500 kV bus and there is only
one transmission outlet out of this bus (ANO 500/161 kV transformer) that is forced to carry the full
output of the ANO plant (at its established stability limit), plus the injection from Project J319. Results
show that for the concerned scenarios, it may be possible for Project J319 to inject a certain amount of
1 B5106 STK contingency takes out two 500 kV lines – ANO- Ft. Smith and ANO –Mabelvale
4
power into the grid. However, considering that the thermal rating of the ANO 500/161 kV auto-
transformer is more limiting for these two events, MISO and Entergy concluded that J319 needs to back
down to zero (0) MW after the prior outage of J319 – Pleasant Hill 500 kV line in order to reduce the
flow below the thermal limits of the ANO 500/161 kV auto-transformer. Thus maximum allowable
injections as derived in additional stability analysis are “moot” because J319 will be required to back
down to 0 MW following the prior-outage of the J319 Tap – Pleasant Hill 500 kV line based on thermal
considerations i.e., emergency rating of the ANO 500/161 kV auto-transformer.
HIS /SSTI (Harmonic Impedance Scanning and Sub-synchronous Torsional Interaction study) results /
plots provides the J319 Interconnection Customer for use in their filter design calculations and convertors
in the HVDC detailed design phase.
Note:
1) Details pertaining to upgrades/ costs/ execution plan for interconnection of the generating facility
at the POI will be documented in the Facility Study for Interconnecting Generator (phase 1)
2) Facilities that have been included as base case assumptions and the level of interconnection
service that would be conditional upon these facilities being in service will be documented in the
Service Agreement.
3) Analysis performed shows there are no projects for Shared Network Upgrade cost allocation.
2. Adhoc Group Details
The Ad-Hoc group for the DPP February 2015 South consisted of Entergy, Cleco, AECC, Ameren, SPP
and the interconnecting customers of project J319. The group reviewed the models, assumptions, and
results and provided input during the course of the study.
3. Model Development and Study Assumptions
A. Base Case Models
The following summer peak and shoulder /summer off peak 2018 and 2025 models were used for the
study. These models were derived from the DPP August 2014 models by applying appropriate MTEP A
projects.
1. 2018 Summer Peak and Shoulder /Summer off peak -Bench and Study cases
2. 2025 Summer Peak and Shoulder /Summer off peak -Bench and Study cases
Benchmark cases were created without generating facilities in the DPP February 2015 South group. Study
cases were created by adding generating facilities in the DPP February 2015 South group.
B. Monitored Elements
The study areas defined in Table 2 were monitored in the analysis. Facilities in the study areas were
monitored for system intact NERC category A conditions (system intact), and contingency conditions
NERC category B & NERC Category C conditions. Under NERC category A conditions (system intact)

5
branches were monitored for loading above the normal (PSSE Rating A) and for NERC category B and C
conditions, branches were monitored for emergency (PSSE Rating B). (EES, EAI and EMI use
emergency ratings as normal ratings). Bus voltages were monitored per the limits as shown in Table 2.
Table 2 Monitored Elements
Area/ Owner Monitored Facilities Voltage Limits
Pre-Disturbance Post-Disturbance
327 / EES & EES-EAI 69 kV and above 0.95/1.05 0.92/1.05
351 / EES & EES-EMI 69 kV and above 0.95/1.05 0.92/1.05
332 /LAGN 69 kV to 300 kV 0.95/1.05 0.95/1.05
349 /SMEPA 69 kV and above 0.95/1.05 0.90/1.05
502 /CLECO 69 kV and above 0.95/1.05 0.90/1.1
503 /LAFA 69 kV and above 0.95/1.05 0.90/1.05
504 /LEPA 69 kV and above 0.95/1.05 0.95/1.05
330 /AECI 69 kV and above 0.95/1.05 0.95/1.05
333 /CWLD 69 kV and above 0.95/1.05 0.90/1.1
356 /AMMO 69 kV and above 0.95/1.05 0.90/1.1
357 /AMIL 69 kV and above 0.95/1.05 0.90/1.1
346/SOCO 69 kV and above 0.95/1.05 0.95/1.05
347/TVA 69 kV and above 0.95/1.05 0.95/1.05
350/PS 69 kV and above 0.95/1.05 0.95/1.05
515/SPP-SWPA 69 kV and above 0.95/1.05 0.95/1.05
520/SPP-AEPW 69 kV and above 0.95/1.05 0.95/1.05
524/SPP-OKGE 69 kV and above 0.95/1.05 0.95/1.05
544/SPP-EMDE 69 kV and above 0.95/1.05 0.95/1.05
C. Contingencies
A variety of contingencies were considered for steady state analysis:
1. NERC category A with system intact (no contingencies)
2. NERC category B contingencies
a. Single element outages, at buses with a nominal voltage of 69 kV and above, in the areas
(327,351,332,349,502,503,504,330,330, 356, 357, 346,347,350,515,520,524,544)
b. Multiple element outages initiated by a fault with normal clearing in areas
(327,351,332,349,502,503,504)
3. NERC Category C
a. Selected NERC Category C events provided by adhoc study group in the study region of
areas (327)
4. For all the contingencies and post-disturbance analyses, cases were solved with transformer tap
adjustment enabled, area interchange adjustment disabled, phase shifter adjustment disabled
(fixed) and switched shunt adjustment enabled.
6
D. Study Methodology
Non-linear (AC) contingency analysis was performed on the benchmark and study cases, and the
incremental impact of the DPP February 2015 generating facilities was evaluated by comparing the steady
state performance of the transmission system in the bench mark and study cases. Analysis was performed
using PSSE version 32.2.1 and PSS MUST version 11.0.1.
E. Performance Criteria
A branch is considered a thermal constraint if the following conditions are met:
1. branch is loaded above its applicable normal or emergency rating for the post-change case
2. generator (ER/NR) has a larger than 20% DF on the overloaded facility under post contingent
condition or 5% DF under system intact condition,
3. the megawatt impact due to the generator is greater than or equal to 20% of the applicable rating
(normal or emergency) of the overloaded facility, or
4. the overloaded facility or the overload-causing contingency is at generator’s outlet.
A bus is considered a voltage constraint if both of the following conditions are met:
1. the bus voltage is outside of applicable normal or emergency limits for the post change case, and
2. the change in bus voltage is greater than 0.01 per unit.
All generators must mitigate thermal injection constraints and voltage constraints in order to obtain any
type of Interconnection Service. Further, all generators requesting Network Resource Interconnection
Service (NRIS) must mitigate constraints found by using the deliverability algorithm, to meet the system
performance criteria for NERC category A, and B events, if DFAX due to the generator is equal to or
greater than 5%.
4. Thermal Analysis Results
In the South study area, the shoulder load was 88 % summer peak load, hence only summer peak cases
were studied. No constraints were seen in thermal analysis for 2018 and 2025 Summer Peak scenarios
due to project J319.
No constraints were identified when the transmission system comprising of control areas listed in Table 2
were evaluated for Category C contingencies for area 327 causing facilities impacted by the project by a
DFAX values larger than 20% DF on the overloaded facility under post contingent condition or 5% DF
under system intact condition and with loadings of up to 125% or more of their emergency rating.
5. Voltage Analysis Results
The voltage analysis results on 2018 and 2025 Summer Peak analysis indicate that the study generator
J319 does not cause any voltage violations.
6. Stability Analysis
Stability analysis for J319 performed by ABB, shows that study projects did not adversely impact the
system for normally cleared faults and stuck breaker faults with back up clearing. However, additional
7
stability analysis performed to study impact of J319 on ANO established stability limits showed that J319
adversely impacts ANO’ transient stability limits for two scenarios involving prior outage of J319 –
Pleasant Hill 500 kV line followed by SLG stuck breaker fault (B5106 STK) at ANO bus. The post-fault
configuration is such that Project J319 is radially connected into the ANO 500 kV bus and there is only
one transmission outlet out of this bus (ANO 500/161 kV transformer) that is forced to carry the full
output of the ANO plant (at its established stability limit), plus the injection from Project J319. Results
show that with ANO at its established stability limits following the above mentioned prior-outage
conditions and faults, it may be possible for Project J319 to inject a certain amount of power into the grid.
However, considering that the thermal rating of the ANO 500/161 kV auto-transformer is more limiting
for these two events, MISO and Entergy concluded that J319 needs to back down to zero (0) MW after
the prior outage of J319 – Pleasant Hill 500 kV line in order to reduce the flow below the thermal limits
of the ANO 500/161 kV auto-transformer.
Thus maximum allowable injections as derived in additional stability analysis are “moot” because J319
will be required to back down to 0 MW following the prior-outage of the J319 Tap – Pleasant Hill 500 kV
line based on thermal considerations i.e., emergency rating of the ANO 500/161 kV auto-transformer.
Details pertaining to the Stability Study Reports can be found in Appendix A Stability Analysis Reports.
7. Short Circuit Analysis
J319 customer has confirmed that the HVDC injection (LCC) will not contribute any short circuit currents
to the AC system. Therefore, a short circuit analysis was not necessary.
8. Deliverability Study
J319 being an HVDC injection, NRIS is not applicable.
9. Shared Network Upgrades
Analysis performed shows there are no projects for Shared Network Upgrade cost allocation.
10. Impact on ANO thermal limits
J319 would be backed down to ‘0’ for prior outage of ‘J319 Tap –Pleasant Hill’ to respect the thermal
rating of ANO Xmer; so as to prepare for the 2nd
contingency (B5106 STK2); during which ANO Xmer
would be the only outlet for ANO units as well as J319. Currently ANO units are being backed down to
respect ANO Xmer for this scenario; which indicates there is no additional injection available for J319.
An operating guide would be considered for backing down and an SPS would not be considered for the
same.
2 B5106 STK contingency takes out two 500 kV lines – ANO- Ft. Smith and ANO –Mabelvale.
8
11. Affected System Analysis
SPP performed the affected system study to analyze the impact on SPP facilities. No SPP impacts were
identified for J319 project. Details pertaining to SPP affected system analysis can be found in Appendix B
SPP Affected System Study.
12. HIS /SSTI (Harmonic Impedance Scanning /Sub-synchronous Torsional
Interaction) study
HIS study this report is a harmonic impedance study (HIS) seen from the point of interconnection on the
ANO-Pleasant Hill 500 kV line under a variety of system conditions and is limited to the Arkansas
terminal. The results / plots provides the J319 Interconnection Customer / HVDC design team for use in
their filter design calculations. Details pertaining to SPP affected system analysis can be found in
Appendix C E17422_0060_01_r00 MISO J319 HIS Report.
SSTI report describes the SSTI screening study conducted for the Midcontinent Independent System
Operator (MISO) Project J319 HVDC Interconnection. The calculations in this report address the
requirements outlined in Section 2.4 of ABB’s Technical Proposal. The report begins with a general
description of the sub-synchronous torsional interaction (SSTI) phenomenon, followed by a discussion of
the SSTI screening and evaluation techniques used in the study. The results of the screening analysis for
machines in the vicinity of the J319 HVDC Interconnection tap on Entergy’s Arkansas Nuclear One
(ANO) – Pleasant Hill 500 kV line are presented in Sections 7 and 8 of this report. Based on the results of
the SSTI screening analysis, and considering a reasonable number of contingences, i.e., N-5 or lower, the
following generating units are identified for SSTI analysis during the detailed design phase for the
J319 HVDC converters:
Entergy’s Arkansas Nuclear One (ANO) Units 1 and 2
The two ANO generating units will require detailed study at the contract stage of the project using the
methods discussed in this report.
The Dardanelle and L&D #91 hydro generating units are the next closest generating units to exhibit unit
interaction factors in excess of 0.10. However, the number of contingencies required to reach a significant
level of interaction, i.e., ≥ 7, as well as the construction of the hydro units, makes sub-synchronous issues
unlikely for these generating units and no further study is recommended. Details pertaining to SPP
affected system analysis can be found in Appendix C E17422_0100_01_r00 MISO J319 SSTI Screening
Study Report

9
Appendix
Appendix A Stability Analysis Reports
The following reports provides details pertaining to stability analysis
MISO_J319_Stability_Study_report_06272016
MISO_J319_Additional_Analysis_Report_09142016
Appendix B SPP Affected System Study
SPP Affected System Study report (MISO FEB 2015 Affected System Study_8-31-15) has been posted to
the MISO external website.
Appendix C HIS /SSTI (Harmonic Impedance Scanning /Sub-synchronous Torsional
Interaction) study
E17422_0060_01_r00 MISO J319 HIS Report.
E17422_0100_01_r00 MISO J319 SSTI Screening Study Report

i
INTERCONNECTION STABILITY ANALYSIS REPORT FOR
PROJECT J319 AND J417
MIDCONTINENT INDEPENDENT SYSTEM OPERATOR DEFINITIVE PLANNING PHASE – FEBRUARY 2015
FINAL REPORT
ABB REPORT #: 2015-E15466 Draft Report Issued On: July 31, 2015 Final Report Updated On: June 27, 2016 Prepared for: Midcontinent Independent System Operator, Inc. Prepared by: ABB Inc. Power Consulting 901 Main Campus Drive Raleigh, NC 27606

ii
Legal Notice This document, prepared by ABB Inc. (ABB), is an account of work sponsored by Midcontinent Independent System Operator, Inc. (MISO). Neither MISO nor ABB nor any person or persons acting on behalf of either party: (i) makes any warranty or representation, expressed or implied, with respect to the use of any information contained in this report, or that the use of any information, apparatus, method, or process disclosed in this report may not infringe privately owned rights, or (ii) assumes any liabilities with respect to the use of or for damages resulting from the use of any information, apparatus, method, or process disclosed in this document.

iii
ABB Inc. Technical Report
Midcontinent Independent System Operator (MISO) ABB Report #: 2015-E-15466
Interconnection Stability Analysis Report for Projects J319 and J417
Update: June 27, 2016
# Pages: 31 + Appendices
Author(s): Reviewed by: Approved by: Xiaohuan Tan Sri Pillutla, Dave Dickmander Willie Wong
EXECUTIVE SUMMARY Midcontinent Independent System Operator, Inc. (MISO) has retained ABB Power Systems Consulting to perform transient stability analysis for two interconnection requests (J319 and J417), in the Definitive Planning Phase (DPP) February 2015 study cycle. Project J319 is a 500 MW HVDC project seeking interconnection in Pope County, AR. Based on the available information, this is a multi-terminal HVDC project with the rectifier station located in Oklahoma and the inverter stations located in Pope County, AR and in Shelby County, TN. The point of interconnection in Pope County, AR is on Entergy’s Arkansas Nuclear One (ANO) – Pleasant Hill 500 kV line. Injection into the Entergy system is 500 MW. Project J417 is a 43 MW waste heat recovery project located in Calcasieu County, LA. The point of interconnection is Entergy’s Graywood 230 kV substation. The primary objective of this study is to evaluate the collective impact of these interconnection requests on stability performance in the MISO South transmission systems. A summary of the study results is presented below. Stability Analysis Stability analysis was performed on 2018 and 2025 summer shoulder peak cases provided by MISO. Thirty (30) three-phase normally cleared and thirteen (13) single-line-to-ground faults with backup clearing were simulated on the post-project cases to determine the impact of J319 and J417 on angular stability and transient voltage recovery of the Entergy system. No angular instability or voltage dip violations attributed to the proposed projects were identified. Based on these results, it can be concluded that J319 and J417 do not adversely impact the stability performance of the Entergy system. A sensitivity analysis was also performed by using an updated HVDC model, which assumes a monopolar tap configuration and the HVDC rectifier end connecting to the AC system in SPP. No angular instability or voltage dip violations attributed to J319 were identified. Note (June 27, 2016): J417 which was in this study had withdrawn and it was determined that additional analysis was not necessary to evaluate its impact on the ongoing analysis, as its POI being in LA was remote with respect to J319.
iv
TABLE OF CONTENTS EXECUTIVE SUMMARY .............................................................................................................................. 3 1 INTRODUCTION .................................................................................................................................. 1
1.1 Description of Project .................................................................................................................... 1 2 STUDY METHODOLOGY AND CRITERIA ......................................................................................... 4
2.1 Study Methodology ....................................................................................................................... 4 2.2 Study Criteria................................................................................................................................. 4
3 STUDY MODEL DEVELOPMENT ....................................................................................................... 6 3.1 Powerflow Cases .......................................................................................................................... 6 3.2 Stability Database ......................................................................................................................... 7
4 STUDY RESULTS................................................................................................................................ 8 4.1 Summary of Results ...................................................................................................................... 8 4.2 PNE HVDC Behavior .................................................................................................................. 11
4.2.1 HVDC Response Following a 3-Phase Fault at the 500 kV AC Tap .................................. 11 4.2.2 HVDC Response Following Temporary Block of Pole 2 ..................................................... 11 4.2.3 HVDC Response to Permanent Block of Bipole ................................................................. 12
5 SENSITIVITY ANALYSIS FOR PROJECT J319 .............................................................................. 19 5.1 Sensitivity Case Development .................................................................................................... 19 5.2 Sensitivity Analysis Results ......................................................................................................... 19 5.3 HVDC Behavior in Sensitivity Analysis ....................................................................................... 20
5.3.1 HVDC Response Following a 3-Phase Fault at the 500 kV AC Tap .................................. 20 5.3.2 HVDC Response Following Temporary Block of Pole 1 ..................................................... 21 5.3.3 HVDC Response to Permanent Block of Pole 1 ................................................................. 22 5.3.4 HVDC Response to Permanent Block of Bipole ................................................................. 22
6 CONCLUSIONS ................................................................................................................................. 31 Appendix A LOCAL ONE-LINE DIAGRAMS ..................................................................................... 32 Appendix B DYNAMIC MODELS ....................................................................................................... 35
B.1 J319 Dynamic Model ................................................................................................................... 35 B.2 J417 Dynamic Model ................................................................................................................... 36
Appendix C PROPOSED 500 KV INTERCONNECTION OF J319 .................................................... 37 Appendix D PLOTS OF 2018 POST-PROJECT CASE ..................................................................... 38 Appendix E PLOTS OF 2018 PRE-PROJECT CASE ........................................................................ 39 Appendix F PLOTS OF 2025 POST-PROJECT CASE ..................................................................... 40 Appendix G PLOTS OF 2025 PRE-PROJECT CASE ........................................................................ 41 Appendix H ONE-LINE DIAGRAM OF UPDATED J319 MODEL ..................................................... 42 Appendix I PLOTS OF 2018 J319 SENSITIVITY ANALYSIS .......................................................... 44 Appendix J PLOTS OF 2025 J319 SENSITIVITY ANALYSIS .......................................................... 45

v
LIST OF TABLES
Table 4-1: Transient Stability with 3-Phase Normally-Cleared Faults .......................................................... 9 Table 4-2: Transient Stability with SLG Stuck-Breaker Faults Cleared at Backup Clearing Time ............. 10
LIST OF FIGURES
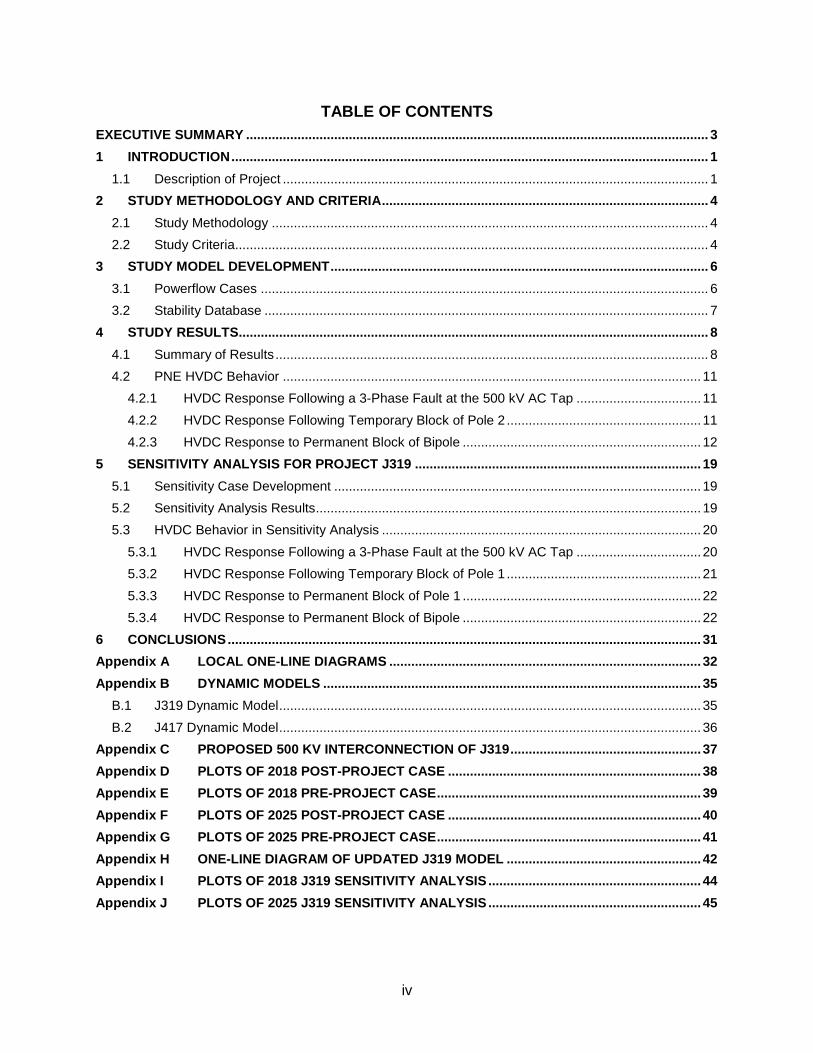
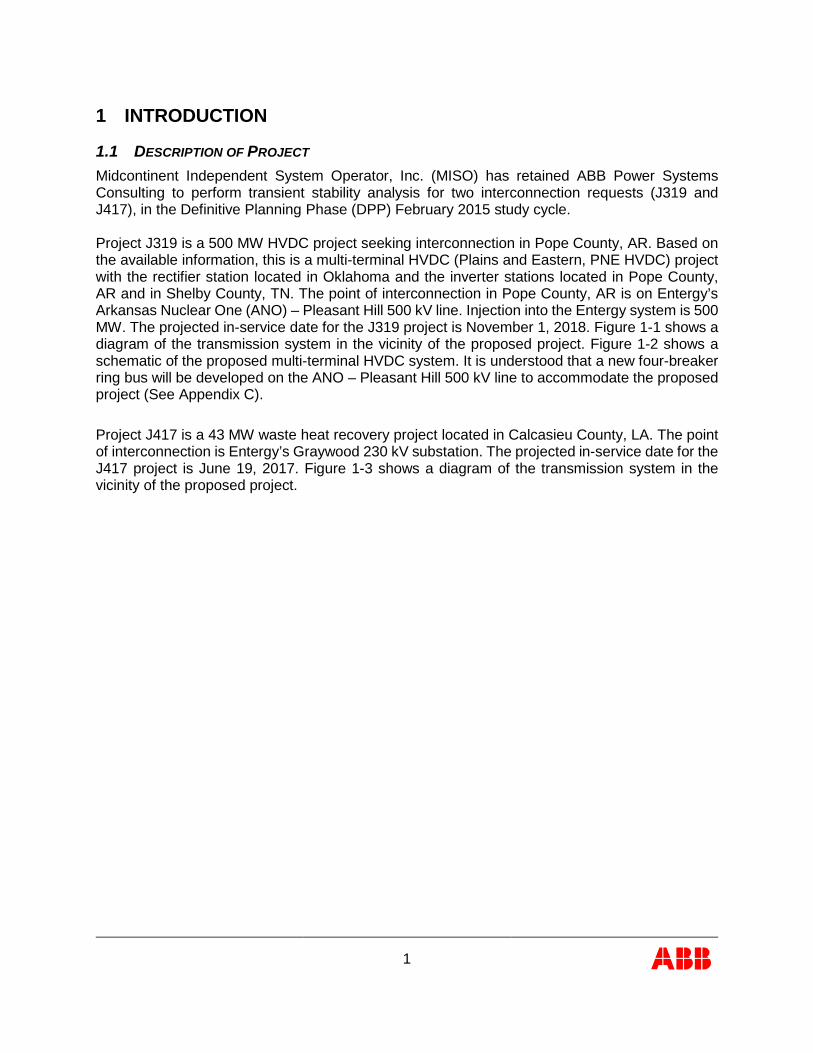
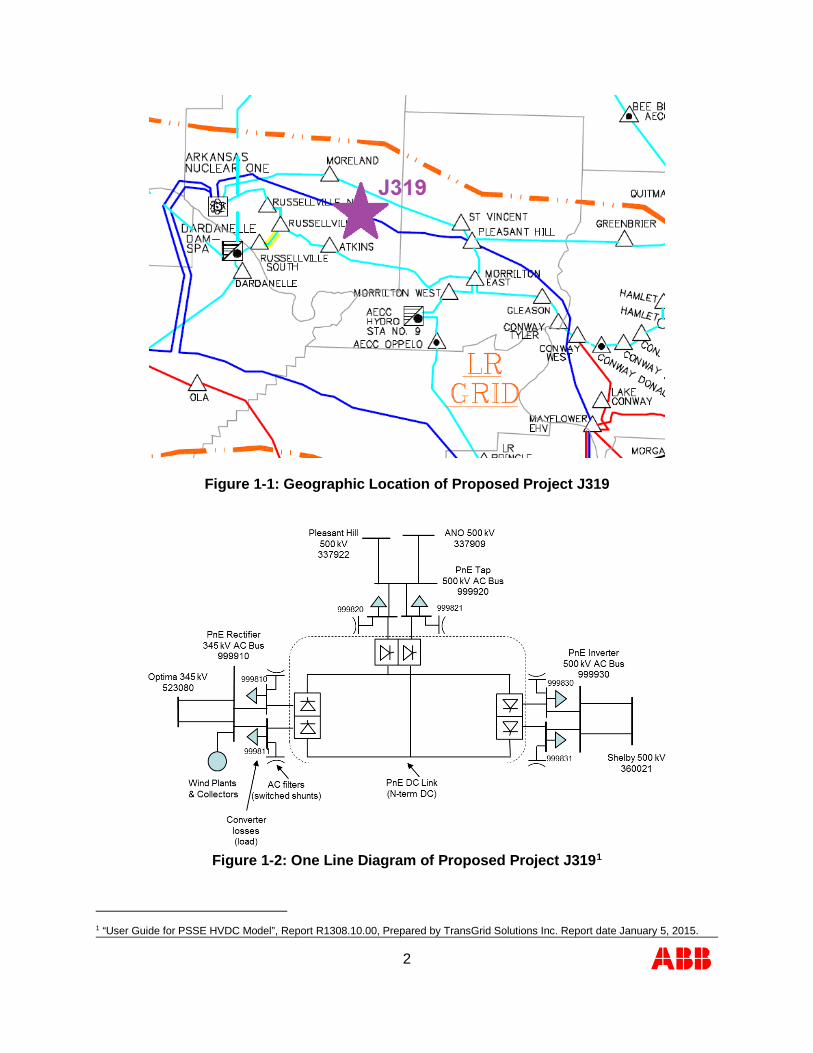
Figure 1-1: Geographic Location of Proposed Project J319 ......................................................................... 2 Figure 1-2: One Line Diagram of Proposed Project J319 ............................................................................. 2 Figure 1-3: Geographic Location of Proposed Project J417 ......................................................................... 3 Figure 4-1: HVDC Response to Fault J319-3PH-01: PDC, PAC, QDC, and IDC ...................................... 13 Figure 4-2: HVDC Response to Fault J319-3PH-01: VDC, VAC, Alpha, and Gamma .............................. 14 Figure 4-3: HVDC Response to Temporary Block of Pole 2: PDC, PAC, QDC, and IDC .......................... 15 Figure 4-4: HVDC Response to Temporary Block of Pole 2: VDC, VAC, Alpha, and Gamma .................. 16 Figure 4-5: HVDC Response to Permanent Block of Bipole: PDC, PAC, QDC, and IDC .......................... 17 Figure 4-6: HVDC Response to Permanent Block of Bipole: VDC, VAC, Alpha, and Gamma .................. 18 Figure 5-1: HVDC Pole 1 Response to Fault J319-3PH-01 ........................................................................ 23 Figure 5-2: HVDC Pole 2 Response to Fault J319-3PH-01 ........................................................................ 24 Figure 5-3: HVDC Pole 1 Response to Temporary Block of Pole 1 ........................................................... 25 Figure 5-4: HVDC Pole 2 Response to Temporary Block of Pole 1 ........................................................... 26 Figure 5-5: HVDC Pole 1 Response to Permanent Block of Pole 1 ........................................................... 27 Figure 5-6: HVDC Pole 2 Response to Permanent Block of Pole 1 ........................................................... 28 Figure 5-7: HVDC Pole 1 Response to Permanent Block of Bipole ........................................................... 29 Figure 5-8: HVDC Pole 2 Response to Permanent Block of Bipole ........................................................... 30
1
1 INTRODUCTION
1.1 DESCRIPTION OF PROJECT Midcontinent Independent System Operator, Inc. (MISO) has retained ABB Power Systems Consulting to perform transient stability analysis for two interconnection requests (J319 and J417), in the Definitive Planning Phase (DPP) February 2015 study cycle. Project J319 is a 500 MW HVDC project seeking interconnection in Pope County, AR. Based on the available information, this is a multi-terminal HVDC (Plains and Eastern, PNE HVDC) project with the rectifier station located in Oklahoma and the inverter stations located in Pope County, AR and in Shelby County, TN. The point of interconnection in Pope County, AR is on Entergy’s Arkansas Nuclear One (ANO) – Pleasant Hill 500 kV line. Injection into the Entergy system is 500 MW. The projected in-service date for the J319 project is November 1, 2018. Figure 1-1 shows a diagram of the transmission system in the vicinity of the proposed project. Figure 1-2 shows a schematic of the proposed multi-terminal HVDC system. It is understood that a new four-breaker ring bus will be developed on the ANO – Pleasant Hill 500 kV line to accommodate the proposed project (See Appendix C). Project J417 is a 43 MW waste heat recovery project located in Calcasieu County, LA. The point of interconnection is Entergy’s Graywood 230 kV substation. The projected in-service date for the J417 project is June 19, 2017. Figure 1-3 shows a diagram of the transmission system in the vicinity of the proposed project.
2
Figure 1-1: Geographic Location of Proposed Project J319
Figure 1-2: One Line Diagram of Proposed Project J3191
1 “User Guide for PSSE HVDC Model”, Report R1308.10.00, Prepared by TransGrid Solutions Inc. Report date January 5, 2015.
3
Figure 1-3: Geographic Location of Proposed Project J417
4
2 STUDY METHODOLOGY AND CRITERIA
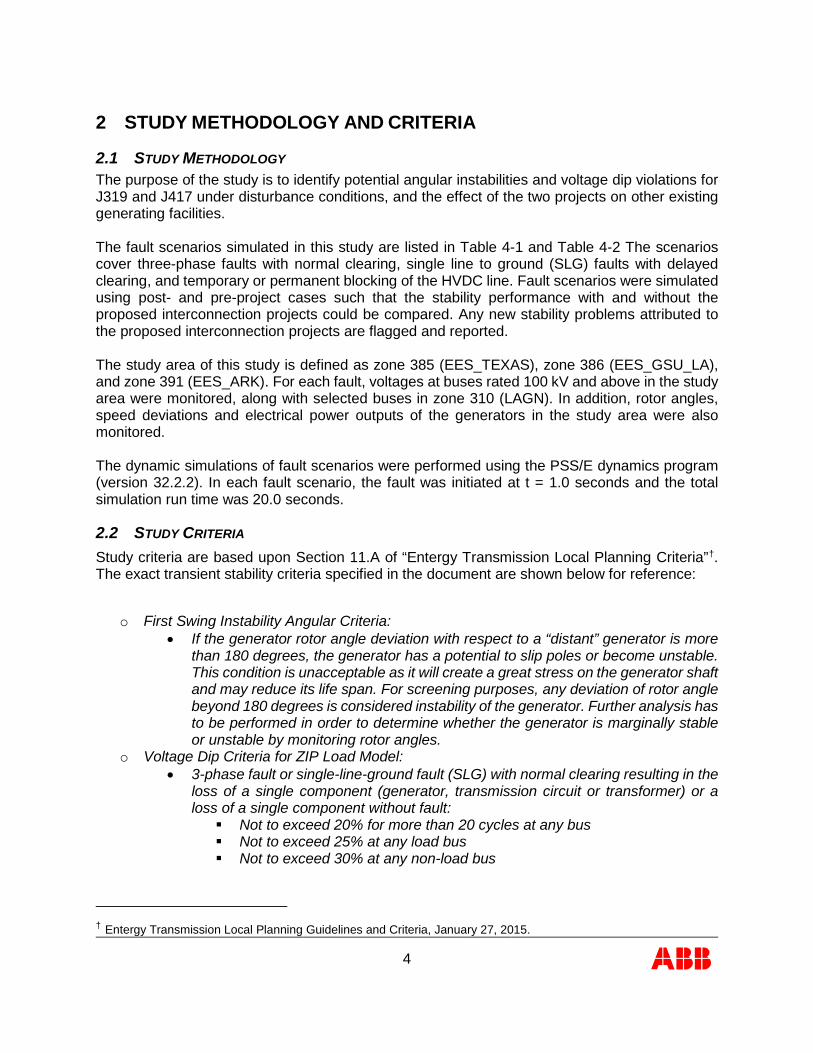
2.1 STUDY METHODOLOGY The purpose of the study is to identify potential angular instabilities and voltage dip violations for J319 and J417 under disturbance conditions, and the effect of the two projects on other existing generating facilities. The fault scenarios simulated in this study are listed in Table 4-1 and Table 4-2 The scenarios cover three-phase faults with normal clearing, single line to ground (SLG) faults with delayed clearing, and temporary or permanent blocking of the HVDC line. Fault scenarios were simulated using post- and pre-project cases such that the stability performance with and without the proposed interconnection projects could be compared. Any new stability problems attributed to the proposed interconnection projects are flagged and reported. The study area of this study is defined as zone 385 (EES_TEXAS), zone 386 (EES_GSU_LA), and zone 391 (EES_ARK). For each fault, voltages at buses rated 100 kV and above in the study area were monitored, along with selected buses in zone 310 (LAGN). In addition, rotor angles, speed deviations and electrical power outputs of the generators in the study area were also monitored. The dynamic simulations of fault scenarios were performed using the PSS/E dynamics program (version 32.2.2). In each fault scenario, the fault was initiated at t = 1.0 seconds and the total simulation run time was 20.0 seconds.
2.2 STUDY CRITERIA Study criteria are based upon Section 11.A of “Entergy Transmission Local Planning Criteria”†. The exact transient stability criteria specified in the document are shown below for reference:
o First Swing Instability Angular Criteria: • If the generator rotor angle deviation with respect to a “distant” generator is more
than 180 degrees, the generator has a potential to slip poles or become unstable. This condition is unacceptable as it will create a great stress on the generator shaft and may reduce its life span. For screening purposes, any deviation of rotor angle beyond 180 degrees is considered instability of the generator. Further analysis has to be performed in order to determine whether the generator is marginally stable or unstable by monitoring rotor angles.
o Voltage Dip Criteria for ZIP Load Model: • 3-phase fault or single-line-ground fault (SLG) with normal clearing resulting in the
loss of a single component (generator, transmission circuit or transformer) or a loss of a single component without fault: Not to exceed 20% for more than 20 cycles at any bus Not to exceed 25% at any load bus Not to exceed 30% at any non-load bus
† Entergy Transmission Local Planning Guidelines and Criteria, January 27, 2015.

5
• 3-phase faults with normal clearing resulting in the loss of two or more components (generator, transmission circuit, or transformer) or SLG fault with delayed clearing resulting in the loss of one or more components: Not to exceed 20% for more than 40 cycles at any bus Not to exceed 30% at any bus
• The duration of the transient voltage dip excludes the duration of the fault. The transient voltage dip criteria may not be applied to three-phase faults followed by stuck breaker conditions unless the determined impact is extremely widespread.
In this study, a load bus is defined as any bus with one or more directly connected loads in the PSS/E case. Conversely, any bus without a directly connected load is defined as a non-load bus.
6
3 STUDY MODEL DEVELOPMENT
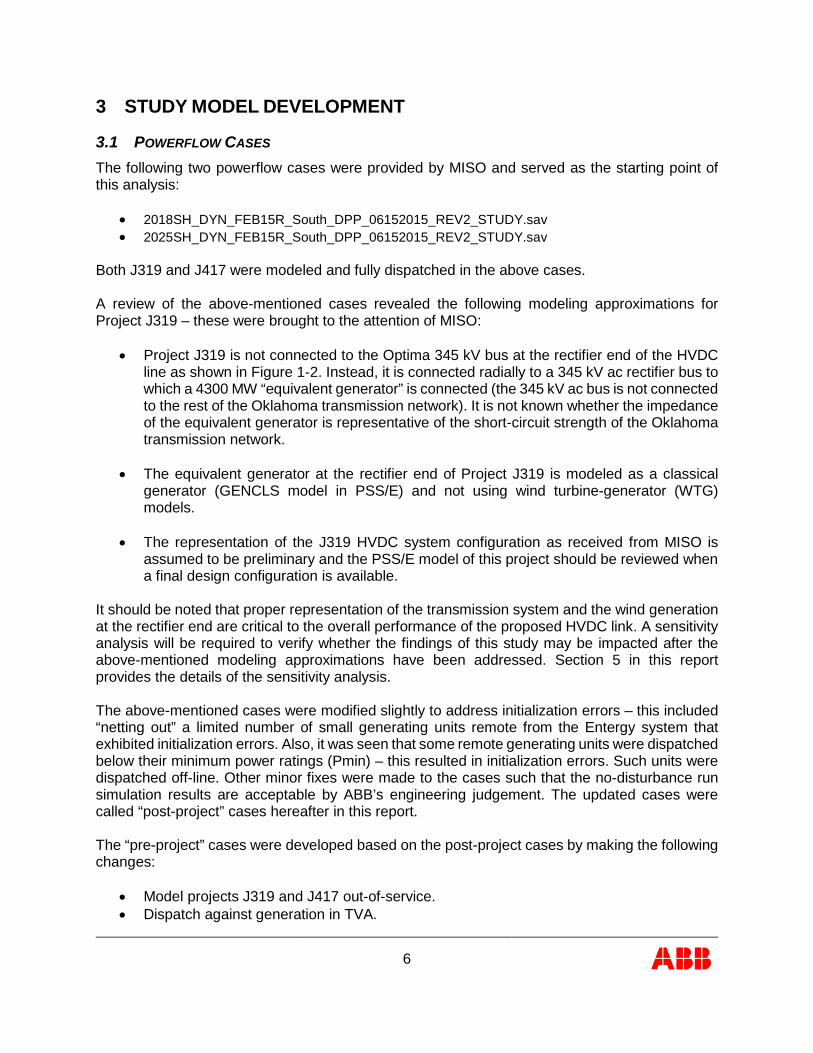
3.1 POWERFLOW CASES The following two powerflow cases were provided by MISO and served as the starting point of this analysis:
• 2018SH_DYN_FEB15R_South_DPP_06152015_REV2_STUDY.sav • 2025SH_DYN_FEB15R_South_DPP_06152015_REV2_STUDY.sav
Both J319 and J417 were modeled and fully dispatched in the above cases. A review of the above-mentioned cases revealed the following modeling approximations for Project J319 – these were brought to the attention of MISO:
• Project J319 is not connected to the Optima 345 kV bus at the rectifier end of the HVDC line as shown in Figure 1-2. Instead, it is connected radially to a 345 kV ac rectifier bus to which a 4300 MW “equivalent generator” is connected (the 345 kV ac bus is not connected to the rest of the Oklahoma transmission network). It is not known whether the impedance of the equivalent generator is representative of the short-circuit strength of the Oklahoma transmission network.
• The equivalent generator at the rectifier end of Project J319 is modeled as a classical generator (GENCLS model in PSS/E) and not using wind turbine-generator (WTG) models.
• The representation of the J319 HVDC system configuration as received from MISO is assumed to be preliminary and the PSS/E model of this project should be reviewed when a final design configuration is available.
It should be noted that proper representation of the transmission system and the wind generation at the rectifier end are critical to the overall performance of the proposed HVDC link. A sensitivity analysis will be required to verify whether the findings of this study may be impacted after the above-mentioned modeling approximations have been addressed. Section 5 in this report provides the details of the sensitivity analysis. The above-mentioned cases were modified slightly to address initialization errors – this included “netting out” a limited number of small generating units remote from the Entergy system that exhibited initialization errors. Also, it was seen that some remote generating units were dispatched below their minimum power ratings (Pmin) – this resulted in initialization errors. Such units were dispatched off-line. Other minor fixes were made to the cases such that the no-disturbance run simulation results are acceptable by ABB’s engineering judgement. The updated cases were called “post-project” cases hereafter in this report. The “pre-project” cases were developed based on the post-project cases by making the following changes:
• Model projects J319 and J417 out-of-service. • Dispatch against generation in TVA.
7
One-line diagrams for the local area with the proposed projects are presented in Appendix A.
3.2 STABILITY DATABASE The stability database used for this study was provided by MISO. Specifically, the files provided are:
o “MTEP14_DYN_FEB15.snp” dated 5/26/2015 o Dynamic link library file “DSUSR.DLL” file dated 5/22/2015 o Dynamic link library associated with user-written model for the PNE HVDC line – file
“PNE.DLL” dated 12/11/2014 During the initial review of the dynamic models, some dynamic data errors were observed in the snapshot, which were identified and corrected. Modeling details of projects J319 and J417 are presented in Appendix B.

8
4 STUDY RESULTS
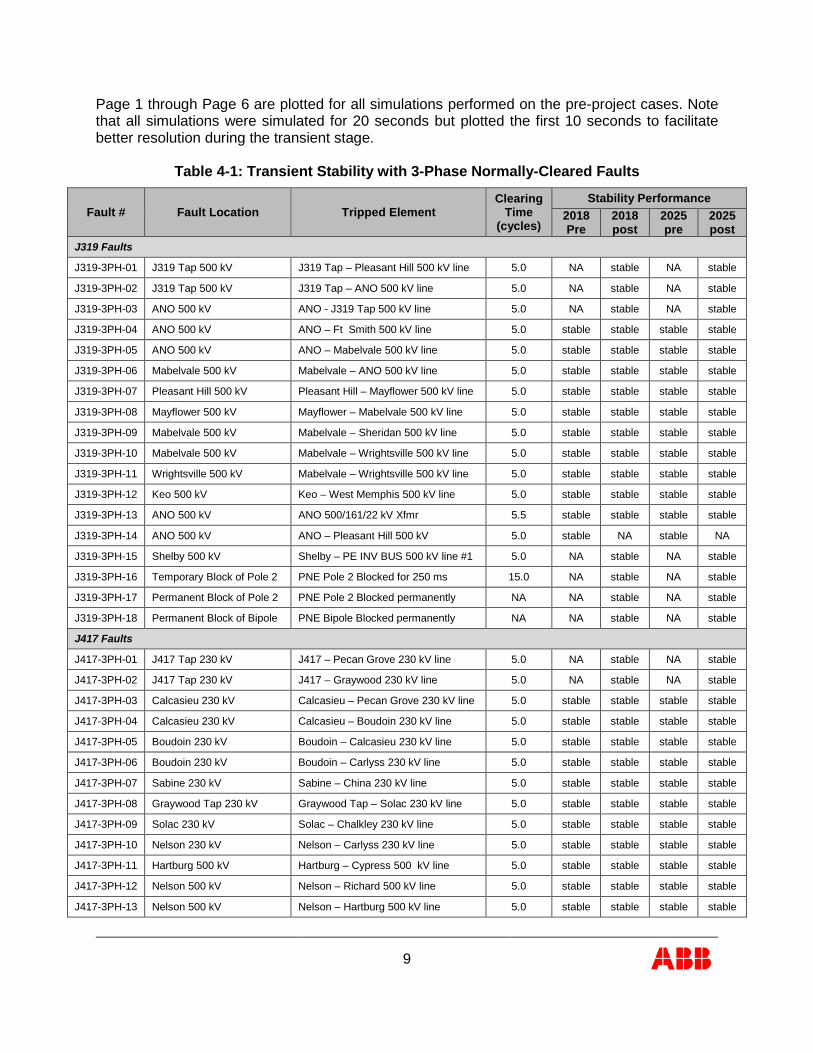
4.1 SUMMARY OF RESULTS Thirty (30) three-phase faults with normal clearing and thirteen (13) single-line-to-ground faults with backup clearing were simulated for the post-project cases, which are tabulated in Table 4-1 and Table 4-2, respectively. Applicable faults were also simulated for the pre-project cases. The breaker diagram for the proposed 500 kV interconnection of J319 was provided by MISO and is shown in Appendix C. In summary, the simulation results indicate that:
• No stability violations attributed to J319 and J417 were identified using Entergy’s First Swing Angular Instability Criteria and Voltage Dip Criteria.
• The only fault that exhibits angular instability is Fault #J319-SLG-09, which is a SLG fault at the White Bluff 500 kV substation followed by tripping of the White Bluff – Sheridan 500 kV line at the primary clearing time and the White Bluff – Keo 500 kV line at the backup clearing. Both 500 kV lines are the White Bluff generation station outlets. The White Bluff generation (approximately 1650 MW) should probably have been tripped following this contingency because the 500/115 and 500/230 kV transformers at White Bluff cannot support this much generation. The fault idev file provided by MISO does not include any special protection scheme to trip the White Bluff units for this contingency though. Since the system was unstable following this fault in both pre-project and post-project cases, the angular instability is not attributed to J319 and J417.
Plots for all simulations of 2018 and 2025 cases are provided in Appendix D through Appendix G. For each fault simulation performed on the post-project cases, the following eight (8) pages of plots are provided:
• Page 1: Rotor angle of the selected units monitored in the study area • Page 2: Speed deviation of the monitored units • Page 3: Active power generation (PELEC) of the monitored units • Page 4: Reactive power generation (QELEC) of the monitored units • Page 5: J319 and J417 local bus voltages • Page 6: J319 and J417 local bus voltages • Page 7: PNE HVDC model variables
o Quadrant 1 – PDC, DC power (MW) at the rectifier, inverter, and tap end o Quadrant 2 – PAC, AC power (MW) at the rectifier, inverter, and tap end o Quadrant 3 – QAC, Reactive power (MVAr) at the rectifier, inverter, and tap end o Quadrant 4 – IDC, DC current (kA) at the rectifier, inverter, and tap end
• Page 8: PNE HVDC model variables o Quadrant 1 – VDC, DC voltage (pu) at the rectifier, inverter, and tap end o Quadrant 2 – VAC, AC voltage (MW) at the rectifier, inverter, and tap end o Quadrant 3 – Alpha, firing angle (rad) at the rectifier, inverter, and tap end o Quadrant 4 – Gamma, extinguish angle (rad) at the rectifier, inverter, and tap end
9
Page 1 through Page 6 are plotted for all simulations performed on the pre-project cases. Note that all simulations were simulated for 20 seconds but plotted the first 10 seconds to facilitate better resolution during the transient stage.
Table 4-1: Transient Stability with 3-Phase Normally-Cleared Faults
Fault # Fault Location Tripped Element Clearing
Time (cycles)
Stability Performance 2018 Pre
2018 post
2025 pre
2025 post
J319 Faults
J319-3PH-01 J319 Tap 500 kV J319 Tap – Pleasant Hill 500 kV line 5.0 NA stable NA stable
J319-3PH-02 J319 Tap 500 kV J319 Tap – ANO 500 kV line 5.0 NA stable NA stable
J319-3PH-03 ANO 500 kV ANO - J319 Tap 500 kV line 5.0 NA stable NA stable
J319-3PH-04 ANO 500 kV ANO – Ft Smith 500 kV line 5.0 stable stable stable stable
J319-3PH-05 ANO 500 kV ANO – Mabelvale 500 kV line 5.0 stable stable stable stable
J319-3PH-06 Mabelvale 500 kV Mabelvale – ANO 500 kV line 5.0 stable stable stable stable
J319-3PH-07 Pleasant Hill 500 kV Pleasant Hill – Mayflower 500 kV line 5.0 stable stable stable stable
J319-3PH-08 Mayflower 500 kV Mayflower – Mabelvale 500 kV line 5.0 stable stable stable stable
J319-3PH-09 Mabelvale 500 kV Mabelvale – Sheridan 500 kV line 5.0 stable stable stable stable
J319-3PH-10 Mabelvale 500 kV Mabelvale – Wrightsville 500 kV line 5.0 stable stable stable stable
J319-3PH-11 Wrightsville 500 kV Mabelvale – Wrightsville 500 kV line 5.0 stable stable stable stable
J319-3PH-12 Keo 500 kV Keo – West Memphis 500 kV line 5.0 stable stable stable stable
J319-3PH-13 ANO 500 kV ANO 500/161/22 kV Xfmr 5.5 stable stable stable stable
J319-3PH-14 ANO 500 kV ANO – Pleasant Hill 500 kV 5.0 stable NA stable NA
J319-3PH-15 Shelby 500 kV Shelby – PE INV BUS 500 kV line #1 5.0 NA stable NA stable
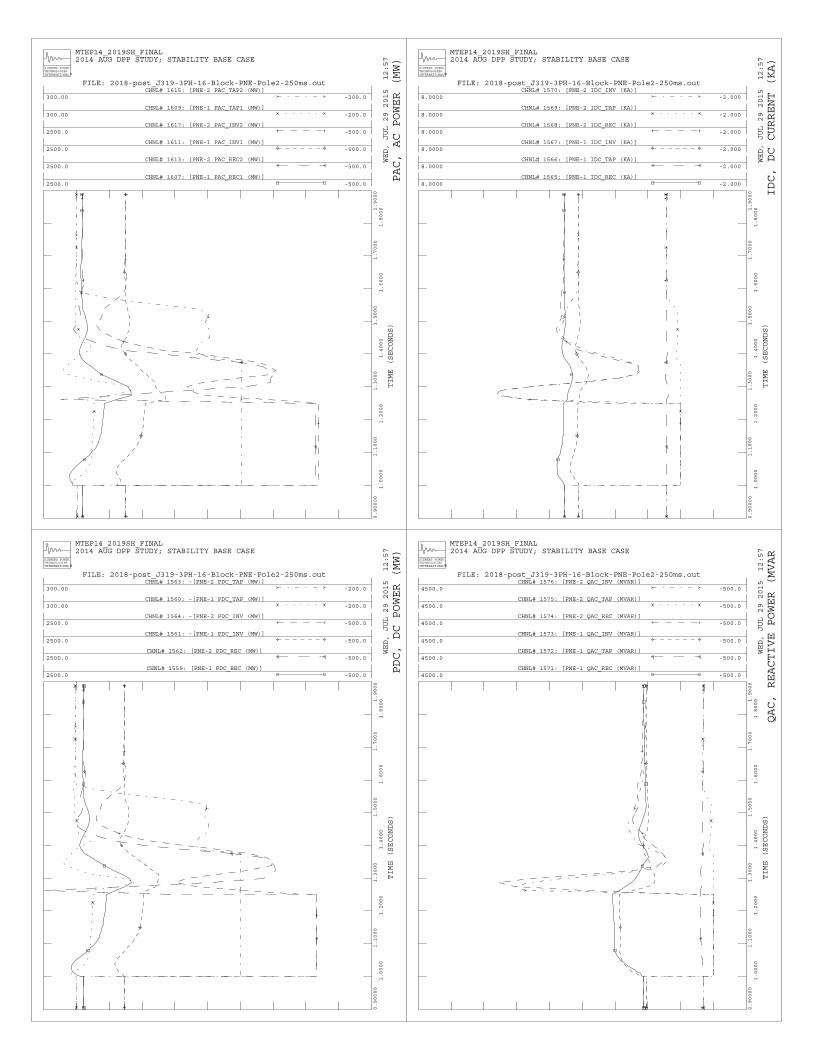
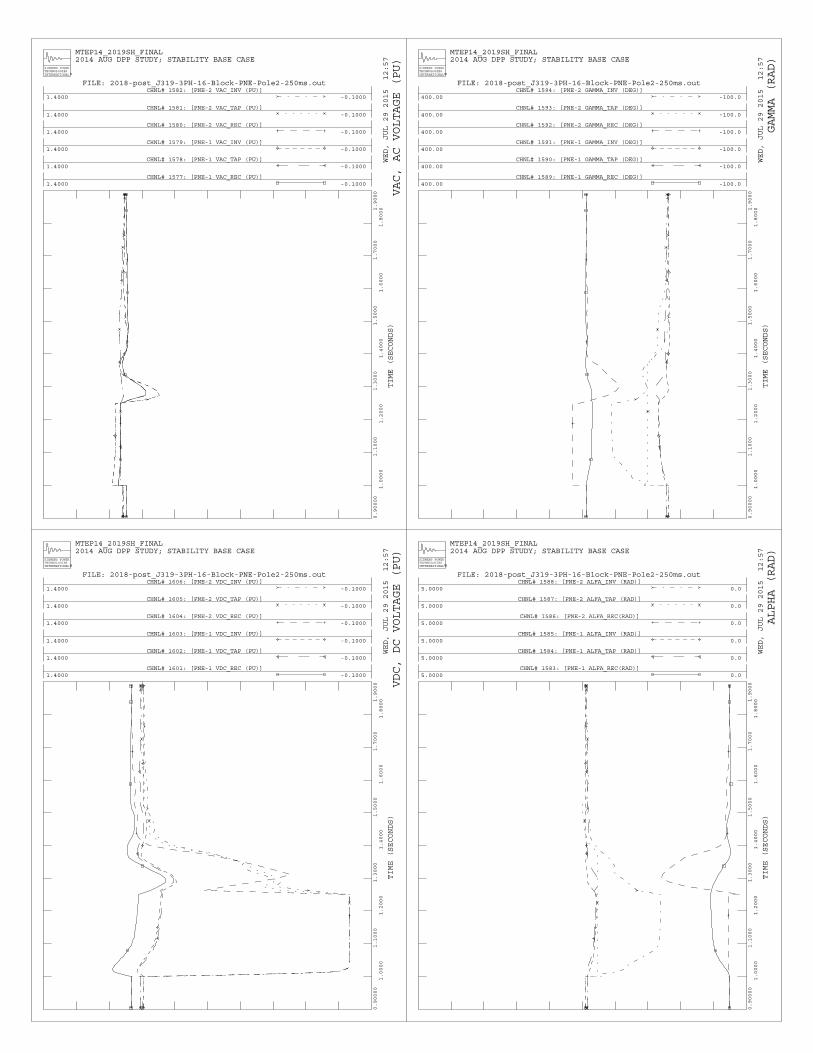
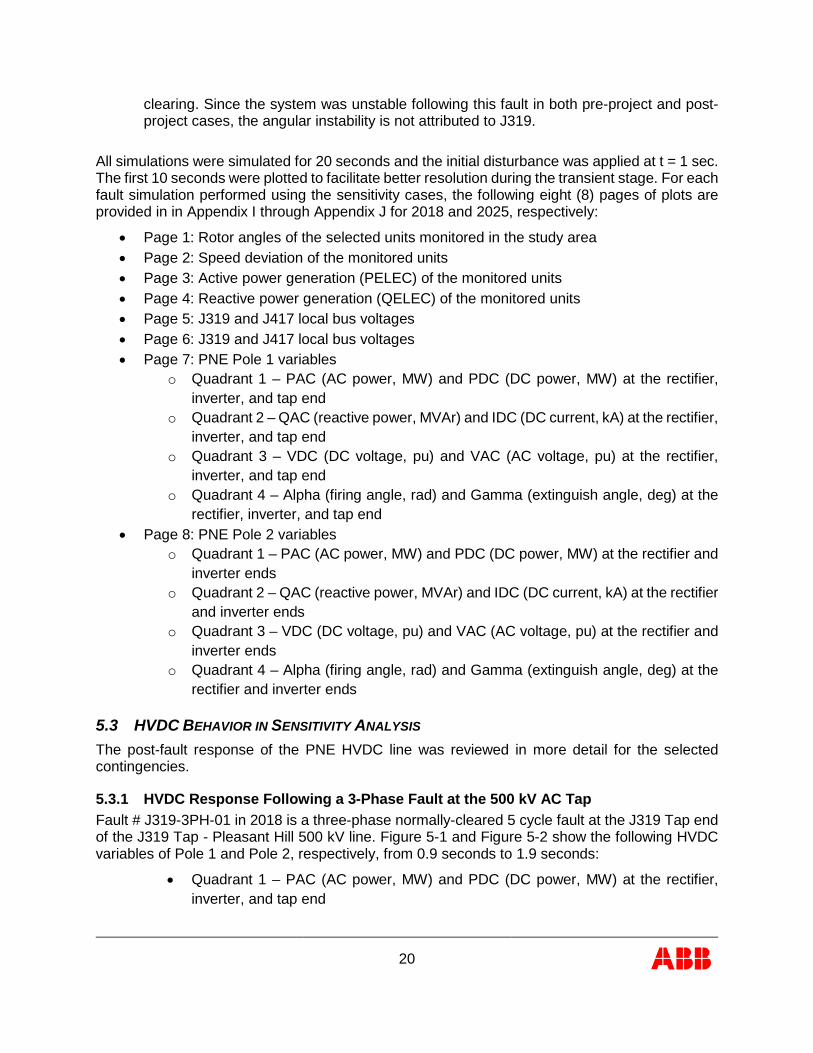
J319-3PH-16 Temporary Block of Pole 2 PNE Pole 2 Blocked for 250 ms 15.0 NA stable NA stable
J319-3PH-17 Permanent Block of Pole 2 PNE Pole 2 Blocked permanently NA NA stable NA stable
J319-3PH-18 Permanent Block of Bipole PNE Bipole Blocked permanently NA NA stable NA stable
J417 Faults
J417-3PH-01 J417 Tap 230 kV J417 – Pecan Grove 230 kV line 5.0 NA stable NA stable
J417-3PH-02 J417 Tap 230 kV J417 – Graywood 230 kV line 5.0 NA stable NA stable
J417-3PH-03 Calcasieu 230 kV Calcasieu – Pecan Grove 230 kV line 5.0 stable stable stable stable
J417-3PH-04 Calcasieu 230 kV Calcasieu – Boudoin 230 kV line 5.0 stable stable stable stable
J417-3PH-05 Boudoin 230 kV Boudoin – Calcasieu 230 kV line 5.0 stable stable stable stable
J417-3PH-06 Boudoin 230 kV Boudoin – Carlyss 230 kV line 5.0 stable stable stable stable
J417-3PH-07 Sabine 230 kV Sabine – China 230 kV line 5.0 stable stable stable stable
J417-3PH-08 Graywood Tap 230 kV Graywood Tap – Solac 230 kV line 5.0 stable stable stable stable
J417-3PH-09 Solac 230 kV Solac – Chalkley 230 kV line 5.0 stable stable stable stable
J417-3PH-10 Nelson 230 kV Nelson – Carlyss 230 kV line 5.0 stable stable stable stable
J417-3PH-11 Hartburg 500 kV Hartburg – Cypress 500 kV line 5.0 stable stable stable stable
J417-3PH-12 Nelson 500 kV Nelson – Richard 500 kV line 5.0 stable stable stable stable
J417-3PH-13 Nelson 500 kV Nelson – Hartburg 500 kV line 5.0 stable stable stable stable
10
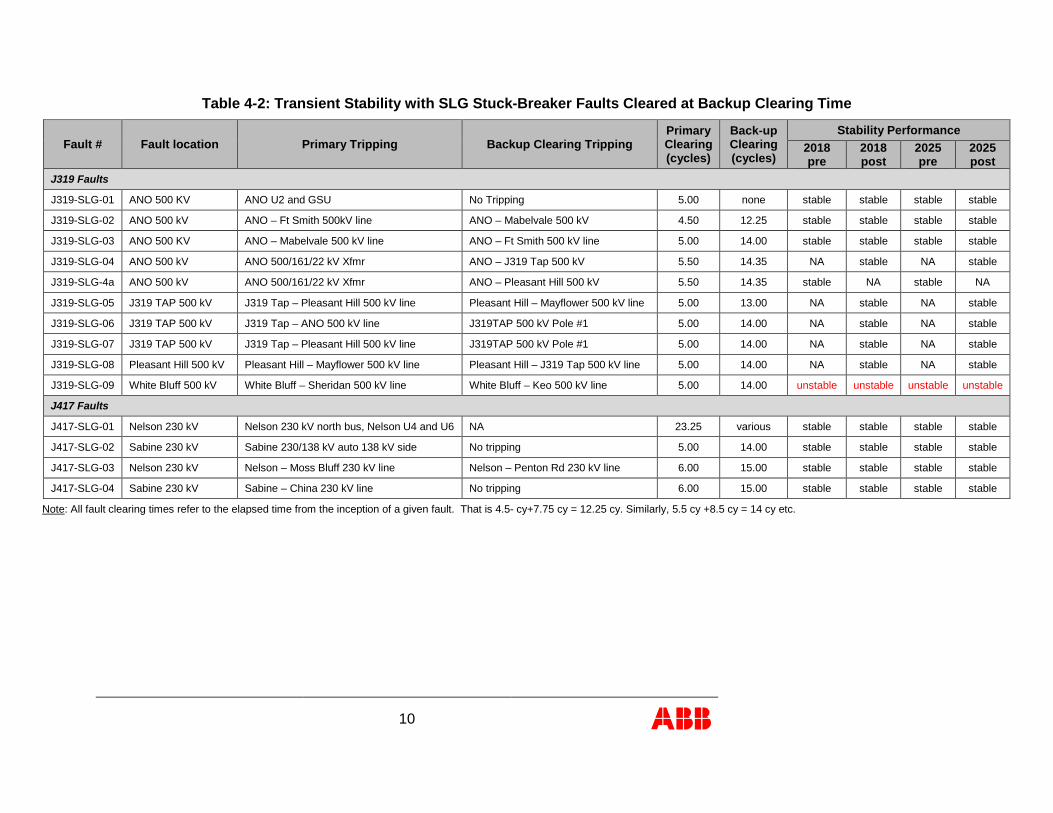
Table 4-2: Transient Stability with SLG Stuck-Breaker Faults Cleared at Backup Clearing Time
Fault # Fault location Primary Tripping Backup Clearing Tripping Primary Clearing (cycles)
Back-up Clearing (cycles)
Stability Performance 2018 pre
2018 post
2025 pre
2025 post
J319 Faults
J319-SLG-01 ANO 500 KV ANO U2 and GSU No Tripping 5.00 none stable stable stable stable
J319-SLG-02 ANO 500 kV ANO – Ft Smith 500kV line ANO – Mabelvale 500 kV 4.50 12.25 stable stable stable stable
J319-SLG-03 ANO 500 KV ANO – Mabelvale 500 kV line ANO – Ft Smith 500 kV line 5.00 14.00 stable stable stable stable
J319-SLG-04 ANO 500 kV ANO 500/161/22 kV Xfmr ANO – J319 Tap 500 kV 5.50 14.35 NA stable NA stable
J319-SLG-4a ANO 500 kV ANO 500/161/22 kV Xfmr ANO – Pleasant Hill 500 kV 5.50 14.35 stable NA stable NA
J319-SLG-05 J319 TAP 500 kV J319 Tap – Pleasant Hill 500 kV line Pleasant Hill – Mayflower 500 kV line 5.00 13.00 NA stable NA stable
J319-SLG-06 J319 TAP 500 kV J319 Tap – ANO 500 kV line J319TAP 500 kV Pole #1 5.00 14.00 NA stable NA stable
J319-SLG-07 J319 TAP 500 kV J319 Tap – Pleasant Hill 500 kV line J319TAP 500 kV Pole #1 5.00 14.00 NA stable NA stable
J319-SLG-08 Pleasant Hill 500 kV Pleasant Hill – Mayflower 500 kV line Pleasant Hill – J319 Tap 500 kV line 5.00 14.00 NA stable NA stable
J319-SLG-09 White Bluff 500 kV White Bluff – Sheridan 500 kV line White Bluff – Keo 500 kV line 5.00 14.00 unstable unstable unstable unstable
J417 Faults
J417-SLG-01 Nelson 230 kV Nelson 230 kV north bus, Nelson U4 and U6 NA 23.25 various stable stable stable stable
J417-SLG-02 Sabine 230 kV Sabine 230/138 kV auto 138 kV side No tripping 5.00 14.00 stable stable stable stable
J417-SLG-03 Nelson 230 kV Nelson – Moss Bluff 230 kV line Nelson – Penton Rd 230 kV line 6.00 15.00 stable stable stable stable
J417-SLG-04 Sabine 230 kV Sabine – China 230 kV line No tripping 6.00 15.00 stable stable stable stable
Note: All fault clearing times refer to the elapsed time from the inception of a given fault. That is 4.5- cy+7.75 cy = 12.25 cy. Similarly, 5.5 cy +8.5 cy = 14 cy etc.
11
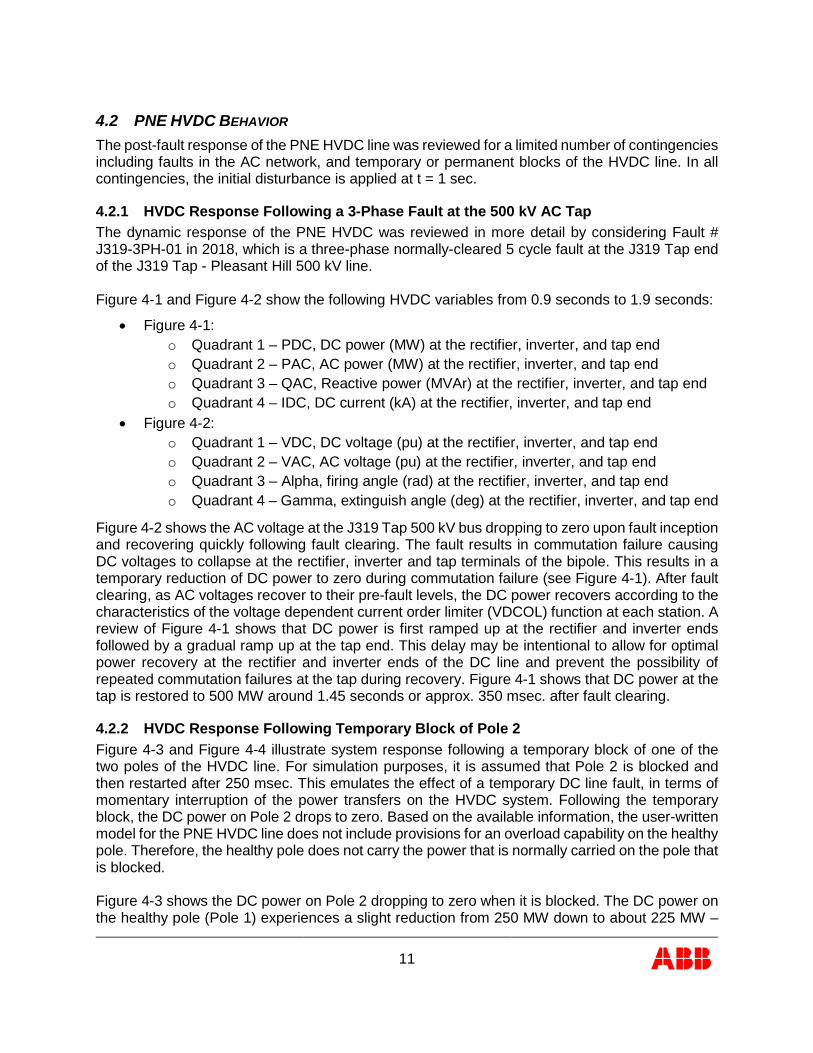
4.2 PNE HVDC BEHAVIOR The post-fault response of the PNE HVDC line was reviewed for a limited number of contingencies including faults in the AC network, and temporary or permanent blocks of the HVDC line. In all contingencies, the initial disturbance is applied at t = 1 sec.
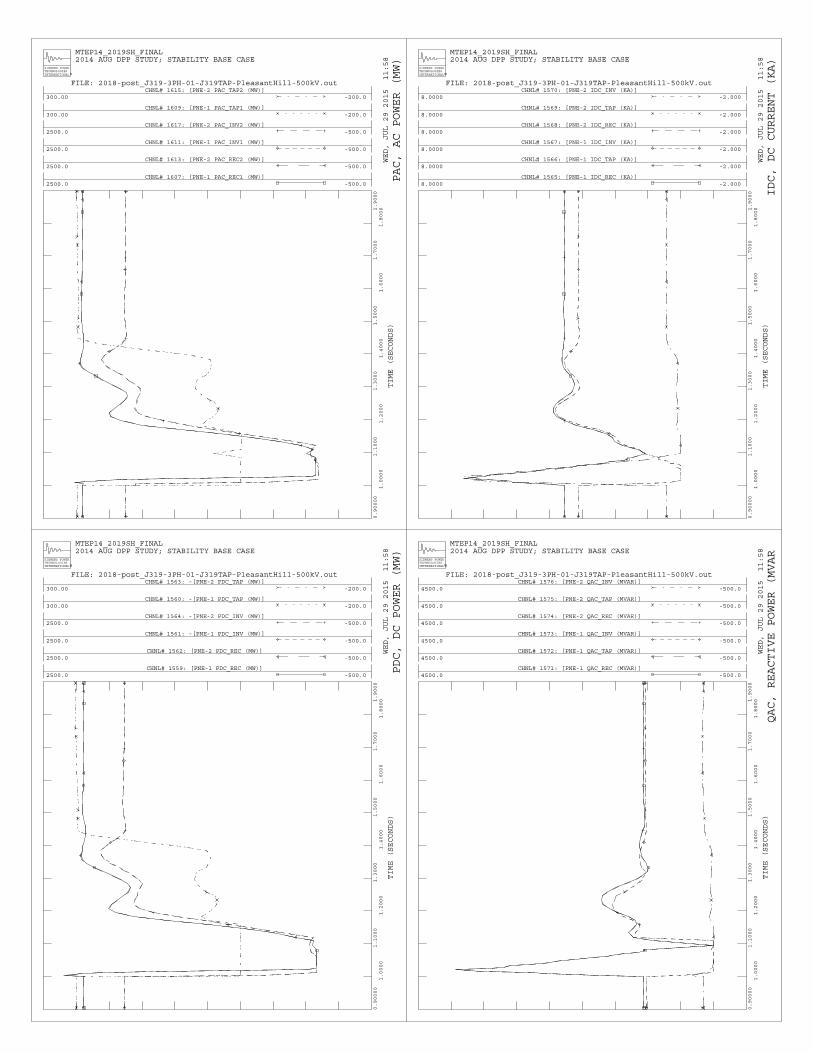
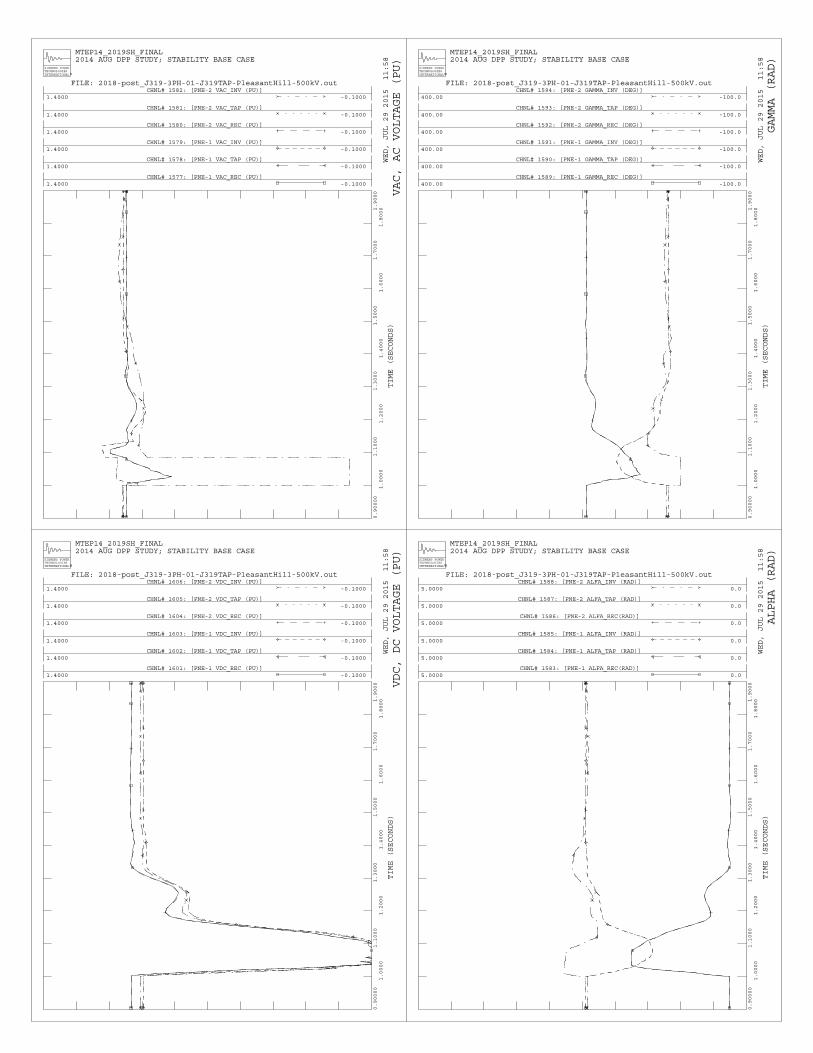
4.2.1 HVDC Response Following a 3-Phase Fault at the 500 kV AC Tap The dynamic response of the PNE HVDC was reviewed in more detail by considering Fault # J319-3PH-01 in 2018, which is a three-phase normally-cleared 5 cycle fault at the J319 Tap end of the J319 Tap - Pleasant Hill 500 kV line. Figure 4-1 and Figure 4-2 show the following HVDC variables from 0.9 seconds to 1.9 seconds:
• Figure 4-1: o Quadrant 1 – PDC, DC power (MW) at the rectifier, inverter, and tap end o Quadrant 2 – PAC, AC power (MW) at the rectifier, inverter, and tap end o Quadrant 3 – QAC, Reactive power (MVAr) at the rectifier, inverter, and tap end o Quadrant 4 – IDC, DC current (kA) at the rectifier, inverter, and tap end
• Figure 4-2: o Quadrant 1 – VDC, DC voltage (pu) at the rectifier, inverter, and tap end o Quadrant 2 – VAC, AC voltage (pu) at the rectifier, inverter, and tap end o Quadrant 3 – Alpha, firing angle (rad) at the rectifier, inverter, and tap end o Quadrant 4 – Gamma, extinguish angle (deg) at the rectifier, inverter, and tap end
Figure 4-2 shows the AC voltage at the J319 Tap 500 kV bus dropping to zero upon fault inception and recovering quickly following fault clearing. The fault results in commutation failure causing DC voltages to collapse at the rectifier, inverter and tap terminals of the bipole. This results in a temporary reduction of DC power to zero during commutation failure (see Figure 4-1). After fault clearing, as AC voltages recover to their pre-fault levels, the DC power recovers according to the characteristics of the voltage dependent current order limiter (VDCOL) function at each station. A review of Figure 4-1 shows that DC power is first ramped up at the rectifier and inverter ends followed by a gradual ramp up at the tap end. This delay may be intentional to allow for optimal power recovery at the rectifier and inverter ends of the DC line and prevent the possibility of repeated commutation failures at the tap during recovery. Figure 4-1 shows that DC power at the tap is restored to 500 MW around 1.45 seconds or approx. 350 msec. after fault clearing.
4.2.2 HVDC Response Following Temporary Block of Pole 2 Figure 4-3 and Figure 4-4 illustrate system response following a temporary block of one of the two poles of the HVDC line. For simulation purposes, it is assumed that Pole 2 is blocked and then restarted after 250 msec. This emulates the effect of a temporary DC line fault, in terms of momentary interruption of the power transfers on the HVDC system. Following the temporary block, the DC power on Pole 2 drops to zero. Based on the available information, the user-written model for the PNE HVDC line does not include provisions for an overload capability on the healthy pole. Therefore, the healthy pole does not carry the power that is normally carried on the pole that is blocked. Figure 4-3 shows the DC power on Pole 2 dropping to zero when it is blocked. The DC power on the healthy pole (Pole 1) experiences a slight reduction from 250 MW down to about 225 MW –

12
this is due to a slight drop in the DC voltage on Pole 1. The DC current on the healthy pole remains unaffected by the pole block. Figure 4-4 shows a slight increase in AC voltages at all three terminals of the DC line when Pole 2 is blocked. This is because the filters at the terminals of the DC line continue to remain in service during the temporary block. After Pole 2 is unblocked at 1.25 seconds, the DC current on that pole rapidly increases toward its pre-fault level. This results in an increased reactive power absorption particularly at the rectifier and inverter ends of the DC line causing voltages at these terminals to sag. The lost MW-seconds during the HVDC power interruption has also resulted in machine rotor angles in the AC network to be different from their pre-disturbance values, which also can contribute to AC voltage effects during the HVDC recovery. See Figure 4-3. There is minimal impact on the AC voltages at the tap end. See Figure 4-4. It should be noted that this simulation is not realistic in that it does not emulate a DC line fault. For a DC line fault, there will be a DC overcurrent that the rectifier will see. Similar to the DC overcurrent for an AC fault at the tap, this DC overcurrent at the rectifier results in a momentary increase of reactive power absorbed from the rectifier AC network. The rectifier control system responses to the DC overcurrent by increasing Alpha, and the DC line fault protection will force Alpha to high values (rectifier retard) to discharge the line. After a few hundred milliseconds, the rectifier retard is released and the converters restart. This results in a behavior very different from this simulation. Our understanding is that this PNE HVDC line model cannot simulate a DC line fault and associated rectifier retard.
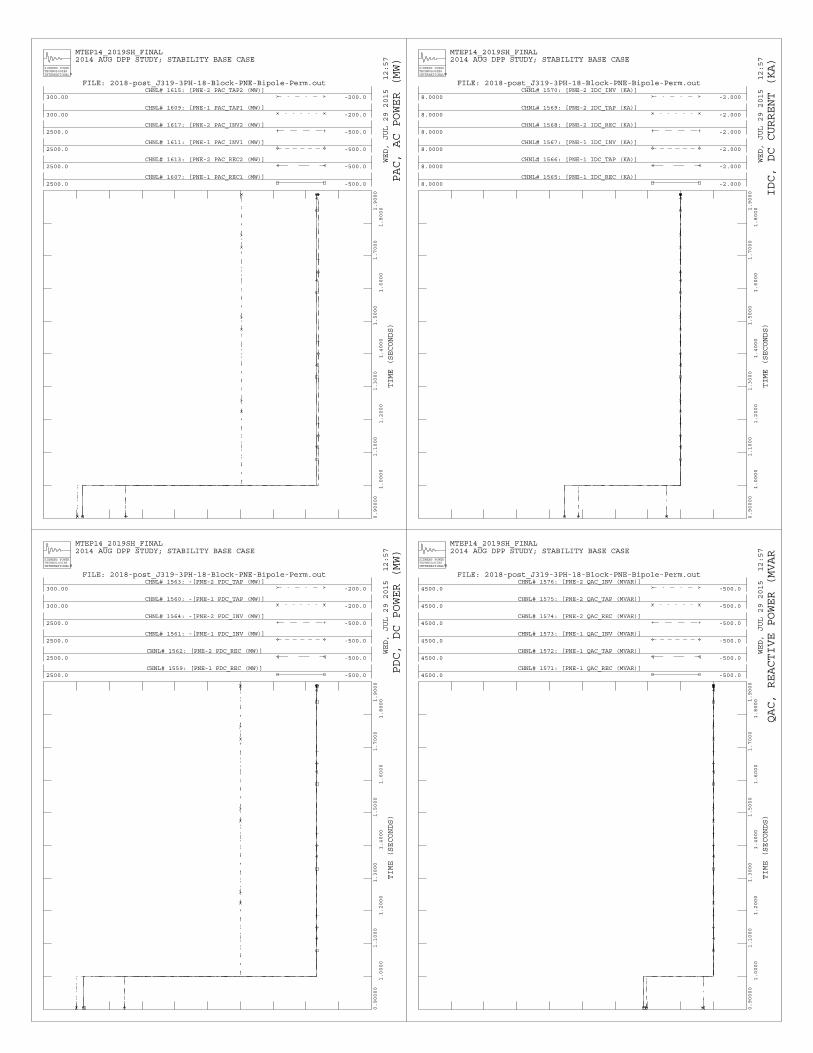
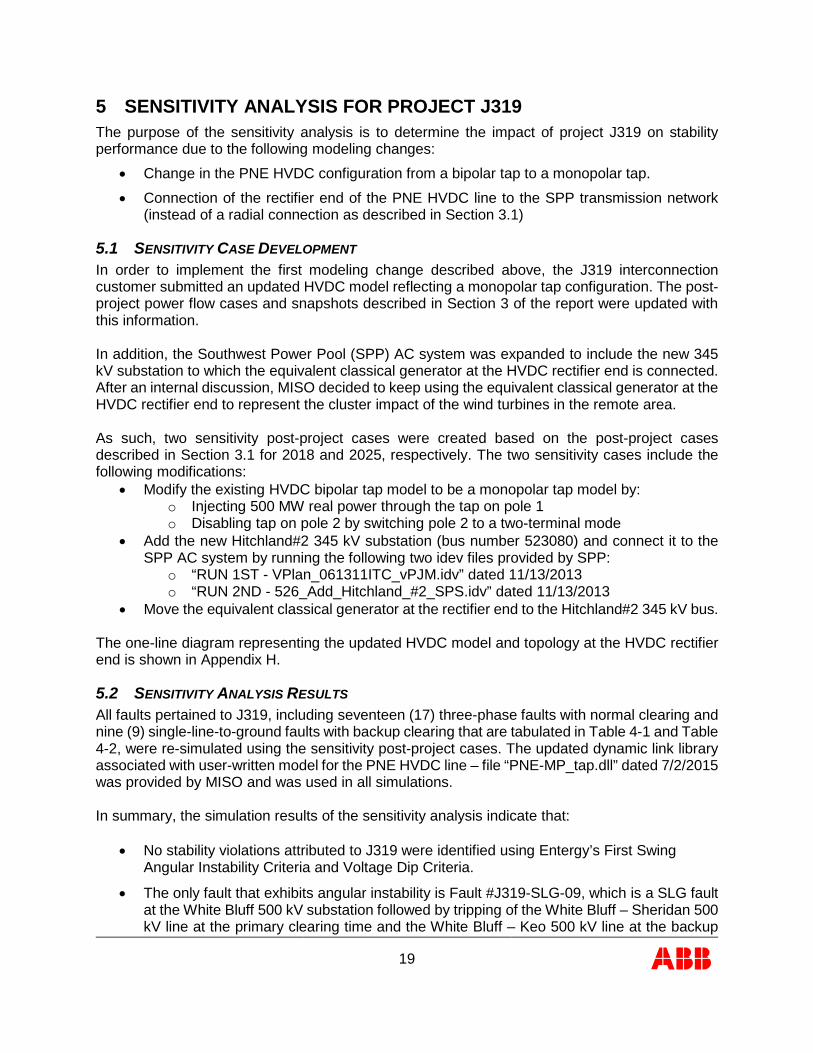
4.2.3 HVDC Response to Permanent Block of Bipole Figure 4-5 and Figure 4-6 illustrate HVDC response after permanently blocking the HVDC bipole. For simulation purposes, it is assumed that all 4300 MW of wind generation is cross-tripped at the instant of the bipole block. AC filter banks at the rectifier end are also cross-tripped at the instant of the bipole block (strictly speaking, the wind generation and filter banks are tripped a few milliseconds after the bipole block; however, this delay was not simulated). Figure 4-5 and Figure 4-6 show DC currents and voltages dropping to zero at t = 1.0 second. AC voltages at the inverter and tap terminals experience over-voltages because the filters at these terminals are assumed to be in-service. AC voltages at the J319 tap bus increase to 1.17 pu – these over-voltages can be mitigated by tripping the AC filter banks (in general, these filter banks are automatically tripped with a short time delay after the bipole block).
CHNL# 1559: [PNE-1 PDC_REC (MW)]2500.0 -500.0
CHNL# 1562: [PNE-2 PDC_REC (MW)]2500.0 -500.0
CHNL# 1561: -[PNE-1 PDC_INV (MW)]2500.0 -500.0
CHNL# 1564: -[PNE-2 PDC_INV (MW)]2500.0 -500.0
CHNL# 1560: -[PNE-1 PDC_TAP (MW)]300.00 -200.0
CHNL# 1563: -[PNE-2 PDC_TAP (MW)]300.00 -200.0
MTEP14_2019SH_FINAL2014 AUG DPP STUDY; STABILITY BASE CASE
WED, JUL 29 2015 11:58
TIME (SECONDS)
SIEMENS POWERTECHNOLOGIESINTERNATIONAL R
0.90000
1.0000
1.1000
1.2000
1.3000
1.4000
1.5000
1.6000
1.7000
1.80001.9000
FILE: 2018-post_J319-3PH-01-J319TAP-PleasantHill-500kV.out
PDC, DC POWER (MW)
CHNL# 1607: [PNE-1 PAC_REC1 (MW)]2500.0 -500.0
CHNL# 1613: [PNE-2 PAC_REC2 (MW)]2500.0 -500.0
CHNL# 1611: [PNE-1 PAC_INV1 (MW)]2500.0 -500.0
CHNL# 1617: [PNE-2 PAC_INV2 (MW)]2500.0 -500.0
CHNL# 1609: [PNE-1 PAC_TAP1 (MW)]300.00 -200.0
CHNL# 1615: [PNE-2 PAC_TAP2 (MW)]300.00 -200.0
MTEP14_2019SH_FINAL2014 AUG DPP STUDY; STABILITY BASE CASE
WED, JUL 29 2015 11:58
TIME (SECONDS)
SIEMENS POWERTECHNOLOGIESINTERNATIONAL R
0.90000
1.0000
1.1000
1.2000
1.3000
1.4000
1.5000
1.6000
1.7000
1.80001.9000
FILE: 2018-post_J319-3PH-01-J319TAP-PleasantHill-500kV.out
PAC, AC POWER (MW)
CHNL# 1571: [PNE-1 QAC_REC (MVAR)]4500.0 -500.0
CHNL# 1572: [PNE-1 QAC_TAP (MVAR)]4500.0 -500.0
CHNL# 1573: [PNE-1 QAC_INV (MVAR)]4500.0 -500.0
CHNL# 1574: [PNE-2 QAC_REC (MVAR)]4500.0 -500.0
CHNL# 1575: [PNE-2 QAC_TAP (MVAR)]4500.0 -500.0
CHNL# 1576: [PNE-2 QAC_INV (MVAR)]4500.0 -500.0
MTEP14_2019SH_FINAL2014 AUG DPP STUDY; STABILITY BASE CASE
WED, JUL 29 2015 11:58
TIME (SECONDS)
SIEMENS POWERTECHNOLOGIESINTERNATIONAL R
0.90000
1.0000
1.1000
1.2000
1.3000
1.4000
1.5000
1.6000
1.7000
1.80001.9000
FILE: 2018-post_J319-3PH-01-J319TAP-PleasantHill-500kV.out
QAC, REACTIVE POWER (MVAR
CHNL# 1565: [PNE-1 IDC_REC (KA)]8.0000 -2.000
CHNL# 1566: [PNE-1 IDC_TAP (KA)]8.0000 -2.000
CHNL# 1567: [PNE-1 IDC_INV (KA)]8.0000 -2.000
CHNL# 1568: [PNE-2 IDC_REC (KA)]8.0000 -2.000
CHNL# 1569: [PNE-2 IDC_TAP (KA)]8.0000 -2.000
CHNL# 1570: [PNE-2 IDC_INV (KA)]8.0000 -2.000
MTEP14_2019SH_FINAL2014 AUG DPP STUDY; STABILITY BASE CASE
WED, JUL 29 2015 11:58
TIME (SECONDS)
SIEMENS POWERTECHNOLOGIESINTERNATIONAL R
0.90000
1.0000
1.1000
1.2000
1.3000
1.4000
1.5000
1.6000
1.7000
1.80001.9000
FILE: 2018-post_J319-3PH-01-J319TAP-PleasantHill-500kV.out
IDC, DC CURRENT (KA)
CHNL# 1601: [PNE-1 VDC_REC (PU)]1.4000 -0.1000
CHNL# 1602: [PNE-1 VDC_TAP (PU)]1.4000 -0.1000
CHNL# 1603: [PNE-1 VDC_INV (PU)]1.4000 -0.1000
CHNL# 1604: [PNE-2 VDC_REC (PU)]1.4000 -0.1000
CHNL# 1605: [PNE-2 VDC_TAP (PU)]1.4000 -0.1000
CHNL# 1606: [PNE-2 VDC_INV (PU)]1.4000 -0.1000
MTEP14_2019SH_FINAL2014 AUG DPP STUDY; STABILITY BASE CASE
WED, JUL 29 2015 11:58
TIME (SECONDS)
SIEMENS POWERTECHNOLOGIESINTERNATIONAL R
0.90000
1.0000
1.1000
1.2000
1.3000
1.4000
1.5000
1.6000
1.7000
1.80001.9000
FILE: 2018-post_J319-3PH-01-J319TAP-PleasantHill-500kV.out
VDC, DC VOLTAGE (PU)
CHNL# 1577: [PNE-1 VAC_REC (PU)]1.4000 -0.1000
CHNL# 1578: [PNE-1 VAC_TAP (PU)]1.4000 -0.1000
CHNL# 1579: [PNE-1 VAC_INV (PU)]1.4000 -0.1000
CHNL# 1580: [PNE-2 VAC_REC (PU)]1.4000 -0.1000
CHNL# 1581: [PNE-2 VAC_TAP (PU)]1.4000 -0.1000
CHNL# 1582: [PNE-2 VAC_INV (PU)]1.4000 -0.1000
MTEP14_2019SH_FINAL2014 AUG DPP STUDY; STABILITY BASE CASE
WED, JUL 29 2015 11:58
TIME (SECONDS)
SIEMENS POWERTECHNOLOGIESINTERNATIONAL R
0.90000
1.0000
1.1000
1.2000
1.3000
1.4000
1.5000
1.6000
1.7000
1.80001.9000
FILE: 2018-post_J319-3PH-01-J319TAP-PleasantHill-500kV.out
VAC, AC VOLTAGE (PU)
CHNL# 1583: [PNE-1 ALFA_REC(RAD)]5.0000 0.0
CHNL# 1584: [PNE-1 ALFA_TAP (RAD)]5.0000 0.0
CHNL# 1585: [PNE-1 ALFA_INV (RAD)]5.0000 0.0
CHNL# 1586: [PNE-2 ALFA_REC(RAD)]5.0000 0.0
CHNL# 1587: [PNE-2 ALFA_TAP (RAD)]5.0000 0.0
CHNL# 1588: [PNE-2 ALFA_INV (RAD)]5.0000 0.0
MTEP14_2019SH_FINAL2014 AUG DPP STUDY; STABILITY BASE CASE
WED, JUL 29 2015 11:58
TIME (SECONDS)
SIEMENS POWERTECHNOLOGIESINTERNATIONAL R
0.90000
1.0000
1.1000
1.2000
1.3000
1.4000
1.5000
1.6000
1.7000
1.80001.9000
FILE: 2018-post_J319-3PH-01-J319TAP-PleasantHill-500kV.out
ALPHA (RAD)
CHNL# 1589: [PNE-1 GAMMA_REC (DEG)]400.00 -100.0
CHNL# 1590: [PNE-1 GAMMA_TAP (DEG)]400.00 -100.0
CHNL# 1591: [PNE-1 GAMMA_INV (DEG)]400.00 -100.0
CHNL# 1592: [PNE-2 GAMMA_REC (DEG)]400.00 -100.0
CHNL# 1593: [PNE-2 GAMMA_TAP (DEG)]400.00 -100.0
CHNL# 1594: [PNE-2 GAMMA_INV (DEG)]400.00 -100.0
MTEP14_2019SH_FINAL2014 AUG DPP STUDY; STABILITY BASE CASE
WED, JUL 29 2015 11:58
TIME (SECONDS)
SIEMENS POWERTECHNOLOGIESINTERNATIONAL R
0.90000
1.0000
1.1000
1.2000
1.3000
1.4000
1.5000
1.6000
1.7000
1.80001.9000
FILE: 2018-post_J319-3PH-01-J319TAP-PleasantHill-500kV.out
GAMMA (RAD)
CHNL# 1559: [PNE-1 PDC_REC (MW)]2500.0 -500.0
CHNL# 1562: [PNE-2 PDC_REC (MW)]2500.0 -500.0
CHNL# 1561: -[PNE-1 PDC_INV (MW)]2500.0 -500.0
CHNL# 1564: -[PNE-2 PDC_INV (MW)]2500.0 -500.0
CHNL# 1560: -[PNE-1 PDC_TAP (MW)]300.00 -200.0
CHNL# 1563: -[PNE-2 PDC_TAP (MW)]300.00 -200.0
MTEP14_2019SH_FINAL2014 AUG DPP STUDY; STABILITY BASE CASE
WED, JUL 29 2015 12:57
TIME (SECONDS)
SIEMENS POWERTECHNOLOGIESINTERNATIONAL R
0.90000
1.0000
1.1000
1.2000
1.3000
1.4000
1.5000
1.6000
1.7000
1.80001.9000
FILE: 2018-post_J319-3PH-16-Block-PNE-Pole2-250ms.out
PDC, DC POWER (MW)
CHNL# 1607: [PNE-1 PAC_REC1 (MW)]2500.0 -500.0
CHNL# 1613: [PNE-2 PAC_REC2 (MW)]2500.0 -500.0
CHNL# 1611: [PNE-1 PAC_INV1 (MW)]2500.0 -500.0
CHNL# 1617: [PNE-2 PAC_INV2 (MW)]2500.0 -500.0
CHNL# 1609: [PNE-1 PAC_TAP1 (MW)]300.00 -200.0
CHNL# 1615: [PNE-2 PAC_TAP2 (MW)]300.00 -200.0
MTEP14_2019SH_FINAL2014 AUG DPP STUDY; STABILITY BASE CASE
WED, JUL 29 2015 12:57
TIME (SECONDS)
SIEMENS POWERTECHNOLOGIESINTERNATIONAL R
0.90000
1.0000
1.1000
1.2000
1.3000
1.4000
1.5000
1.6000
1.7000
1.80001.9000
FILE: 2018-post_J319-3PH-16-Block-PNE-Pole2-250ms.out
PAC, AC POWER (MW)
CHNL# 1571: [PNE-1 QAC_REC (MVAR)]4500.0 -500.0
CHNL# 1572: [PNE-1 QAC_TAP (MVAR)]4500.0 -500.0
CHNL# 1573: [PNE-1 QAC_INV (MVAR)]4500.0 -500.0
CHNL# 1574: [PNE-2 QAC_REC (MVAR)]4500.0 -500.0
CHNL# 1575: [PNE-2 QAC_TAP (MVAR)]4500.0 -500.0
CHNL# 1576: [PNE-2 QAC_INV (MVAR)]4500.0 -500.0
MTEP14_2019SH_FINAL2014 AUG DPP STUDY; STABILITY BASE CASE
WED, JUL 29 2015 12:57
TIME (SECONDS)
SIEMENS POWERTECHNOLOGIESINTERNATIONAL R
0.90000
1.0000
1.1000
1.2000
1.3000
1.4000
1.5000
1.6000
1.7000
1.80001.9000
FILE: 2018-post_J319-3PH-16-Block-PNE-Pole2-250ms.out
QAC, REACTIVE POWER (MVAR
CHNL# 1565: [PNE-1 IDC_REC (KA)]8.0000 -2.000
CHNL# 1566: [PNE-1 IDC_TAP (KA)]8.0000 -2.000
CHNL# 1567: [PNE-1 IDC_INV (KA)]8.0000 -2.000
CHNL# 1568: [PNE-2 IDC_REC (KA)]8.0000 -2.000
CHNL# 1569: [PNE-2 IDC_TAP (KA)]8.0000 -2.000
CHNL# 1570: [PNE-2 IDC_INV (KA)]8.0000 -2.000
MTEP14_2019SH_FINAL2014 AUG DPP STUDY; STABILITY BASE CASE
WED, JUL 29 2015 12:57
TIME (SECONDS)
SIEMENS POWERTECHNOLOGIESINTERNATIONAL R
0.90000
1.0000
1.1000
1.2000
1.3000
1.4000
1.5000
1.6000
1.7000
1.80001.9000
FILE: 2018-post_J319-3PH-16-Block-PNE-Pole2-250ms.out
IDC, DC CURRENT (KA)
CHNL# 1601: [PNE-1 VDC_REC (PU)]1.4000 -0.1000
CHNL# 1602: [PNE-1 VDC_TAP (PU)]1.4000 -0.1000
CHNL# 1603: [PNE-1 VDC_INV (PU)]1.4000 -0.1000
CHNL# 1604: [PNE-2 VDC_REC (PU)]1.4000 -0.1000
CHNL# 1605: [PNE-2 VDC_TAP (PU)]1.4000 -0.1000
CHNL# 1606: [PNE-2 VDC_INV (PU)]1.4000 -0.1000
MTEP14_2019SH_FINAL2014 AUG DPP STUDY; STABILITY BASE CASE
WED, JUL 29 2015 12:57
TIME (SECONDS)
SIEMENS POWERTECHNOLOGIESINTERNATIONAL R
0.90000
1.0000
1.1000
1.2000
1.3000
1.4000
1.5000
1.6000
1.7000
1.80001.9000
FILE: 2018-post_J319-3PH-16-Block-PNE-Pole2-250ms.out
VDC, DC VOLTAGE (PU)
CHNL# 1577: [PNE-1 VAC_REC (PU)]1.4000 -0.1000
CHNL# 1578: [PNE-1 VAC_TAP (PU)]1.4000 -0.1000
CHNL# 1579: [PNE-1 VAC_INV (PU)]1.4000 -0.1000
CHNL# 1580: [PNE-2 VAC_REC (PU)]1.4000 -0.1000
CHNL# 1581: [PNE-2 VAC_TAP (PU)]1.4000 -0.1000
CHNL# 1582: [PNE-2 VAC_INV (PU)]1.4000 -0.1000
MTEP14_2019SH_FINAL2014 AUG DPP STUDY; STABILITY BASE CASE
WED, JUL 29 2015 12:57
TIME (SECONDS)
SIEMENS POWERTECHNOLOGIESINTERNATIONAL R
0.90000
1.0000
1.1000
1.2000
1.3000
1.4000
1.5000
1.6000
1.7000
1.80001.9000
FILE: 2018-post_J319-3PH-16-Block-PNE-Pole2-250ms.out
VAC, AC VOLTAGE (PU)
CHNL# 1583: [PNE-1 ALFA_REC(RAD)]5.0000 0.0
CHNL# 1584: [PNE-1 ALFA_TAP (RAD)]5.0000 0.0
CHNL# 1585: [PNE-1 ALFA_INV (RAD)]5.0000 0.0
CHNL# 1586: [PNE-2 ALFA_REC(RAD)]5.0000 0.0
CHNL# 1587: [PNE-2 ALFA_TAP (RAD)]5.0000 0.0
CHNL# 1588: [PNE-2 ALFA_INV (RAD)]5.0000 0.0
MTEP14_2019SH_FINAL2014 AUG DPP STUDY; STABILITY BASE CASE
WED, JUL 29 2015 12:57
TIME (SECONDS)
SIEMENS POWERTECHNOLOGIESINTERNATIONAL R
0.90000
1.0000
1.1000
1.2000
1.3000
1.4000
1.5000
1.6000
1.7000
1.80001.9000
FILE: 2018-post_J319-3PH-16-Block-PNE-Pole2-250ms.out
ALPHA (RAD)
CHNL# 1589: [PNE-1 GAMMA_REC (DEG)]400.00 -100.0
CHNL# 1590: [PNE-1 GAMMA_TAP (DEG)]400.00 -100.0
CHNL# 1591: [PNE-1 GAMMA_INV (DEG)]400.00 -100.0
CHNL# 1592: [PNE-2 GAMMA_REC (DEG)]400.00 -100.0
CHNL# 1593: [PNE-2 GAMMA_TAP (DEG)]400.00 -100.0
CHNL# 1594: [PNE-2 GAMMA_INV (DEG)]400.00 -100.0
MTEP14_2019SH_FINAL2014 AUG DPP STUDY; STABILITY BASE CASE
WED, JUL 29 2015 12:57
TIME (SECONDS)
SIEMENS POWERTECHNOLOGIESINTERNATIONAL R
0.90000
1.0000
1.1000
1.2000
1.3000
1.4000
1.5000
1.6000
1.7000
1.80001.9000
FILE: 2018-post_J319-3PH-16-Block-PNE-Pole2-250ms.out
GAMMA (RAD)
CHNL# 1559: [PNE-1 PDC_REC (MW)]2500.0 -500.0
CHNL# 1562: [PNE-2 PDC_REC (MW)]2500.0 -500.0
CHNL# 1561: -[PNE-1 PDC_INV (MW)]2500.0 -500.0
CHNL# 1564: -[PNE-2 PDC_INV (MW)]2500.0 -500.0
CHNL# 1560: -[PNE-1 PDC_TAP (MW)]300.00 -200.0
CHNL# 1563: -[PNE-2 PDC_TAP (MW)]300.00 -200.0
MTEP14_2019SH_FINAL2014 AUG DPP STUDY; STABILITY BASE CASE
WED, JUL 29 2015 12:57
TIME (SECONDS)
SIEMENS POWERTECHNOLOGIESINTERNATIONAL R
0.90000
1.0000
1.1000
1.2000
1.3000
1.4000
1.5000
1.6000
1.7000
1.80001.9000
FILE: 2018-post_J319-3PH-18-Block-PNE-Bipole-Perm.out
PDC, DC POWER (MW)
CHNL# 1607: [PNE-1 PAC_REC1 (MW)]2500.0 -500.0
CHNL# 1613: [PNE-2 PAC_REC2 (MW)]2500.0 -500.0
CHNL# 1611: [PNE-1 PAC_INV1 (MW)]2500.0 -500.0
CHNL# 1617: [PNE-2 PAC_INV2 (MW)]2500.0 -500.0
CHNL# 1609: [PNE-1 PAC_TAP1 (MW)]300.00 -200.0
CHNL# 1615: [PNE-2 PAC_TAP2 (MW)]300.00 -200.0
MTEP14_2019SH_FINAL2014 AUG DPP STUDY; STABILITY BASE CASE
WED, JUL 29 2015 12:57
TIME (SECONDS)
SIEMENS POWERTECHNOLOGIESINTERNATIONAL R
0.90000
1.0000
1.1000
1.2000
1.3000
1.4000
1.5000
1.6000
1.7000
1.80001.9000
FILE: 2018-post_J319-3PH-18-Block-PNE-Bipole-Perm.out
PAC, AC POWER (MW)
CHNL# 1571: [PNE-1 QAC_REC (MVAR)]4500.0 -500.0
CHNL# 1572: [PNE-1 QAC_TAP (MVAR)]4500.0 -500.0
CHNL# 1573: [PNE-1 QAC_INV (MVAR)]4500.0 -500.0
CHNL# 1574: [PNE-2 QAC_REC (MVAR)]4500.0 -500.0
CHNL# 1575: [PNE-2 QAC_TAP (MVAR)]4500.0 -500.0
CHNL# 1576: [PNE-2 QAC_INV (MVAR)]4500.0 -500.0
MTEP14_2019SH_FINAL2014 AUG DPP STUDY; STABILITY BASE CASE
WED, JUL 29 2015 12:57
TIME (SECONDS)
SIEMENS POWERTECHNOLOGIESINTERNATIONAL R
0.90000
1.0000
1.1000
1.2000
1.3000
1.4000
1.5000
1.6000
1.7000
1.80001.9000
FILE: 2018-post_J319-3PH-18-Block-PNE-Bipole-Perm.out
QAC, REACTIVE POWER (MVAR
CHNL# 1565: [PNE-1 IDC_REC (KA)]8.0000 -2.000
CHNL# 1566: [PNE-1 IDC_TAP (KA)]8.0000 -2.000
CHNL# 1567: [PNE-1 IDC_INV (KA)]8.0000 -2.000
CHNL# 1568: [PNE-2 IDC_REC (KA)]8.0000 -2.000
CHNL# 1569: [PNE-2 IDC_TAP (KA)]8.0000 -2.000
CHNL# 1570: [PNE-2 IDC_INV (KA)]8.0000 -2.000
MTEP14_2019SH_FINAL2014 AUG DPP STUDY; STABILITY BASE CASE
WED, JUL 29 2015 12:57
TIME (SECONDS)
SIEMENS POWERTECHNOLOGIESINTERNATIONAL R
0.90000
1.0000
1.1000
1.2000
1.3000
1.4000
1.5000
1.6000
1.7000
1.80001.9000
FILE: 2018-post_J319-3PH-18-Block-PNE-Bipole-Perm.out
IDC, DC CURRENT (KA)

CHNL# 1601: [PNE-1 VDC_REC (PU)]1.4000 -0.1000
CHNL# 1602: [PNE-1 VDC_TAP (PU)]1.4000 -0.1000
CHNL# 1603: [PNE-1 VDC_INV (PU)]1.4000 -0.1000
CHNL# 1604: [PNE-2 VDC_REC (PU)]1.4000 -0.1000
CHNL# 1605: [PNE-2 VDC_TAP (PU)]1.4000 -0.1000
CHNL# 1606: [PNE-2 VDC_INV (PU)]1.4000 -0.1000
MTEP14_2019SH_FINAL2014 AUG DPP STUDY; STABILITY BASE CASE
WED, JUL 29 2015 12:57
TIME (SECONDS)
SIEMENS POWERTECHNOLOGIESINTERNATIONAL R
0.90000
1.0000
1.1000
1.2000
1.3000
1.4000
1.5000
1.6000
1.7000
1.80001.9000
FILE: 2018-post_J319-3PH-18-Block-PNE-Bipole-Perm.out
VDC, DC VOLTAGE (PU)
CHNL# 1577: [PNE-1 VAC_REC (PU)]1.4000 -0.1000
CHNL# 1578: [PNE-1 VAC_TAP (PU)]1.4000 -0.1000
CHNL# 1579: [PNE-1 VAC_INV (PU)]1.4000 -0.1000
CHNL# 1580: [PNE-2 VAC_REC (PU)]1.4000 -0.1000
CHNL# 1581: [PNE-2 VAC_TAP (PU)]1.4000 -0.1000
CHNL# 1582: [PNE-2 VAC_INV (PU)]1.4000 -0.1000
MTEP14_2019SH_FINAL2014 AUG DPP STUDY; STABILITY BASE CASE
WED, JUL 29 2015 12:57
TIME (SECONDS)
SIEMENS POWERTECHNOLOGIESINTERNATIONAL R
0.90000
1.0000
1.1000
1.2000
1.3000
1.4000
1.5000
1.6000
1.7000
1.80001.9000
FILE: 2018-post_J319-3PH-18-Block-PNE-Bipole-Perm.out
VAC, AC VOLTAGE (PU)
CHNL# 1583: [PNE-1 ALFA_REC(RAD)]5.0000 0.0
CHNL# 1584: [PNE-1 ALFA_TAP (RAD)]5.0000 0.0
CHNL# 1585: [PNE-1 ALFA_INV (RAD)]5.0000 0.0
CHNL# 1586: [PNE-2 ALFA_REC(RAD)]5.0000 0.0
CHNL# 1587: [PNE-2 ALFA_TAP (RAD)]5.0000 0.0
CHNL# 1588: [PNE-2 ALFA_INV (RAD)]5.0000 0.0
MTEP14_2019SH_FINAL2014 AUG DPP STUDY; STABILITY BASE CASE
WED, JUL 29 2015 12:57
TIME (SECONDS)
SIEMENS POWERTECHNOLOGIESINTERNATIONAL R
0.90000
1.0000
1.1000
1.2000
1.3000
1.4000
1.5000
1.6000
1.7000
1.80001.9000
FILE: 2018-post_J319-3PH-18-Block-PNE-Bipole-Perm.out
ALPHA (RAD)
CHNL# 1589: [PNE-1 GAMMA_REC (DEG)]400.00 -100.0
CHNL# 1590: [PNE-1 GAMMA_TAP (DEG)]400.00 -100.0
CHNL# 1591: [PNE-1 GAMMA_INV (DEG)]400.00 -100.0
CHNL# 1592: [PNE-2 GAMMA_REC (DEG)]400.00 -100.0
CHNL# 1593: [PNE-2 GAMMA_TAP (DEG)]400.00 -100.0
CHNL# 1594: [PNE-2 GAMMA_INV (DEG)]400.00 -100.0
MTEP14_2019SH_FINAL2014 AUG DPP STUDY; STABILITY BASE CASE
WED, JUL 29 2015 12:57
TIME (SECONDS)
SIEMENS POWERTECHNOLOGIESINTERNATIONAL R
0.90000
1.0000
1.1000
1.2000
1.3000
1.4000
1.5000
1.6000
1.7000
1.80001.9000
FILE: 2018-post_J319-3PH-18-Block-PNE-Bipole-Perm.out
GAMMA (RAD)
19
5 SENSITIVITY ANALYSIS FOR PROJECT J319 The purpose of the sensitivity analysis is to determine the impact of project J319 on stability performance due to the following modeling changes:
• Change in the PNE HVDC configuration from a bipolar tap to a monopolar tap.
• Connection of the rectifier end of the PNE HVDC line to the SPP transmission network (instead of a radial connection as described in Section 3.1)
5.1 SENSITIVITY CASE DEVELOPMENT In order to implement the first modeling change described above, the J319 interconnection customer submitted an updated HVDC model reflecting a monopolar tap configuration. The post-project power flow cases and snapshots described in Section 3 of the report were updated with this information. In addition, the Southwest Power Pool (SPP) AC system was expanded to include the new 345 kV substation to which the equivalent classical generator at the HVDC rectifier end is connected. After an internal discussion, MISO decided to keep using the equivalent classical generator at the HVDC rectifier end to represent the cluster impact of the wind turbines in the remote area. As such, two sensitivity post-project cases were created based on the post-project cases described in Section 3.1 for 2018 and 2025, respectively. The two sensitivity cases include the following modifications:
• Modify the existing HVDC bipolar tap model to be a monopolar tap model by: o Injecting 500 MW real power through the tap on pole 1 o Disabling tap on pole 2 by switching pole 2 to a two-terminal mode
• Add the new Hitchland#2 345 kV substation (bus number 523080) and connect it to the SPP AC system by running the following two idev files provided by SPP:
o “RUN 1ST - VPlan_061311ITC_vPJM.idv” dated 11/13/2013 o “RUN 2ND - 526_Add_Hitchland_#2_SPS.idv” dated 11/13/2013
• Move the equivalent classical generator at the rectifier end to the Hitchland#2 345 kV bus. The one-line diagram representing the updated HVDC model and topology at the HVDC rectifier end is shown in Appendix H.
5.2 SENSITIVITY ANALYSIS RESULTS All faults pertained to J319, including seventeen (17) three-phase faults with normal clearing and nine (9) single-line-to-ground faults with backup clearing that are tabulated in Table 4-1 and Table 4-2, were re-simulated using the sensitivity post-project cases. The updated dynamic link library associated with user-written model for the PNE HVDC line – file “PNE-MP_tap.dll” dated 7/2/2015 was provided by MISO and was used in all simulations. In summary, the simulation results of the sensitivity analysis indicate that:
• No stability violations attributed to J319 were identified using Entergy’s First Swing Angular Instability Criteria and Voltage Dip Criteria.
• The only fault that exhibits angular instability is Fault #J319-SLG-09, which is a SLG fault at the White Bluff 500 kV substation followed by tripping of the White Bluff – Sheridan 500 kV line at the primary clearing time and the White Bluff – Keo 500 kV line at the backup
20
clearing. Since the system was unstable following this fault in both pre-project and post-project cases, the angular instability is not attributed to J319.
All simulations were simulated for 20 seconds and the initial disturbance was applied at t = 1 sec. The first 10 seconds were plotted to facilitate better resolution during the transient stage. For each fault simulation performed using the sensitivity cases, the following eight (8) pages of plots are provided in in Appendix I through Appendix J for 2018 and 2025, respectively:
• Page 1: Rotor angles of the selected units monitored in the study area • Page 2: Speed deviation of the monitored units • Page 3: Active power generation (PELEC) of the monitored units • Page 4: Reactive power generation (QELEC) of the monitored units • Page 5: J319 and J417 local bus voltages • Page 6: J319 and J417 local bus voltages • Page 7: PNE Pole 1 variables
o Quadrant 1 – PAC (AC power, MW) and PDC (DC power, MW) at the rectifier, inverter, and tap end
o Quadrant 2 – QAC (reactive power, MVAr) and IDC (DC current, kA) at the rectifier, inverter, and tap end
o Quadrant 3 – VDC (DC voltage, pu) and VAC (AC voltage, pu) at the rectifier, inverter, and tap end
o Quadrant 4 – Alpha (firing angle, rad) and Gamma (extinguish angle, deg) at the rectifier, inverter, and tap end
• Page 8: PNE Pole 2 variables o Quadrant 1 – PAC (AC power, MW) and PDC (DC power, MW) at the rectifier and
inverter ends o Quadrant 2 – QAC (reactive power, MVAr) and IDC (DC current, kA) at the rectifier
and inverter ends o Quadrant 3 – VDC (DC voltage, pu) and VAC (AC voltage, pu) at the rectifier and
inverter ends o Quadrant 4 – Alpha (firing angle, rad) and Gamma (extinguish angle, deg) at the
rectifier and inverter ends
5.3 HVDC BEHAVIOR IN SENSITIVITY ANALYSIS The post-fault response of the PNE HVDC line was reviewed in more detail for the selected contingencies.
5.3.1 HVDC Response Following a 3-Phase Fault at the 500 kV AC Tap Fault # J319-3PH-01 in 2018 is a three-phase normally-cleared 5 cycle fault at the J319 Tap end of the J319 Tap - Pleasant Hill 500 kV line. Figure 5-1 and Figure 5-2 show the following HVDC variables of Pole 1 and Pole 2, respectively, from 0.9 seconds to 1.9 seconds:
• Quadrant 1 – PAC (AC power, MW) and PDC (DC power, MW) at the rectifier, inverter, and tap end

21
• Quadrant 2 – QAC (reactive power, MVAr) and IDC (DC current, kA) at the rectifier, inverter, and tap end
• Quadrant 3 – VDC (DC voltage, pu) and VAC (AC voltage, pu) at the rectifier, inverter, and tap end
• Quadrant 4 – Alpha (firing angle, rad) and Gamma (extinguish angle, deg) at the rectifier, inverter, and tap end
Quadrant-3 of Figure 5-1 shows the AC voltage at the J319 Tap 500 kV bus dropping to zero upon fault inception and recovering quickly following fault clearing. Similar to the description given in Section 4.2.1, the fault results in commutation failure causing DC voltages to collapse at the rectifier, inverter and tap terminals of Pole 1. This results in a temporary reduction of DC power to zero during commutation failure (see Quadrant 1 of Figure 5-1). After fault clearing, as AC voltages recover to their pre-fault levels, the DC power is ramped up through voltage dependent current order limiter (VDCOL) action. DC power is first ramped up at the rectifier and inverter ends followed by a gradual ramp up at the tap end. This delay is intentional to allow for optimal power recovery at the rectifier and inverter ends of the DC line and prevent the possibility of repeated commutation failures at the tap during recovery. Figure 5-1 shows that DC power at the tap is restored to 500 MW around 1.42 seconds or approx. 320 msec. after fault clearing. Figure 5-2 shows that the Pole 2 tap was disabled such that the AC / DC power at the “non-existent” tap end of Pole 2 are all zero.
5.3.2 HVDC Response Following Temporary Block of Pole 1 Figure 5-3 and Figure 5-4 illustrate system response following a temporary block of the HVDC Pole 1 for 250 msec. As shown in Quadrant-1 of Figure 5-3, the DC power on Pole 1 dropping to zero when it is blocked. Since the user-written model for the PNE HVDC line does not include provisions for an overload capability on the healthy pole, the healthy pole (Pole 2) does not carry the power that is normally carried on Pole 1 as illustrated by Quadrant-1 of Figure 5-4. The DC power on Pole 2 experiences a slight reduction due to a slight drop in the DC voltage on Pole 2. This reduction in DC voltage is attributed to an increase in DC line resistance when Pole 1 is blocked. Quadrant-2 of Figure 5-4 shows that the DC current on the healthy pole (Pole 2) remains largely unaffected by the pole block. After Pole 1 is unblocked at 1.25 seconds, the DC current on that pole rapidly increases toward its pre-fault level. This results in an increased reactive power absorption particularly at the rectifier and inverter ends of the DC line causing voltages at these terminals to sag. See Quadrant-2 and Quadrant-3 of Figure 5-3. Quadrant-3 of Figure 5-3 also shows a slight increase in AC voltages at all three terminals of the DC line when Pole 1 is blocked. This is because the filters at the terminals of the DC line continue to remain in service during the temporary block. There is minimal impact on the AC voltages at the tap end. Comments made in the last paragraph of Section 4.2.2 are also applicable here.

22
5.3.3 HVDC Response to Permanent Block of Pole 1 Figure 5-5 and Figure 5-6 illustrate HVDC response after permanently blocking the HVDC Pole 1. Figure 5-5 shows DC currents and voltages of Pole 1 dropping to zero at t = 1.0 second. AC voltages at the inverter and tap terminals experience over-voltages because the filters at these terminals are assumed to be in-service. AC voltage at the J319 tap bus increases to 1.07 pu – the over-voltages can be mitigated by tripping the AC filter banks associated with the blocked pole automatically.
5.3.4 HVDC Response to Permanent Block of Bipole Figure 5-7 and Figure 5-8 illustrate HVDC response after permanently blocking the HVDC bipoles. The DC currents and voltages on the bipole dropping to zero at t = 1.0 second. AC voltages at the inverter and tap terminals experience over-voltages because the filters at these terminals are assumed to be in-service. AC voltages at the J319 tap bus increase to 1.07 pu. The AC voltage at the rectifier increases to .1.31 pu and the AC voltage at the inverter at Shelby 345 kV bus increases to 1.15 pu. These over-voltages can also be mitigated by tripping the AC filter banks automatically.

CHNL# 1607: [PNE-1 PAC_REC1 (MW)]2500.0 -500.0
CHNL# 1609: [PNE-1 PAC_TAP1 (MW)]700.00 -300.0
CHNL# 1611: [PNE-1 PAC_INV1 (MW)]2500.0 -500.0
CHNL# 1559: [PNE-1 PDC_REC (MW)]2500.0 -500.0
CHNL# 1560: -[PNE-1 PDC_TAP (MW)]700.00 -300.0
CHNL# 1561: -[PNE-1 PDC_INV (MW)]2500.0 -500.0
THU, OCT 01 2015 15:46
TIME (SECONDS)
SIEMENS POWERTECHNOLOGIESINTERNATIONAL R
0.90000
1.0000
1.1000
1.2000
1.3000
1.4000
1.5000
1.6000
1.7000
1.80001.9000
FILE: 2018-post-sen_J319-3PH-01-J319TAP-PleasantHill-500kV.out
PNE-1 FLOW (MW)
CHNL# 1571: [PNE-1 QAC_REC (MVAR)]4500.0 -500.0
CHNL# 1572: [PNE-1 QAC_TAP (MVAR)]4500.0 -500.0
CHNL# 1573: [PNE-1 QAC_INV (MVAR)]4500.0 -500.0
CHNL# 1565: [PNE-1 IDC_REC (KA)]8.0000 -2.000
CHNL# 1566: [PNE-1 IDC_TAP (KA)]8.0000 -2.000
CHNL# 1567: [PNE-1 IDC_INV (KA)]8.0000 -2.000
THU, OCT 01 2015 15:46
TIME (SECONDS)
SIEMENS POWERTECHNOLOGIESINTERNATIONAL R
0.90000
1.0000
1.1000
1.2000
1.3000
1.4000
1.5000
1.6000
1.7000
1.80001.9000
FILE: 2018-post-sen_J319-3PH-01-J319TAP-PleasantHill-500kV.out
PNE-1 QAC & IDC
CHNL# 1601: [PNE-1 VDC_REC (PU)]1.2000 -0.3000
CHNL# 1602: [PNE-1 VDC_TAP (PU)]1.2000 -0.3000
CHNL# 1603: [PNE-1 VDC_INV (PU)]1.2000 -0.3000
CHNL# 1577: [PNE-1 VAC_REC (PU)]1.2000 -0.3000
CHNL# 1578: [PNE-1 VAC_TAP (PU)]1.2000 -0.3000
CHNL# 1579: [PNE-1 VAC_INV (PU)]1.2000 -0.3000
THU, OCT 01 2015 15:46
TIME (SECONDS)
SIEMENS POWERTECHNOLOGIESINTERNATIONAL R
0.90000
1.0000
1.1000
1.2000
1.3000
1.4000
1.5000
1.6000
1.7000
1.80001.9000
FILE: 2018-post-sen_J319-3PH-01-J319TAP-PleasantHill-500kV.out
PNE-1 DC & AC VOLTAGE
CHNL# 1583: [PNE-1 ALFA_REC(RAD)]5.0000 0.0
CHNL# 1584: [PNE-1 ALFA_TAP (RAD)]5.0000 0.0
CHNL# 1585: [PNE-1 ALFA_INV (RAD)]5.0000 0.0
CHNL# 1589: [PNE-1 GAMMA_REC (DEG)]400.00 -100.0
CHNL# 1590: [PNE-1 GAMMA_TAP (DEG)]400.00 -100.0
CHNL# 1591: [PNE-1 GAMMA_INV (DEG)]400.00 -100.0
THU, OCT 01 2015 15:46
TIME (SECONDS)
SIEMENS POWERTECHNOLOGIESINTERNATIONAL R
0.90000
1.0000
1.1000
1.2000
1.3000
1.4000
1.5000
1.6000
1.7000
1.80001.9000
FILE: 2018-post-sen_J319-3PH-01-J319TAP-PleasantHill-500kV.out
PNE-1 ALPHA & GAMMA

CHNL# 1613: [PNE-2 PAC_REC2 (MW)]2500.0 -500.0
CHNL# 1615: [PNE-2 PAC_TAP2 (MW)]100.00 -100.0
CHNL# 1617: [PNE-2 PAC_INV2 (MW)]2500.0 -500.0
CHNL# 1562: [PNE-2 PDC_REC (MW)]2500.0 -500.0
CHNL# 1563: -[PNE-2 PDC_TAP (MW)]100.00 -100.0
CHNL# 1564: -[PNE-2 PDC_INV (MW)]2500.0 -500.0
THU, OCT 01 2015 15:46
TIME (SECONDS)
SIEMENS POWERTECHNOLOGIESINTERNATIONAL R
0.90000
1.0000
1.1000
1.2000
1.3000
1.4000
1.5000
1.6000
1.7000
1.80001.9000
FILE: 2018-post-sen_J319-3PH-01-J319TAP-PleasantHill-500kV.out
PNE-2 FLOW (MW)
CHNL# 1574: [PNE-2 QAC_REC (MVAR)]4500.0 -500.0
CHNL# 1575: [PNE-2 QAC_TAP (MVAR)]4500.0 -500.0
CHNL# 1576: [PNE-2 QAC_INV (MVAR)]4500.0 -500.0
CHNL# 1568: [PNE-2 IDC_REC (KA)]8.0000 -2.000
CHNL# 1569: [PNE-2 IDC_TAP (KA)]8.0000 -2.000
CHNL# 1570: [PNE-2 IDC_INV (KA)]8.0000 -2.000
THU, OCT 01 2015 15:46
TIME (SECONDS)
SIEMENS POWERTECHNOLOGIESINTERNATIONAL R
0.90000
1.0000
1.1000
1.2000
1.3000
1.4000
1.5000
1.6000
1.7000
1.80001.9000
FILE: 2018-post-sen_J319-3PH-01-J319TAP-PleasantHill-500kV.out
PNE-2 QAC & IDC
CHNL# 1604: [PNE-2 VDC_REC (PU)]1.4000 -0.1000
CHNL# 1605: [PNE-2 VDC_TAP (PU)]1.4000 -0.1000
CHNL# 1606: [PNE-2 VDC_INV (PU)]1.4000 -0.1000
CHNL# 1580: [PNE-2 VAC_REC (PU)]1.4000 -0.1000
CHNL# 1581: [PNE-2 VAC_TAP (PU)]1.4000 -0.1000
CHNL# 1582: [PNE-2 VAC_INV (PU)]1.4000 -0.1000
THU, OCT 01 2015 15:46
TIME (SECONDS)
SIEMENS POWERTECHNOLOGIESINTERNATIONAL R
0.90000
1.0000
1.1000
1.2000
1.3000
1.4000
1.5000
1.6000
1.7000
1.80001.9000
FILE: 2018-post-sen_J319-3PH-01-J319TAP-PleasantHill-500kV.out
PNE-2 DC & AC VOLTAGE
CHNL# 1586: [PNE-2 ALFA_REC(RAD)]5.0000 0.0
CHNL# 1587: [PNE-2 ALFA_TAP (RAD)]5.0000 0.0
CHNL# 1588: [PNE-2 ALFA_INV (RAD)]5.0000 0.0
CHNL# 1592: [PNE-2 GAMMA_REC (DEG)]400.00 -100.0
CHNL# 1593: [PNE-2 GAMMA_TAP (DEG)]400.00 -100.0
CHNL# 1594: [PNE-2 GAMMA_INV (DEG)]400.00 -100.0
THU, OCT 01 2015 15:46
TIME (SECONDS)
SIEMENS POWERTECHNOLOGIESINTERNATIONAL R
0.90000
1.0000
1.1000
1.2000
1.3000
1.4000
1.5000
1.6000
1.7000
1.80001.9000
FILE: 2018-post-sen_J319-3PH-01-J319TAP-PleasantHill-500kV.out
PNE-2 ALPHA & GAMMA

CHNL# 1607: [PNE-1 PAC_REC (MW)]2500.0 -500.0
CHNL# 1609: [PNE-1 PAC_TAP (MW)]700.00 -300.0
CHNL# 1611: [PNE-1 PAC_INV (MW)]2500.0 -500.0
CHNL# 1559: [PNE-1 PDC_REC (MW)]2500.0 -500.0
CHNL# 1560: -[PNE-1 PDC_TAP (MW)]700.00 -300.0
CHNL# 1561: -[PNE-1 PDC_INV (MW)]2500.0 -500.0
THU, OCT 01 2015 15:46
TIME (SECONDS)
SIEMENS POWERTECHNOLOGIESINTERNATIONAL R
0.90000
1.0000
1.1000
1.2000
1.3000
1.4000
1.5000
1.6000
1.7000
1.80001.9000
FILE: 2018-post-sen_J319-3PH-16a-Block-PNE-Pole1-250ms.out
PNE-1 FLOW (MW)
CHNL# 1571: [PNE-1 QAC_REC (MVAR)]4500.0 -500.0
CHNL# 1572: [PNE-1 QAC_TAP (MVAR)]4500.0 -500.0
CHNL# 1573: [PNE-1 QAC_INV (MVAR)]4500.0 -500.0
CHNL# 1565: [PNE-1 IDC_REC (KA)]8.0000 -2.000
CHNL# 1566: [PNE-1 IDC_TAP (KA)]8.0000 -2.000
CHNL# 1567: [PNE-1 IDC_INV (KA)]8.0000 -2.000
THU, OCT 01 2015 15:46
TIME (SECONDS)
SIEMENS POWERTECHNOLOGIESINTERNATIONAL R
0.90000
1.0000
1.1000
1.2000
1.3000
1.4000
1.5000
1.6000
1.7000
1.80001.9000
FILE: 2018-post-sen_J319-3PH-16a-Block-PNE-Pole1-250ms.out
PNE-1 QAC & IDC
CHNL# 1601: [PNE-1 VDC_REC (PU)]1.2000 -0.3000
CHNL# 1602: [PNE-1 VDC_TAP (PU)]1.2000 -0.3000
CHNL# 1603: [PNE-1 VDC_INV (PU)]1.2000 -0.3000
CHNL# 1577: [PNE-1 VAC_REC (PU)]1.2000 -0.3000
CHNL# 1578: [PNE-1 VAC_TAP (PU)]1.2000 -0.3000
CHNL# 1579: [PNE-1 VAC_INV (PU)]1.2000 -0.3000
THU, OCT 01 2015 15:46
TIME (SECONDS)
SIEMENS POWERTECHNOLOGIESINTERNATIONAL R
0.90000
1.0000
1.1000
1.2000
1.3000
1.4000
1.5000
1.6000
1.7000
1.80001.9000
FILE: 2018-post-sen_J319-3PH-16a-Block-PNE-Pole1-250ms.out
PNE-1 DC & AC VOLTAGE
CHNL# 1583: [PNE-1 ALFA_REC(RAD)]5.0000 0.0
CHNL# 1584: [PNE-1 ALFA_TAP (RAD)]5.0000 0.0
CHNL# 1585: [PNE-1 ALFA_INV (RAD)]5.0000 0.0
CHNL# 1589: [PNE-1 GAMMA_REC (DEG)]400.00 -100.0
CHNL# 1590: [PNE-1 GAMMA_TAP (DEG)]400.00 -100.0
CHNL# 1591: [PNE-1 GAMMA_INV (DEG)]400.00 -100.0
THU, OCT 01 2015 15:46
TIME (SECONDS)
SIEMENS POWERTECHNOLOGIESINTERNATIONAL R
0.90000
1.0000
1.1000
1.2000
1.3000
1.4000
1.5000
1.6000
1.7000
1.80001.9000
FILE: 2018-post-sen_J319-3PH-16a-Block-PNE-Pole1-250ms.out
PNE-1 ALPHA & GAMMA
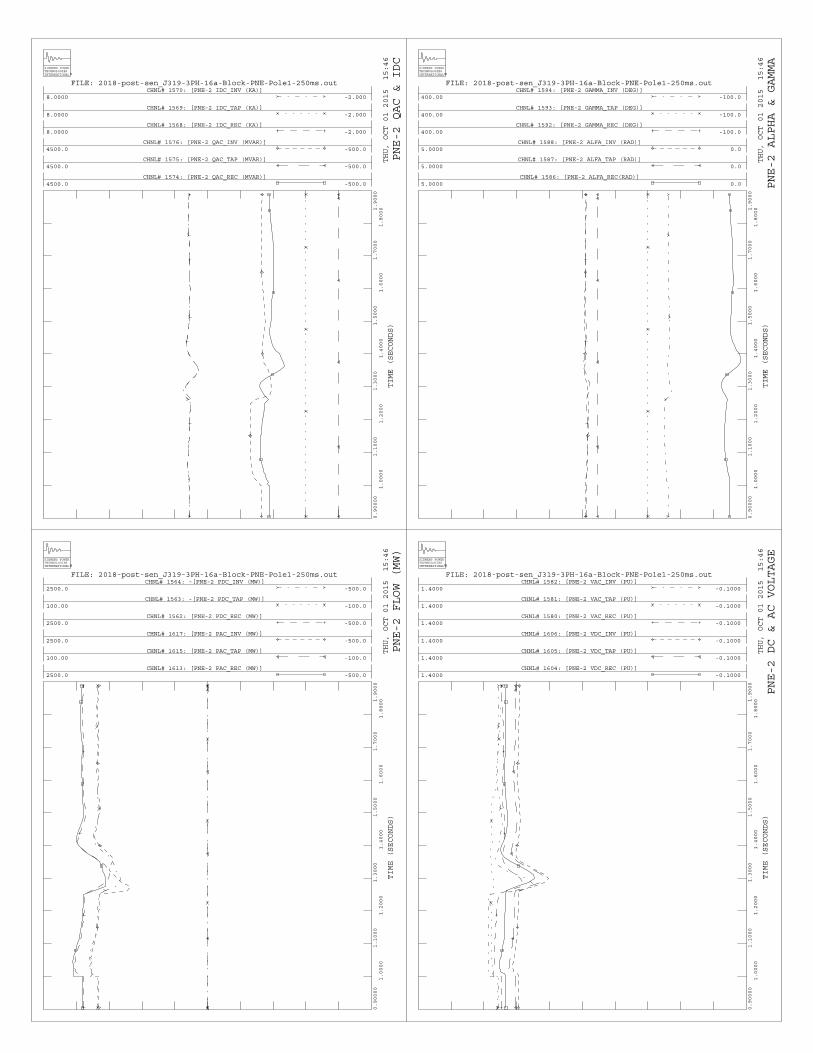
CHNL# 1613: [PNE-2 PAC_REC (MW)]2500.0 -500.0
CHNL# 1615: [PNE-2 PAC_TAP (MW)]100.00 -100.0
CHNL# 1617: [PNE-2 PAC_INV (MW)]2500.0 -500.0
CHNL# 1562: [PNE-2 PDC_REC (MW)]2500.0 -500.0
CHNL# 1563: -[PNE-2 PDC_TAP (MW)]100.00 -100.0
CHNL# 1564: -[PNE-2 PDC_INV (MW)]2500.0 -500.0
THU, OCT 01 2015 15:46
TIME (SECONDS)
SIEMENS POWERTECHNOLOGIESINTERNATIONAL R
0.90000
1.0000
1.1000
1.2000
1.3000
1.4000
1.5000
1.6000
1.7000
1.80001.9000
FILE: 2018-post-sen_J319-3PH-16a-Block-PNE-Pole1-250ms.out
PNE-2 FLOW (MW)
CHNL# 1574: [PNE-2 QAC_REC (MVAR)]4500.0 -500.0
CHNL# 1575: [PNE-2 QAC_TAP (MVAR)]4500.0 -500.0
CHNL# 1576: [PNE-2 QAC_INV (MVAR)]4500.0 -500.0
CHNL# 1568: [PNE-2 IDC_REC (KA)]8.0000 -2.000
CHNL# 1569: [PNE-2 IDC_TAP (KA)]8.0000 -2.000
CHNL# 1570: [PNE-2 IDC_INV (KA)]8.0000 -2.000
THU, OCT 01 2015 15:46
TIME (SECONDS)
SIEMENS POWERTECHNOLOGIESINTERNATIONAL R
0.90000
1.0000
1.1000
1.2000
1.3000
1.4000
1.5000
1.6000
1.7000
1.80001.9000
FILE: 2018-post-sen_J319-3PH-16a-Block-PNE-Pole1-250ms.out
PNE-2 QAC & IDC
CHNL# 1604: [PNE-2 VDC_REC (PU)]1.4000 -0.1000
CHNL# 1605: [PNE-2 VDC_TAP (PU)]1.4000 -0.1000
CHNL# 1606: [PNE-2 VDC_INV (PU)]1.4000 -0.1000
CHNL# 1580: [PNE-2 VAC_REC (PU)]1.4000 -0.1000
CHNL# 1581: [PNE-2 VAC_TAP (PU)]1.4000 -0.1000
CHNL# 1582: [PNE-2 VAC_INV (PU)]1.4000 -0.1000
THU, OCT 01 2015 15:46
TIME (SECONDS)
SIEMENS POWERTECHNOLOGIESINTERNATIONAL R
0.90000
1.0000
1.1000
1.2000
1.3000
1.4000
1.5000
1.6000
1.7000
1.80001.9000
FILE: 2018-post-sen_J319-3PH-16a-Block-PNE-Pole1-250ms.out
PNE-2 DC & AC VOLTAGE
CHNL# 1586: [PNE-2 ALFA_REC(RAD)]5.0000 0.0
CHNL# 1587: [PNE-2 ALFA_TAP (RAD)]5.0000 0.0
CHNL# 1588: [PNE-2 ALFA_INV (RAD)]5.0000 0.0
CHNL# 1592: [PNE-2 GAMMA_REC (DEG)]400.00 -100.0
CHNL# 1593: [PNE-2 GAMMA_TAP (DEG)]400.00 -100.0
CHNL# 1594: [PNE-2 GAMMA_INV (DEG)]400.00 -100.0
THU, OCT 01 2015 15:46
TIME (SECONDS)
SIEMENS POWERTECHNOLOGIESINTERNATIONAL R
0.90000
1.0000
1.1000
1.2000
1.3000
1.4000
1.5000
1.6000
1.7000
1.80001.9000
FILE: 2018-post-sen_J319-3PH-16a-Block-PNE-Pole1-250ms.out
PNE-2 ALPHA & GAMMA
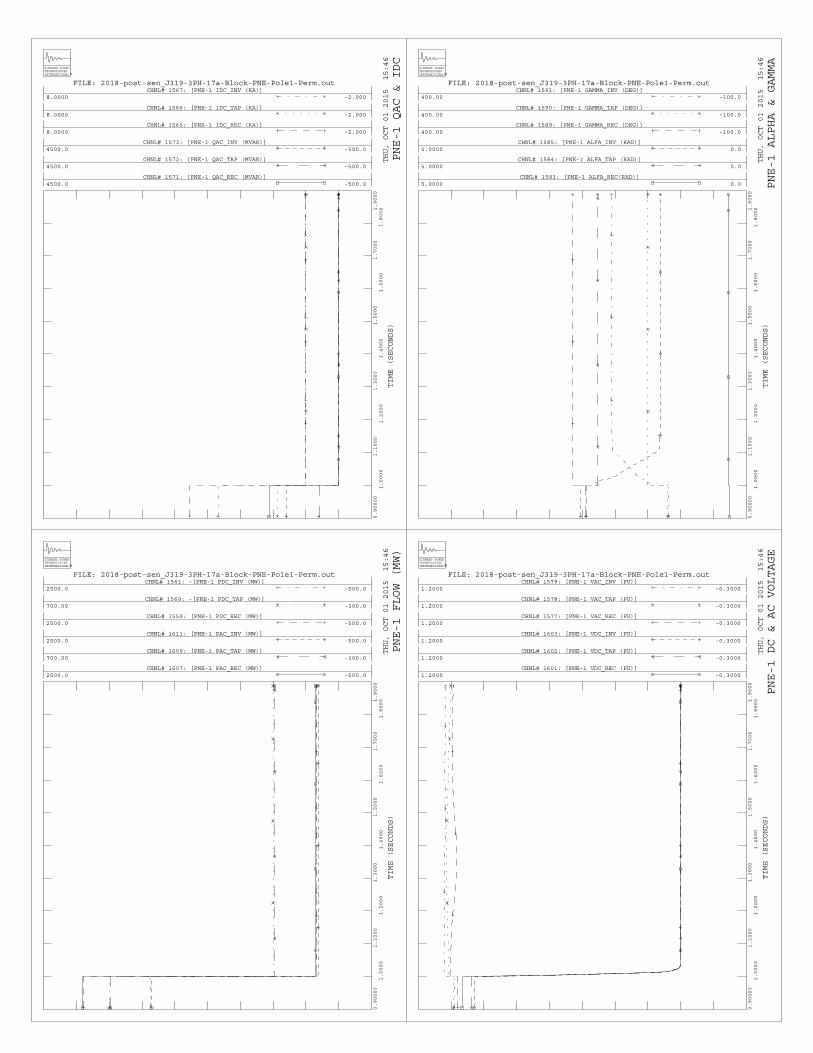
CHNL# 1607: [PNE-1 PAC_REC (MW)]2500.0 -500.0
CHNL# 1609: [PNE-1 PAC_TAP (MW)]700.00 -300.0
CHNL# 1611: [PNE-1 PAC_INV (MW)]2500.0 -500.0
CHNL# 1559: [PNE-1 PDC_REC (MW)]2500.0 -500.0
CHNL# 1560: -[PNE-1 PDC_TAP (MW)]700.00 -300.0
CHNL# 1561: -[PNE-1 PDC_INV (MW)]2500.0 -500.0
THU, OCT 01 2015 15:46
TIME (SECONDS)
SIEMENS POWERTECHNOLOGIESINTERNATIONAL R
0.90000
1.0000
1.1000
1.2000
1.3000
1.4000
1.5000
1.6000
1.7000
1.80001.9000
FILE: 2018-post-sen_J319-3PH-17a-Block-PNE-Pole1-Perm.out
PNE-1 FLOW (MW)
CHNL# 1571: [PNE-1 QAC_REC (MVAR)]4500.0 -500.0
CHNL# 1572: [PNE-1 QAC_TAP (MVAR)]4500.0 -500.0
CHNL# 1573: [PNE-1 QAC_INV (MVAR)]4500.0 -500.0
CHNL# 1565: [PNE-1 IDC_REC (KA)]8.0000 -2.000
CHNL# 1566: [PNE-1 IDC_TAP (KA)]8.0000 -2.000
CHNL# 1567: [PNE-1 IDC_INV (KA)]8.0000 -2.000
THU, OCT 01 2015 15:46
TIME (SECONDS)
SIEMENS POWERTECHNOLOGIESINTERNATIONAL R
0.90000
1.0000
1.1000
1.2000
1.3000
1.4000
1.5000
1.6000
1.7000
1.80001.9000
FILE: 2018-post-sen_J319-3PH-17a-Block-PNE-Pole1-Perm.out
PNE-1 QAC & IDC
CHNL# 1601: [PNE-1 VDC_REC (PU)]1.2000 -0.3000
CHNL# 1602: [PNE-1 VDC_TAP (PU)]1.2000 -0.3000
CHNL# 1603: [PNE-1 VDC_INV (PU)]1.2000 -0.3000
CHNL# 1577: [PNE-1 VAC_REC (PU)]1.2000 -0.3000
CHNL# 1578: [PNE-1 VAC_TAP (PU)]1.2000 -0.3000
CHNL# 1579: [PNE-1 VAC_INV (PU)]1.2000 -0.3000
THU, OCT 01 2015 15:46
TIME (SECONDS)
SIEMENS POWERTECHNOLOGIESINTERNATIONAL R
0.90000
1.0000
1.1000
1.2000
1.3000
1.4000
1.5000
1.6000
1.7000
1.80001.9000
FILE: 2018-post-sen_J319-3PH-17a-Block-PNE-Pole1-Perm.out
PNE-1 DC & AC VOLTAGE
CHNL# 1583: [PNE-1 ALFA_REC(RAD)]5.0000 0.0
CHNL# 1584: [PNE-1 ALFA_TAP (RAD)]5.0000 0.0
CHNL# 1585: [PNE-1 ALFA_INV (RAD)]5.0000 0.0
CHNL# 1589: [PNE-1 GAMMA_REC (DEG)]400.00 -100.0
CHNL# 1590: [PNE-1 GAMMA_TAP (DEG)]400.00 -100.0
CHNL# 1591: [PNE-1 GAMMA_INV (DEG)]400.00 -100.0
THU, OCT 01 2015 15:46
TIME (SECONDS)
SIEMENS POWERTECHNOLOGIESINTERNATIONAL R
0.90000
1.0000
1.1000
1.2000
1.3000
1.4000
1.5000
1.6000
1.7000
1.80001.9000
FILE: 2018-post-sen_J319-3PH-17a-Block-PNE-Pole1-Perm.out
PNE-1 ALPHA & GAMMA
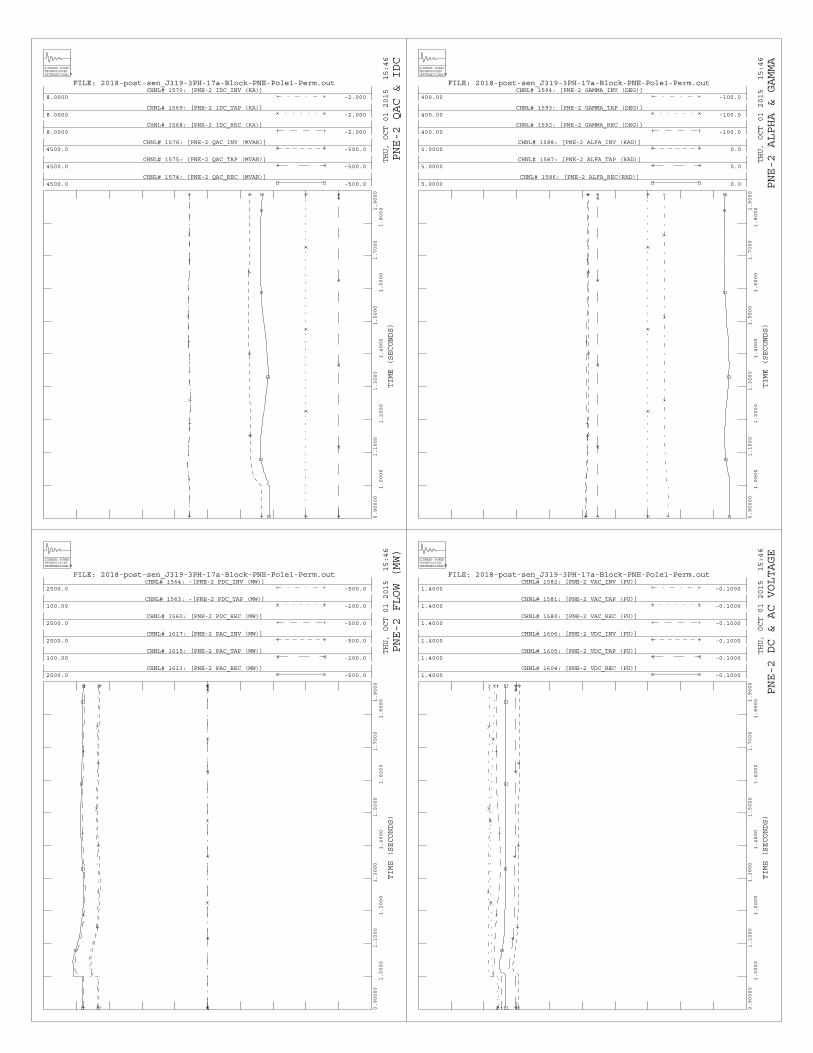
CHNL# 1613: [PNE-2 PAC_REC (MW)]2500.0 -500.0
CHNL# 1615: [PNE-2 PAC_TAP (MW)]100.00 -100.0
CHNL# 1617: [PNE-2 PAC_INV (MW)]2500.0 -500.0
CHNL# 1562: [PNE-2 PDC_REC (MW)]2500.0 -500.0
CHNL# 1563: -[PNE-2 PDC_TAP (MW)]100.00 -100.0
CHNL# 1564: -[PNE-2 PDC_INV (MW)]2500.0 -500.0
THU, OCT 01 2015 15:46
TIME (SECONDS)
SIEMENS POWERTECHNOLOGIESINTERNATIONAL R
0.90000
1.0000
1.1000
1.2000
1.3000
1.4000
1.5000
1.6000
1.7000
1.80001.9000
FILE: 2018-post-sen_J319-3PH-17a-Block-PNE-Pole1-Perm.out
PNE-2 FLOW (MW)
CHNL# 1574: [PNE-2 QAC_REC (MVAR)]4500.0 -500.0
CHNL# 1575: [PNE-2 QAC_TAP (MVAR)]4500.0 -500.0
CHNL# 1576: [PNE-2 QAC_INV (MVAR)]4500.0 -500.0
CHNL# 1568: [PNE-2 IDC_REC (KA)]8.0000 -2.000
CHNL# 1569: [PNE-2 IDC_TAP (KA)]8.0000 -2.000
CHNL# 1570: [PNE-2 IDC_INV (KA)]8.0000 -2.000
THU, OCT 01 2015 15:46
TIME (SECONDS)
SIEMENS POWERTECHNOLOGIESINTERNATIONAL R
0.90000
1.0000
1.1000
1.2000
1.3000
1.4000
1.5000
1.6000
1.7000
1.80001.9000
FILE: 2018-post-sen_J319-3PH-17a-Block-PNE-Pole1-Perm.out
PNE-2 QAC & IDC
CHNL# 1604: [PNE-2 VDC_REC (PU)]1.4000 -0.1000
CHNL# 1605: [PNE-2 VDC_TAP (PU)]1.4000 -0.1000
CHNL# 1606: [PNE-2 VDC_INV (PU)]1.4000 -0.1000
CHNL# 1580: [PNE-2 VAC_REC (PU)]1.4000 -0.1000
CHNL# 1581: [PNE-2 VAC_TAP (PU)]1.4000 -0.1000
CHNL# 1582: [PNE-2 VAC_INV (PU)]1.4000 -0.1000
THU, OCT 01 2015 15:46
TIME (SECONDS)
SIEMENS POWERTECHNOLOGIESINTERNATIONAL R
0.90000
1.0000
1.1000
1.2000
1.3000
1.4000
1.5000
1.6000
1.7000
1.80001.9000
FILE: 2018-post-sen_J319-3PH-17a-Block-PNE-Pole1-Perm.out
PNE-2 DC & AC VOLTAGE
CHNL# 1586: [PNE-2 ALFA_REC(RAD)]5.0000 0.0
CHNL# 1587: [PNE-2 ALFA_TAP (RAD)]5.0000 0.0
CHNL# 1588: [PNE-2 ALFA_INV (RAD)]5.0000 0.0
CHNL# 1592: [PNE-2 GAMMA_REC (DEG)]400.00 -100.0
CHNL# 1593: [PNE-2 GAMMA_TAP (DEG)]400.00 -100.0
CHNL# 1594: [PNE-2 GAMMA_INV (DEG)]400.00 -100.0
THU, OCT 01 2015 15:46
TIME (SECONDS)
SIEMENS POWERTECHNOLOGIESINTERNATIONAL R
0.90000
1.0000
1.1000
1.2000
1.3000
1.4000
1.5000
1.6000
1.7000
1.80001.9000
FILE: 2018-post-sen_J319-3PH-17a-Block-PNE-Pole1-Perm.out
PNE-2 ALPHA & GAMMA
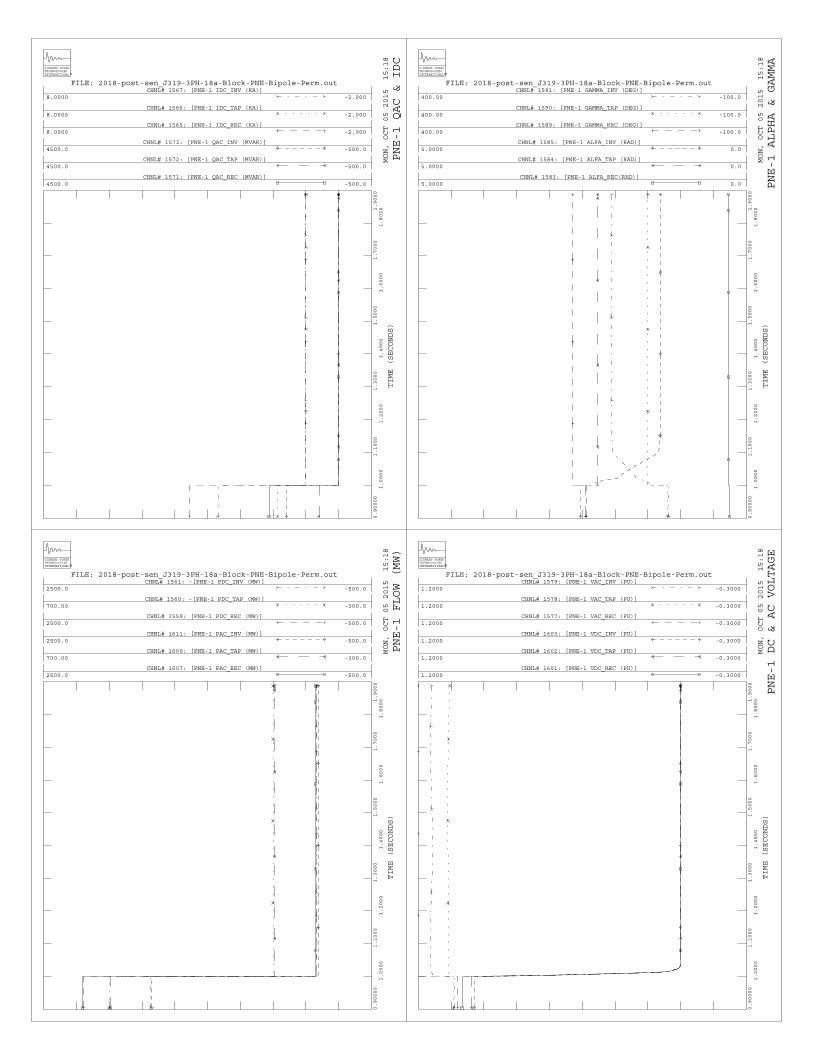
CHNL# 1607: [PNE-1 PAC_REC (MW)]2500.0 -500.0
CHNL# 1609: [PNE-1 PAC_TAP (MW)]700.00 -300.0
CHNL# 1611: [PNE-1 PAC_INV (MW)]2500.0 -500.0
CHNL# 1559: [PNE-1 PDC_REC (MW)]2500.0 -500.0
CHNL# 1560: -[PNE-1 PDC_TAP (MW)]700.00 -300.0
CHNL# 1561: -[PNE-1 PDC_INV (MW)]2500.0 -500.0
MON, OCT 05 2015 15:18
TIME (SECONDS)
SIEMENS POWERTECHNOLOGIESINTERNATIONAL R
0.90000
1.0000
1.1000
1.2000
1.3000
1.4000
1.5000
1.6000
1.7000
1.80001.9000
FILE: 2018-post-sen_J319-3PH-18a-Block-PNE-Bipole-Perm.out
PNE-1 FLOW (MW)
CHNL# 1571: [PNE-1 QAC_REC (MVAR)]4500.0 -500.0
CHNL# 1572: [PNE-1 QAC_TAP (MVAR)]4500.0 -500.0
CHNL# 1573: [PNE-1 QAC_INV (MVAR)]4500.0 -500.0
CHNL# 1565: [PNE-1 IDC_REC (KA)]8.0000 -2.000
CHNL# 1566: [PNE-1 IDC_TAP (KA)]8.0000 -2.000
CHNL# 1567: [PNE-1 IDC_INV (KA)]8.0000 -2.000
MON, OCT 05 2015 15:18
TIME (SECONDS)
SIEMENS POWERTECHNOLOGIESINTERNATIONAL R
0.90000
1.0000
1.1000
1.2000
1.3000
1.4000
1.5000
1.6000
1.7000
1.80001.9000
FILE: 2018-post-sen_J319-3PH-18a-Block-PNE-Bipole-Perm.out
PNE-1 QAC & IDC
CHNL# 1601: [PNE-1 VDC_REC (PU)]1.2000 -0.3000
CHNL# 1602: [PNE-1 VDC_TAP (PU)]1.2000 -0.3000
CHNL# 1603: [PNE-1 VDC_INV (PU)]1.2000 -0.3000
CHNL# 1577: [PNE-1 VAC_REC (PU)]1.2000 -0.3000
CHNL# 1578: [PNE-1 VAC_TAP (PU)]1.2000 -0.3000
CHNL# 1579: [PNE-1 VAC_INV (PU)]1.2000 -0.3000
MON, OCT 05 2015 15:18
TIME (SECONDS)
SIEMENS POWERTECHNOLOGIESINTERNATIONAL R
0.90000
1.0000
1.1000
1.2000
1.3000
1.4000
1.5000
1.6000
1.7000
1.80001.9000
FILE: 2018-post-sen_J319-3PH-18a-Block-PNE-Bipole-Perm.out
PNE-1 DC & AC VOLTAGE
CHNL# 1583: [PNE-1 ALFA_REC(RAD)]5.0000 0.0
CHNL# 1584: [PNE-1 ALFA_TAP (RAD)]5.0000 0.0
CHNL# 1585: [PNE-1 ALFA_INV (RAD)]5.0000 0.0
CHNL# 1589: [PNE-1 GAMMA_REC (DEG)]400.00 -100.0
CHNL# 1590: [PNE-1 GAMMA_TAP (DEG)]400.00 -100.0
CHNL# 1591: [PNE-1 GAMMA_INV (DEG)]400.00 -100.0
MON, OCT 05 2015 15:18
TIME (SECONDS)
SIEMENS POWERTECHNOLOGIESINTERNATIONAL R
0.90000
1.0000
1.1000
1.2000
1.3000
1.4000
1.5000
1.6000
1.7000
1.80001.9000
FILE: 2018-post-sen_J319-3PH-18a-Block-PNE-Bipole-Perm.out
PNE-1 ALPHA & GAMMA
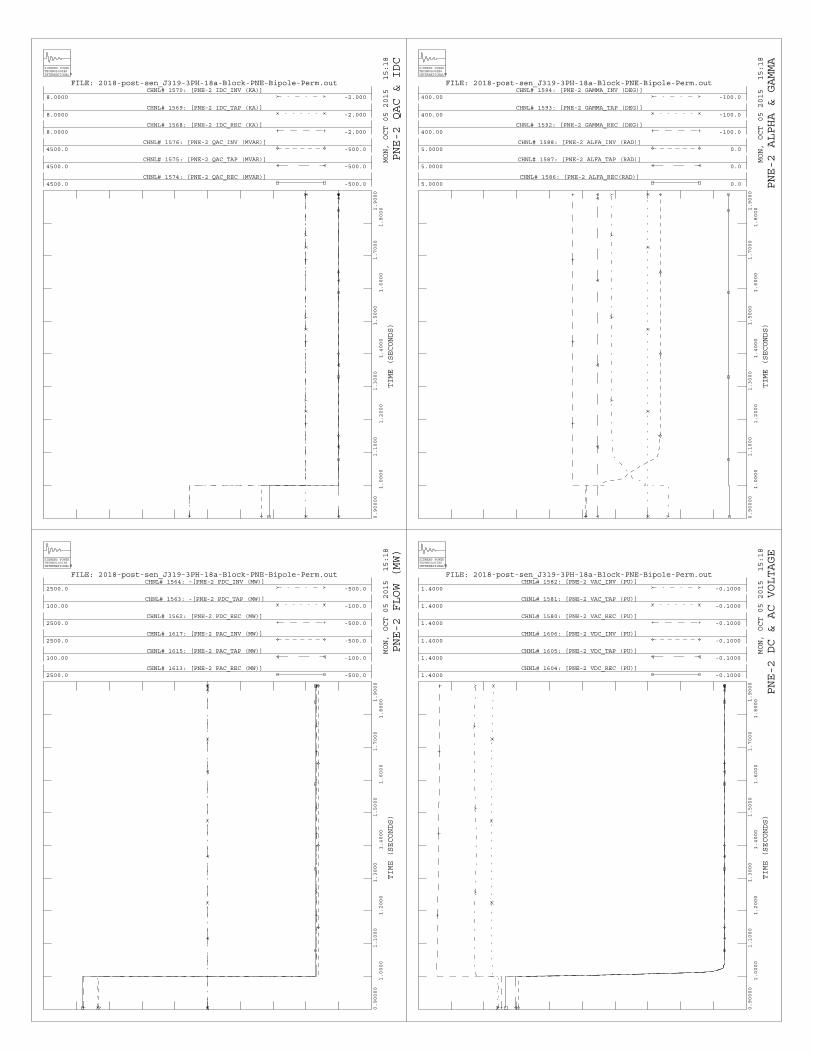
CHNL# 1613: [PNE-2 PAC_REC (MW)]2500.0 -500.0
CHNL# 1615: [PNE-2 PAC_TAP (MW)]100.00 -100.0
CHNL# 1617: [PNE-2 PAC_INV (MW)]2500.0 -500.0
CHNL# 1562: [PNE-2 PDC_REC (MW)]2500.0 -500.0
CHNL# 1563: -[PNE-2 PDC_TAP (MW)]100.00 -100.0
CHNL# 1564: -[PNE-2 PDC_INV (MW)]2500.0 -500.0
MON, OCT 05 2015 15:18
TIME (SECONDS)
SIEMENS POWERTECHNOLOGIESINTERNATIONAL R
0.90000
1.0000
1.1000
1.2000
1.3000
1.4000
1.5000
1.6000
1.7000
1.80001.9000
FILE: 2018-post-sen_J319-3PH-18a-Block-PNE-Bipole-Perm.out
PNE-2 FLOW (MW)
CHNL# 1574: [PNE-2 QAC_REC (MVAR)]4500.0 -500.0
CHNL# 1575: [PNE-2 QAC_TAP (MVAR)]4500.0 -500.0
CHNL# 1576: [PNE-2 QAC_INV (MVAR)]4500.0 -500.0
CHNL# 1568: [PNE-2 IDC_REC (KA)]8.0000 -2.000
CHNL# 1569: [PNE-2 IDC_TAP (KA)]8.0000 -2.000
CHNL# 1570: [PNE-2 IDC_INV (KA)]8.0000 -2.000
MON, OCT 05 2015 15:18
TIME (SECONDS)
SIEMENS POWERTECHNOLOGIESINTERNATIONAL R
0.90000
1.0000
1.1000
1.2000
1.3000
1.4000
1.5000
1.6000
1.7000
1.80001.9000
FILE: 2018-post-sen_J319-3PH-18a-Block-PNE-Bipole-Perm.out
PNE-2 QAC & IDC
CHNL# 1604: [PNE-2 VDC_REC (PU)]1.4000 -0.1000
CHNL# 1605: [PNE-2 VDC_TAP (PU)]1.4000 -0.1000
CHNL# 1606: [PNE-2 VDC_INV (PU)]1.4000 -0.1000
CHNL# 1580: [PNE-2 VAC_REC (PU)]1.4000 -0.1000
CHNL# 1581: [PNE-2 VAC_TAP (PU)]1.4000 -0.1000
CHNL# 1582: [PNE-2 VAC_INV (PU)]1.4000 -0.1000
MON, OCT 05 2015 15:18
TIME (SECONDS)
SIEMENS POWERTECHNOLOGIESINTERNATIONAL R
0.90000
1.0000
1.1000
1.2000
1.3000
1.4000
1.5000
1.6000
1.7000
1.80001.9000
FILE: 2018-post-sen_J319-3PH-18a-Block-PNE-Bipole-Perm.out
PNE-2 DC & AC VOLTAGE
CHNL# 1586: [PNE-2 ALFA_REC(RAD)]5.0000 0.0
CHNL# 1587: [PNE-2 ALFA_TAP (RAD)]5.0000 0.0
CHNL# 1588: [PNE-2 ALFA_INV (RAD)]5.0000 0.0
CHNL# 1592: [PNE-2 GAMMA_REC (DEG)]400.00 -100.0
CHNL# 1593: [PNE-2 GAMMA_TAP (DEG)]400.00 -100.0
CHNL# 1594: [PNE-2 GAMMA_INV (DEG)]400.00 -100.0
MON, OCT 05 2015 15:18
TIME (SECONDS)
SIEMENS POWERTECHNOLOGIESINTERNATIONAL R
0.90000
1.0000
1.1000
1.2000
1.3000
1.4000
1.5000
1.6000
1.7000
1.80001.9000
FILE: 2018-post-sen_J319-3PH-18a-Block-PNE-Bipole-Perm.out
PNE-2 ALPHA & GAMMA
31
6 CONCLUSIONS In this study, the stability analysis was performed on 2018 and 2025 summer shoulder peak cases provided by MISO. Thirty (30) three-phase normally cleared and thirteen (13) single-line-to-ground faults with backup clearing were simulated for the post-project cases to determine the impact of J319 and J417 on the stability and transient voltage recovery of the local Entergy System. No angular instability or voltage dip violations attributed to the proposed projects were identified. Based on these results, it can be concluded that J319 and J417 do not adversely impact the stability performance of the Entergy system. A sensitivity analysis was also performed by using an updated HVDC model, which assumes a monopolar tap configuration and the HVDC rectifier end connecting to the AC system in SPP. No angular instability or voltage dip violations attributed to J319 were identified.

32
APPENDIX A LOCAL ONE-LINE DIAGRAMS

* 32
1.0
28.5
-320
.3-7
.3
* -0
.0-0
.0
-250
.015
6.8
21.7
1
1.00
00
-250
.015
6.8
21.7
1
1.00
00
Dia
gram
cre
ated
usi
ng'C
:\MIS
O D
PP
2015
Feb\
Dyn
_abb
\lf\2
018S
H_D
YN
_FE
B15
R_S
outh
_DP
P_0
6152
015_
RE
V2_
STU
DY
_abb
.sav
''C
:\MIS
O D
PP
2015
Feb\
03_A
BB
File
s\J3
19_s
lider
_abb
.sld
'
2132
.510
62.4
14.5
4
1.02
25
-176
3.5
1028
.8
18.4
8
1.01
25
2132
.510
62.4
14.5
4
1.02
25
-176
3.5
1029
.5
18.7
2
1.01
25
9998
10P
E R
EC
1 B
US
1.02
035
1.9
DC
14.9
0.0
SW
-117
9.8
9998
11P
E R
EC
2 B
US
1.02
035
1.9
DC
14.9
0.0
SW
-117
9.8
9999
10P
E R
EC
BU
S
1.02
035
1.9
-214
7.4
117.
521
47.4
-117
.5
-214
7.4
117.
521
47.4
-117
.5
142
94.8
-234
.9R
9998
20P
E T
AP
1 B
US
1.03
951
9.3
9998
21P
E T
AP
2 B
US
1.03
951
9.3
9999
20J3
19 P
NE
TA
P
1.03
951
9.3
248.
25.
0-2
48.2
-5.0
248.
25.
0-2
48.2
-5.0
3379
098A
NO
%
1.04
052
0.0
3379
228P
.HIL
L%
1.03
551
7.5
514.
0-6
.2-5
13.4
-26.
1-1
007.
5-4
6.6
1009
.836
.0
5153
05FT
SM
ITH
8
1.01
450
7.0
3378
088M
AB
ELV
ALE
%
1.04
152
0.7
573.
910
0.9
-569
.4-8
9.0
-514
.2-2
6.1
517.
6-1
18.9
SW
-0.0
3379
378M
AY
FLO
WE
R%
1.03
351
6.3
679.
0-2
8.8
-677
.2-1
6.7
-163
.012
4.4
163.
2-1
84.8
3378
608W
RIG
HTS
VLE
%
1.04
252
1.0
3376
438S
HE
RID
AN
%
1.04
452
1.8
219.
6-4
3.6
-219
.518
.8
16.5
31.2
-16.
5-7
4.0
DC
1.8
0.0
SW
-161
.8
DC
1.8
0.0
SW
-161
.8
3376
518W
HT
BLU
FF%
1.04
252
1.0
3377
638M
AG
NE
TCO
VE
%
1.04
252
1.0
3375
618E
L D
OR
AD
O%
1.04
252
1.0
-293
.845
.829
4.1
-82.
7
7.8
6.4
-7.8
-54.
7 -268
.8-6
8.1
269.
5-8
3.4
3379
578K
EO
%
1.04
252
1.2
3385
208O
SW
ALD
#
1.04
252
1.0
340.
6-4
6.5
-340
.428
.1
-285
.8-5
.628
5.8
5.6
759.3-71.4
-757.954.6
3381
408H
OLN
D B
TM%
1.04
152
0.7
3381
628W
.ME
MP
HIS
%
1.03
251
6.1
423.
9-2
5.0
-423
.3-1
0.3
674.
5-5
7.7
-667
.5-5
0.9
SW
-0.0
3381
458I
SE
S%
1.04
052
0.0
21.8-54.8
-21.8-71.3
3381
878D
ELL
%
1.03
851
9.0
3381
448I
SE
S-X
F
1.04
052
0.0
561.
2-9
2.8
-557
.6-3
7.3
-258
.7-9
2.4
258.
792
.4
9998
30P
E IN
V1
BU
S
1.03
251
6.2
DC
12.3
0.0
SW
-107
4.4
9998
31P
E IN
V2
BU
S
1.03
251
6.2
DC
12.3
0.0
SW
-805
.8
9999
30P
E IN
V B
US
1.03
251
6.2
1751
.2
45.6
-175
1.2
-45.
6
1751
.2-2
23.7
-175
1.2
223.
7
3600
218S
HE
LBY
TN
1.03
351
6.7
-175
1.2
117.
917
51.2
-89.
1
-175
1.2
117.
917
51.2
-89.
1
3379
101A
NO
U1
1.03
722
.8
3379
111A
NO
U2
1.04
423
.0
3379
131A
NO
AU
X
1.03
622
.8
1
1 1
-896
.811
.3
1
0.98636
899.
011
6.1
-102
9.6
-15.
7
1.025
1.0227
1031
.010
6.1
AX
38.0
22.0
193
7.0
138.
1R
AX
42.0
32.0
110
73.0
138.
1R
3379
125A
NO
%
1.03
516
6.7
15.
12.
1
SW
-0.0
3379
235P
.HIL
L%
1.04
616
8.4
328.
575
.4
1.0237
1.0497
-328
.2-5
1.1
3380
155H
OLN
D B
TM!
1.04
016
7.4
-114
.7-4
.6
1
1
114.
77.
233
8152
5IS
ES
-2!
1.00
016
1.0
3381
425I
SE
S-1
!
1.00
016
1.0
128.
846
.0
1.025
1
-128
.7-4
0.0
-129
.8-4
0.4
1
1.025
129.
946
.4-1
25.5
21.9
125.
5-2
1.9
3381
515N
EW
PO
RT!
0.99
215
9.7
-185
.6
-1.3
186.
7
10.9
-201
.4-0
.320
2.6
11.0
3379
303M
AY
FLO
WE
R%
1.04
111
9.7
-170
.2-5
7.5
1
0.975 170.
466
.1
-170
.2-5
7.5
1
0.975 170.
466
.1
-173
.0-6
0.6
1
0.975 173.
369
.4
SW
108.
4
3377
993M
AB
LVA
LE-W
!
1.01
511
6.7
3378
043M
AB
LVA
LE-E
!
1.01
511
6.7
-236
.811
.2
1
1.025
237.
29.
4
-236
.610
.6
1
1.025
236.
910
.0
-6.1
-24.
56.
124
.5
SW
-0.0
3378
593W
RIG
HTS
VLE
!
1.03
111
8.6
-164
.4-2
3.4
1
1
164.
733
.3
3376
483W
HT
BLU
FF!
1.03
211
8.6
-150
.9-2
4.1
1
1
151.
032
.0
-150
.9-2
4.1
1
1
151.
032
.0
16.
7
1.6
3380
163H
OLN
D B
TM!
1.03
111
8.5
-286
.6-4
1.5
1
1
286.
857
.8
3376
521W
HT
BLU
F U
1
1.05
027
.3
3376
531W
HT
BLU
F U
2
1.05
227
.4
-772
.8-1
5.01
1
774.
087
.6
-796
.461
.01
1
801.
687
.6
177
4.0
87.6
R
180
1.6
87.6
R
3381
461I
SE
S U
2
0.99
825
.9
-798
.171
.7
1
0.96154 799.
66.
41
799.
66.
4R
3381
431I
SE
S U
1
1.00
926
.2
399.
778
.9 0.96154
1
-386
.140
.0
-380
.839
.6
1
0.96154
394.
377
.61
794.
015
6.5R
3376
546W
HT
BLU
FF%
1.03
423
7.8
213.
744
.1
1
1-213
.5-3
5.6
1

Dia
gram
cre
ated
usi
ng'C
:\MIS
O D
PP
2015
Feb\
Dyn
_abb
\lf\2
025S
H_D
YN
_FE
B15
R_S
outh
_DP
P_0
6152
015_
RE
V2_
STU
DY
_abb
.sav
''C
:\MIS
O D
PP
2015
Feb\
03_A
BB
File
s\J4
17_s
lider
_abb
.sld
'
1215
7J4
17-T
AP
0.99
922
9.8
3350
786V
INC
EN
T
1.00
023
0.0
3350
796G
RA
YW
OO
D%
0.99
922
9.7
1215
6J4
17_H
V
0.99
922
9.8
-61.
0
-31.
8
61.1
30.8
100.
4
29.5
-100
.4
-29.
6
39.4
-2.3
-39.
4
2.2
119
.1 8.1
IN12
.0 9.0
3350
776P
EC
AN
_GR
V!
1.00
323
0.6
80.2
37.6
-80.
1
-38.
9
IN56
.8
22.3
3350
746C
ALC
AS
IEU
%
1.00
423
0.9
137.0
59.8
-137.0
-59.9
3350
806G
RA
YW
OO
D_T
P
0.99
722
9.4
88.4
20.6
-88.
4
-22.
0
3352
446S
OLA
C!
0.99
722
9.2
88.4
22.0
-88.
4
-22.
6
116
.7
4.9
3031
026C
HA
LKLE
Y!
0.99
822
9.6
38.8
13.0
-38.
8
113
.1
2.2
3351
916G
ILLI
S
1.00
223
0.6
-51.
9
-15.
2
52.0
10.0
15.
7
1.7
3350
736B
OU
DO
IN%
1.00
123
0.1
-201
.6
-136
.5
201.
7
137.
3IN
30.5
21.1
3350
706C
AR
LYS
S%
0.99
622
9.2
-171
.0
-114
.9
171.
2
115.
4
3350
716B
IG_T
HR
EE
0.99
622
9.2
3350
726R
OS
E_B
LUFF
%
0.99
622
9.2
3351
906N
ELS
ON
%
1.01
023
2.3
197.
3
-34.
3
-197
.1
34.5
-91.
7
14.0
91.7
-14.
7
-136
.1
-56.
8
136.
6
54.6
IN11
.0 2.2
IN71
.5
22.3
SW
-0.0
5006
70P
EN
TON
6
1.00
123
0.3
3031
016M
OS
S_B
LUFF
!
1.00
323
0.7
3351
346M
ICH
IGA
N%
1.00
523
1.2
51.8
31.0
-51.
7
-34.
4
-315
.7
-611
.7
1
0.975
316.
1
618.
2
-142
.7
-48.
0
143.
0
47.9
-378
.8
-218
.2
379.
3
220.
9
114
.3
6.9
LG70
.0
12.3
57.8
11.0
-57.
7
-11.
6
185
.0
37.1
IN20
0.0
65.7
3343
636H
AR
TBR
G!
1.02
223
5.0
205.
8
136.
4
0.975
1
-205
.7
-126
.0
191.
9
-10.
7
1
1
-191
.8
17.5
SW
36.5
3350
846M
UD
_LA
KE
%
1.00
022
9.9
186.
1
-36.
7
-184
.4
39.6
IN22
0.0
106.
5
SW
-122
.1
3344
346S
AB
INE
%
1.01
023
2.3
35.7
11.9
-35.
6
-24.
0
3344
396V
FWP
K%
1.00
323
0.7
3344
426G
ULF
WA
Y%
1.00
023
0.1
3342
046C
HIN
A%
1.01
423
3.2
3344
286N
ED
ER
LAN
D%
0.99
422
8.7
3344
296C
HIS
HO
LM%
1.01
123
2.5
196.
7
89.9
-196
.3
-89.
4
192.
6
90.8
-192
.1
-88.
9
-299
.2
63.8
304.
5
-39.
9
-219
.2
-88.
6
220.
2
91.8
-117
.9
24.1
118.
1
-26.
5
171.
4
79.5
-171
.3
-79.
4
SW
-167
.3
IN12
0.7
39.7
186.
3
23.5
-185
.2
-21.
3
3343
226W
ES
TBR
OO
K%
1.00
423
0.9
3343
276A
ME
LIA
!
1.00
423
0.9
3342
036C
HP
TSR
1
1.01
923
4.4
-196
.9
89.8
197.
7
-86.
4
-170
.5
73.6
171.
1
-75.
0
-316
.0
56.9
319.
4
-34.
8
5007
65R
OR
K 6
1.02
123
4.8
56.9
-55.
6
1
1
-56.
9
56.7
5009
40W
ELL
S 6
1.00
223
0.4
204.
3
34.5
1
1
-204
.3
-26.
4
204.
8
34.6
1
1
-204
.8
-26.
5
3360
116B
YU
LAB
UTT
E!
1.00
723
1.6
268.
3
130.
6
0.975
1
-268
.1
-115
.6
-15.
8
3342
406B
ATI
STE
%
1.01
623
3.7
258.
2
-32.
6
-256
.3
40.6
111
.0 3.0
1205
4J4
17_G
EN
1.00
013
.8
39.5 0.5
1
1
-39.
4
2.3
AU
2.8
2.1
142
.3
2.6R
3352
402S
OLA
C!
1.02
971
.0
-55.
5
-15.
0
1.0102
0.96957
55.6
16.9
-54.
8
-14.
8
1.0102
0.96957
54.9
16.6
1.02
370
.6
-74.
6
-50.
8
1.0567
1
74.7
55.1
-72.
1
-49.
2
1.0567
1
72.3
53.4
-11.
5
3350
452C
AR
LYS
S!
SW
3350
751D
YN
EG
Y_U
1!
1.07
719
.4
3350
761D
YN
EG
Y_U
2!
1.08
619
.6
-169
.4
-96.
8
1
1
170.
1
122.
0
-169
.3
-100
.2
1
1
170.
1
128.
0
117
0.1
122.
0H
117
0.1
128.
0H
3353
711A
CA
DIA
_C25
!
0.99
918
.0
3353
721A
CA
DIA
_C24
!
0.99
918
.0
-81.
6
-33.
0
1.029
181.
9
38.4
-81.
6
-33.
0
1.029
1
81.9
38.4
181
.9
38.4
R
181
.9
38.4
R
3350
604C
AR
LYS
S!
1.02
114
0.9
-54.
4
-81.
1
1.0462
1
54.5
83.5
SW
-144
.1
3352
004N
ELS
ON
!
1.00
513
8.7
138.
7
36.2
1
1
-138
.4
-32.
2
3344
304S
AB
INE
!
1.00
013
8.0
117.
7
-23.
4
1
1
29.3
3342
154C
HIN
A%
0.99
413
7.1
89.0 7.4
1
0.98189
-88.
9
-5.8
15.
7
2.3
3353
644R
ICH
AR
D2!
1.03
414
2.7
3353
664R
ICH
AR
D%
1.00
013
7.9
118.
1
191.
2
1
1
-118
.0
-185
.3
-185
.7
-39.
5
1
1
185.
9
47.8
LG19
.3 6.7
SW
104.
9
3344
504O
RA
NG
E!
0.99
913
7.8
3344
534C
OW
%
0.99
913
7.9
3343
974O
ILLA
0.99
113
6.8
3343
984H
AM
PTO
N
0.98
013
5.2
3344
134P
NE
C B
K!
0.99
013
6.6
3344
144L
IND
E
0.99
113
6.8
-4.8
3.1
4.8
-4.1
-4.8
3.1
4.8
-4.1
-65.
7
11.1
65.9
-11.
0
-189
.1
-32.
3
189.
8
37.2
-186
.3
-24.
9
188.
1
37.0
-197
.1
-4.1
198.
6
14.7
-188
.3
-9.7
189.
4
17.4
SW
-36.
0
13.
7
0.5
13.
4
0.4
-147
.1 6.8
147.
3
-5.2
IN41
.0
14.8
-117
.5
3353
694A
CA
DIA
%
1.00
013
8.0
-151
.5
-47.
7
151.
5
47.8
-146
.1
-46.
5
146.
1
46.6
3351
928N
ELS
ON
%
0.99
349
6.7
3353
678R
ICH
AR
D%
1.01
050
5.2
3343
258H
AR
TBR
G%
1.02
050
9.8
-656
.2
-118
.9
659.
9
60.8
-338
.9
467.
5
340.
2
-499
.4
3030
218C
OTN
WO
OD
2!
1.02
050
9.9
3030
288C
OTN
WO
OD
1!
1.02
050
9.9
3343
208C
YP
RE
SS
%
1.02
051
0.2
339.
8
274.
7
-339
.8
-275
.3
339.
8
244.
2
-339
.8
-244
.8
-619
.1
35.0
620.
8
-73.
1
3353
688W
ELL
S%
1.00
850
3.8
-784
.8
132.
3
786.
2
-142
.0
3355
008W
EB
RE
%
1.01
050
5.0
-119
5.2
72.9
1203
.2
-28.
6
3360
108B
YU
LAB
UTT
E%
1.00
350
1.6
3030
058B
IG_C
AJU
N2%
1.02
051
0.0
198.8
81.9
-198.6
-126.5
1409
.5
111.
5
-140
2.0
-53.
3
3356
188W
ILLO
W_G
L%
1.00
350
1.6
69.6
-5.4
-69.
6
-4.0
3358
378C
OLY
%
1.00
550
2.6
-733
.5
-3.1
735.
1
-13.
2
3344
401G
4SA
BIN
!
1.02
624
.6
-514
.0
-221
.4
1
0.975
515.
2
272.
71
515.
2
272.
7R33
5206
1NE
LSO
N_G
6!
0.93
918
.8
-533
.7
221.
1
1
0.95
534.
6
-183
.81
534.
6
-183
.8R
3344
311G
1SA
BIN
!
1.07
821
.6
3344
321G
2SA
BIN
!
0.98
019
.6
-202
.6
-41.
2
1
1.045
204.
1
61.6
-202
.7
-40.
8
1
0.95
204.
1
61.6
120
4.1
61.6
R
120
4.1
61.6
R
3344
411G
5SA
BIN
!
0.97
021
.3
-436
.4
-25.
8
1
0.95
437.
4
64.0
143
7.4
64.0
H
3344
331G
3SA
BIN
!
0.97
221
.4
-403
.0
-18.
1
1
0.95
408.
3
61.6
140
8.3
61.6
R
3352
011N
ELS
ON
_G1!
0.98
614
.233
5202
1NE
LSO
N_G
2!
0.98
614
.2
-102
.8
29.0
1
1
103.
0
-19.
0
-102
.8
29.0
1
1
103.
0
-19.
0
110
3.0
-19.
0L 110
3.0
-19.
0L
3353
701A
CA
DIA
_S26
!
0.99
415
.9
-134
.5
-28.
4
1.029
1
135.
2
38.4
113
5.2
38.4
R
1
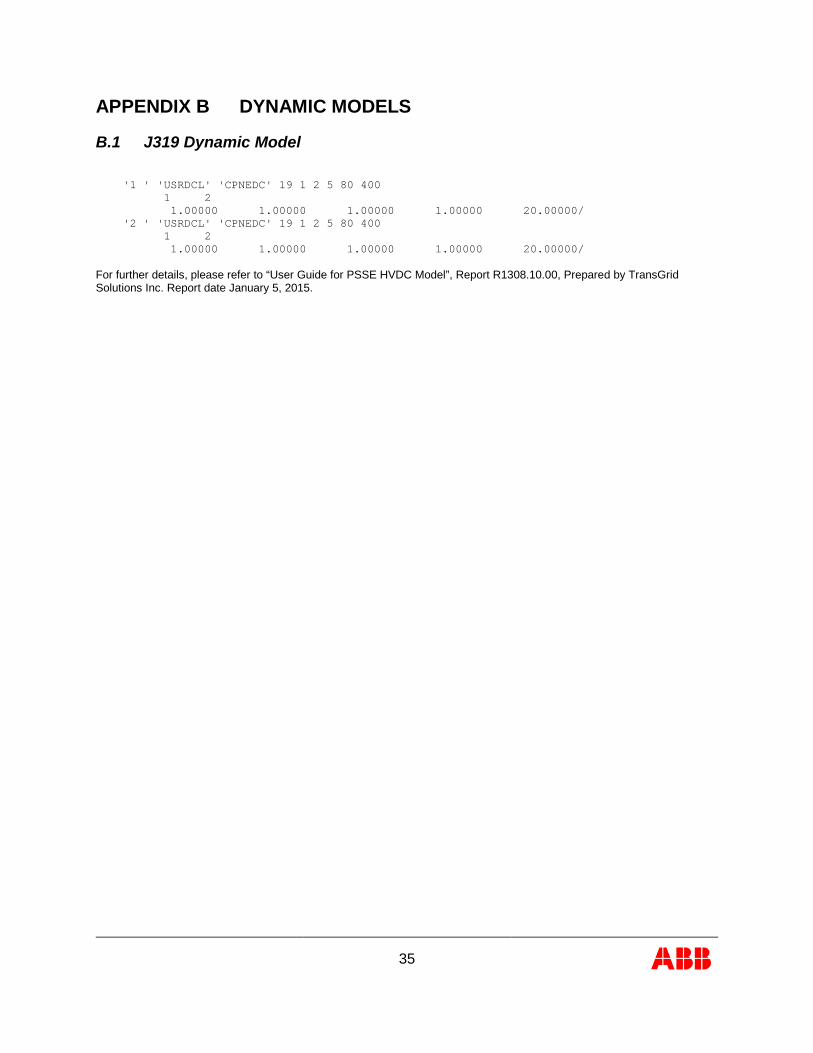
35
APPENDIX B DYNAMIC MODELS
B.1 J319 Dynamic Model '1 ' 'USRDCL' 'CPNEDC' 19 1 2 5 80 400 1 2 1.00000 1.00000 1.00000 1.00000 20.00000/ '2 ' 'USRDCL' 'CPNEDC' 19 1 2 5 80 400 1 2 1.00000 1.00000 1.00000 1.00000 20.00000/ For further details, please refer to “User Guide for PSSE HVDC Model”, Report R1308.10.00, Prepared by TransGrid Solutions Inc. Report date January 5, 2015.

36
B.2 J417 Dynamic Model 1 PTI INTERACTIVE POWER SYSTEM SIMULATOR--PSS(R)E TUE, JUL 28 2015 14:11 MTEP14_2019SH_FINAL 2014 AUG DPP STUDY; STABILITY BASE CASE PLANT MODELS REPORT FOR ALL MODELS BUS 12054 [J417_GEN 13.800] MODELS ** GENSAL ** BUS X-- NAME --X BASEKV MC C O N S S T A T E S 12054 J417_GEN 13.800 1 391164-391175 135049-135053 MBASE Z S O R C E X T R A N GENTAP 51.3 0.00130+J 0.23300 0.00000+J 0.00000 1.00000 T'D0 T''D0 T''Q0 H DAMP XD XQ X'D X''D XL 8.601 0.030 0.036 4.04 0.00 2.1000 1.1900 0.3000 0.2330 0.1310 S(1.0) S(1.2) 0.2380 0.5880 ** AC8B ** BUS X-- NAME --X BASEKV MC C O N S S T A T E S V A R S 12054 J417_GEN 13.800 1 392396-392416 135433-135437 84351-84353 TR KPR KIR KDR TDR VPIDMAX VPIDMIN 0.0050 6.4000 1.6000 0.8000 0.0500 1.0000 0.0000 KA TA VRMAX VRMIN KC KD 6.4800 0.0040 5.6200 -5.6200 0.0000 0.0000 KE TE VFEMAX VEMIN 1.0000 0.3000 99.0000 0.0000 E1 S(E1) E2 S(E2) 5.8116 0.0298 7.7488 0.1786 ** TGOV1 ** BUS X-- NAME --X BASEKV MC C O N S S T A T E S VAR 12054 J417_GEN 13.800 1 393565-393571 135740-135741 84501 R T1 VMAX VMIN T2 T3 DT 0.057 0.500 0.880 0.000 2.000 7.000 0.000
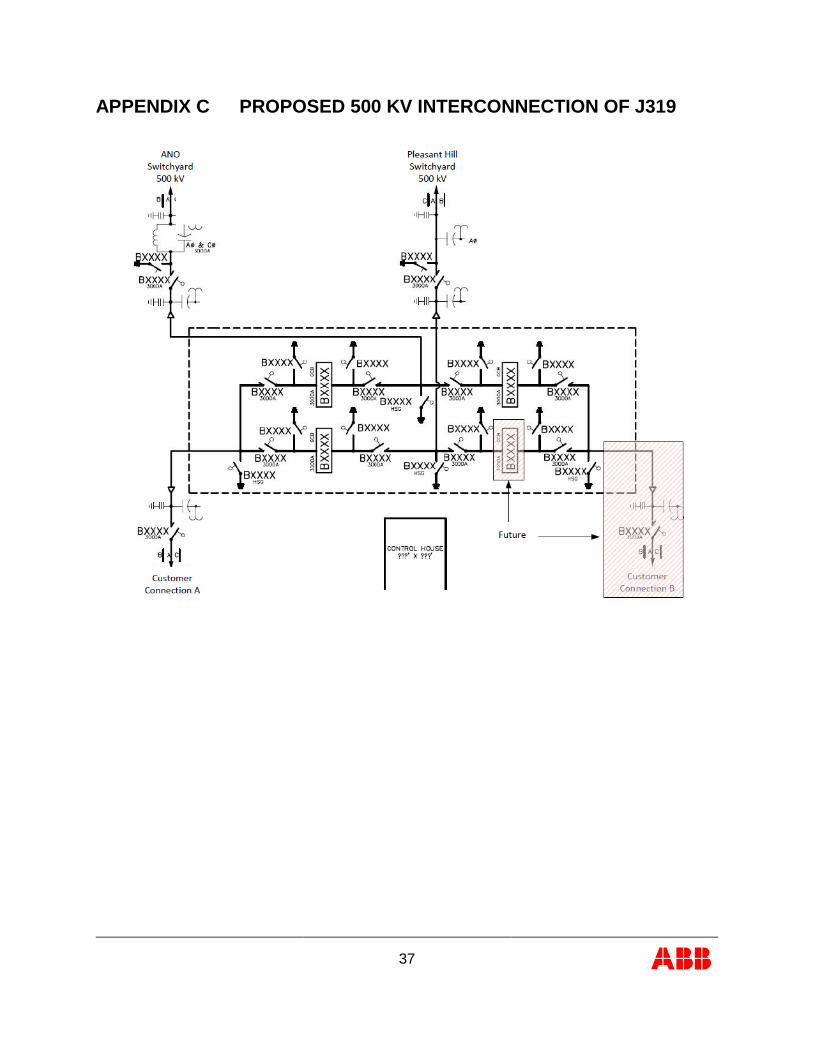
37
APPENDIX C PROPOSED 500 KV INTERCONNECTION OF J319

38
APPENDIX D PLOTS OF 2018 POST-PROJECT CASE See the separate attachment for the plots.

39
APPENDIX E PLOTS OF 2018 PRE-PROJECT CASE See the separate attachment for the plots.

40
APPENDIX F PLOTS OF 2025 POST-PROJECT CASE See the separate attachment for the plots.

41
APPENDIX G PLOTS OF 2025 PRE-PROJECT CASE See the separate attachment for the plots.

42
APPENDIX H ONE-LINE DIAGRAM OF UPDATED J319 MODEL

43
Placeholder for updated J319 slider

44
APPENDIX I PLOTS OF 2018 J319 SENSITIVITY ANALYSIS See the separate attachment for the plots.

45
APPENDIX J PLOTS OF 2025 J319 SENSITIVITY ANALYSIS See the separate attachment for the plots.
I m p ac ts o f MI S O Fe bru ar y 2015 S ou th A re a D PP
S tu d y Gen er a to r In te rc onn ec t i on R eques t s on
SP P F ac i l i t i es
August 2015
Generator Interconnection
Impacts for MISO West Area DPP Generators on SPP Facilities i
Revision History
Date Author Change Description
08/31/2015 SPP Initial Draft Report Issued
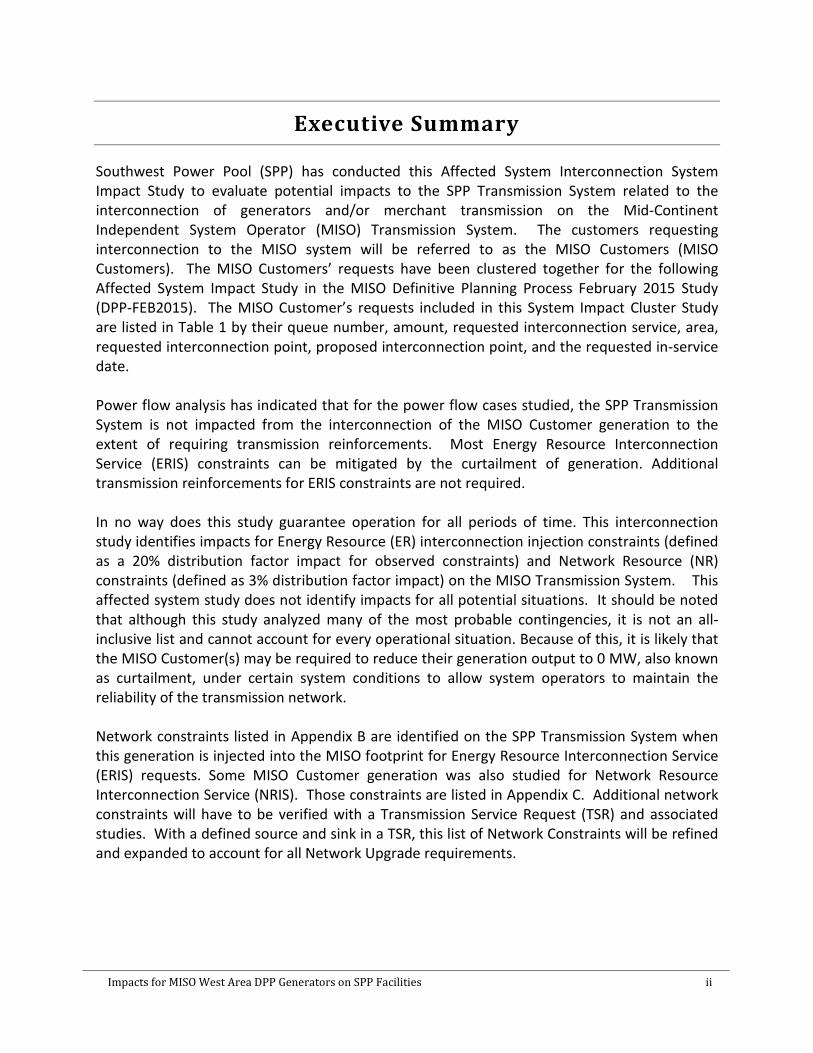
Impacts for MISO West Area DPP Generators on SPP Facilities ii
Executive Summary
Southwest Power Pool (SPP) has conducted this Affected System Interconnection System Impact Study to evaluate potential impacts to the SPP Transmission System related to the interconnection of generators and/or merchant transmission on the Mid-Continent Independent System Operator (MISO) Transmission System. The customers requesting interconnection to the MISO system will be referred to as the MISO Customers (MISO Customers). The MISO Customers’ requests have been clustered together for the following Affected System Impact Study in the MISO Definitive Planning Process February 2015 Study (DPP-FEB2015). The MISO Customer’s requests included in this System Impact Cluster Study are listed in Table 1 by their queue number, amount, requested interconnection service, area, requested interconnection point, proposed interconnection point, and the requested in-service date. Power flow analysis has indicated that for the power flow cases studied, the SPP Transmission System is not impacted from the interconnection of the MISO Customer generation to the extent of requiring transmission reinforcements. Most Energy Resource Interconnection Service (ERIS) constraints can be mitigated by the curtailment of generation. Additional transmission reinforcements for ERIS constraints are not required. In no way does this study guarantee operation for all periods of time. This interconnection study identifies impacts for Energy Resource (ER) interconnection injection constraints (defined as a 20% distribution factor impact for observed constraints) and Network Resource (NR) constraints (defined as 3% distribution factor impact) on the MISO Transmission System. This affected system study does not identify impacts for all potential situations. It should be noted that although this study analyzed many of the most probable contingencies, it is not an all-inclusive list and cannot account for every operational situation. Because of this, it is likely that the MISO Customer(s) may be required to reduce their generation output to 0 MW, also known as curtailment, under certain system conditions to allow system operators to maintain the reliability of the transmission network. Network constraints listed in Appendix B are identified on the SPP Transmission System when this generation is injected into the MISO footprint for Energy Resource Interconnection Service (ERIS) requests. Some MISO Customer generation was also studied for Network Resource Interconnection Service (NRIS). Those constraints are listed in Appendix C. Additional network constraints will have to be verified with a Transmission Service Request (TSR) and associated studies. With a defined source and sink in a TSR, this list of Network Constraints will be refined and expanded to account for all Network Upgrade requirements.
Impacts for MISO West Area DPP Generators on SPP Facilities iii
Contents Revision History ................................................................................................................................ i
Executive Summary ......................................................................................................................... ii
Introduction ............................................................................................................................................ 1 Analysis ................................................................................................................................................... 1
1. Interconnection Requests Included in the Study .................................................................. 1
2. Previously Queued Interconnection Requests ...................................................................... 1
3. Models ................................................................................................................................... 2
4. Contingencies ........................................................................................................................ 3
5. Monitored Elements .............................................................................................................. 3
6. Methodology ......................................................................................................................... 3
7. Results ................................................................................................................................... 4
8. Determination ....................................................................................................................... 5
Conclusion .............................................................................................................................................. 5
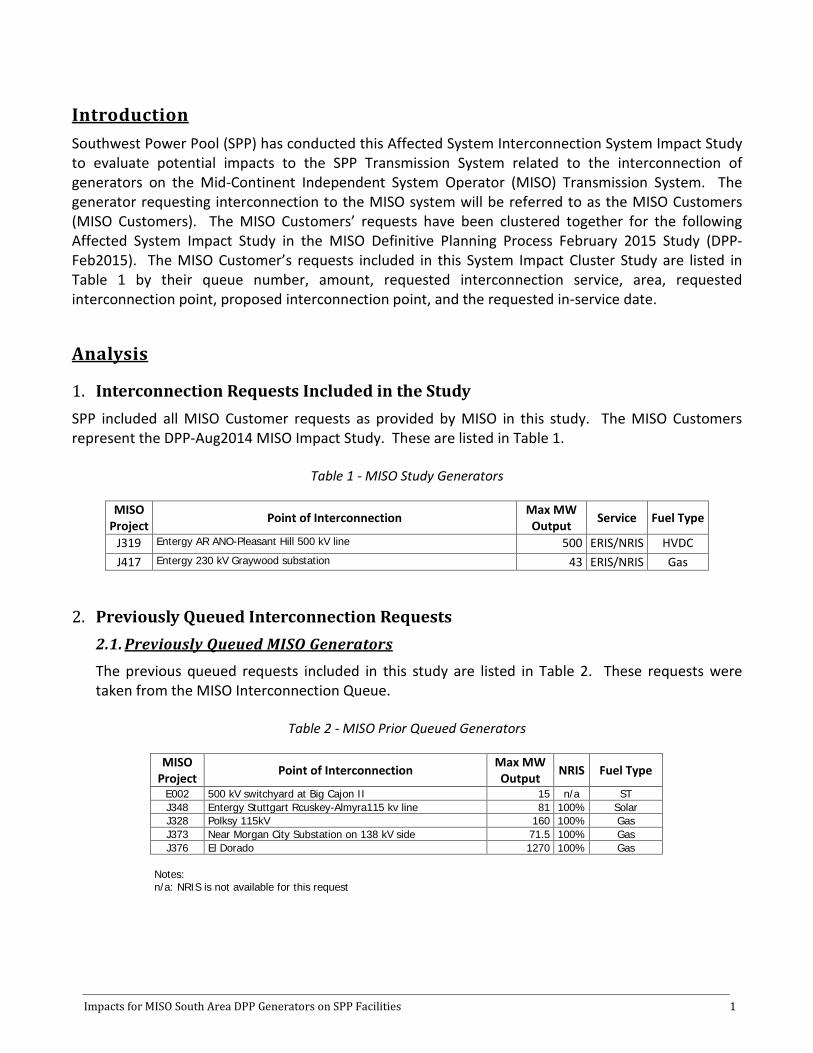
Impacts for MISO South Area DPP Generators on SPP Facilities 1
Introduction Southwest Power Pool (SPP) has conducted this Affected System Interconnection System Impact Study to evaluate potential impacts to the SPP Transmission System related to the interconnection of generators on the Mid-Continent Independent System Operator (MISO) Transmission System. The generator requesting interconnection to the MISO system will be referred to as the MISO Customers (MISO Customers). The MISO Customers’ requests have been clustered together for the following Affected System Impact Study in the MISO Definitive Planning Process February 2015 Study (DPP-Feb2015). The MISO Customer’s requests included in this System Impact Cluster Study are listed in Table 1 by their queue number, amount, requested interconnection service, area, requested interconnection point, proposed interconnection point, and the requested in-service date.
Analysis
1. Interconnection Requests Included in the Study SPP included all MISO Customer requests as provided by MISO in this study. The MISO Customers represent the DPP-Aug2014 MISO Impact Study. These are listed in Table 1.
Table 1 - MISO Study Generators
MISO Project Point of Interconnection Max MW
Output Service Fuel Type
J319 Entergy AR ANO-Pleasant Hill 500 kV line 500 ERIS/NRIS HVDC J417 Entergy 230 kV Graywood substation 43 ERIS/NRIS Gas
2. Previously Queued Interconnection Requests 2.1. Previously Queued MISO Generators
The previous queued requests included in this study are listed in Table 2. These requests were taken from the MISO Interconnection Queue.
Table 2 - MISO Prior Queued Generators
MISO Project Point of Interconnection Max MW
Output NRIS Fuel Type
E002 500 kV switchyard at Big Cajon II 15 n/a ST J348 Entergy Stuttgart Rcuskey-Almyra115 kv line 81 100% Solar J328 Polksy 115kV 160 100% Gas J373 Near Morgan City Substation on 138 kV side 71.5 100% Gas J376 El Dorado 1270 100% Gas
Notes: n/a: NRIS is not available for this request
Impacts for MISO South Area DPP Generators on SPP Facilities 2
2.2. Other MISO Generators
Also included in this study were Arkansas generators in the models that were ramped up to their Pmax due to their electrical proximity to the study generators.
Table 3 – Other MISO generators dispatched to Pmax
Bus Number Bus Name Pmax
337910 1ANO U1 937 337911 1ANO U2 1073
2.3. Previously Queued SPP Generators
Also included in this study were SPP Generator Interconnection Requests as listed in Appendix A. These Interconnection Requests include Group 12 Requests through DISIS-2015-001.
3. Models The 2014 series Integrated Transmission Planning models (used in the 2015ITPNT) including the 2015 (spring, summer, and winter peak seasons), the 2020 (summer and winter peak seasons) and the 2025 (summer peak season) scenario 0 cases were used for this study. After the cases were developed, each of the control areas’ resources were then re-dispatched to account for the new generation requests using current dispatch orders. For Energy Resource Interconnection Service (ERIS), the MISO generating plants were modeled at 100% nameplate of maximum generation. These projects were dispatched as Energy Resources and sunk to load across the MISO footprint. All generators that requested Network Resource Interconnection Service (NRIS) were dispatched in an additional analysis in accordance with the values listed in Tables 2 and 3. The models used for this study include the following:
• 2015 Spring (15G) – ERIS • 2015 Spring (15G) - NRIS • 2015 Summer (15SP) – ERIS • 2015 Summer (15SP) - NRIS • 2015 Winter (15WP) – ERIS • 2015 Winter (15WP) - NRIS • 2020 Summer (20SP) – ERIS • 2020 Summer (20SP) - NRIS • 2020 Winter (20WP) – ERIS • 2020 Winter (20WP) - NRIS • 2025 Summer (25SP) – ERIS • 2025 Summer (25SP) - NRIS
Impacts for MISO South Area DPP Generators on SPP Facilities 3
4. Contingencies • All branches and ties within the following areas:
o 502 – 546, 640, 645, 650, 652, 998, 999 o 326, 327, 328, 329, 330, 332, 334, 335, 336, 337, 338, 339, 351, 356, 635
• NERC, SPP, and Tier 1 Permanent Contingent Flowgates • SPP T.O. Specific and Tier 1 Specific Contingencies • SPP T.O. Specific Op Guide Implementation
5. Monitored Elements • NERC, SPP, and Tier 1 Permanent Monitor Flowgates • All branches and ties within the following areas:
o 330,502 – 546,640,645,650,652,998,999 for voltages 65 kV – 999 kV o 326, 327, 328, 329, 332, 334, 335, 336, 337, 338, 339, 351, 356, 635 for voltages 100
kV – 999 kV
6. Methodology This Affected System Study for the MISO February 2015 South Area DPP Study used ACCC analysis. AC Analysis uses the ACCC function of PSS/E to determine the constraints and PSS/MUST to determine the associated DFs. Per the following SPP Constraint identification criteria, a facility requires review if loadings are higher than 95%. If loadings are higher than 100% mitigation may be required depending on the type of service requested and the distribution factors associated with the affecting requests and the type of contingency. Other factors may also be considered when determining the effects of requests on overloaded facilities.
6.1. ERIS Constraint Criteria
If a facility is overloaded under no contingency (CAT A) or under contingency (CAT B, CAT C, and CAT D and Extreme Events) by a request with a distribution factor of greater than or equal to 19.5%, that request will be labeled as affecting and mitigation may be required. If the overloaded facilities make up a flowgate (OTDF) and a request has a distribution factor of greater than or equal to 19.5%, that request will be labeled as affecting and mitigation may be required. Non-converged contingencies shall also be considered for mitigation.
6.2. NRIS Constraint Criteria
If a facility is overloaded under no contingency (CAT A) or under contingency (CAT B, CAT C, and CAT D and Extreme Events) by a request with a distribution factor of greater than or equal to 3%, that request will be labeled as affecting and mitigation may be required. If the overloaded facilities make up a flowgate (PTDF or OTDF) and a request has a distribution factor of greater than or equal

Impacts for MISO South Area DPP Generators on SPP Facilities 4
to 3%, that request will be labeled as affecting and mitigation may be required. Non-converged contingencies shall also be considered for mitigation.
6.3. Additional Constraint Consideration
Notwithstanding, should any facility be identified by MISO using MISO Constraint Identification Criteria as being affected by a study request, such as “Outlet” constraints or other specific criteria, review and mitigation of those constraints may also be required.
As a note the SPP Permanent List of Flowgates are included within SPP Planning studies and can be reviewed on the SPP OASIS website. The direct link to the current Permanent Flowgate list is as follows: https://www.oasis.oati.com/SWPP/SWPPdocs/Permanent_flowgates.xls
7. Results The following facilities were found to be impacted by the MISO generators.
Table 4 – Potential Constraints
ERIS Constraint Area Contingency Loading Affecting Requests Season None
7.1. Evaluation of MISO Identified Constraints
In its Interconnection Study, MISO identified the following constraints by the MISO Customer
generation. Table 5 – MISO Identified Constraints
Constraint Area Contingency Loading Affecting Requests Season Ft. Smith East – Bevy Tap 115kV OKGE J319 tap – ANO 500kV 103.3% J319 2025 Ft. Smith East – Bevy Tap 115kV OKGE J319 tap – Pleasant Hill 500kV 108.4% J319 2025
SPP analyzed the cases and found worst case loadings as follows.
Table 6 – SPP results for MISO Identified Constraints
Constraint Area Contingency Loading Season Ft. Smith East – Bevy Tap 115kV OKGE J319 tap – ANO 500kV 30% 2025SP (ERIS)
The SPP generation at AES COGEN 1 and 2 (515266 and 515267) have firm transmission service for 320MW. These units were not dispatched in the MISO provided cases. This generation provides counterflow on the Fort Smith East to Bevy tap line, removing the overload for the listed contingencies. No overloads for other contingencies were seen on this line.

Impacts for MISO South Area DPP Generators on SPP Facilities 5
8. Determination The SPP Transmission System is not impacted by the interconnection of the MISO Customer generation to the extent that transmission reinforcement in required. Most ERIS impacts can be mitigated through generator curtailment and do not require additional transmission reinforcement.
Conclusion Southwest Power Pool (SPP) has conducted this Affected System Interconnection System Impact Study to evaluate potential impacts to the SPP Transmission System related to the interconnection of generators on the Mid-Continent Independent System Operator (MISO) Transmission System. Power flow analysis has indicated that for the power flow cases studied, the SPP Transmission System is impacted from the interconnection of the MISO Customer generation. Most Energy Resource Interconnection Service (ERIS) constraints can be mitigated by the curtailment of generation and transmission reinforcements are not required. If additional analysis is required it will be performed under an executed Affected System Facility Study. The purpose of the Affected System Facility Study is to perform additional analysis required to refine the scope, cost estimates, and expected time of construction of system facilities identified as Network Upgrades that would be placed under the SPP Open Access Transmission Tariff.