Embed Size (px)
Citation preview


1 MoM of Ramagundam Islanding/Identification of RP load reliefs – 23.09.2020
Minutes of the Meeting on Review of Ramagundam
Island/identification of HVDC Raigarh- Pugalur SPS
Load relief
A meeting was held on 23rd September 2020 with participation from TSSLDC, TSTRANSCO, SRPC and SRLDC, to review the Ramagundam Islanding scheme and Identification of Loads for the HVDC Raigarh - Pugalur SPS in Telangana area. The list of participants is at Annexure-I.
Brief background of the Ramagundam Islanding Scheme/identification of Raigarh-Pugalur is at Annexure-II.
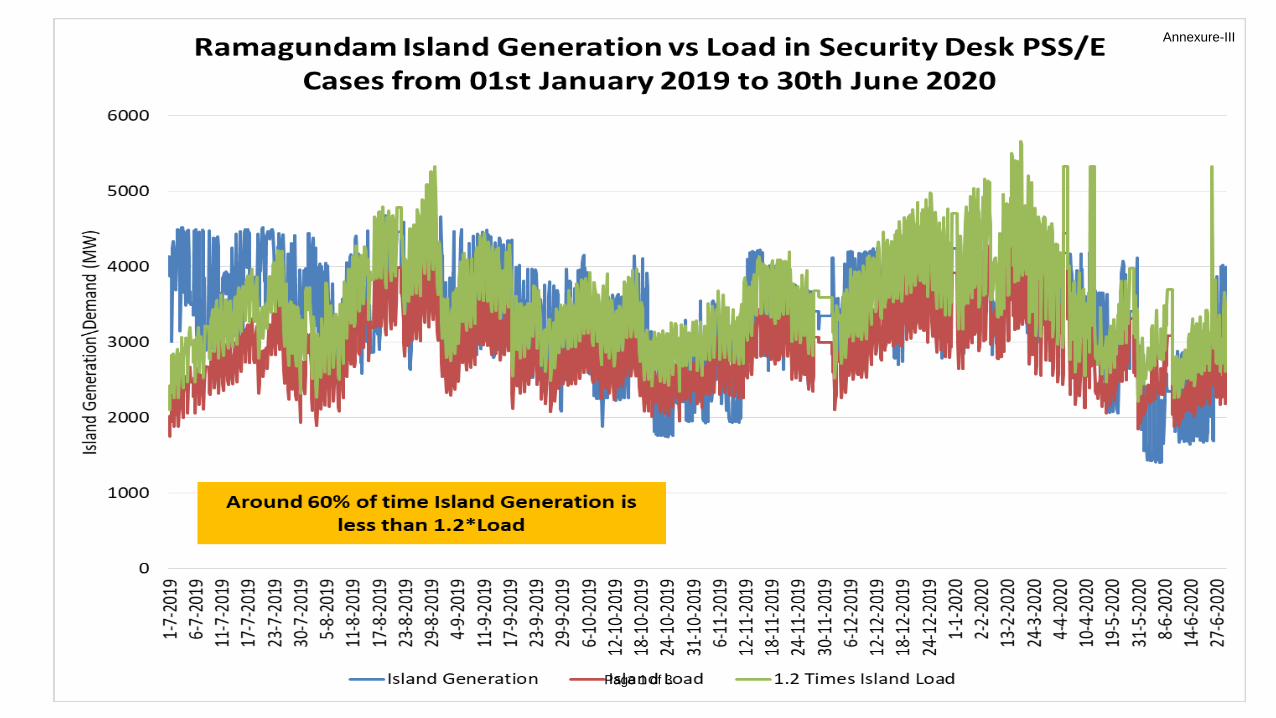
SRLDC appraised about the Ramagundam Island and emphasized that generation in any island needs to be around 10 - 20 % higher than Loadto allow the island frequency to recover from the islanded formation frequency i.e. from 47.7 Hz. The island should not generally include Lift Irrigation loads, loads identified for AUFR, df/dt and SPS as this would cause a Load generation imbalance as these loads would be interrupted well before formation of the island. CGM, SRLDC stated that system studies were conducted on approx. 2000 available PSS/E cases for time period of 1st January 2019 to 30th June 2020. From the analysis of the cases, it was found that there is about 300-400 MW excess load is available in the Island and that can be utilized for connecting to the HVDC Raighar-Pugalur SPS (Annexure-III). TSTRANSCO informed that the average Load of the Telangana is 7100 MW and all the Loads have been identified for different defense mechanisms/SPS Schemes/island. On examination the data presented by TSTRANSCO, it was found that the AUFR/Df/dt is shown for Solar and Non-solar period separately and there were overlaps among AUFR and SPS scheme. SRPC informed that as per IEGC clause 5.4.2(e), there should not be any overlap among different groups of loads and AUFR & df/dt. Loads should be identified as average load instead of the way followed by TSTRANSCO. IEGC clause 5.4.2(e)
“In order to maintain the frequency within the stipulated band and maintaining the network security, the interruptible loads shall be arranged in four groups of loads, for scheduled power cuts/load shedding, loads for unscheduled

2 MoM of Ramagundam Islanding/Identification of RP load reliefs – 23.09.2020
load shedding, loads to be shed through under frequency relays/ df/dt relays and loads to be shed under any System Protection Scheme identified at the RPC level. These loads shall be grouped in such a manner, that there is no overlapping between different groups of loads.”
After the deliberations in the meeting following are decided,
SRLDC would prepare the format for collection of load data identified for Island, AUFR, df/dt and different SPS schemes. (The format is attached at Annexure-IV)
It was agreed that if TSTRANSCO is not able to identify separate loads of Raigarh-Pugalur SPS, it can be taken from the Ramagundam Island as it would help in addressing the LGB mismatch in the island.
TSTRANSCO has to furnish the load data identified for Island, AUFR, df/dt and different SPS schemes. All loads identified are must be average loads.
TSTRANSCO has to ensure no overlapping of loads among the AUFR, df/dt & SPS schemes (in compliance of IEGC). Discrepancy, if any, may be mentioned.
TSTRANSCO to examine and take action to avoid mixed feeders (RE +load) and dedicated feeder from RE resource to nearest SS could be ensured.
After receiving the data from TSTRANSCO, SRPC/SRLDC would conduct a meeting for finalization of the island and HVDC Raigarh-Pugalur SPS load relief.
***

Sl.No Name Designation Email
1 A.Balan MS, SRPC [email protected]
2 Abhimanyu Gartia ED, SRLDC [email protected]
3 Asit Singh SE (O), SRPC [email protected]
4 R.M.Rangarajan SE (P), SRPC [email protected]
5 Kumar SP Chief GM , SRLDC [email protected]
6 Suresh Babu SE, TSSLDC [email protected]
7 PRAVEEN ADE/SYSTEM PROTECTION TSTRANSCO [email protected]
8 Sharath chand Manager , SRLDC [email protected]
9 Goodelli Madhukar G M, SRLDC [email protected]
10 N.S.Malini EE, SRPC [email protected]
11 Sriharsha M AEE, SRPC [email protected]
12 J.B.Len EE, SRPC [email protected]
13 Betsy Sebastian AEE, SRPC [email protected]
14 A Kesavan EE, SRPC [email protected]
Meeting on Review of Ramagundam Island/ Identification of HVDC Raigarh - Pugalur SPS Load Relief -Reg.
List of Participants
Annexure-I
Page 1 of 1

Ramagundam islanding
scheme/SPS scheming
23rd September 2020
Annexure-II
Page 1 of 14

Introduction Meeting held on 27th Jan 2020, discussed in detail various islanding schemes in
SR
Broad actions requested from constituents:
i. Lift irrigation scheme pumps/motors and pumped storage schemes to be tripped at 48.5 Hz.
at pump side (not at grid side).
ii. HF set points (to trip) for Renewable generators shall be at steps of 25% each of total RE
Generation, at 51 Hz., 51.2 Hz., 51.4 Hz. and 51.5 Hz within the island.
iii. df/dt relays to be modified with under frequency tripping at 47.8 Hz as a backup (i.e.OR
logic) with existing df/dt trip settings (will act as Island UFR).
Alongwith the above island specific information was also requested to be
furnished by the constituents.
Annexure-II
Page 2 of 14

Ramagundam island discussed in Jan 2020
meeting Ramagundam Island Size 4700 MW
Major Generators
Ramagundam TPS
Singareni TPS
Kakatiya TPS
Major Load Centres
Hyderabad
Warangal
Upcoming Generating units have not been considered
Telangana STPP
Bhadradri TPS
Damarcherla TPS
More Lift Irrigation projects to get commissioned in Telangana
Annexure-II
Page 3 of 14

Load Generation Balance Details
S.No Area Generation
(MW)
Load
(MW) Losses (MW)
1 TS SPDCL 0 3496 124
2 RGM TPS 2446 0 30
3 TS NPDCL 2250 357 35
4 TS WW 0 50 0
5 TOTALS 4696 4505 192
S.No Area Generation
(MW)
Load
(MW) Losses
1 TS STU 0 4504 154
2 TS HYDRO 36 0
3 TS THERMAL 1070 0
4 TS STPP 1136 0
5 NTPC SR 2454 0 38
6 Totals 4696 4504 192
S.No Bus
Number Generator Name Generation (MW)
Installed Capacity
(MW)
1 424002 Ramagundam TPS 2446 2600
2 424015 Singareni 1136 1200
3 424009 Kakatiya 1025 1100
4 421055 Ramagundam B 45 63
5 421047 Pochampad 36 36
6 42135 Orient Cements 8 8
Annexure-II
Page 4 of 14

-200
-150
-100
-50
0
50
100
150
200
250
300
0
500
1000
1500
2000
2500
3000
3500
4000
4500
5000
5500
6000
6500
7000
% M
ism
atc
h
Ge
ne
rati
on
/Lo
ad
(M
W)
Ramagundam Island Load Generation Balance
Island Generation Island Load Margin Available w.r.t Generation (%)
Average Generation
Average Load
Average Mismatch
3553
5019
45 %
Annexure-II
Page 5 of 14

Observations by SRLDC In the Ramagundam Island , most of the time a deficit island with a average
mismatch of almost around 45%, however the UFR and df/dt loads are yet to
be mapped.
In Telangana there is huge Solar Generation and Large amount of Lift
irrigation pump sets. Thus creating further uncertainty in the Island success
With the commissioning of the upcoming generators Telangana STPP,
Damarcherla the Islanding scheme needs to be further reviewed.
In case of successful Island formation the transmission lines are in the normal
limits.
TSTRANSCO was also requested to submit study results of islanding scheme
with modifications suggested by them with additional details on or before
21.02.2020.
Annexure-II
Page 6 of 14

Identification of loads for Raigarh Pugalur SPS
Subsequently with the advancements in commissioning of HVDC Raigarh Pugalur all constituents
were requested to identify loads of Raigarh – Pugalur SPS.
During discussions in 168th OCC held on 09-07-2020, TSTRANSCO raised difficulties in identifying new
loads for load relief of 335MW.
It was suggested that excess load of 1500MW (average load-5019MW, average Generation 3553MW)
was observed in Ramagundam island and may be used for HVDC Raigarh – Pugalur SPS. TSTRANSCO
informed that excess load of 1500MW is not available.
TSTRANSCO was requested to submit the following to verify the above:
Furnish the actual average and peak available load in the island. (SCADA data for proof of 1 year)
To form island, SRLDC had proposed line openings, whether the proposed line list is ok? If not please may
furnish the line opening details for formation of island. The lines where UFR relays for Island formation are
already installed may also be indicated.
Furnish the converged PSSE case with average loads for studying the island. Furnish the SPS, AUFR, df/dt
load details, which are part of this island.
Details of any further elements, generators likely to be commissioned in next 6 months
Annexure-II
Page 7 of 14

TSTRANSCO vide mail dated 05.08.2020 submitted the following:
i. Actual average load and peak load in the Island (SCADA proof for 1 year) -
as obtained from SLDC
ii. The list of feeders to be tripped during the Islanding formation.
iii. PSSE case file with average loads. - as obtained from SLDC.
iv. Present list of feeders/PTRs to be tripped under AUFR & f+df/dt
v. The Raichur-Sholapur and Kudankulam SPS load relief details.
Loads identified by TSTRANSCO under
AUFR
Stage-I at 49.4Hz (Instantaneous) 417 MW
Stage-II at 49.2Hz (Instantaneous) 419 MW
Stage-III at 49.0 Hz (Instantaneous) 424 MW
Stage-IV at 48.8 Hz (Instantaneous) 426 MW
Total 1686 MW
Loads identified by TSTRANSCO under Df/dt
Stage-A: Frequency < =49.5
Hz(Trip) (0.2Hz/sec fall of freq.)
or 48.5Hz (Trip for Islanding formation) 367 MW
Stage-B: Frequency < =49.3 Hz
(Trip) (0.3Hz/sec fall of freq.)
or 48.5Hz (Trip for Islanding formation) 912 MW
Total 1279 MW
Load
Details
Annexure-II
Page 8 of 14

Generation Details
RSTPS - NTPC Installed Capacity: 2600 MW
SINGARENI Installed Capacity: 1200 MW
KTPP Installed Capacity: 1100 MW
RAMAGUNDAM-B Installed Capacity: 63 MW
Total Installed Capacity available for
Islanding Scheme: 4963 MW
Generation Availability for Islanding
Scheme:(4963X0.7) 3474 MW
Average Load of the island 2933 MW
Generation and load details of Ramagundam
islanding furnished by TSTRANSCO
Annexure-II
Page 9 of 14

Loads identified under various existing
SPS Schemes
SPS Scheme Load in MW
RS-1 344
RS-2 183
RS-3 230
KK-2 120
Total 877
Annexure-II
Page 10 of 14

Load Profile in Telangana
Total AUFR load 1686 MW
Total Df/dt 1297 MW
Total SPS loads (excluding RP SPS) 877 MW
Ramagundam islanding load 2933 MW
Total (AUFR+ df/dt + SPS + Rmgdm
islnd) 6793 MW
Average TS load 7100 MW
Annexure-II
Page 11 of 14

TSTRANSCO also stated that average load availability of Telangana is 7100MW
and there is no exclusive availability of Average load of 335MWs for Raigarh-
Pugalur SPS scheme
PSSE case submitted by TSTRANSCO was simulated in 1972 No of security desk
cases from 1st July 2019 to 08 August 2020 by SRLDC and their observations
are – Load in excess in comparison to generation for majority of time in a year.
Considering at least 10% generation excess around 600MW load is surplus & can be used for
HVDC Raigarh Pugalur SPS.
TSTRANSCO informed in 170th OCC that GHMC loads have been modelled as
non-scalable loads in TTC case submitted by TSTRANSCO. Hence loads have
not been scaled proportional to demand in cases sent by SRLDC.
Annexure-II
Page 12 of 14

Generation in MU
Generators in Ramagudam island IC(MW) 2018-19 2019-20
Ramagundam 2600 18547.88 17126.03
Singaneri 1200 8694.40 8642.35
Kakatiya 1100 7726.32 7579.83
Ramagundam B 62.5 423.01 400.17
Pochmapad 36 31.64 48.16
Ex - bus generation 32945.52 31433.67
Average MW 3760.90 3578.51
After assuming 5% loss in MW 3572.86 3399.59
After assuming 10% of extra generation in MW 3215.57 3059.63
Average Generation in Ramagundam island Annexure-II
Page 13 of 14

Load Duration curve of Telangana
0
1000
2000
3000
4000
5000
6000
7000
8000
9000
10000
11000
12000
0%
5%
10%
15%
20%
25%
30%
35%
40%
45%
50%
55%
60%
65%
70%
75%
80%
85%
90%
95%
100%
DE
MA
ND
ME
T IN
MW
---
>
% OF TIME --->
तेलंगाना / TELANGANA
1000
2000
3000
4000
5000
6000
7000
8000
9000
10000
11000
12000
13000
14000
0%
5%
10%
15%
20%
25%
30%
35%
40%
45%
50%
55%
60%
65%
70%
75%
80%
85%
90%
95%
100%
DE
MA
ND
ME
T IN
MW
% OF TIME
TELANGANA
2018-19 2019-20
Annexure-II
Page 14 of 14
Annexure-III
Page 1 of 3

Annexure-III
Page 2 of 3

Annexure-III
Page 3 of 3

Annexure-IV
S.No Substation Feeder/Transformer Feeders/PTRsRamagundam
Island (MW)
Raichur - Sholapur - 1 SPS
(MW)
Raichur - Sholapur - 2
SPS (MW)
Raichur - Sholapur - 3 SPS
(MW)KKNPP - 2 (MW)
AUFR STAGE-1
(MW)
AUFR STAGE-2
(MW)
AUFR STAGE-3
(MW)
AUFR STAGE-4
(MW)
DF/DT STAGE 1
(MW)
DF/DT STAGE -2
(MW)
Lift Irrigation
(MW)
1 Station- A
2 Station - B
3
4
5
6
7
8
9
10