Embed Size (px)
Citation preview

Researched By:
D. M. Frosaker Process Engineer, US Steel - MOO
Written By:
D.M. Frosaker Process Engineer, US Steel - MOO
September 30, 2004
Prepared for:
Minnesota Department of Natural Resources Taconite Grant Technical Committee
USS – Minnesota Ore Operations
1 of 74
ABSTRACT
Hydrocycloning of flotation feed was shown to increase recovery by decreasing fine iron
losses in the processing of magnetic taconite concentrates. The hydrocyclone
classification of flotation feed allows the fine, liberated particles to bypass flotation and
to be processed with conventional magnetic separators to achieve a final concentrate
grade with a much higher iron recovery. The fine particles also include a fraction of
material referred to as silica “slimes.” Silica slimes are detrimental to the flotation
process by consuming large amounts of amine with minimal reduction in silica.
Hydrocyclone classification allows for the slimes to bypass flotation and results in much
improved flotation selectivity on the coarse fraction. The coarse, unliberated middling
particles go through the existing flotation plant. The absence of the fine iron particles
from flotation alleviates the iron loss due to the fine iron entrainment. Furthermore, the
coarse particles have nearly twice as much retention time in the flotation plant.
2 of 74
INTRODUCTION
Minntac must make use of flotation for upgrading concentrates to achieve the pellet silica
content required by customers. In taconite flotation, the flotation collector is an ether
diamine and the mineral floated is silica. The ether diamine molecule has a partial
positive charge associated with it and the silica particles have a partial negative charge.
Differences in charge results in the attraction and attachment of the amine to the silica
particles. For taconite flotation to work, amine and air are introduced to the slurry in a
highly agitated flotation cell. The well-mixed contents of the cell allows for the amine
and silica to interact and subsequently attach. Amine is also attracted to the air bubbles.
The binding of the silica-laden amine to the air bubbles brings the silica to the surface
and is removed as tailings. The process efficiency is less than 100% because fine iron
particles are entrained with the air bubbles and report to the tailings stream.
Silica grade in the concentrate is controlled by the addition rate of amine. Increasing the
amine rate results in more silica removal. The flotation process is time and chemical
concentration dependent. To achieve an increase in retention time, feed rates must be
lowered or capacity must be increased. Large amounts of amine have been shown to
correlate with poor pellet quality. When the amine rate is high, iron recovery is lowered
due to the relatively large amount of fine iron particles entrained in the froth and
ultimately lost to tails.
The theory behind pre-classification of flotation feed is to utilize hydrocyclones to
separate the fine, liberated particles from the coarse, unliberated particles, and process the
two by different means to achieve a higher iron recovery. The fine, liberated particles
can be processed with a conventional magnetic separator to achieve final concentrate
grade with a much higher iron recovery than would result in flotation. The fine particles
also include a fraction of material referred to as silica “slimes.” The slimes are very
detrimental to flotation by consuming large amounts of amine with little reduction in
silica. Pre-classification of flotation feed will allow for these slimes to by-pass flotation.

3 of 74
This results in much improved flotation selectivity on the coarse fraction. The coarse,
unliberated particles will go through the existing flotation plant. With the slimes
removed, flotation of the coarse particles will require less amine. The absence of the fine
iron particles from flotation improves recovery by alleviating the iron loss due to fine
iron entrainment. The coarse particles will now have nearly twice as much retention time
in the flotation plant, and flotation selectivity will increase.
The pre-classification project was subject to three phases of research and development
before plant installation. Work began in 1997, by Coleraine Minerals Research
Laboratory (CMRL), as a part of a Minntac research project, to study the feasibility of
producing a desirable split on the flotation feed using a hydrocyclone. After promising
results were shown in the laboratory, a full-scale hydrocyclone was slipstreamed into a
grinding circuit in the Minntac concentrator. This circuit was tested for over a year to
examine the effects of process water temperature on the cyclone split. In the later part of
2000, work was done to engineer a circuit to test pre-classification on two grinding lines
and to float the material separate from the rest of the grinding lines. The installation of
the circuit was completed in May 2001, and full scale plant testing was performed during
the period of May-July 2001. The 2001 plant testing verified the cyclones could make
the desired size split and the nest of cyclones could be controlled during normal
operation. The fine particle stream was upgraded over conventional double drum
cleaners to produce silica levels below the required value with a high iron recovery. The
coarse particle stream was floated separately in one flotation bank and also on a bench
scale in the laboratory. The plant flotation results were inconclusive due to the low flow
rate of coarse material being processed. The bench flotation results showed an increase
in flotation weight recovery at a lower chemical addition rate. The results of the plant
testing were used for the design of the Step 3 installation.
Late in 2002, US Steel approved the capital project for the installation of pre-
classification in the Minntac Step 3 concentrator commencing in 2003. The Step 3
concentrator was chosen for the logistics of material handling and issues with the
production of dual products at Minntac. NORAMCO Engineering Corp. of Hibbing, MN

4 of 74
was hired to perform the detailed engineering of the project. Installation occurred in
June-August of 2003.
Startup and testing of the pre-classification cyclones began immediately after the
installation. Much of September, October, and November were used for troubleshooting
mechanical and operating issues with the cyclone circuit. Problems with the design of
the cyclone feed sump and cleaner tailings flows were the two main issues, but both were
resolved by November. Data from the 2001 plant test was used to pick the starting point
for the cyclone testing. The test plan was modified accordingly with each set of results.
After the cyclones were operating properly, flotation of the pre-classified material began
in December. The testing of the pre-classification cyclones and flotation continued
through May 2004. The test period was lengthy due to the operating conditions of the
concentrator. The production of both acid and flux pellets restricted the amount of
flotation testing due to upset conditions in the plant and no control data. At the end of
April, the plant went back to total flux pellet production. This allowed for a rigorous
testing campaign of the flotation plant in May.
5 of 74
PROCESS FLOWSHEET AND EQUIPMENT
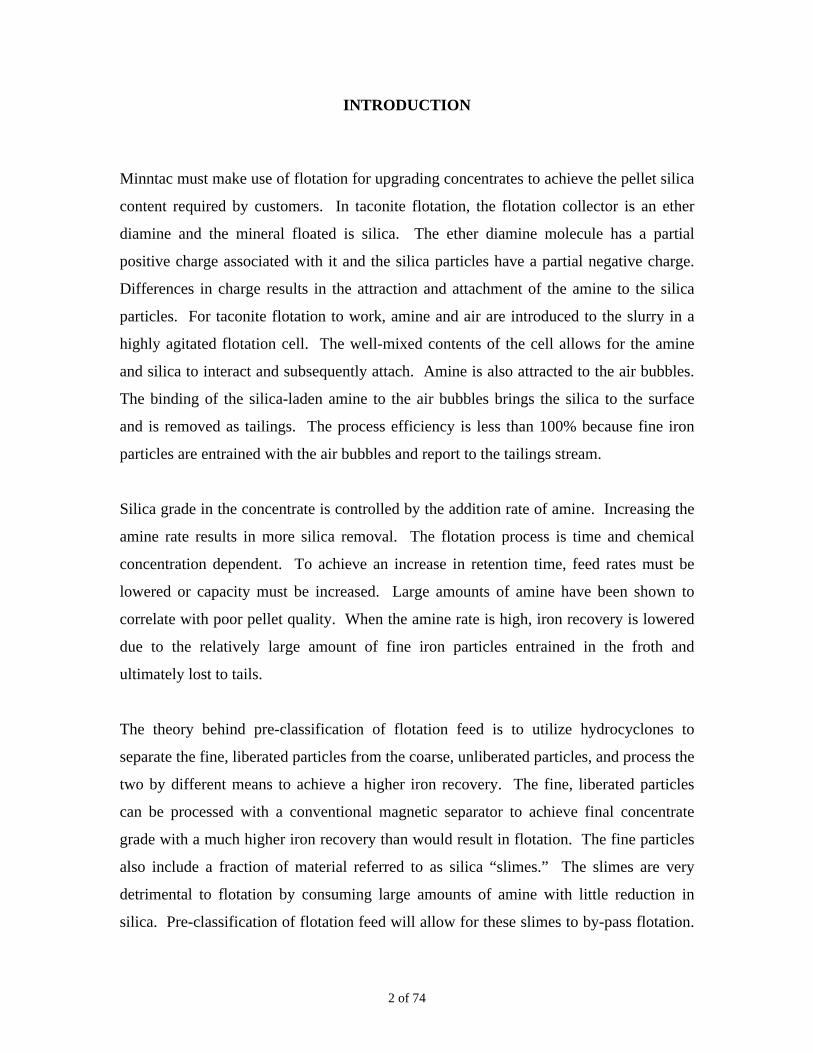
The pre-classification circuit is situated between the grinding lines and the flotation plant
in the Minntac flow sheet. Figure 1 is a detailed diagram of a typical grinding line with a
simplified flotation plant that illustrates how the pre-classification circuit is incorporated
in the concentrating process. The grinding line consists of three stages of grinding with
four stages of magnetic separation and various stages of size classification to produce
feed to the flotation plant. With pre-classification the grinding line remained essentially
the same with the exception of the final stage of magnetic separation.
FIGURE 1
Two grinding lines (1 Section) feed each pre-classification circuit. Figure 2 shows the
pre-classification circuit in detail. The screen undersize from the two grinding lines is
combined in a common sump. The sump is equipped with 2-200hp pumps to feed the
nest of cyclones (one for normal operation and one spare). The pipeline feeding the
cyclones is equipped with a density gauge. Cyclone feed density is controlled by the

6 of 74
pump speed and water valve. Each nest has eight cyclones that are fed by knife gate
valves, which automatically open and close to control the cyclone pressure. The cyclone
overflow is distributed over four sets of double drum cleaners for further upgrading. The
cleaner concentrate reports to a sump and is pumped to another sump at the end of
flotation where the coarse and fine material can be mixed. The cleaner tailings report to
the fine tails thickener. The underflow from the cyclones reports to a sump and is
pumped over to flotation. The pre-classified flotation feed is floated in a separate float
bank from the rest of the flotation material. Finally, the pre-classified flotation
concentrate is mixed with the pre-classified fines and the flotation concentrate from the
rest of the plant in a sump before being pumped to the agglomerator.
FIGURE 2
7 of 74
Operating Conditions
Feed density of the cyclones is controlled at a set point of 29.0%. During normal
operation the density will vary +/- 1.0%. Cyclone pressure is controlled over the range of
14-28 psi. The pressure is measured at the cyclone feed distributor. Both the feed
density and pressure are controlled automatically by the Westinghouse WDPF system.
Cyclone Feed System
A new pumping system was installed on each section to feed the hydrocyclones. Fine
screen undersize launderers were modified to deliver material to the new cyclone feed
sump. The sump is equipped with two GIW LSA 8x10-32.5 pumps (one for normal
operation and one spare). Each pump is rated at 200 hp and is equipped with a variable
frequency drive (VFD). The feed sump is equipped with a sonar head for measuring
sump level. The feed piping to the cyclones is equipped with a density gauge.
Hydrocyclones
Each section has a nest of 8 Warman CAVEX model 400CVX10E hydrocyclones. The
cyclones are 15-inches in diameter. All cyclones operate with a 49mm apex and a
100mm vortex finder. The cyclones are fed by a Warman 8-place radial
cyclone/manifold system. A transducer on the manifold system measures the cyclone
feed pressure. Air actuated knife gate valves on the distributor feed the cyclones.
Magnetic Separators
Four sets of double drum 4x10 cleaners were used for the magnetic upgrading of the
cyclone overflow.
Particle Size Measurement
A multi-line PSI 200 Model 2601 was installed on each section to read the screen
undersize particle size. The screen undersize particle size is necessary for grind control
in each mill line.

8 of 74
Flotation Banks
Each bank consists of 10 500-cubic foot Denver flotation cells in series. The bank is
divided into three sections (4-4-2) by dart valves that control the level in the preceding
section. The amine is added to the flotation bank in the first cell and the fifth cell. A
frother is also added to assist in the flotation process. Manual dampers on a blower
system control air addition to the cells.
Flotation Scavenging Circuit
The tailings from the flotation banks act as feed to the scavenging circuit. The flotation
scavenging circuit consists of 8 single drum 4x10 cleaners, 12-10 inch hydrocyclones,
and 3-flotation columns. The concentrate from the columns is added back to final
concentrate when the proper operating conditions exist. The basic flow sheet for the
scavenging circuit can be seen in Figure 3.
FIGURE 3
FROTHER AMINE
121 SUMPFrom170 SUMPS
FLOAT BANKS
FLOATCOLUMNS
150 CYCLONES 170-01 SUMP126 SUMPS
CONCENTRATE(TO AGGLOMERATOR)
ADDER BOX139 DEWATERS
TAILS
140 SUMP
TAILS

9 of 74
RESULTS AND DISCUSSION
Hydrocyclone Classification
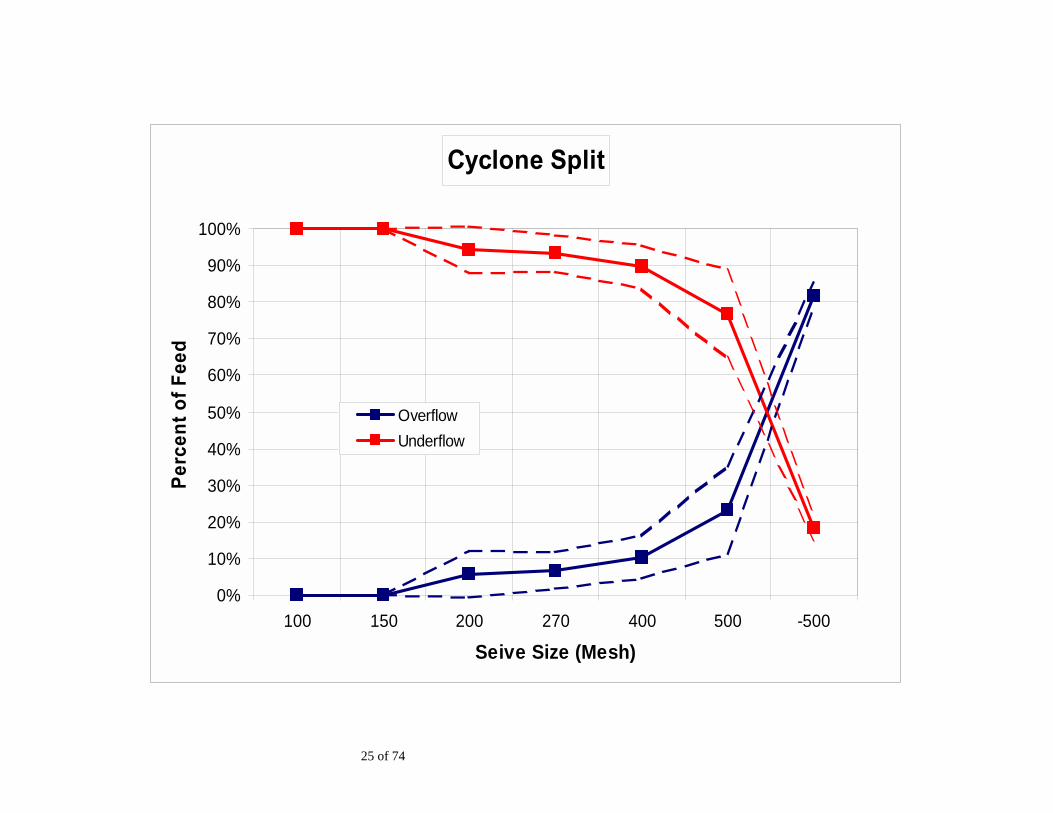
The cyclone results were as predicted from the earlier phases of testing. Results show
49.0% of the material reported to the fine fraction from the cyclones and was easily
upgraded to final concentrate grade with the magnetic separators. The remaining 51.0%
of the material reported to the flotation plant. As discussed before, the benefits from pre-
classification are based upon the fine, liberated material bypassing flotation and the
coarse, non-liberated material reporting to flotation. Therefore, the size split of the
cyclones is very important. The split of the cyclones occurs between the 400 and 500
mesh particles. Only 10.4% of the +400 mesh material in the cyclone feed reports to the
cyclone overflow, while 23.3% of the +500 mesh material and 81.7% of the –500 mesh
material reports to the overflow. Complete size analysis can be seen in the Appendix.
A limited amount of test work was done with density and pressure because the results
duplicated the earlier work. Density testing examined the cyclone performance over a
range of feed solids from 26% to 34%. As seen in the pilot testing, feed density had by
far the largest effect on cyclone performance. The effect of density on various
characteristics of cyclone performance can be seen in graphical form in the Appendix.
The pressure range of the cyclones was also examined, but was limited due to the design
of the circuit. The pressure range of the cyclones was varied from 10 to 30 psi during the
testing.
A majority of the testing focused on the proper operation of the circuit. Samples were
collected during stable and non-stable periods of operation to examine changes in the
product split during upset conditions. Density control was examined closely since it is
the most important variable in achieving the proper cyclone split. The optimum cyclone
feed density was found to be 28-29%. At this percent solids, the cyclones made a clean
size split with a high amount of material in the overflow and cleaner concentrate silica
low enough to be final product. On a daily basis the density control varies +/- 1% from

10 of 74
the set point. During upsets, such as mill charging or line startups, the cyclone feed
density will vary as much as 4% for a period of an hour or two. The operating range of
the cyclone feed pressure is set at 14 to 28 psi. Testing showed the optimum to be in the
low 20’s with little change over the whole test range. Since the cyclones open and close
based on the pressure, the range was set large enough to ensure stable operation could be
achieved.
Magnetic Separators
With the pre-classification cyclones producing the proper split, the cleaner magnetic
separator concentrate averaged 3.71% silica. This is below the required 4.00% silica
required to meet the flux pellet specification. Testing of the cleaner magnetic separators
show an average silica reduction of 0.82%. This compares to the average reduction of
0.80% for the non-pre-classified material. More magnetic iron was lost to tails due to the
extremely low density feeding the cleaners and because much of the material is
exceptionally fine. The magnetic iron recovery of the cleaners dropped by 0.28%. The
low density in the cleaner feed also caused some minor problems in the material handling
of the cleaner tails. The volume of cleaner tails increased slightly, but was enough to tax
the current system. The launderers and pipes that transport the cleaner tails were cleaned
out and the problem was rectified.
Plant Flotation
Extensive flotation testing was performed to compare the performance of the pre-
classified and non-pre-classified material. The setup of the flotation plant allowed for a
head to head comparison in the flotation banks, even through all of the material is
eventually combined in the scavenging circuit. Comparison of flotation bank
performance showed the pre-classified material to have a lower weight recovery (2.90%),
but a much higher silica reduction (0.85%). The amine consumption of the pre-classified
flotation material averaged 21.3% higher but was 14.7% lower on a unit of amine per unit
of silica removed basis. Details can be seen in the Appendix.

11 of 74
Flotation operating conditions were examined to ensure the banks would not sand up with
the coarser material. This concern never became an issue. With less material reporting
to flotation, the density of the flotation feed could be dropped to keep the superficial
velocity through the float bank high enough to prevent sanding. The ability to decrease
the flotation density from the previous operating range of 45-48% solids to 40-42% solids
brought the banks into the optimum range for density. The residence time of the flotation
banks increased even with the flotation feed solids being lower. The increase in
residence time and decrease in solids increased the performance of both the pre-classified
material and the non-pre-classified (control) material. A summary of the flotation bank
testing can be seen in the Appendix.
Addition rate of the amine was adjusted to achieve the proper reduction in silica
assuming the material was combined with the pre-classification cleaner concentrate. The
adjustment was accomplished on a test-by-test basis using the results from the previous
testing as a guide. This adjustment was an inexact science and resulted in both the pre-
classified and control banks being slightly under-dosed or over-dosed. On average, the
pre-classified material required 21.3% more amine, but amine consumption changed from
day-to-day. It is speculated that the reason for this difference is due to the changes in
floatability of the various ore types. Different ores produce a variety of particle shapes
that may not process the same in the pre-classification cyclones. The liberation
characteristics of the various ores will also play a large part in the amine efficiency and
flotation performance.
Recovery Increase
The recovery increase due to the installation of pre-classification in the Step 3
concentrator is from both the pre-classified and non-pre-classified material. A weight
recovery increase of 3.75% was measured on the pre-classified material, whereas the
weight recovery of the non-pre-classified material increased by 0.68%. The increase in
weight recovery of the pre-classified material is because nearly half of the material
reports to the cyclone overflow and is upgraded over cleaner magnetic separators. This

12 of 74
results in a weight recovery of 98.6% compared to being floated at a recovery of 91.1%
before pre-classification was installed.
The increased weight recovery of the non-pre-classified material is the result of lower
flotation feed density, increased flotation retention time, and an increased amount of time
the scavenging flotation concentrate is added back to final concentrate. The lower
flotation feed density and increased retention time are the result of nearly half of the pre-
classified material bypassing the flotation plant. The flotation feed density dropped
nearly 4% while the residence time increase almost 10%. Both of these changes resulted
in better flotation performance. The increase in flotation performance also results in
lower amine rates. The addition of scavenging circuit material is based upon the amine
rate. Prior to pre-classification, addition of scavenging circuit material averaged 64.5%
of the time. Since pre-classification flotation came on line, addition of scavenging circuit
material has averaged 79.6% of the time. The addition of scavenging circuit material
typically increases flotation weight recovery by over 4%.
Chemical Reduction
Almost half of the predicted monetary benefit of pre-classification was from reduction in
flotation chemicals. Based on testing, the reduction in amine, defoamer, and frother
consumption for the total plant is 27.9%, 27.9%, and 20.3% respectively. The amine
reduction is measured from the metering pumps and calculated from the amount of
material reporting to flotation. The defoamer reduction is based strictly upon amine
usage. The defoamer is not metered into the process. It is used on an as needed basis,
but the defoamer usage mirrors that of amine. Since frother is dosed on strictly on the
amount of material reporting to flotation, the amount of reduction is equal to the amount
of fines material bypassing flotation. A majority of the reduction in the amine and
defoamer is the result of nearly half of the pre-classified material bypassing flotation.
About 15% of the reduction is from the increased performance of the non-pre-classified
material due to the lower float feed density and the increased retention time.
13 of 74
Maintenance
Maintenance on the pre-classification circuit has been minimal. Cyclone change-outs
have accrued 120 man-hours in the first eight months of 2004. Cyclone overflow pipe
change outs have accounted for 144 man-hours. During the same time period, the pre-
classification circuits have produced 4,415,736 LT of concentrate. That equates to
16,726 LT of concentrate per maintenance man-hour.
Minimal special maintenance is required for the pre-classification circuits. The wear
parts of the cyclone are changed out as necessary and the cyclone feed pumps will be
overhauled when needed. The instrumentation in the circuit is monitored in the same
manner as the rest of the plant and periodically audited through special sampling.
Energy Requirements
Additional energy requirements of pre-classification are from the cyclone feed pumps.
Each cyclone nest is fed by one 200hp pump equipped with a VFD. At average operating
time and pump speed each 200hp pump will consume 3,300 KWH/Day. During the first
eight months of 2004, the pre-classification circuits have produced 4,415,736 LT of
concentrate. That equates to 0.547 kwh/LT of concentrate.

14 of 74
CONCLUSION
The installation of hydrocyclones in Step 3 of the Minntac concentrator to classify the
flotation feed was a success. Weight recovery of the pre-classified Step 3 material
increased by 3.75% while the weight recovery Step 1&2 non-pre-classified material also
increased by 0.68%. The result was a 1.95% increase in weight recovery for the total
concentrator, or a 4.71% increase when normalized to the Step 3 production. A majority
of the recovery increase is possible because 81.7% of the –500 mesh material is
bypassing flotation and being upgraded over conventional magnetic separators. Prior to
the installation of pre-classification the –500 mesh material accounted for over 80% of
the iron losses in flotation. The rest of the recovery increase is from lower flotation feed
density and more residence time in the flotation banks. These two reasons increased the
flotation performance of both the pre-classified material and the non-pre-classified
material. Flotation chemical consumption was decreased by 23.57% for the total plant
based on annual flotation chemical spending. The removal of the silica slimes from the
flotation feed stream, lower flotation feed density, and increased float bank residence
time all resulted in higher amine efficiency and lower flotation chemical rates.

15 of 74
APPENDIX
Page(s)
Table 1 – Cyclone Stream Data Summary 17
Table 2 – Cyclone Stream Size Summary 17
Table 3 – Cyclone Size Recovery Summary 17
Table 4 – Flotation Lab Sampling and Performance Summary 18
Table 5 –Flotation Bank Process Value Summary 18
Table 6 – Pre-Classification Flotation Stream Size Summary 18
Table 7 – Control Flotation Stream Size Summary 18
Process Flow Sheet Prior to Pre-classification 19
Process Flow Sheet for Step 3 Pre-classification 20
Process Flow Sheet for Steps 1&2 with Step 3 Pre-classification 21
Graph – Cyclone Split – Weight Recovery to Overflow 22
Graph – Cyclone Split – -270 Mesh in Overflow 23
Graph – Cyclone Split – -500 Mesh in Overflow 24
Graph – Cyclone Split – Split of Feed 25
Graph – Flotation Performance 26
Cyclone Operating Data 27-29
Cyclone Feed Data 30-32
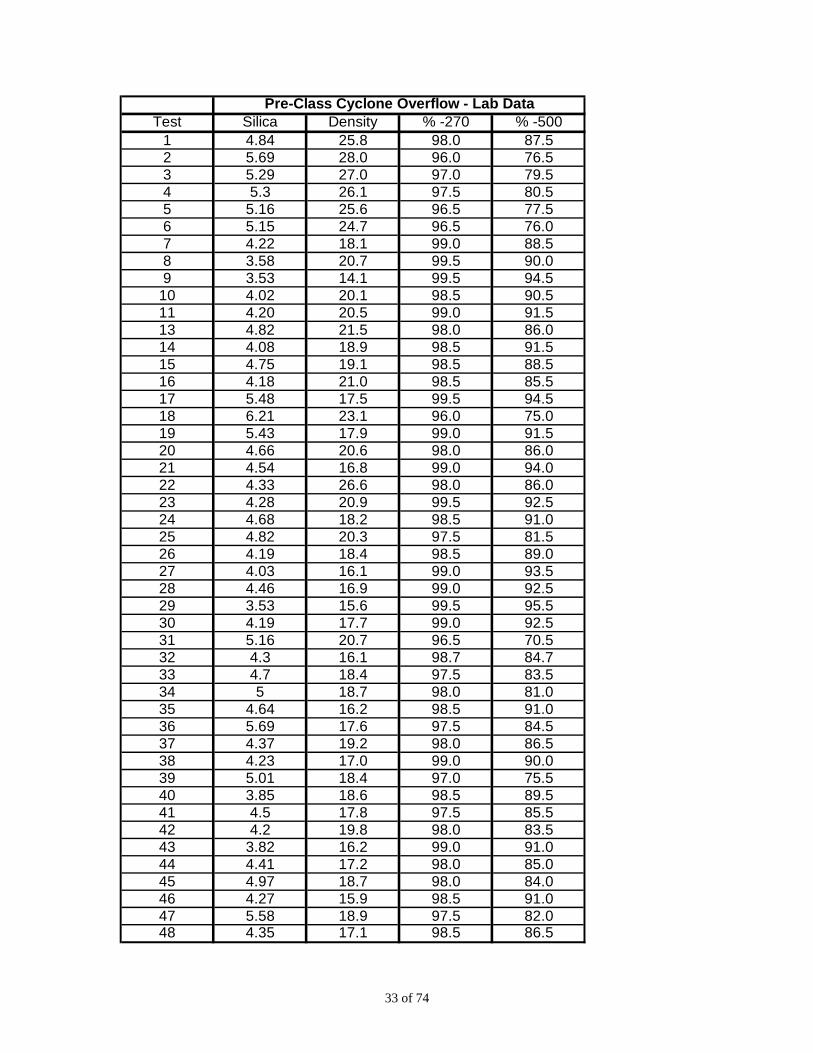
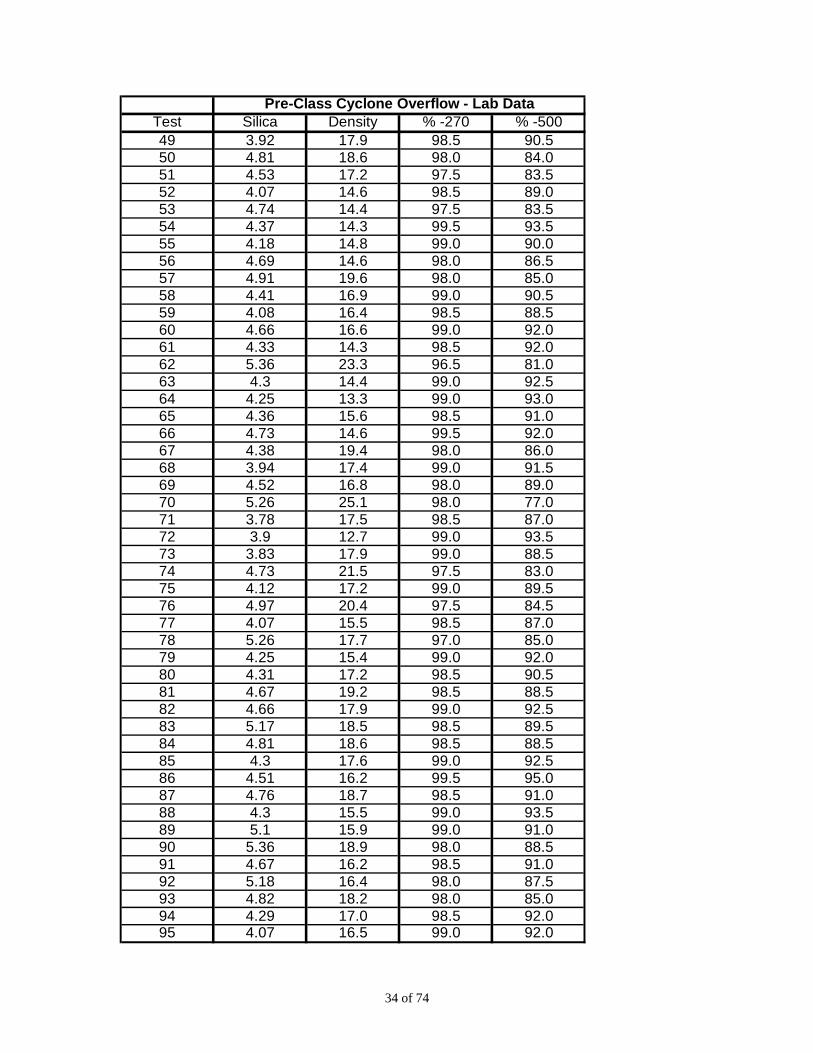
Cyclone Overflow Data 33-35
Cyclone Underflow Data 36-38
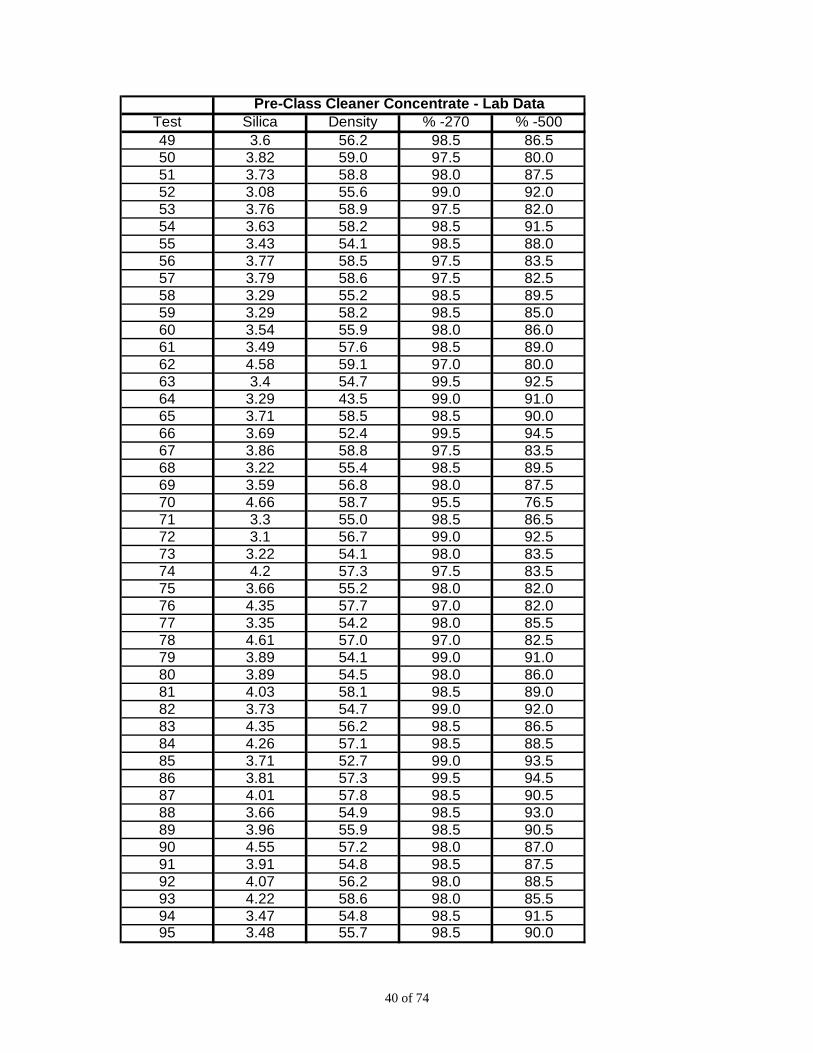
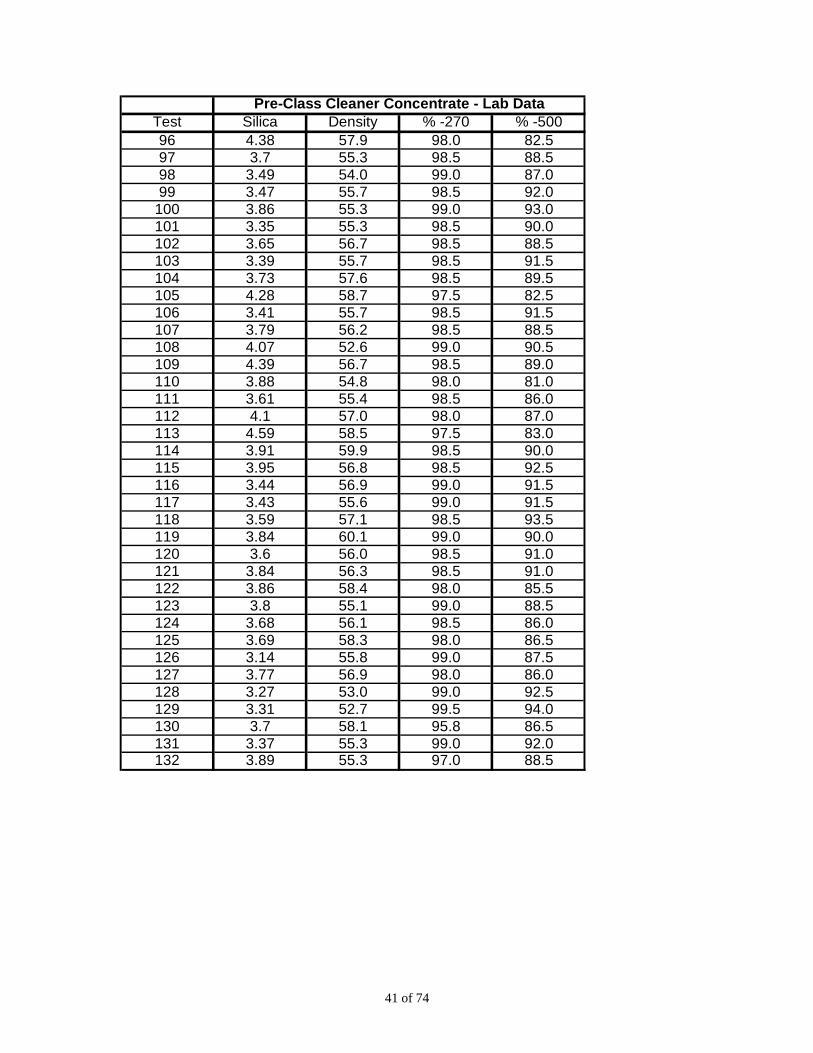
Cleaner Concentrate Data 39-41
Cyclone Split Data 42-44
Cyclone Feed Size Data 45-47
Cyclone Overflow Size Data 48-50
Cyclone Underflow Size Data 51-53
Size Split – Recover to Overflow 54-56
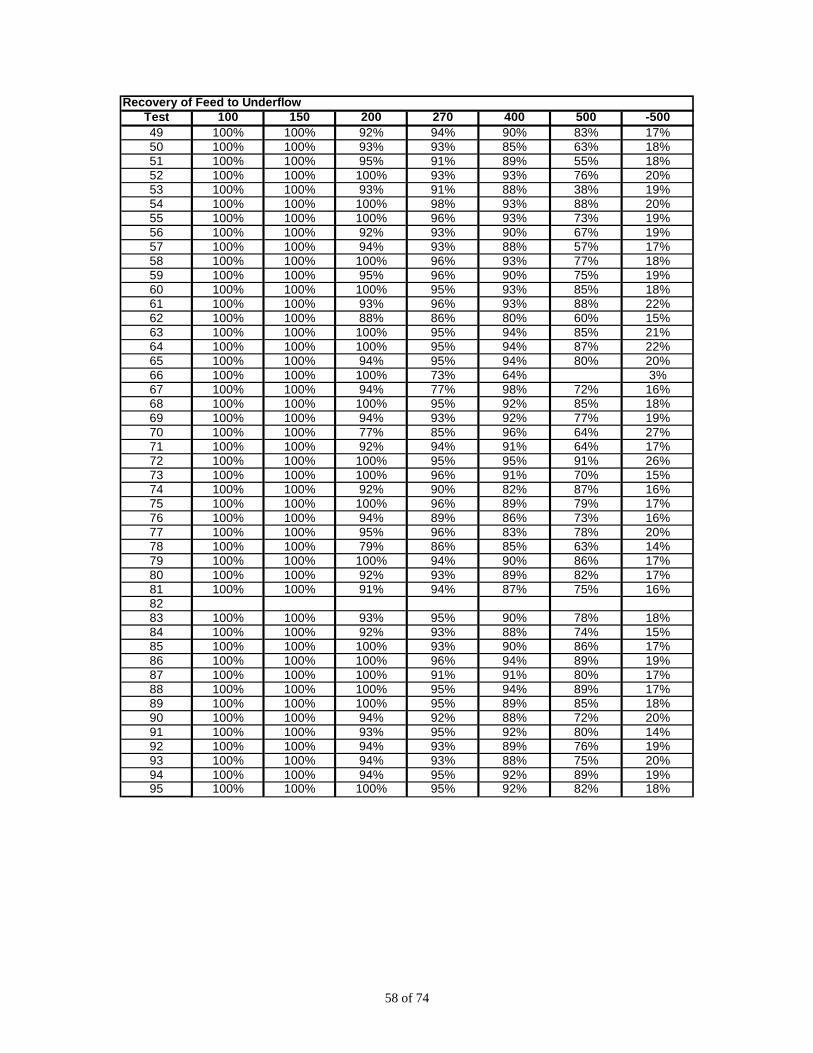
Size Split – Recovery to Underflow 57-59
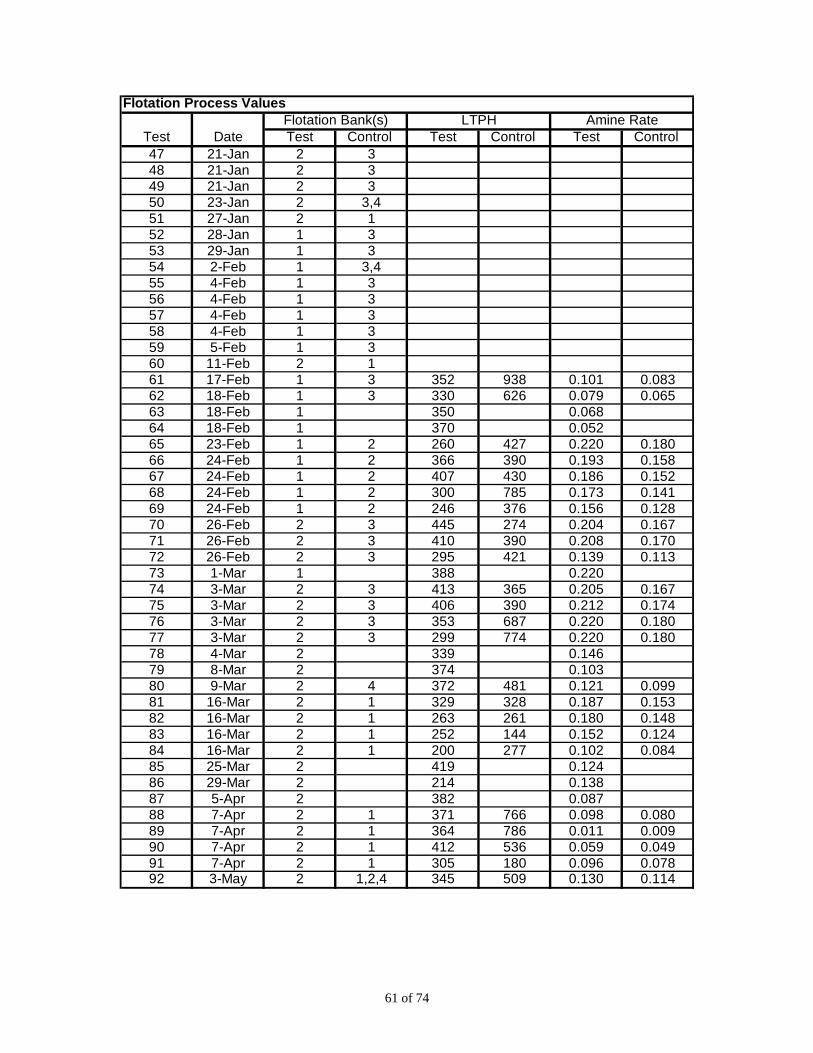
Flotation Operating Data 60-62

16 of 74
APPENDIX
Page(s)
Test Bank Performance Data 63-65
Control Bank Performance Data 66-68
Pre-classification Flotation Bank Feed Size Data 69
Pre-classification Flotation Bank Concentrate Size Data 70
Pre-classification Flotation Bank Tails Size Data 71
Control Flotation Bank Feed Size Data 72
Control Flotation Bank Concentrate Size Data 73
Control Flotation Bank Tails Size Data 74

17 of 74
Table 1 – Cyclone Stream Data Summary
Table 2 – Cyclone Stream Size Summary
Table 3 – Cyclone Size Recovery Summary
Silica Density % -270 Mesh % -500 MeshAverage 5.84 28.13 84.92 54.63STDEV 0.42 1.64 2.09 3.75Average 4.53 17.04 98.58 89.54STDEV 0.44 1.94 0.60 3.88Average 7.04 76.26 71.80 20.01STDEV 0.71 1.53 3.00 2.09Average 3.71 56.39 98.40 88.01STDEV 0.36 2.14 0.64 3.91Average 48.86% 48.85% 48.67% 49.59%STDEV 3.70% 3.34% 3.55% 3.22%
Recovery to Overflow
Summary of Laboratory Sampling for Pre-Class Cyclones
Cyclone FeedCyclone OverflowCyclone UnderflowCleaner Concentrate
100 150 200 270 400 500Average 99.68% 98.94% 95.43% 85.11% 68.76% 54.79%STDEV 0.25% 0.38% 0.99% 2.36% 3.61% 4.17%Average 100.00% 100.00% 99.64% 98.39% 95.25% 88.46%STDEV 0.00% 0.00% 0.32% 0.85% 1.97% 4.87%Average 66.92% 99.44% 98.10% 91.72% 72.00% 41.44%STDEV 38.10% 0.33% 0.61% 1.60% 4.12% 3.84%
Summary of Pre-Classification Cyclone Stream Size Distributions - Percent Passing Mesh Size
Cyclone FeedCyclone OverflowCyclone Underflow
100 150 200 270 400 500 -500Average 0.0% 0.0% 5.6% 6.8% 10.4% 23.3% 81.7%STDEV 0.0% 0.0% 6.3% 5.0% 5.8% 12.2% 3.3%Average 100.0% 100.0% 94.4% 93.2% 89.6% 76.7% 18.3%STDEV 0.0% 0.0% 6.3% 5.0% 5.8% 12.2% 3.3%
Recovery to Cyclone OverflowRecovery to Cyclone Underflow
Summary of Weight of Cyclone Feed Stream

18 of 74
Table 4 – Flotation Lab Sampling and Performance Summary
Table 5 – Flotation Bank Process Value Summary
Table 6 – Pre-Classification Flotation Stream Size Summary
Table 7 – Control Flotation Stream Size Summary
Bank Feed LTPH Amine RateAverage 329 0.156STDEV 64 0.045Average 434 0.129STDEV 169 0.034
Control Flotation
Summary of Flotaiton Bank Process Values
Pre-Class Flotation
100 150 200 270 400 500Average 99.52% 98.38% 91.68% 71.32% 42.09% 20.42%STDEV 0.09% 0.25% 0.75% 1.86% 2.35% 2.05%Average 99.45% 98.30% 92.64% 71.03% 38.64% 17.79%STDEV 0.26% 0.41% 0.99% 2.28% 2.50% 2.08%Average 99.65% 98.11% 85.94% 64.62% 48.39% 37.18%STDEV 0.23% 0.41% 1.47% 2.85% 3.29% 3.91%
Summary of Pre-Classification Flotation Stream Size Distributions - Percent Passing Mesh Size
Flotation Bank FeedFlotation Bank Flotation Bank Tails
100 150 200 270 400 500Average 99.77% 99.20% 95.45% 83.73% 66.86% 53.77%STDEV 0.25% 0.34% 0.87% 2.05% 1.90% 1.82%Average 99.75% 99.16% 95.66% 84.57% 66.46% 50.36%STDEV 0.25% 0.33% 0.95% 2.32% 3.02% 3.08%Average 99.96% 99.22% 94.04% 84.59% 75.69% 68.87%STDEV 0.13% 0.35% 1.30% 2.40% 2.68% 2.91%
Summary of Control Flotation Stream Size Distributions - Percent Passing Mesh Size
Flotation Bank FeedFlotation Bank Flotation Bank Tails
Silica Solids Silica Solids Silica Solids7.10 40.89 4.11 44.14 22.36 15.00 2.99 83.24%0.79 4.33 0.80 8.27 2.46 3.73 1.23 7.81%5.49 33.60 3.35 39.26 16.15 15.32 2.14 80.34%0.44 8.37 0.61 9.49 3.90 4.73 0.68 12.94%
Float Tails Silica Upgrade
Weight Recovery
Pre-Class Flotation Control Flotation
Summary of Flotation Lab Samping and PerformanceFloat Feed Float Con

19 of 74
Process Flow Sheet Prior to Pre-classification
Screen Undersize/Cleaner Feed Cleaner Tails
6.29 100.00% 76.92 1.12%64.64 100.00% 5.06 1.12%
Cleaner Concentrate/Flotation Bank Feed Flotation Bank Tails/Scavenging Feed Scavenging Flotation Tails
5.49 98.88% 18.15 10.78% 27.04 57.98%65.31 98.88% 54.63 10.66% 46.83 6.18%
Flotation Bank Concentrate Scavenging Flotation Concentrate
3.96 89.22% 5.40 42.02%66.60 88.22% 65.39 4.48%
LEGEND
Final Float Concentrate Adder BoxTails
4.01 - 64.5% 35.5%66.56 91.11%
Silica
MagFe
Unit Weight Recovery
Cumulative Weight

20 of 74
Process Flow Sheet for Step 3 Pre-classification
Screen Undersize/Cycone Feed Cyclone Underflow/Float Bank Feed Float Bank Tails/Scavenging Feed Scavenging Tails
5.84 100.00% 7.04 51.04% 26.66 12.33% 38.55 63.26%65.02 100.00% 64.00 51.04% 47.45 6.29% 37.43 3.98%
Cleaner Tails Cyclone Overflow/Cleaner Feed Flotation Bank Concentrate Scavenging Flotation Concentrate
62.28 1.40% 4.53 48.96% 4.28 87.67% 6.20 36.74%17.41 0.69% 66.12 48.96% 66.33 44.75% 64.71 2.31%
Cleaner Concentrate Total Flotation Concentrate
3.71 98.60% 4.36 79.6%66.81 48.27% 66.27 46.59% Tails
20.4%
Total ConcentrateLEGEND
4.0366.55 94.86%
Adder Box
Silica Unit Weight Recovery
MagFe Cumulative Weight Recovery

21 of 74
Process Flow Sheet for Steps 1&2 with Step 3 Pre-classification
Screen Undersize/Cleaner Feed Cleaner Tails
6.29 100.00% 76.92 1.12%64.64 100.00% 5.06 1.12%
Cleaner Concentrate/Flotation Bank Feed Flotation Bank Tails/Scavenging Feed Scavenging Flotation Tails
5.49 98.88% 18.15 10.78% 27.40 57.98%65.31 98.88% 54.63 10.66% 46.93 6.18%
Flotation Bank Concentrate Scavenging Flotation Concentrate
3.96 89.22% 5.40 42.02%66.6 88.22% 65.39 4.48%
LEGEND
Final Float Concentrate Adder BoxTails
4.02 - 79.6% 20.4%66.55 91.79%
Silica Unit Weight Recovery
MagFe Cumulative Weight Recovery

22 of 74
y = 0.001x2 - 0.052x + 1.144R2 = 0.407
40%
45%
50%
55%
60%
65%
20 25 30 35 40
Feed Density (Percent Solids by Wt)

23 of 74
y = -0.013x2 + 0.591x + 91.973R2 = 0.332
95.0
95.5
96.0
96.5
97.0
97.5
98.0
98.5
99.0
99.5
100.0
20 25 30 35 40
Feed Density (Percent Solids by Wt)

24 of 74
y = -0.078x2 + 3.626x + 49.654R2 = 0.345
65
70
75
80
85
90
95
100
20 25 30 35 40
Feed Density (Percent Solids by Wt)
25 of 74
0%
10%
20%
30%
40%
50%
60%
70%
80%
90%
100%
100 150 200 270 400 500 -500
Seive Size (Mesh)
OverflowUnderflow

26 of 74
y = -0.002x2 - 0.049x + 1.000R2 = 0.910
y = -0.031x2 - 0.017x + 1.000R2 = 0.695
20%
30%
40%
50%
60%
70%
80%
90%
100%
0.0 1.0 2.0 3.0 4.0 5.0 6.0 7.0 8.0
d SiO2
Pre-ClassControl2003

27 of 74
Test Date Section Lines Density Cyclones Pressure1 18-Aug 13 13,14 34 4 222 19-Aug 13 13,14 36 33 19-Aug 13 13,14 35 24 19-Aug 13 13,14 34 45 20-Aug 13 13 35 2 206 20-Aug 13 13 35 3 87 20-Aug 13 13 30 2 278 20-Aug 13 13 30 3 109 20-Aug 13 13 25 3 21
10 22-Aug 13 13 30 3 1211 22-Aug 13 13 32 2 2713 25-Aug 13 13,14 30 5 1614 27-Aug 15 15,16 32 4 2915 29-Aug 13 13,14 29 5 1716 29-Sep 13 13,14 31 5 917 29-Sep 15 15,16 31 5 2018 1-Oct 13 13,14 31 4 2019 1-Oct 15 15,16 30 5 1720 2-Oct 13 13,14 30 4 2121 2-Oct 15 15,16 30 5 2122 3-Oct 13 13,14 31 4 2223 3-Oct 15 15,16 30 5 2124 3-Oct 17 17,18 30 5 2125 6-Oct 13 13,14 30 4 1726 8-Oct 13 13,14 30 5 2527 8-Oct 15 15,16 30 5 2128 8-Oct 17 17,18 31 5 2129 9-Oct 15 15,16 30 5 1830 9-Oct 17 17,18 32 5 1731 30-Oct 13 13,14 30 2 2232 30-Oct 15 15,16 30 5 2033 30-Oct 17 17,18 31 5 1834 31-Oct 13 13,14 30 4 2435 31-Oct 15 15,16 30 5 1836 31-Oct 17 17,18 28 5 1737 3-Nov 13 13,14 30 4 2038 3-Nov 15 15,16 29 5 1939 3-Nov 17 17,18 29 5 1840 4-Nov 13 13,14 29 4 2241 4-Nov 17 17,18 29 5 1942 5-Nov 13 13,14 29 4 2743 5-Nov 15 15,16 29 5 2444 5-Nov 17 17,18 30 5 2145 6-Nov 13 13,14 28 4 2446 6-Nov 15 15,16 30 5 2047 6-Nov 17 17,18 31 5 1748 11-Nov 13 13,14 28 5 18
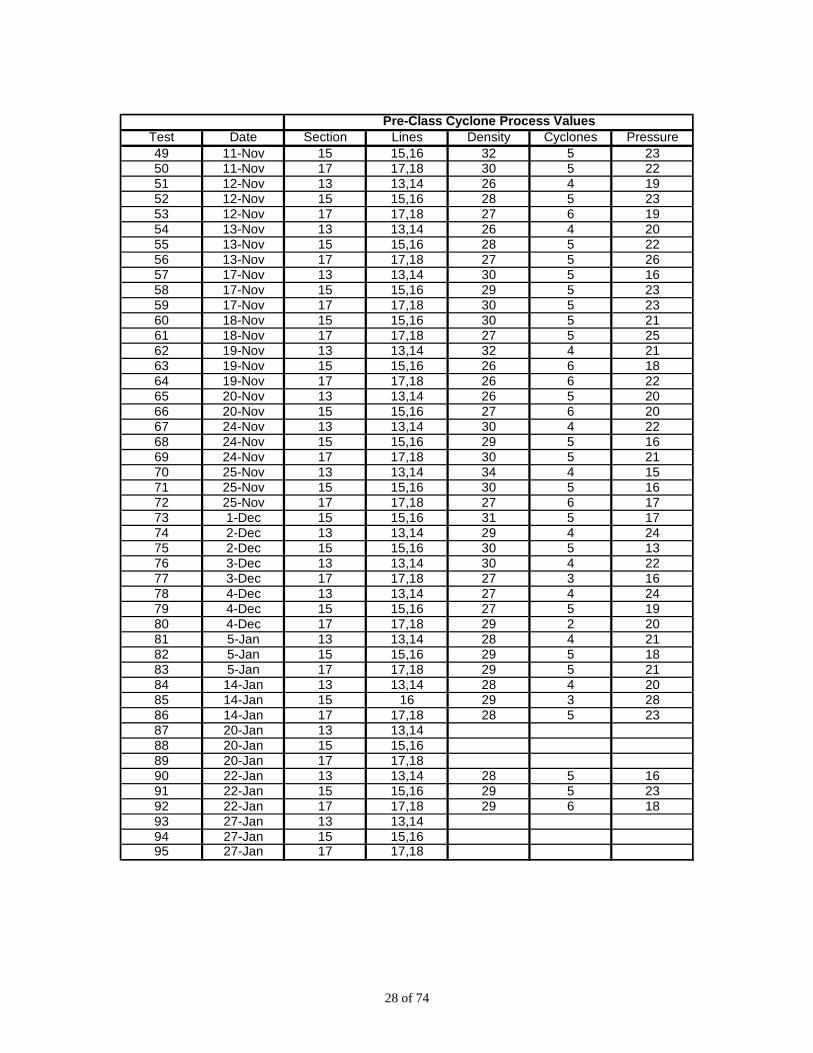
Pre-Class Cyclone Process Values
28 of 74
Test Date Section Lines Density Cyclones Pressure49 11-Nov 15 15,16 32 5 2350 11-Nov 17 17,18 30 5 2251 12-Nov 13 13,14 26 4 1952 12-Nov 15 15,16 28 5 2353 12-Nov 17 17,18 27 6 1954 13-Nov 13 13,14 26 4 2055 13-Nov 15 15,16 28 5 2256 13-Nov 17 17,18 27 5 2657 17-Nov 13 13,14 30 5 1658 17-Nov 15 15,16 29 5 2359 17-Nov 17 17,18 30 5 2360 18-Nov 15 15,16 30 5 2161 18-Nov 17 17,18 27 5 2562 19-Nov 13 13,14 32 4 2163 19-Nov 15 15,16 26 6 1864 19-Nov 17 17,18 26 6 2265 20-Nov 13 13,14 26 5 2066 20-Nov 15 15,16 27 6 2067 24-Nov 13 13,14 30 4 2268 24-Nov 15 15,16 29 5 1669 24-Nov 17 17,18 30 5 2170 25-Nov 13 13,14 34 4 1571 25-Nov 15 15,16 30 5 1672 25-Nov 17 17,18 27 6 1773 1-Dec 15 15,16 31 5 1774 2-Dec 13 13,14 29 4 2475 2-Dec 15 15,16 30 5 1376 3-Dec 13 13,14 30 4 2277 3-Dec 17 17,18 27 3 1678 4-Dec 13 13,14 27 4 2479 4-Dec 15 15,16 27 5 1980 4-Dec 17 17,18 29 2 2081 5-Jan 13 13,14 28 4 2182 5-Jan 15 15,16 29 5 1883 5-Jan 17 17,18 29 5 2184 14-Jan 13 13,14 28 4 2085 14-Jan 15 16 29 3 2886 14-Jan 17 17,18 28 5 2387 20-Jan 13 13,1488 20-Jan 15 15,1689 20-Jan 17 17,1890 22-Jan 13 13,14 28 5 1691 22-Jan 15 15,16 29 5 2392 22-Jan 17 17,18 29 6 1893 27-Jan 13 13,1494 27-Jan 15 15,1695 27-Jan 17 17,18
Pre-Class Cyclone Process Values

29 of 74
Test Date Section Lines Density Cyclones Pressure96 28-Jan 13 13,1497 28-Jan 15 15,1698 28-Jan 17 17,1899 2-Feb 15 15,16
100 2-Feb 17 17,18101 5-Feb 15 15,16102 5-Feb 17 17,18103 6-Feb 15 15,16104 6-Feb 17 17,18105 9-Feb 13 13,14106 9-Feb 15 15,16107 9-Feb 17 17,18108 23-Feb 15 15,16 29 6 21109 23-Feb 17 17,18 30 6 18110 1-Mar 13 13,14 28 5 20111 1-Mar 15 15,16 30 6 17112 1-Mar 17 17,18 29 6 18113 4-Mar 13 13,14 32 4 22114 4-Mar 15 15,16 27 4 14115 4-Mar 17 17,18 29 6 17116 8-Mar 13 14 27 2 33117 8-Mar 15 15,16 29 6 21118 8-Mar 17 17,18 29 6 17119 9-Mar 13 14 28 3 13120 9-Mar 15 15,16 30 6 19121 9-Mar 17 17,18 28 6 16122 17-Mar 13 13,14 28 5 18123 17-Mar 15 16 30 3 15124 22-Mar 15 15,16 29 5 25125 29-Mar 13 13,14 29 4 17126 29-Mar 15 15 28 3 18127 31-Mar 13 13,14 28 5 18128 31-Mar 15 15,16 29 5 24129 31-Mar 17 18 29 2 11130 5-Apr 13 13,14 28 5 19131 5-Apr 15 15,16 29 5 23132 5-Apr 17 17,18 32 4 21
Pre-Class Cyclone Process Values

30 of 74
Test Silica Density % -270 % -5001 5.04 34.7 92.0 62.52 5.47 37.3 87.5 58.03 5.39 36.9 89.0 59.04 5.41 35.6 89.0 59.05 5.33 34.6 84.0 54.06 5.32 34.7 84.0 53.57 5.29 30.9 84.0 54.08 4.38 30.8 91.5 61.59 4.46 24.2 89.5 60.0
10 4.71 31.0 86.5 55.511 4.87 33.5 86.0 55.013 5.34 33.2 85.5 54.514 5.09 32.7 84.5 53.515 5.40 31.7 84.0 52.516 5.22 31.6 88.5 56.517 6.17 29.3 85.5 54.518 7.24 34.3 80.0 49.519 7.08 29.6 86.5 55.020 5.63 31.2 86.5 53.521 6.05 28.9 85.5 54.522 5.38 29.9 83.0 52.023 5.72 29.2 83.0 52.524 6.29 29.7 83.0 51.525 5.68 30.8 87.0 53.026 5.57 29.1 83.0 52.027 5.65 28.7 83.0 53.028 5.86 28.6 83.5 52.529 5.32 27.2 88.0 56.030 5.62 30.1 87.0 54.531 5.95 30.7 83.5 51.032 6.39 28.6 84.0 50.533 4.89 28.5 85.5 52.034 6.4 30.2 79.5 50.035 6.65 28.9 80.5 47.536 5.07 27.6 92.5 74.037 5.69 29.4 86.0 54.038 6.13 28.9 81.5 52.039 6.06 28.8 83.0 54.040 5.31 30.0 84.5 54.041 5.53 27.9 86.0 55.042 5.14 29.8 83.0 53.543 5.4 28.4 81.0 50.544 5.42 28.1 84.5 54.545 6.18 29.0 83.0 54.046 6.2 27.4 85.5 54.547 6.4 29.0 87.0 56.548 5.44 28.0 83.5 53.5
Pre-Class Cyclone Feed - Lab Data

31 of 74
Test Silica Density % -270 % -50049 5.45 31.5 87.0 56.550 5.61 27.9 85.0 54.551 5.77 28.4 83.5 52.552 5.9 26.2 84.0 52.553 6.08 25.3 84.5 55.054 5.96 25.1 85.0 55.555 6.14 26.3 84.5 53.556 6.22 25.1 86.0 54.557 5.66 31.1 83.0 53.058 5.8 29.6 84.0 53.559 5.46 28.3 83.0 52.060 6.3 28.9 83.5 53.061 6.09 26.4 84.5 53.562 5.65 33.7 84.0 54.063 5.86 25.8 85.5 54.564 5.75 24.8 85.5 54.565 6.09 26.6 86.0 55.066 6.64 24.5 96.0 84.267 5.65 31.0 82.0 52.568 5.6 28.3 84.0 53.569 5.9 28.3 83.0 52.570 5.81 35.1 84.5 43.571 5.55 28.6 86.5 55.572 5.79 22.9 86.5 54.573 5.03 28.8 82.5 52.074 5.43 30.8 84.5 54.075 5.53 28.3 83.5 54.076 5.8 31.1 84.5 55.077 5.34 25.0 82.5 53.078 6.34 27.6 88.0 59.079 6.01 25.7 86.5 56.580 5.92 25.9 88.5 58.581 5.78 30.2 86.5 57.58283 6.38 28.6 85.0 55.584 6.26 28.6 87.0 58.585 6.28 27.7 89.0 59.586 6.36 26.0 89.5 61.587 5.71 28.8 87.5 58.088 6.06 26.4 84.5 54.089 6.37 27.0 86.0 55.590 6.29 28.6 86.5 55.091 6.11 27.8 85.5 56.092 6.2 27.1 85.5 54.593 5.91 29.8 84.0 52.094 6.03 27.4 85.5 55.095 5.77 27.7 85.0 55.5
Pre-Class Cyclone Feed - Lab Data

32 of 74
Test Silica Density % -270 % -50096 6.24 83.0 54.597 6.25 84.0 52.598 5.75 86.5 58.099 5.76 28.2 84.5 54.5
100 6.3 27.3 86.5 56.0101 5.93 27.1 83.0 53.5102 6.15 27.0 86.0 56.5103 5.82 28.2 84.5 53.5104 6.25 27.0 86.5 56.0105 5.74 28.5 84.5 42.0106 5.97 27.3 85.0 53.5107 6.41 26.9 87.5 57.0108 6.4 27.6 85.5 55.0109 6.86 27.7 86.0 57.0110 5.47 28.7 85.0 54.5111 5.58 28.5 83.0 51.5112 6 27.3 85.5 56.5113 5.82 32.7 83.0 54.0114 6.01 29.3 82.5 52.5115 6.12 26.0 86.5 56.0116 5.22 30.0 85.0 55.5117 5.32 28.0 82.0 52.0118 5.68 27.4 85.0 55.0119 5.76 28.1 84.0 56.5120 5.67 28.6 83.0 53.5121 6.13 27.1 86.0 57.0122 4.99 28.9 83.5 52.0123 5.5 28.5 86.0 54.0124 6.04 28.7 83.5 52.5125 5.21 28.7 84.5 55.5126 5.61 27.0 83.5 54.0127 5.14 28.5 84.5 56.5128 5.21 27.3 84.0 55.5129 6.29 25.7 85.5 57.5130 5.09 28.9 84.0 54.5131 5.36 28.4 84.5 54.5132 5.73 29.9 85.5 54.5
Pre-Class Cyclone Feed - Lab Data
33 of 74
Test Silica Density % -270 % -5001 4.84 25.8 98.0 87.52 5.69 28.0 96.0 76.53 5.29 27.0 97.0 79.54 5.3 26.1 97.5 80.55 5.16 25.6 96.5 77.56 5.15 24.7 96.5 76.07 4.22 18.1 99.0 88.58 3.58 20.7 99.5 90.09 3.53 14.1 99.5 94.5
10 4.02 20.1 98.5 90.511 4.20 20.5 99.0 91.513 4.82 21.5 98.0 86.014 4.08 18.9 98.5 91.515 4.75 19.1 98.5 88.516 4.18 21.0 98.5 85.517 5.48 17.5 99.5 94.518 6.21 23.1 96.0 75.019 5.43 17.9 99.0 91.520 4.66 20.6 98.0 86.021 4.54 16.8 99.0 94.022 4.33 26.6 98.0 86.023 4.28 20.9 99.5 92.524 4.68 18.2 98.5 91.025 4.82 20.3 97.5 81.526 4.19 18.4 98.5 89.027 4.03 16.1 99.0 93.528 4.46 16.9 99.0 92.529 3.53 15.6 99.5 95.530 4.19 17.7 99.0 92.531 5.16 20.7 96.5 70.532 4.3 16.1 98.7 84.733 4.7 18.4 97.5 83.534 5 18.7 98.0 81.035 4.64 16.2 98.5 91.036 5.69 17.6 97.5 84.537 4.37 19.2 98.0 86.538 4.23 17.0 99.0 90.039 5.01 18.4 97.0 75.540 3.85 18.6 98.5 89.541 4.5 17.8 97.5 85.542 4.2 19.8 98.0 83.543 3.82 16.2 99.0 91.044 4.41 17.2 98.0 85.045 4.97 18.7 98.0 84.046 4.27 15.9 98.5 91.047 5.58 18.9 97.5 82.048 4.35 17.1 98.5 86.5
Pre-Class Cyclone Overflow - Lab Data
34 of 74
Test Silica Density % -270 % -50049 3.92 17.9 98.5 90.550 4.81 18.6 98.0 84.051 4.53 17.2 97.5 83.552 4.07 14.6 98.5 89.053 4.74 14.4 97.5 83.554 4.37 14.3 99.5 93.555 4.18 14.8 99.0 90.056 4.69 14.6 98.0 86.557 4.91 19.6 98.0 85.058 4.41 16.9 99.0 90.559 4.08 16.4 98.5 88.560 4.66 16.6 99.0 92.061 4.33 14.3 98.5 92.062 5.36 23.3 96.5 81.063 4.3 14.4 99.0 92.564 4.25 13.3 99.0 93.065 4.36 15.6 98.5 91.066 4.73 14.6 99.5 92.067 4.38 19.4 98.0 86.068 3.94 17.4 99.0 91.569 4.52 16.8 98.0 89.070 5.26 25.1 98.0 77.071 3.78 17.5 98.5 87.072 3.9 12.7 99.0 93.573 3.83 17.9 99.0 88.574 4.73 21.5 97.5 83.075 4.12 17.2 99.0 89.576 4.97 20.4 97.5 84.577 4.07 15.5 98.5 87.078 5.26 17.7 97.0 85.079 4.25 15.4 99.0 92.080 4.31 17.2 98.5 90.581 4.67 19.2 98.5 88.582 4.66 17.9 99.0 92.583 5.17 18.5 98.5 89.584 4.81 18.6 98.5 88.585 4.3 17.6 99.0 92.586 4.51 16.2 99.5 95.087 4.76 18.7 98.5 91.088 4.3 15.5 99.0 93.589 5.1 15.9 99.0 91.090 5.36 18.9 98.0 88.591 4.67 16.2 98.5 91.092 5.18 16.4 98.0 87.593 4.82 18.2 98.0 85.094 4.29 17.0 98.5 92.095 4.07 16.5 99.0 92.0
Pre-Class Cyclone Overflow - Lab Data

35 of 74
Test Silica Density % -270 % -50096 5.28 26.3 98.0 83.597 4.41 25.9 98.5 88.098 4.04 25.6 98.5 88.599 4.11 15.3 99.0 93.5
100 5.01 16.4 99.0 93.0101 4.64 15.2 99.0 92.0102 4.99 16.6 98.5 90.0103 4.32 15.6 98.5 91.5104 5.04 16.2 98.5 90.0105 4.89 17.7 97.5 83.5106 4.35 15.7 99.0 92.5107 4.93 15.4 98.5 92.0108 5.04 16.4 99.0 91.0109 6.02 16.6 98.5 92.0110 4.63 17.8 98.0 85.5111 4.4 16.7 98.5 87.0112 5.32 16.2 98.5 89.5113 5.61 21.8 97.0 83.5114 5.15 17.9 98.0 88.0115 4.96 15.7 99.5 95.0116 4.31 17.3 99.0 93.5117 4.41 16.1 98.5 91.0118 4.82 14.7 99.5 95.5119 4.73 16.1 99.0 91.5120 4.55 16.1 99.0 91.5121 5.19 15.6 99.5 94.5122 4.39 18.3 98.0 86.0123 4.79 17.4 98.5 90.0124 4.58 16.1 99.0 90.5125 4.47 19.0 98.0 85.0126 3.87 15.1 99.5 94.5127 4.4 17.0 98.0 88.5128 4.01 16.3 99.0 93.0129 4.26 14.9 99.5 96.0130 4.41 18.1 98.5 85.5131 4.15 16.1 99.5 93.5132 4.26 16.9 99.5 95.0
Pre-Class Cyclone Overflow - Lab Data

36 of 74
Test Silica Density % -270 % -5001 5.23 78.1 82.5 24.02 5.16 76.9 72.0 23.53 5.19 79.2 74.5 22.04 5.55 73.1 78.0 27.05 5.47 78.4 67.0 21.56 5.38 72.4 69.5 28.57 5.93 78.2 71.5 21.58 5.25 72.0 83.0 28.59 5.23 76.7 80.0 28.0
10 5.46 76.2 74.5 19.511 5.43 77.8 73.0 17.513 5.82 76.4 70.5 21.014 6.08 79.1 70.5 22.515 6.08 76.1 70.5 19.016 6.33 71.4 78.0 23.017 6.85 77.3 72.0 18.018 8.49 77.4 58.0 17.019 8.9 75.4 74.5 19.520 6.66 77.4 73.5 17.521 7.54 76.7 74.0 19.022 6.31 71.2 65.5 16.523 7.24 77.5 72.0 17.524 7.61 76.5 69.5 18.525 6.9 76.7 74.5 18.026 6.72 78.5 66.5 17.027 6.98 75.2 70.5 19.028 7.24 79.8 70.5 18.529 6.66 76.2 76.0 20.030 6.83 75.9 74.5 20.031 7.01 77.3 68.5 17.032 7.21 80.6 72.5 18.533 7.19 74.7 75.0 23.034 7.89 77.0 65.5 14.535 8.4 77.0 68.5 16.536 7.47 75.9 70.5 19.537 7.01 78.2 66.0 16.038 7.61 76.5 68.5 17.039 7.03 75.4 69.5 21.540 6.87 77.5 71.0 18.041 6.64 74.8 73.0 21.542 6.18 78.4 67.5 16.543 6.64 77.0 66.5 16.544 6.56 75.4 70.5 19.545 7.15 77.6 68.5 18.546 7.97 76.3 72.5 18.047 7.5 73.2 74.5 23.548 6.7 77.1 69.0 18.0
Pre-Class Cyclone Underflow - Lab Data

37 of 74
Test Silica Density % -270 % -50049 7.06 73.2 76.0 20.050 6.84 75.9 71.5 21.051 6.93 76.8 71.5 19.552 7.45 77.4 72.0 20.053 7.4 74.5 73.0 22.554 7.41 77.3 72.0 21.055 3.75 77.0 73.0 20.056 7.5 75.7 75.5 21.057 6.43 76.8 68.5 19.058 6.92 77.0 71.5 19.059 6.6 76.6 70.5 18.560 7.78 77.6 69.5 18.061 7.85 73.2 73.0 21.562 6.13 77.8 70.0 19.063 7.32 75.7 74.5 21.564 7.15 75.0 22.065 7.57 76.1 74.5 21.066 8.62 74.4 79.5 23.567 6.75 77.4 65.0 17.068 7.03 77.3 70.0 18.569 7.2 76.3 69.5 19.070 6.62 76.0 66.5 20.071 7.43 75.1 74.5 20.072 7.37 75.3 76.5 25.073 6.09 77.0 67.5 16.074 6.25 77.1 68.0 18.075 6.9 74.7 69.0 18.576 6.7 77.3 68.0 19.577 6.43 73.3 68.5 20.578 7.65 75.9 74.5 21.079 7.84 73.7 74.0 20.080 7.78 74.1 77.0 21.081 7.11 76.0 73.0 20.582 7.7 75.8 70.5 19.583 7.7 75.8 71.0 20.084 7.98 76.9 72.5 20.585 8.53 76.5 78.0 21.586 8.49 75.2 79.5 24.587 6.87 77.7 76.0 20.588 7.48 77.4 71.0 17.589 7.48 75.0 73.0 20.090 7.26 75.0 74.0 22.591 7.58 75.9 71.5 17.092 7.23 74.5 72.5 20.593 7.04 76.9 70.0 20.094 7.45 76.3 72.5 20.095 7.48 75.4 72.5 20.0
Pre-Class Cyclone Underflow - Lab Data

38 of 74
Test Silica Density % -270 % -50096 7.15 76.1 69.5 21.097 7.99 75.1 72.5 19.098 7.49 74.6 73.5 20.599 7.02 74.6 72.5 22.0
100 7.52 76.5 73.5 21.0101 7.14 74.8 71.0 21.5102 7.08 73.4 75.0 23.5103 7.25 73.9 71.5 21.5104 7.38 75.2 73.5 21.5105 6.74 76.2 70.0 19.5106 7.33 76.6 73.0 20.0107 7.85 74.6 76.5 21.5108 7.72 76.4 73.0 22.0109 7.71 76.0 73.5 23.0110 6.22 77.0 70.5 19.0111 6.57 76.4 70.0 19.0112 6.83 76.0 73.0 23.5113 6.14 78.2 66.0 19.5114 6.74 76.8 67.5 19.0115 7.3 76.3 75.0 23.0116 6.05 78.7 70.5 19.5117 6.03 77.8 69.5 19.5118 6.52 77.3 73.5 23.5119 6.59 76.4 70.5 22.5120 6.62 77.6 70.5 21.0121 7.03 76.8 74.0 23.0122 5.62 76.8 69.0 21.0123 6.3 75.8 73.0 20.5124 7.28 77.6 68.5 17.5125 5.98 76.6 70.0 22.0126 6.71 76.5 70.5 18.5127 5.99 76.7 68.5 22.0128 6.28 77.6 69.5 19.0129 7.92 77.7 74.0 23.0130 5.86 76.5 69.5 20.5131 6.39 77.3 72.0 20.0132 6.83 79.1 73.5 20.0
Pre-Class Cyclone Underflow - Lab Data

39 of 74
Test Silica Density % -270 % -5001 4.51 58.5 98.0 86.52 5.13 52.1 96.5 76.53 4.98 49.6 97.0 80.04 4.86 46.6 97.0 79.05 4.58 58.9 97.0 79.06 4.74 58.9 96.0 74.07 3.75 54.5 99.0 88.08 3.3 55.0 99.0 90.09 2.99 52.5 99.5 96.0
10 3.43 42.7 98.5 89.511 3.70 43.0 98.5 86.013 4.25 58.9 98.0 84.414 3.73 44.5 97.5 83.515 4.05 58.7 98.6 87.616 3.47 57.5 99.0 86.517 3.83 55.0 99.5 92.518 5.26 58.3 97.0 76.519 4.43 55.2 99.0 90.020 3.99 58.9 98.0 85.021 3.66 55.4 99.0 88.522 3.63 58.8 98.5 87.023 3.29 54.7 99.5 91.024 3.64 57.6 99.0 86.025 4.23 58.6 97.5 75.526 3.6 57.9 98.5 88.027 3.25 55.5 99.0 92.028 3.3 56.9 98.5 89.029 3.08 55.4 99.5 94.530 3.37 58.8 99.5 92.031 4.77 58.7 96.5 69.032 3.46 55.1 98.5 81.533 4.06 58.3 98.0 83.034 4.3 57.6 97.5 80.535 3.8536 4.66 56.7 98.0 86.037 3.98 58.1 98.0 86.538 3.6 55.1 98.0 82.039 4.19 58.7 98.0 84.040 3.55 58.1 98.5 87.541 3.82 58.2 97.5 82.542 3.54 58.7 98.0 83.543 3.03 55.3 98.5 90.044 3.66 57.9 98.0 84.545 4.23 58.7 98.0 87.546 3.75 54.0 99.0 91.547 4.67 57.5 97.5 81.548 3.66 58.9 98.0 83.0
Pre-Class Cleaner Concentrate - Lab Data
40 of 74
Test Silica Density % -270 % -50049 3.6 56.2 98.5 86.550 3.82 59.0 97.5 80.051 3.73 58.8 98.0 87.552 3.08 55.6 99.0 92.053 3.76 58.9 97.5 82.054 3.63 58.2 98.5 91.555 3.43 54.1 98.5 88.056 3.77 58.5 97.5 83.557 3.79 58.6 97.5 82.558 3.29 55.2 98.5 89.559 3.29 58.2 98.5 85.060 3.54 55.9 98.0 86.061 3.49 57.6 98.5 89.062 4.58 59.1 97.0 80.063 3.4 54.7 99.5 92.564 3.29 43.5 99.0 91.065 3.71 58.5 98.5 90.066 3.69 52.4 99.5 94.567 3.86 58.8 97.5 83.568 3.22 55.4 98.5 89.569 3.59 56.8 98.0 87.570 4.66 58.7 95.5 76.571 3.3 55.0 98.5 86.572 3.1 56.7 99.0 92.573 3.22 54.1 98.0 83.574 4.2 57.3 97.5 83.575 3.66 55.2 98.0 82.076 4.35 57.7 97.0 82.077 3.35 54.2 98.0 85.578 4.61 57.0 97.0 82.579 3.89 54.1 99.0 91.080 3.89 54.5 98.0 86.081 4.03 58.1 98.5 89.082 3.73 54.7 99.0 92.083 4.35 56.2 98.5 86.584 4.26 57.1 98.5 88.585 3.71 52.7 99.0 93.586 3.81 57.3 99.5 94.587 4.01 57.8 98.5 90.588 3.66 54.9 98.5 93.089 3.96 55.9 98.5 90.590 4.55 57.2 98.0 87.091 3.91 54.8 98.5 87.592 4.07 56.2 98.0 88.593 4.22 58.6 98.0 85.594 3.47 54.8 98.5 91.595 3.48 55.7 98.5 90.0
Pre-Class Cleaner Concentrate - Lab Data
41 of 74
Test Silica Density % -270 % -50096 4.38 57.9 98.0 82.597 3.7 55.3 98.5 88.598 3.49 54.0 99.0 87.099 3.47 55.7 98.5 92.0
100 3.86 55.3 99.0 93.0101 3.35 55.3 98.5 90.0102 3.65 56.7 98.5 88.5103 3.39 55.7 98.5 91.5104 3.73 57.6 98.5 89.5105 4.28 58.7 97.5 82.5106 3.41 55.7 98.5 91.5107 3.79 56.2 98.5 88.5108 4.07 52.6 99.0 90.5109 4.39 56.7 98.5 89.0110 3.88 54.8 98.0 81.0111 3.61 55.4 98.5 86.0112 4.1 57.0 98.0 87.0113 4.59 58.5 97.5 83.0114 3.91 59.9 98.5 90.0115 3.95 56.8 98.5 92.5116 3.44 56.9 99.0 91.5117 3.43 55.6 99.0 91.5118 3.59 57.1 98.5 93.5119 3.84 60.1 99.0 90.0120 3.6 56.0 98.5 91.0121 3.84 56.3 98.5 91.0122 3.86 58.4 98.0 85.5123 3.8 55.1 99.0 88.5124 3.68 56.1 98.5 86.0125 3.69 58.3 98.0 86.5126 3.14 55.8 99.0 87.5127 3.77 56.9 98.0 86.0128 3.27 53.0 99.0 92.5129 3.31 52.7 99.5 94.0130 3.7 58.1 95.8 86.5131 3.37 55.3 99.0 92.0132 3.89 55.3 97.0 88.5
Pre-Class Cleaner Concentrate - Lab Data

42 of 74
Test Silica Solids % -270 % -500 Average1 61.8% 61.3% 60.6% 61.2%2 58.5% 60.6% 64.6% 65.1% 62.2%3 59.3% 64.4% 64.3% 62.7%4 56.0% 58.6% 56.4% 59.8% 57.7%5 61.4% 57.6% 58.0% 59.0%6 56.3% 53.7% 52.6% 54.2%7 46.0% 45.5% 48.5% 46.7%8 52.1% 54.2% 51.5% 53.7% 52.9%9 45.3% 48.8% 48.7% 48.1% 47.7%
10 52.1% 52.2% 50.0% 50.7% 51.2%11 45.5% 47.4% 50.0% 50.7% 48.4%13 48.0% 51.0% 54.5% 51.5% 51.3%14 49.5% 44.5% 50.0% 44.9% 47.2%15 51.1% 46.9% 48.2% 48.2% 48.6%16 51.6% 52.7% 51.2% 53.6% 52.3%17 49.6% 47.9% 49.1% 47.7% 48.6%18 54.8% 53.3% 57.9% 56.0% 55.5%19 52.4% 48.4% 49.0% 49.3% 49.8%20 51.5% 53.7% 53.1% 52.6% 52.7%21 49.7% 46.2% 46.0% 47.3% 47.3%22 47.0% 53.8% 51.1% 50.6%23 51.4% 40.0% 46.7% 46.0%24 45.1% 49.3% 46.6% 45.5% 46.6%25 53.6% 54.3% 55.1% 54.4%26 45.5% 52.0% 51.6% 48.6% 49.4%27 45.1% 44.2% 43.9% 45.6% 44.7%28 49.6% 48.0% 45.6% 45.9% 47.3%29 42.8% 46.2% 51.1% 47.7% 46.9%30 45.8% 46.4% 51.0% 47.6% 47.7%31 57.3% 55.8% 53.6% 63.6% 57.5%32 45.2% 43.9% 48.4% 45.8%33 52.8% 46.7% 47.9% 49.1%34 51.6% 49.6% 43.1% 53.4% 49.4%35 46.5% 44.3% 40.0% 41.6% 43.1%3637 50.0% 53.8% 53.9% 52.6%38 43.8% 46.8% 42.6% 47.9% 45.3%39 48.0% 52.2% 49.1% 49.8%40 51.7% 49.9% 49.1% 50.3% 50.3%41 51.9% 52.4% 53.1% 52.3% 52.4%42 52.5% 54.8% 50.8% 55.2% 53.4%43 44.0% 45.6% 44.6% 45.6% 45.0%44 53.0% 49.8% 50.9% 53.4% 51.8%45 44.5% 53.2% 49.2% 54.2% 50.3%46 47.8% 47.2% 50.0% 50.0% 48.7%47 57.3% 52.9% 54.3% 56.4% 55.2%48 53.6% 49.8% 49.2% 51.8% 51.1%
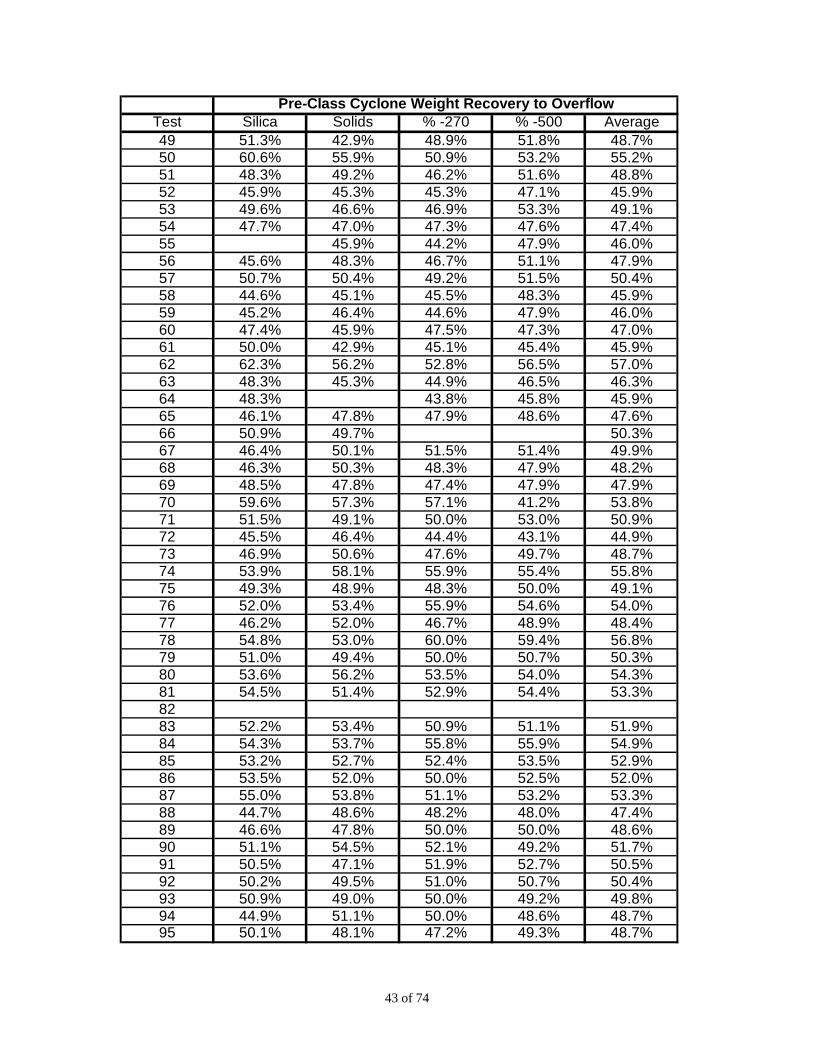
Pre-Class Cyclone Weight Recovery to Overflow
43 of 74
Test Silica Solids % -270 % -500 Average49 51.3% 42.9% 48.9% 51.8% 48.7%50 60.6% 55.9% 50.9% 53.2% 55.2%51 48.3% 49.2% 46.2% 51.6% 48.8%52 45.9% 45.3% 45.3% 47.1% 45.9%53 49.6% 46.6% 46.9% 53.3% 49.1%54 47.7% 47.0% 47.3% 47.6% 47.4%55 45.9% 44.2% 47.9% 46.0%56 45.6% 48.3% 46.7% 51.1% 47.9%57 50.7% 50.4% 49.2% 51.5% 50.4%58 44.6% 45.1% 45.5% 48.3% 45.9%59 45.2% 46.4% 44.6% 47.9% 46.0%60 47.4% 45.9% 47.5% 47.3% 47.0%61 50.0% 42.9% 45.1% 45.4% 45.9%62 62.3% 56.2% 52.8% 56.5% 57.0%63 48.3% 45.3% 44.9% 46.5% 46.3%64 48.3% 43.8% 45.8% 45.9%65 46.1% 47.8% 47.9% 48.6% 47.6%66 50.9% 49.7% 50.3%67 46.4% 50.1% 51.5% 51.4% 49.9%68 46.3% 50.3% 48.3% 47.9% 48.2%69 48.5% 47.8% 47.4% 47.9% 47.9%70 59.6% 57.3% 57.1% 41.2% 53.8%71 51.5% 49.1% 50.0% 53.0% 50.9%72 45.5% 46.4% 44.4% 43.1% 44.9%73 46.9% 50.6% 47.6% 49.7% 48.7%74 53.9% 58.1% 55.9% 55.4% 55.8%75 49.3% 48.9% 48.3% 50.0% 49.1%76 52.0% 53.4% 55.9% 54.6% 54.0%77 46.2% 52.0% 46.7% 48.9% 48.4%78 54.8% 53.0% 60.0% 59.4% 56.8%79 51.0% 49.4% 50.0% 50.7% 50.3%80 53.6% 56.2% 53.5% 54.0% 54.3%81 54.5% 51.4% 52.9% 54.4% 53.3%8283 52.2% 53.4% 50.9% 51.1% 51.9%84 54.3% 53.7% 55.8% 55.9% 54.9%85 53.2% 52.7% 52.4% 53.5% 52.9%86 53.5% 52.0% 50.0% 52.5% 52.0%87 55.0% 53.8% 51.1% 53.2% 53.3%88 44.7% 48.6% 48.2% 48.0% 47.4%89 46.6% 47.8% 50.0% 50.0% 48.6%90 51.1% 54.5% 52.1% 49.2% 51.7%91 50.5% 47.1% 51.9% 52.7% 50.5%92 50.2% 49.5% 51.0% 50.7% 50.4%93 50.9% 49.0% 50.0% 49.2% 49.8%94 44.9% 51.1% 50.0% 48.6% 48.7%95 50.1% 48.1% 47.2% 49.3% 48.7%
Pre-Class Cyclone Weight Recovery to Overflow
44 of 74
Test Silica Solids % -270 % -500 Average96 48.7% 47.4% 53.6% 49.9%97 48.6% 44.2% 48.6% 47.1%98 50.4% 52.0% 55.1% 52.5%99 43.3% 42.3% 45.3% 45.5% 44.1%
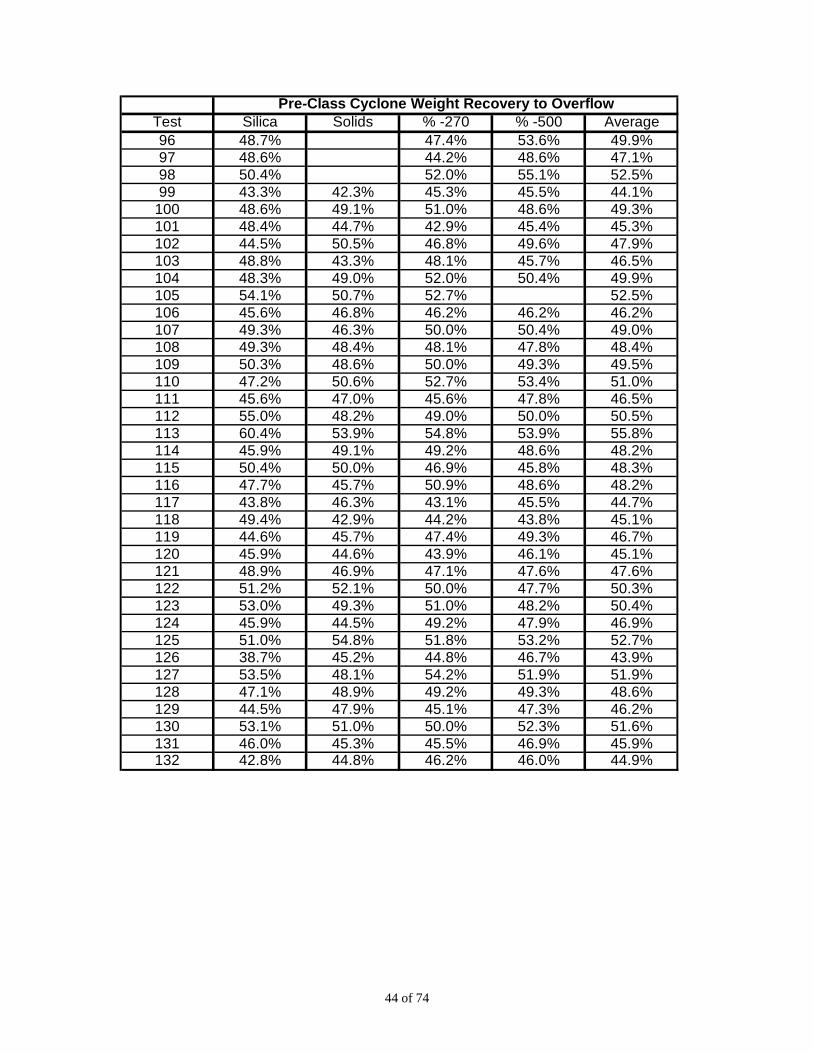
100 48.6% 49.1% 51.0% 48.6% 49.3%101 48.4% 44.7% 42.9% 45.4% 45.3%102 44.5% 50.5% 46.8% 49.6% 47.9%103 48.8% 43.3% 48.1% 45.7% 46.5%104 48.3% 49.0% 52.0% 50.4% 49.9%105 54.1% 50.7% 52.7% 52.5%106 45.6% 46.8% 46.2% 46.2% 46.2%107 49.3% 46.3% 50.0% 50.4% 49.0%108 49.3% 48.4% 48.1% 47.8% 48.4%109 50.3% 48.6% 50.0% 49.3% 49.5%110 47.2% 50.6% 52.7% 53.4% 51.0%111 45.6% 47.0% 45.6% 47.8% 46.5%112 55.0% 48.2% 49.0% 50.0% 50.5%113 60.4% 53.9% 54.8% 53.9% 55.8%114 45.9% 49.1% 49.2% 48.6% 48.2%115 50.4% 50.0% 46.9% 45.8% 48.3%116 47.7% 45.7% 50.9% 48.6% 48.2%117 43.8% 46.3% 43.1% 45.5% 44.7%118 49.4% 42.9% 44.2% 43.8% 45.1%119 44.6% 45.7% 47.4% 49.3% 46.7%120 45.9% 44.6% 43.9% 46.1% 45.1%121 48.9% 46.9% 47.1% 47.6% 47.6%122 51.2% 52.1% 50.0% 47.7% 50.3%123 53.0% 49.3% 51.0% 48.2% 50.4%124 45.9% 44.5% 49.2% 47.9% 46.9%125 51.0% 54.8% 51.8% 53.2% 52.7%126 38.7% 45.2% 44.8% 46.7% 43.9%127 53.5% 48.1% 54.2% 51.9% 51.9%128 47.1% 48.9% 49.2% 49.3% 48.6%129 44.5% 47.9% 45.1% 47.3% 46.2%130 53.1% 51.0% 50.0% 52.3% 51.6%131 46.0% 45.3% 45.5% 46.9% 45.9%132 42.8% 44.8% 46.2% 46.0% 44.9%
Pre-Class Cyclone Weight Recovery to Overflow

45 of 74
Test 100 150 200 270 400 5001 99.5 99.0 97.5 92.0 78.0 62.52 100.0 99.5 97.0 87.5 72.0 58.03 100.0 99.5 97.5 89.0 72.5 59.04 99.5 99.0 97.0 89.0 73.0 59.05 99.5 98.5 95.0 84.0 68.0 54.06 99.5 98.5 95.0 84.0 68.0 53.57 99.5 98.5 95.0 84.0 68.0 54.08 100.0 99.5 98.0 91.5 76.5 61.59 100.0 99.5 97.5 89.5 73.5 60.0
10 99.5 99.0 96.5 86.5 71.0 55.511 99.5 99.0 96.5 86.0 70.0 55.013 100.0 99.0 96.0 85.5 69.0 54.514 99.5 99.0 96.0 84.5 66.5 53.515 99.5 99.0 95.0 84.0 67.0 52.516 100.0 99.5 97.0 88.5 71.0 56.517 100.0 99.5 96.5 85.5 68.0 54.518 99.0 97.5 91.5 80.0 63.5 49.519 100.0 99.5 96.0 86.5 70.0 55.020 100.0 99.0 96.0 86.5 69.0 53.521 100.0 99.0 96.0 85.5 69.0 54.522 99.5 98.5 95.0 83.0 66.0 52.023 100.0 99.0 95.5 83.0 65.5 52.524 99.5 98.5 94.5 83.0 66.5 51.525 99.5 99.0 96.0 87.0 69.5 53.026 100.0 99.0 95.5 83.0 65.5 52.027 99.5 98.5 95.0 83.0 66.0 53.028 99.5 98.5 95.0 83.5 66.5 52.529 100.0 99.5 97.0 88.0 70.0 56.030 100.0 99.5 96.5 87.0 68.5 54.531 99.5 98.5 94.5 83.5 66.0 51.032 100.0 99.0 95.0 84.0 66.5 50.533 99.5 98.5 95.0 85.5 68.5 52.034 99.5 98.5 93.0 79.5 64.0 50.035 99.5 98.5 93.0 80.5 62.0 47.536 99.5 99.0 97.0 92.5 83.5 74.037 99.5 98.5 95.0 86.0 68.5 54.038 99.5 98.5 94.5 81.5 65.0 52.039 99.5 99.0 95.0 83.0 67.0 54.040 100.0 99.0 95.5 84.5 67.5 54.041 99.5 98.5 95.5 86.0 69.0 55.042 99.5 98.5 94.5 83.0 67.0 53.543 99.5 98.5 93.5 81.0 64.5 50.544 99.5 99.0 95.5 84.5 68.0 54.545 99.5 98.5 93.5 83.0 67.5 54.046 100.0 99.0 95.5 85.5 69.0 54.547 100.0 99.0 96.0 87.0 70.5 56.548 99.5 99.0 95.0 83.5 68.0 53.5
Feed Size Distribution - Percent Passing Mesh Size

46 of 74
Test 100 150 200 270 400 50049 99.5 99.0 96.0 87.0 71.5 56.550 99.5 99.0 95.5 85.0 69.0 54.551 99.5 98.5 94.5 83.5 67.0 52.552 99.5 98.5 94.5 84.0 67.0 52.553 99.5 98.5 95.0 84.5 67.0 55.054 99.5 99.0 95.5 85.0 69.5 55.555 99.5 98.5 95.0 84.5 67.0 53.556 100.0 99.0 96.0 86.0 68.5 54.557 99.5 98.5 94.5 83.0 66.0 53.058 99.5 98.5 95.0 84.0 67.5 53.559 99.5 98.5 94.5 83.0 66.0 52.060 99.5 98.5 94.5 83.5 66.5 53.061 99.5 98.5 95.0 84.5 67.5 53.562 99.5 98.5 94.5 84.0 67.5 54.063 100.0 99.0 95.5 85.5 69.0 54.564 100.0 99.0 95.5 85.5 68.0 54.565 100.0 99.0 95.5 86.0 68.5 55.066 100.0 99.8 98.8 96.0 89.6 84.267 99.5 98.5 94.0 82.0 66.0 52.568 99.5 98.5 95.0 84.0 67.5 53.569 99.5 98.5 94.5 83.0 66.0 52.570 100.0 99.0 95.0 84.5 57.5 43.571 99.5 98.5 95.5 86.5 70.0 55.572 99.5 99.0 96.0 86.5 69.5 54.573 99.5 98.5 94.5 82.5 66.0 52.074 100.0 99.0 95.5 84.4 68.0 54.075 100.0 99.0 95.0 83.5 67.0 54.076 99.5 99.0 95.0 84.5 68.5 55.077 99.5 98.5 94.0 82.5 66.5 53.078 100.0 99.5 96.5 88.0 72.5 59.079 99.5 99.0 96.0 86.5 70.0 56.580 100.0 99.5 96.5 88.5 73.0 58.581 99.5 99.0 96.0 86.5 71.5 57.58283 100.0 99.0 95.5 85.0 68.5 55.584 100.0 99.0 95.5 87.0 73.0 58.585 100.0 99.5 96.5 89.0 74.5 59.586 99.5 99.0 96.5 89.5 76.0 61.587 100.0 99.0 96.0 87.5 72.0 58.088 99.5 99.0 95.0 84.5 68.5 54.089 100.0 99.5 96.0 86.0 70.0 55.590 100.0 99.5 96.0 86.5 69.5 55.091 99.5 99.0 95.5 85.5 69.5 56.092 100.0 99.5 96.0 85.5 69.0 54.593 99.5 99.0 95.0 84.0 67.5 52.094 99.5 99.0 95.5 85.5 70.0 55.095 99.5 99.0 95.5 85.0 69.0 55.5
Feed Size Distribution - Percent Passing Mesh Size

47 of 74
Test 100 150 200 270 400 50096 99.5 98.5 94.5 83.0 68.0 54.597 99.5 98.5 95.0 84.0 68.0 52.598 100.0 99.5 96.5 86.5 70.5 58.099 99.5 98.5 94.5 84.5 68.5 54.5
100 100.0 99.5 96.0 86.5 70.0 56.0101 99.5 98.5 94.0 83.0 67.0 53.5102 100.0 99.0 95.5 86.0 70.5 56.5103 99.5 99.0 95.0 84.5 68.0 53.5104 99.5 99.0 95.5 86.5 70.0 56.0105 99.5 99.0 95.0 84.5 57.0 42.0106 99.5 99.0 95.5 85.0 68.5 53.5107 99.5 99.0 96.0 87.5 72.0 57.0108 99.5 99.0 95.5 85.5 69.5 55.0109 100.0 99.5 96.0 86.0 70.0 57.0110 100.0 99.5 96.0 85.0 69.0 54.5111 99.5 99.0 95.0 83.0 66.0 51.5112 100.0 99.5 96.0 85.5 70.0 56.5113 100.0 99.0 94.5 83.0 67.5 54.0114 99.5 98.5 94.0 82.5 66.5 52.5115 100.0 99.0 96.0 86.5 70.5 56.0116 99.5 99.0 95.5 85.0 69.5 55.5117 99.5 98.5 94.5 82.0 65.5 52.0118 100.0 99.5 96.5 85.0 69.0 55.0119 99.5 99.0 95.0 84.0 69.5 56.5120 99.5 99.0 95.0 83.0 67.5 53.5121 99.5 99.0 96.0 86.0 71.0 57.0122 99.5 99.0 95.0 83.5 66.0 52.0123 99.5 99.0 96.0 86.0 67.5 54.0124 99.5 99.0 95.5 83.5 66.5 52.5125 99.5 99.0 95.0 84.5 69.0 55.5126 99.5 99.0 95.5 83.5 67.5 54.0127 100.0 99.5 95.5 84.5 69.5 56.5128 100.0 99.5 95.5 84.0 69.0 55.5129 100.0 99.5 95.5 85.5 70.5 57.5130 99.5 99.0 95.0 84.0 68.0 54.5131 99.5 99.0 95.5 84.5 68.5 54.5132 100.0 99.5 96.0 85.5 69.0 54.5
Feed Size Distribution - Percent Passing Mesh Size
48 of 74
Test 100 150 200 270 400 5001 100.0 100.0 99.5 98.0 95.0 87.52 100.0 100.0 98.5 96.0 89.5 76.53 100.0 100.0 99.0 97.0 91.5 79.54 100.0 100.0 99.5 97.5 92.5 80.55 100.0 100.0 99.0 96.5 91.5 77.56 100.0 100.0 99.0 96.5 90.5 76.07 100.0 100.0 100.0 99.0 95.5 88.58 100.0 100.0 100.0 99.5 96.5 90.09 100.0 100.0 100.0 99.5 98.5 94.5
10 100.0 100.0 99.5 98.5 96.0 90.511 100.0 100.0 99.5 99.0 96.5 91.513 100.0 100.0 99.5 98.0 95.0 86.014 100.0 100.0 99.5 98.5 95.5 91.515 100.0 100.0 99.5 98.5 95.5 88.516 100.0 100.0 99.5 98.5 95.0 85.517 100.0 100.0 100.0 99.5 98.0 94.518 100.0 100.0 99.0 96.0 89.5 75.019 100.0 100.0 99.5 99.0 96.5 91.520 100.0 100.0 99.5 98.0 95.0 86.021 100.0 100.0 100.0 99.0 97.5 94.022 100.0 100.0 99.5 98.0 95.5 86.023 100.0 100.0 100.0 99.5 97.5 92.524 100.0 100.0 99.5 98.5 96.0 91.025 100.0 100.0 99.5 97.5 93.0 81.526 100.0 100.0 99.5 98.5 95.5 89.027 100.0 100.0 99.5 99.0 97.5 93.528 100.0 100.0 100.0 99.0 97.0 92.529 100.0 100.0 100.0 99.5 98.0 95.530 100.0 100.0 99.5 99.0 97.0 92.531 100.0 100.0 99.0 96.5 89.0 70.532 100.0 100.0 100.0 98.7 95.3 84.733 100.0 100.0 99.5 97.5 93.5 83.534 100.0 100.0 99.5 98.0 93.5 81.035 100.0 100.0 99.5 98.5 96.0 91.036 100.0 100.0 99.5 97.5 93.5 84.537 100.0 100.0 99.5 98.0 95.0 86.538 100.0 100.0 100.0 99.0 96.0 90.039 100.0 100.0 99.5 97.0 90.5 75.540 100.0 100.0 99.5 98.5 95.5 89.541 100.0 100.0 99.5 97.5 93.0 85.542 100.0 100.0 99.5 98.0 94.0 83.543 100.0 100.0 100.0 99.0 96.5 91.044 100.0 100.0 99.5 98.0 94.0 85.045 100.0 100.0 99.5 98.0 94.0 84.046 100.0 100.0 99.5 98.5 96.0 91.047 100.0 100.0 99.5 97.5 92.0 82.048 100.0 100.0 100.0 98.5 95.0 86.5
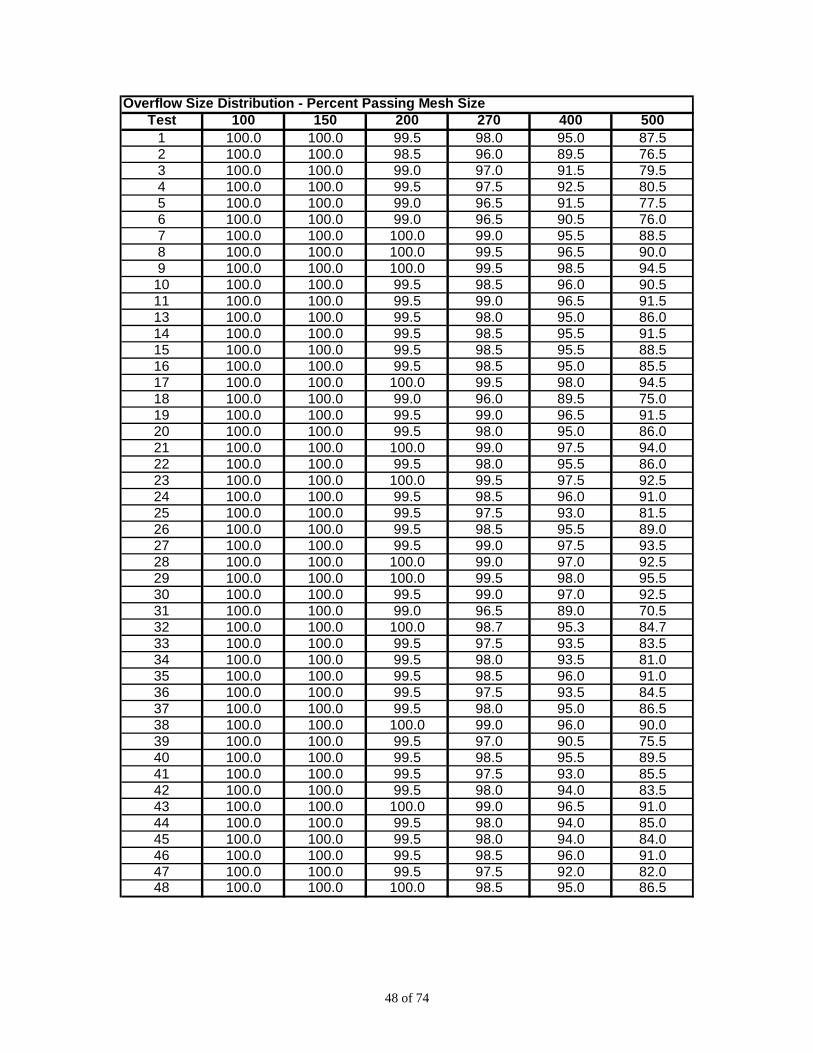
Overflow Size Distribution - Percent Passing Mesh Size
49 of 74
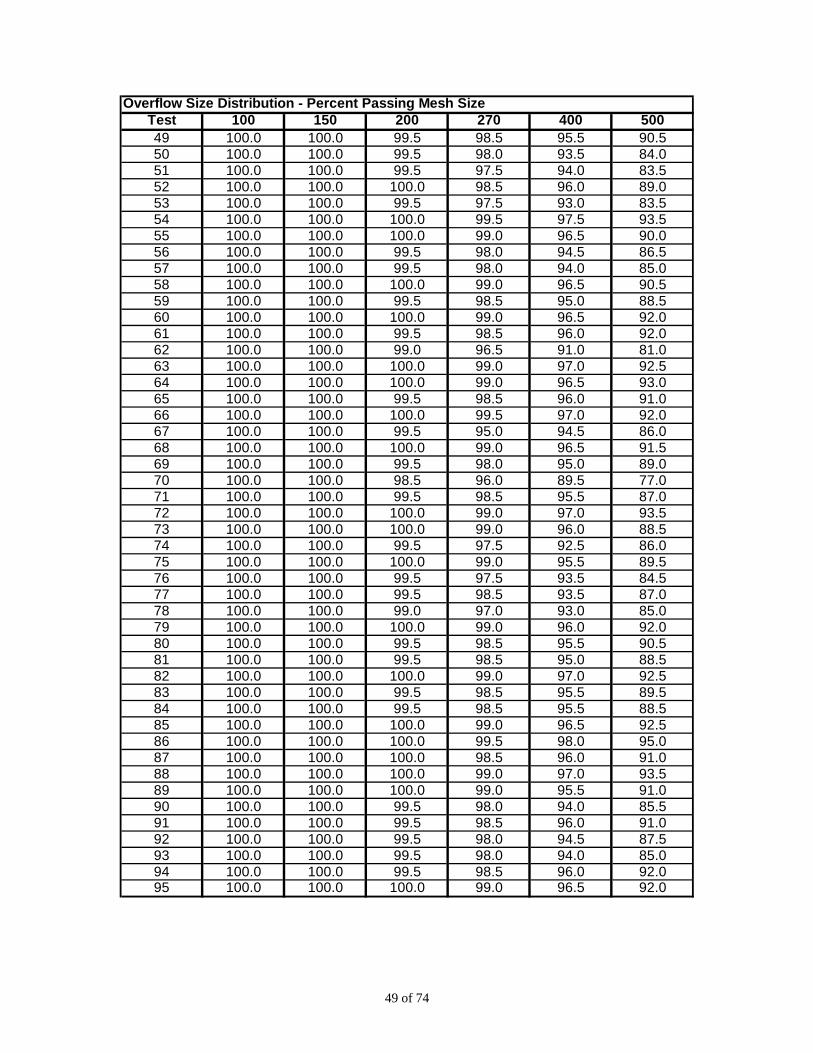
Test 100 150 200 270 400 50049 100.0 100.0 99.5 98.5 95.5 90.550 100.0 100.0 99.5 98.0 93.5 84.051 100.0 100.0 99.5 97.5 94.0 83.552 100.0 100.0 100.0 98.5 96.0 89.053 100.0 100.0 99.5 97.5 93.0 83.554 100.0 100.0 100.0 99.5 97.5 93.555 100.0 100.0 100.0 99.0 96.5 90.056 100.0 100.0 99.5 98.0 94.5 86.557 100.0 100.0 99.5 98.0 94.0 85.058 100.0 100.0 100.0 99.0 96.5 90.559 100.0 100.0 99.5 98.5 95.0 88.560 100.0 100.0 100.0 99.0 96.5 92.061 100.0 100.0 99.5 98.5 96.0 92.062 100.0 100.0 99.0 96.5 91.0 81.063 100.0 100.0 100.0 99.0 97.0 92.564 100.0 100.0 100.0 99.0 96.5 93.065 100.0 100.0 99.5 98.5 96.0 91.066 100.0 100.0 100.0 99.5 97.0 92.067 100.0 100.0 99.5 95.0 94.5 86.068 100.0 100.0 100.0 99.0 96.5 91.569 100.0 100.0 99.5 98.0 95.0 89.070 100.0 100.0 98.5 96.0 89.5 77.071 100.0 100.0 99.5 98.5 95.5 87.072 100.0 100.0 100.0 99.0 97.0 93.573 100.0 100.0 100.0 99.0 96.0 88.574 100.0 100.0 99.5 97.5 92.5 86.075 100.0 100.0 100.0 99.0 95.5 89.576 100.0 100.0 99.5 97.5 93.5 84.577 100.0 100.0 99.5 98.5 93.5 87.078 100.0 100.0 99.0 97.0 93.0 85.079 100.0 100.0 100.0 99.0 96.0 92.080 100.0 100.0 99.5 98.5 95.5 90.581 100.0 100.0 99.5 98.5 95.0 88.582 100.0 100.0 100.0 99.0 97.0 92.583 100.0 100.0 99.5 98.5 95.5 89.584 100.0 100.0 99.5 98.5 95.5 88.585 100.0 100.0 100.0 99.0 96.5 92.586 100.0 100.0 100.0 99.5 98.0 95.087 100.0 100.0 100.0 98.5 96.0 91.088 100.0 100.0 100.0 99.0 97.0 93.589 100.0 100.0 100.0 99.0 95.5 91.090 100.0 100.0 99.5 98.0 94.0 85.591 100.0 100.0 99.5 98.5 96.0 91.092 100.0 100.0 99.5 98.0 94.5 87.593 100.0 100.0 99.5 98.0 94.0 85.094 100.0 100.0 99.5 98.5 96.0 92.095 100.0 100.0 100.0 99.0 96.5 92.0
Overflow Size Distribution - Percent Passing Mesh Size

50 of 74
Test 100 150 200 270 400 50096 100.0 100.0 99.5 98.0 93.5 83.597 100.0 100.0 99.5 98.5 95.0 88.098 100.0 100.0 99.5 98.5 95.5 88.599 100.0 100.0 100.0 99.0 97.5 93.5
100 100.0 100.0 100.0 99.0 97.0 93.0101 100.0 100.0 100.0 99.0 96.5 92.0102 100.0 100.0 99.5 98.5 95.5 90.0103 100.0 100.0 99.5 98.5 96.0 91.0104 100.0 100.0 99.5 98.5 95.5 90.0105 100.0 100.0 99.5 97.5 93.5 83.5106 100.0 100.0 100.0 99.0 97.0 92.5107 100.0 100.0 99.5 98.5 96.0 92.0108 100.0 100.0 100.0 99.0 96.0 91.0109 100.0 100.0 99.5 98.5 96.0 92.0110 100.0 100.0 99.5 98.0 94.5 85.5111 100.0 100.0 99.5 98.5 95.0 87.0112 100.0 100.0 99.5 98.5 95.0 89.5113 100.0 100.0 99.0 97.0 92.5 83.5114 100.0 100.0 99.5 98.5 95.0 88.0115 100.0 100.0 100.0 99.5 98.0 95.0116 100.0 100.0 100.0 99.0 97.0 93.5117 100.0 100.0 99.5 98.5 96.0 91.0118 100.0 100.0 100.0 99.5 98.0 95.5119 100.0 100.0 100.0 99.0 96.5 91.5120 100.0 100.0 99.5 99.0 96.5 91.5121 100.0 100.0 100.0 99.5 97.5 94.5122 100.0 100.0 99.5 98.0 94.0 86.0123 100.0 100.0 99.5 98.5 95.5 90.0124 100.0 100.0 100.0 99.0 96.5 90.5125 100.0 100.0 99.5 98.0 94.0 85.0126 100.0 100.0 100.0 99.5 98.0 94.5127 100.0 100.0 99.5 98.0 95.5 88.5128 100.0 100.0 100.0 99.0 97.0 93.0129 100.0 100.0 100.0 99.5 98.5 96.0130 100.0 100.0 100.0 98.5 94.5 85.5131 100.0 100.0 100.0 99.5 97.5 93.5132 100.0 100.0 100.0 99.5 98.0 95.0
Overflow Size Distribution - Percent Passing Mesh Size

51 of 74
Test 100 150 200 270 400 5001 99.5 99.0 95.5 82.5 47.5 24.02 99.5 98.5 94.0 72.0 38.5 23.53 99.0 98.0 94.0 74.5 38.5 22.04 99.5 98.5 94.5 78.0 43.5 27.05 98.5 97.0 90.0 67.0 36.0 21.56 99.0 97.0 91.0 69.5 41.5 28.57 99.5 98.0 92.0 71.5 41.5 21.58 100.0 99.0 95.5 83.0 54.0 28.59 99.5 98.5 95.0 80.0 49.0 28.0
10 99.5 98.5 94.0 74.5 43.5 19.511 99.5 98.5 93.5 73.0 40.5 17.513 99.5 98.5 92.5 70.5 40.5 21.014 99.5 98.5 93.0 70.5 40.5 22.515 99.0 98.0 91.0 70.5 41.0 19.016 100.0 99.0 94.5 78.0 42.5 23.017 99.5 98.5 93.0 72.0 39.0 18.018 98.0 95.0 83.0 58.0 29.0 17.019 100.0 98.5 92.5 74.5 43.5 19.520 99.5 98.0 92.5 73.5 39.5 17.521 99.5 98.0 92.5 74.0 41.0 19.022 99.0 97.5 91.0 65.5 31.5 16.523 99.5 98.0 92.0 72.0 43.0 17.524 99.5 98.0 91.0 69.5 41.0 18.525 100.0 98.5 92.5 74.5 40.0 18.026 99.5 98.0 91.0 66.5 33.5 17.027 99.5 98.5 92.0 70.5 40.0 19.028 99.5 98.0 91.5 70.5 38.5 18.529 99.5 98.0 93.5 76.0 40.5 20.030 99.5 98.5 93.5 74.5 40.0 20.031 98.5 96.5 89.5 68.5 36.0 17.032 99.5 98.0 91.5 72.5 43.5 18.533 99.0 97.5 91.5 75.0 46.0 23.034 98.5 96.0 87.0 65.5 33.0 14.535 98.5 96.5 88.0 68.5 37.5 16.536 99.5 97.5 89.5 70.5 37.5 19.537 99.5 98.0 91.0 73.0 38.5 17.038 99.0 97.5 90.5 68.5 37.5 17.039 99.0 97.5 90.5 69.5 39.0 21.540 100.0 98.5 92.0 71.0 38.0 18.041 99.5 98.0 92.0 73.0 40.5 21.542 99.0 97.5 90.0 67.5 35.5 16.543 99.0 97.0 89.0 66.5 38.0 16.544 99.5 98.0 91.0 70.5 40.0 19.545 99.5 98.0 88.5 68.5 39.5 18.546 99.5 98.0 92.0 72.5 40.5 18.047 99.5 98.0 92.0 74.5 45.5 23.548 99.5 98.0 90.5 69.0 40.5 18.0
Underflow Size Distribution - Percent Passing Mesh Size

52 of 74
Test 100 150 200 270 400 50049 99.5 98.5 93.0 76.0 46.0 20.050 99.5 98.0 91.5 71.5 42.0 21.051 99.5 98.0 91.5 71.5 40.5 19.552 99.5 97.5 91.5 72.0 42.0 20.053 99.5 98.0 91.5 73.0 43.5 22.554 99.0 97.5 91.5 72.0 42.5 21.055 99.0 97.5 92.0 73.0 42.5 20.056 100.0 98.5 93.0 75.5 43.0 21.057 99.5 97.5 90.0 68.5 38.5 19.058 99.5 98.0 91.5 71.5 42.0 19.059 99.5 98.0 91.5 70.5 41.0 18.560 99.5 97.5 90.5 69.5 38.5 18.061 99.5 98.0 91.5 73.0 43.0 21.562 99.5 98.0 91.0 70.0 36.5 19.063 100.0 98.5 92.5 74.5 45.5 21.564 100.0 98.5 93.0 75.0 45.5 22.065 99.5 98.0 92.0 74.5 45.0 21.066 99.5 98.5 93.5 97.5 50.0 23.567 99.0 97.0 88.5 65.0 34.5 17.068 99.5 97.5 91.0 70.0 39.0 18.569 99.5 98.0 91.0 69.5 40.5 19.070 99.0 97.0 89.0 66.0 35.0 20.071 99.0 97.5 92.0 74.5 44.0 20.072 99.5 98.5 93.5 76.5 47.0 25.073 99.0 97.5 90.0 67.5 38.5 16.074 99.5 98.0 91.0 68.0 35.0 18.075 99.5 98.0 91.0 69.0 37.5 18.576 99.0 97.5 90.5 68.0 36.0 19.577 99.5 98.0 90.5 68.5 40.0 20.578 100.0 99.0 92.5 74.5 43.5 21.079 100.0 99.0 93.0 74.0 42.5 20.080 100.0 99.0 93.5 77.0 46.0 21.081 99.5 98.5 92.5 73.0 43.5 20.582 99.5 98.5 92.0 70.5 39.0 19.583 99.5 98.5 92.0 71.0 39.5 20.084 99.0 97.5 90.5 72.5 43.5 20.585 99.5 98.5 92.5 78.0 48.5 21.586 99.5 98.5 93.5 79.5 51.5 24.587 99.5 98.0 92.5 76.0 46.0 20.588 99.5 98.0 91.0 71.0 41.5 17.589 99.5 98.5 92.0 73.0 44.0 20.090 99.5 98.5 92.5 74.0 42.5 22.591 99.5 98.5 92.0 71.5 41.0 17.092 99.5 98.5 92.5 72.5 42.5 20.593 99.5 98.0 91.0 70.0 40.5 20.094 99.5 98.0 92.0 72.5 43.0 20.095 99.5 98.5 92.0 72.5 43.5 20.0
Underflow Size Distribution - Percent Passing Mesh Size

53 of 74
Test 100 150 200 270 400 50096 99.5 98.0 91.0 69.5 41.0 21.097 99.5 98.0 92.0 72.5 44.0 19.098 99.5 98.5 92.5 73.5 43.0 20.599 99.5 98.0 91.5 72.5 44.5 22.0
100 99.5 98.5 92.0 73.5 43.5 21.0101 99.5 98.0 90.5 71.0 43.0 21.0102 99.5 98.5 92.5 75.0 46.5 23.5103 99.5 98.0 91.5 71.5 43.5 21.5104 99.5 98.0 92.0 73.5 45.0 21.5105 99.0 97.5 90.5 70.0 38.0 19.5106 99.5 98.5 92.5 73.0 44.0 20.0107 99.5 98.5 93.0 76.5 44.5 21.5108 100.0 99.0 93.0 73.0 44.5 22.0109 99.5 98.5 92.5 73.5 44.0 23.0110 99.5 98.5 92.0 70.5 39.0 19.0111 99.5 98.5 92.0 70.0 40.0 19.0112 99.5 98.5 92.5 73.0 44.0 23.5113 99.0 97.5 89.0 66.0 35.5 19.5114 99.0 97.5 89.5 67.5 39.5 19.0115 99.5 98.0 92.5 75.0 47.0 23.0116 99.5 98.5 92.0 70.5 41.0 19.5117 99.5 98.5 91.5 69.5 41.0 19.5118 99.5 98.5 93.0 73.5 45.5 23.5119 99.5 98.5 91.5 70.5 42.5 22.5120 99.5 98.5 92.0 70.5 42.5 21.0121 99.5 98.5 93.0 74.0 45.5 23.0122 99.5 98.5 91.5 69.0 38.0 21.0123 99.5 98.5 93.0 73.0 40.5 20.5124 99.5 98.5 91.5 68.5 36.0 17.5125 99.5 98.5 91.5 70.0 40.5 22.0126 99.5 98.5 92.0 70.5 42.0 18.5127 99.5 98.5 90.5 68.5 41.0 22.0128 99.5 98.5 91.5 69.5 42.0 19.0129 100.0 99.0 92.0 74.0 47.5 23.0130 99.5 98.0 91.0 69.5 39.0 20.5131 100.0 99.0 93.0 72.0 44.0 20.0132 100.0 99.0 93.0 73.5 44.0 20.0
Underflow Size Distribution - Percent Passing Mesh Size

54 of 74
Test 100 150 200 270 400 500 -5001 0% 0% 22% 18% 14% 24% 85%2 0% 0% 40% 17% 28% 46% 86%3 0% 0% 33% 15% 21% 59% 87%4 0% 0% 14% 15% 20% 48% 82%5 0% 0% 17% 13% 18% 83%6 0% 0% 14% 13% 20% 75%7 0% 0% 0% 4% 12% 23% 79%8 0% 0% 0% 4% 11% 24% 79%9 0% 0% 0% 3% 3% 13% 76%
10 0% 0% 10% 5% 9% 16% 83%11 0% 0% 11% 2% 9% 15% 84%13 0% 0% 9% 8% 9% 30% 81%14 0% 0% 8% 4% 7% 11% 77%15 0% 0% 6% 4% 8% 24% 81%16 0% 0% 10% 6% 11% 33% 81%17 0% 0% 0% 2% 4% 11% 83%18 0% 0% 9% 16% 22% 85%19 0% 0% 6% 3% 8% 16% 82%20 0% 0% 8% 9% 9% 29% 84%21 0% 0% 0% 4% 5% 10% 82%22 0% 0% 7% 7% 8% 12% 84%23 0% 0% 0% 2% 5% 23% 82%24 0% 0% 6% 4% 7% 14% 80%25 0% 0% 9% 13% 15% 37% 85%26 0% 0% 8% 4% 9% 14% 83%27 0% 0% 7% 2% 4% 14% 81%28 0% 0% 0% 4% 6% 12% 81%29 0% 0% 0% 3% 4% 6% 81%30 0% 0% 7% 3% 5% 12% 81%31 0% 0% 13% 12% 26% 88%32 0% 0% 0% 5% 9% 42% 81%33 0% 0% 6% 10% 11% 30% 77%34 0% 0% 4% 4% 18% 67% 86%35 0% 0% 3% 3% 6% 14% 80%36 0% 0% 20% 38% 37% 96%37 0% 0% 8% 9% 9% 32% 85%38 0% 0% 0% 3% 9% 24% 83%39 0% 0% 6% 10% 25% 84%40 0% 0% 7% 5% 9% 21% 83%41 0% 0% 9% 12% 15% 23% 81%42 0% 0% 6% 7% 14% 50% 86%43 0% 0% 0% 4% 7% 18% 82%44 0% 0% 8% 7% 13% 41% 83%45 0% 0% 5% 7% 14% 51% 84%46 0% 0% 6% 5% 8% 16% 83%47 0% 0% 9% 12% 18% 48% 82%48 0% 0% 0% 7% 12% 33% 84%
Recovery of Feed to Overflow

55 of 74
Test 100 150 200 270 400 500 -50049 0% 0% 8% 6% 10% 17% 83%50 0% 0% 7% 7% 15% 37% 82%51 0% 0% 5% 9% 11% 45% 82%52 0% 0% 0% 7% 7% 24% 80%53 0% 0% 7% 9% 12% 62% 81%54 0% 0% 0% 2% 7% 12% 80%55 0% 0% 0% 4% 7% 27% 81%56 0% 0% 8% 7% 10% 33% 81%57 0% 0% 6% 7% 12% 43% 83%58 0% 0% 0% 4% 7% 23% 82%59 0% 0% 5% 4% 10% 25% 81%60 0% 0% 0% 5% 7% 15% 82%61 0% 0% 7% 4% 7% 12% 78%62 0% 0% 13% 14% 20% 40% 85%63 0% 0% 0% 5% 6% 15% 79%64 0% 0% 0% 5% 6% 13% 78%65 0% 0% 6% 5% 6% 20% 80%66 0% 0% 0% 27% 36% 97%67 0% 0% 6% 23% 2% 28% 84%68 0% 0% 0% 5% 8% 15% 82%69 0% 0% 6% 7% 8% 23% 81%70 0% 0% 23% 15% 4% 36% 73%71 0% 0% 8% 6% 9% 36% 83%72 0% 0% 0% 5% 5% 9% 74%73 0% 0% 0% 4% 9% 30% 85%74 0% 0% 8% 10% 18% 13% 84%75 0% 0% 0% 4% 11% 21% 83%76 0% 0% 6% 11% 14% 27% 84%77 0% 0% 5% 4% 17% 22% 80%78 0% 21% 14% 15% 37% 86%79 0% 0% 6% 10% 14% 83%80 0% 8% 7% 11% 18% 83%81 0% 0% 9% 6% 13% 25% 84%8283 0% 7% 5% 10% 22% 82%84 0% 8% 7% 12% 26% 85%85 0% 0% 7% 10% 14% 83%86 0% 0% 0% 4% 6% 11% 81%87 0% 0% 9% 9% 20% 83%88 0% 0% 0% 5% 6% 11% 83%89 0% 0% 5% 11% 15% 82%90 0% 6% 8% 12% 28% 80%91 0% 0% 7% 5% 8% 20% 86%92 0% 6% 7% 11% 24% 81%93 0% 0% 6% 7% 12% 25% 80%94 0% 0% 6% 5% 8% 11% 81%95 0% 0% 0% 5% 8% 18% 82%
Recovery of Feed to Overflow

56 of 74
Test 100 150 200 270 400 500 -50096 0% 0% 6% 7% 17% 48% 82%97 0% 0% 6% 4% 11% 24% 81%98 0% 0% 9% 5% 10% 36% 84%99 0% 0% 0% 5% 4% 13% 78%
100 0% 0% 0% 5% 6% 13% 81%101 0% 0% 0% 4% 7% 16% 79%102 0% 0% 6% 5% 10% 20% 79%103 0% 0% 5% 5% 7% 15% 78%104 0% 0% 6% 6% 9% 21% 81%105 0% 0% 6% 10% 2% 27% 70%106 0% 0% 0% 5% 6% 14% 80%107 0% 0% 8% 6% 9% 11% 81%108 0% 0% 0% 5% 9% 16% 79%109 0% 0% 6% 5% 8% 14% 80%110 0% 0% 7% 7% 12% 31% 84%111 0% 0% 5% 4% 10% 28% 81%112 0% 0% 6% 5% 12% 19% 79%113 0% 0% 12% 10% 17% 24% 83%114 0% 0% 5% 4% 11% 24% 81%115 0% 0% 0% 2% 4% 9% 78%116 0% 0% 0% 5% 7% 10% 82%117 0% 0% 6% 4% 7% 18% 80%118 0% 0% 0% 2% 4% 7% 76%119 0% 0% 0% 5% 9% 18% 80%120 0% 0% 5% 2% 8% 16% 79%121 0% 0% 0% 2% 7% 9% 79%122 0% 0% 6% 7% 11% 19% 79%123 0% 0% 8% 5% 8% 18% 80%124 0% 0% 0% 4% 8% 15% 83%125 0% 0% 6% 8% 14% 35% 81%126 0% 0% 0% 2% 4% 13% 82%127 0% 0% 7% 7% 8% 27% 81%128 0% 0% 0% 4% 7% 15% 83%129 0% 0% 0% 2% 3% 10% 79%130 0% 0% 0% 7% 14% 35% 82%131 0% 0% 0% 2% 6% 14% 81%132 0% 0% 0% 2% 4% 9% 80%
Recovery of Feed to Overflow

57 of 74
Test 100 150 200 270 400 500 -5001 100% 100% 78% 82% 86% 76% 15%2 100% 100% 60% 83% 72% 54% 14%3 100% 100% 67% 85% 79% 41% 13%4 100% 100% 86% 85% 80% 52% 18%5 100% 100% 83% 87% 82% 17%6 100% 100% 86% 87% 80% 25%7 100% 100% 100% 96% 88% 77% 21%8 100% 100% 100% 96% 89% 76% 21%9 100% 100% 100% 97% 97% 87% 24%
10 100% 100% 90% 95% 91% 84% 17%11 100% 100% 89% 98% 91% 85% 16%13 100% 100% 91% 92% 91% 70% 19%14 100% 100% 92% 96% 93% 89% 23%15 100% 100% 94% 96% 92% 76% 19%16 100% 100% 90% 94% 89% 67% 19%17 100% 100% 100% 98% 96% 89% 17%18 100% 100% 91% 84% 78% 15%19 100% 100% 94% 97% 92% 84% 18%20 100% 100% 92% 91% 91% 71% 16%21 100% 100% 100% 96% 95% 90% 18%22 100% 100% 93% 93% 92% 88% 16%23 100% 100% 100% 98% 95% 77% 18%24 100% 100% 94% 96% 93% 86% 20%25 100% 100% 91% 88% 85% 63% 15%26 100% 100% 92% 96% 91% 86% 17%27 100% 100% 93% 98% 96% 86% 19%28 100% 100% 100% 96% 94% 88% 19%29 100% 100% 100% 97% 96% 94% 19%30 100% 100% 93% 97% 95% 88% 19%31 100% 100% 88% 88% 74% 12%32 100% 100% 100% 95% 91% 58% 19%33 100% 100% 94% 90% 89% 70% 23%34 100% 100% 96% 96% 82% 33% 14%35 100% 100% 97% 97% 94% 86% 20%36 100% 100% 80% 62% 63% 4%37 100% 100% 92% 91% 91% 68% 15%38 100% 100% 100% 97% 91% 76% 17%39 100% 100% 94% 90% 75% 16%40 100% 100% 93% 95% 91% 79% 17%41 100% 100% 91% 88% 85% 77% 19%42 100% 100% 94% 93% 86% 50% 14%43 100% 100% 100% 96% 93% 82% 18%44 100% 100% 92% 93% 87% 59% 17%45 100% 100% 95% 93% 86% 49% 16%46 100% 100% 94% 95% 92% 84% 17%47 100% 100% 91% 88% 82% 52% 18%48 100% 100% 100% 93% 88% 67% 16%
Recovery of Feed to Underflow
58 of 74
Test 100 150 200 270 400 500 -50049 100% 100% 92% 94% 90% 83% 17%50 100% 100% 93% 93% 85% 63% 18%51 100% 100% 95% 91% 89% 55% 18%52 100% 100% 100% 93% 93% 76% 20%53 100% 100% 93% 91% 88% 38% 19%54 100% 100% 100% 98% 93% 88% 20%55 100% 100% 100% 96% 93% 73% 19%56 100% 100% 92% 93% 90% 67% 19%57 100% 100% 94% 93% 88% 57% 17%58 100% 100% 100% 96% 93% 77% 18%59 100% 100% 95% 96% 90% 75% 19%60 100% 100% 100% 95% 93% 85% 18%61 100% 100% 93% 96% 93% 88% 22%62 100% 100% 88% 86% 80% 60% 15%63 100% 100% 100% 95% 94% 85% 21%64 100% 100% 100% 95% 94% 87% 22%65 100% 100% 94% 95% 94% 80% 20%66 100% 100% 100% 73% 64% 3%67 100% 100% 94% 77% 98% 72% 16%68 100% 100% 100% 95% 92% 85% 18%69 100% 100% 94% 93% 92% 77% 19%70 100% 100% 77% 85% 96% 64% 27%71 100% 100% 92% 94% 91% 64% 17%72 100% 100% 100% 95% 95% 91% 26%73 100% 100% 100% 96% 91% 70% 15%74 100% 100% 92% 90% 82% 87% 16%75 100% 100% 100% 96% 89% 79% 17%76 100% 100% 94% 89% 86% 73% 16%77 100% 100% 95% 96% 83% 78% 20%78 100% 100% 79% 86% 85% 63% 14%79 100% 100% 100% 94% 90% 86% 17%80 100% 100% 92% 93% 89% 82% 17%81 100% 100% 91% 94% 87% 75% 16%8283 100% 100% 93% 95% 90% 78% 18%84 100% 100% 92% 93% 88% 74% 15%85 100% 100% 100% 93% 90% 86% 17%86 100% 100% 100% 96% 94% 89% 19%87 100% 100% 100% 91% 91% 80% 17%88 100% 100% 100% 95% 94% 89% 17%89 100% 100% 100% 95% 89% 85% 18%90 100% 100% 94% 92% 88% 72% 20%91 100% 100% 93% 95% 92% 80% 14%92 100% 100% 94% 93% 89% 76% 19%93 100% 100% 94% 93% 88% 75% 20%94 100% 100% 94% 95% 92% 89% 19%95 100% 100% 100% 95% 92% 82% 18%
Recovery of Feed to Underflow

59 of 74
Test 100 150 200 270 400 500 -50096 100% 100% 94% 93% 83% 52% 18%97 100% 100% 94% 96% 89% 76% 19%98 100% 100% 91% 95% 90% 64% 16%99 100% 100% 100% 95% 96% 87% 22%
100 100% 100% 100% 95% 94% 87% 19%101 100% 100% 100% 96% 93% 84% 21%102 100% 100% 94% 95% 90% 80% 21%103 100% 100% 95% 95% 93% 85% 22%104 100% 100% 94% 94% 91% 79% 19%105 100% 100% 94% 90% 98% 73% 30%106 100% 100% 100% 95% 94% 86% 20%107 100% 100% 92% 94% 91% 89% 19%108 100% 100% 100% 95% 91% 84% 21%109 100% 100% 94% 95% 92% 86% 20%110 100% 100% 93% 93% 88% 69% 16%111 100% 100% 95% 96% 90% 72% 19%112 100% 100% 94% 95% 88% 81% 21%113 100% 100% 88% 90% 83% 76% 17%114 100% 100% 95% 96% 89% 76% 19%115 100% 100% 100% 98% 96% 91% 22%116 100% 100% 100% 95% 93% 90% 18%117 100% 100% 94% 96% 93% 82% 20%118 100% 100% 100% 98% 96% 93% 24%119 100% 100% 100% 95% 91% 82% 20%120 100% 100% 95% 98% 92% 84% 21%121 100% 100% 100% 98% 93% 91% 21%122 100% 100% 94% 93% 89% 81% 21%123 100% 100% 92% 95% 92% 82% 20%124 100% 100% 100% 96% 92% 85% 17%125 100% 100% 94% 92% 86% 65% 19%126 100% 100% 100% 98% 96% 87% 18%127 100% 100% 93% 93% 92% 73% 19%128 100% 100% 100% 96% 93% 85% 17%129 100% 100% 100% 98% 97% 90% 21%130 100% 100% 100% 93% 86% 65% 18%131 100% 100% 100% 98% 94% 86% 19%132 100% 100% 100% 98% 96% 91% 20%
Recovery of Feed to Underflow

60 of 74
Test Date Test Control Test Control Test Control 1 15-Dec 1,2,4 480 0.1432 15-Dec 1 2,4 431 300 0.178 0.1783 16-Dec 1 2 340 440 0.193 0.1384 16-Dec 1 2 370 806 0.155 0.1115 16-Dec 1 2 370 820 0.112 0.0866 16-Dec 1 2 420 720 0.099 0.0767 17-Dec 1 2 221 253 0.198 0.1528 17-Dec 1 2 235 281 0.165 0.1279 17-Dec 1 2 216 414 0.186 0.143
10 17-Dec 1 2 218 330 0.263 0.18811 18-Dec 1 2 376 114 0.135 0.10412 18-Dec 1 2 289 100 0.186 0.14313 18-Dec 1 2 254 259 0.142 0.10914 18-Dec 1 2 407 160 0.143 0.11015 19-Dec 1 2 405 315 0.159 0.12216 19-Dec 1 2 398 329 0.170 0.13117 19-Dec 1 2 410 360 0.156 0.12018 29-Dec 1 2 415 503 0.190 0.14619 29-Dec 1 2 403 427 0.173 0.13320 29-Dec 1 2 395 300 0.151 0.11621 29-Dec 1 2 334 274 0.148 0.11422 30-Dec 1 2 409 120 0.212 0.16323 30-Dec 1 407 0.20524 30-Dec 1 356 0.18625 6-Jan 2 3 397 704 0.091 0.08326 7-Jan 2 3 391 560 0.098 0.08927 8-Jan 2 3 400 771 0.143 0.13028 9-Jan 2 3 384 425 0.188 0.15429 9-Jan 2 3 419 460 0.186 0.15230 9-Jan 2 3 266 495 0.182 0.14931 9-Jan 2 3 292 370 0.187 0.15332 12-Jan 2 3 388 525 0.153 0.13233 12-Jan 2 3 386 179 0.140 0.12134 12-Jan 2 3 314 38 0.136 0.11835 12-Jan 2 3 402 57 0.140 0.12136 13-Jan 2 3 330 438 0.169 0.14637 13-Jan 2 3 333 462 0.180 0.15638 13-Jan 2 3 318 489 0.173 0.14939 14-Jan 2 3 272 179 0.188 0.16240 14-Jan 2 3 259 713 0.117 0.10141 14-Jan 2 3 234 384 0.150 0.12942 15-Jan 2 3 342 507 0.177 0.15343 15-Jan 2 3 289 316 0.175 0.15144 15-Jan 2 3 248 484 0.152 0.13145 15-Jan 2 3 222 284 0.194 0.16746 21-Jan 2 3
Flotation Process ValuesFlotation Bank(s) LTPH Amine Rate
61 of 74
Test Date Test Control Test Control Test Control 47 21-Jan 2 348 21-Jan 2 349 21-Jan 2 350 23-Jan 2 3,451 27-Jan 2 152 28-Jan 1 353 29-Jan 1 354 2-Feb 1 3,455 4-Feb 1 356 4-Feb 1 357 4-Feb 1 358 4-Feb 1 359 5-Feb 1 360 11-Feb 2 161 17-Feb 1 3 352 938 0.101 0.08362 18-Feb 1 3 330 626 0.079 0.06563 18-Feb 1 350 0.06864 18-Feb 1 370 0.05265 23-Feb 1 2 260 427 0.220 0.18066 24-Feb 1 2 366 390 0.193 0.15867 24-Feb 1 2 407 430 0.186 0.15268 24-Feb 1 2 300 785 0.173 0.14169 24-Feb 1 2 246 376 0.156 0.12870 26-Feb 2 3 445 274 0.204 0.16771 26-Feb 2 3 410 390 0.208 0.17072 26-Feb 2 3 295 421 0.139 0.11373 1-Mar 1 388 0.22074 3-Mar 2 3 413 365 0.205 0.16775 3-Mar 2 3 406 390 0.212 0.17476 3-Mar 2 3 353 687 0.220 0.18077 3-Mar 2 3 299 774 0.220 0.18078 4-Mar 2 339 0.14679 8-Mar 2 374 0.10380 9-Mar 2 4 372 481 0.121 0.09981 16-Mar 2 1 329 328 0.187 0.15382 16-Mar 2 1 263 261 0.180 0.14883 16-Mar 2 1 252 144 0.152 0.12484 16-Mar 2 1 200 277 0.102 0.08485 25-Mar 2 419 0.12486 29-Mar 2 214 0.13887 5-Apr 2 382 0.08788 7-Apr 2 1 371 766 0.098 0.08089 7-Apr 2 1 364 786 0.011 0.00990 7-Apr 2 1 412 536 0.059 0.04991 7-Apr 2 1 305 180 0.096 0.07892 3-May 2 1,2,4 345 509 0.130 0.114
Flotation Process ValuesFlotation Bank(s) LTPH Amine Rate

62 of 74
Test Date Test Control Test Control Test Control 93 3-May 2 1,2,4 326 401 0.113 0.11394 3-May 2 1,2,4 256 508 0.118 0.10295 5-May 2 1,2,4 332 598 0.099 0.08396 5-May 2 1,2,4 285 523 0.123 0.10397 5-May 2 1,2,4 297 501 0.117 0.09998 6-May 2 1,2,4 303 459 0.176 0.14899 6-May 2 1,2,4 280 384 0.151 0.127
100 6-May 2 1,2,4 330 411 0.099 0.083101 7-May 2 1,2,4 305 458 0.114 0.096102 7-May 2 1,2,4 292 415 0.114 0.096103 10-May 2 1,2,4 227 563 0.072 0.061104 10-May 2 1,2,4 184 435 0.082 0.069105 10-May 2 1,2,4 301 492 0.070 0.059106 12-May 2 1,2,4 330 518 0.090 0.075107 13-May 2 1,2,4 301 463 0.156 0.131108 13-May 2 1,2,4 293 346 0.171 0.144109 13-May 2 1,2,4 298 462 0.162 0.136110 14-May 2 1,2,4 383 502 0.186 0.157111 14-May 2 1,2,4 324 535 0.176 0.148112 14-May 2 1,2,4 336 509 0.123 0.103113 17-May 1 2,3,4 304 428 0.151 0.129114 17-May 1 2,3,4 234 431 0.128 0.109115 17-May 1 2,3,4 278 493 0.119 0.097116 19-May 1 2,3,4 348 546 0.173 0.142117 19-May 1 2,3,4 285 409 0.184 0.150118 19-May 1 2,3,4 261 501 0.178 0.146119 20-May 1 2,3,4 286 547 0.189 0.148120 20-May 1 2,3,4 239 412 0.184 0.145121 20-May 1 2,3,4 255 358 0.201 0.158122 21-May 1 2,3,4 385 485 0.158 0.124123 21-May 1 2,3,4 404 441 0.201 0.158124 21-May 1 2,3,4 419 503 0.199 0.156125 24-May 1 2,3,4 383 552 0.163 0.128126 24-May 1 2,3,4 233 394 0.169 0.133127 24-May 1 2,3,4 219 389 0.191 0.150128 25-May 1 2,3,4 367 375 0.180 0.142129 25-May 1 2,3,4 288 295 0.203 0.159130 25-May 1 2,3,4 311 355 0.216 0.170131 26-May 1 2,3,4 414 401 0.224 0.176132 26-May 1 2,3,4 345 322 0.234 0.184133 26-May 1 2,3,4 327 314 0.238 0.187
Flotation Process ValuesFlotation Bank(s) LTPH Amine Rate

63 of 74
Upgrade WeightTest Silica Solids Silica Solids Silica Solids d SiO2 Recovery
12 7.18 42.3% 5.72 3.8% 21.26 15.4% 1.46 90.6%3 6.86 42.1% 4.60 35.1% 18.48 16.7% 2.26 83.7%4 6.62 39.1% 3.45 56.8% 17.93 17.6% 3.17 78.1%5 6.55 40.5% 4.86 53.2% 20.71 11.5% 1.69 89.3%6 6.42 43.3% 4.84 51.5% 22.67 10.1% 1.58 91.1%7 7.23 42.3% 4.28 54.3% 19.30 16.3% 2.95 80.4%8 7.49 44.8% 3.81 54.9% 21.03 16.1% 3.68 78.6%9 7.46 39.1% 3.19 48.4% 16.87 19.9% 4.27 68.8%
10 7.67 38.0% 3.51 55.6% 18.06 17.0% 4.16 71.4%11 7.55 39.9% 3.40 47.7% 23.11 18.1% 4.15 78.9%12 7.32 41.5% 2.79 48.2% 20.09 20.2% 4.53 73.8%13 6.85 38.4% 3.01 49.1% 21.30 12.3% 3.84 79.0%14 6.72 43.8% 3.00 49.4% 19.63 20.2% 3.72 77.6%15 7.69 40.7% 3.64 49.9% 22.73 18.4% 4.05 78.8%16 7.78 41.3% 3.47 49.8% 22.93 18.6% 4.31 77.9%17 7.67 43.3% 3.56 49.2% 23.29 19.2% 4.11 79.2%18 8.22 41.0% 3.86 51.9% 23.99 16.8% 4.36 78.3%19 8.15 40.1% 3.88 48.7% 23.49 16.7% 4.27 78.2%20 7.80 42.1% 3.23 48.0% 22.63 18.0% 4.57 76.4%21 7.38 39.6% 2.55 47.8% 20.12 18.7% 4.83 72.5%22 7.59 43.7% 3.19 51.9% 21.92 16.3% 4.40 76.5%23 7.17 42.2% 3.19 51.1% 21.99 15.4% 3.98 78.8%24 7.31 40.9% 2.70 45.5% 22.23 15.5% 4.61 76.4%25 7.36 45.1% 4.46 45.7% 23.67 12.1% 2.90 84.9%26 7.90 41.8% 5.03 44.4% 24.94 12.3% 2.87 85.6%27 7.09 41.3% 4.02 45.9% 22.77 19.5% 3.07 83.6%28 7.87 42.0% 3.77 52.2% 20.44 20.1% 4.10 75.4%29 7.76 40.2% 3.90 48.6% 20.65 19.7% 3.86 77.0%30 7.75 43.2% 3.48 52.3% 21.35 19.7% 4.27 76.1%31 7.69 34.9% 3.41 40.9% 19.28 18.6% 4.28 73.0%32 8.95 41.5% 4.06 45.5% 25.47 14.6% 4.89 77.2%33 9.44 41.9% 4.06 42.5% 25.95 17.7% 5.38 75.4%34 8.45 39.9% 3.62 45.8% 23.47 14.1% 4.83 75.7%35 7.98 41.1% 3.16 47.3% 21.77 14.4% 4.82 74.1%36 8.69 41.2% 3.30 52.9% 20.00 14.6% 5.39 67.7%37 9.97 37.9% 3.32 55.7% 18.94 17.1% 6.65 57.4%38 9.61 41.4% 4.18 49.0% 21.57 16.0% 5.43 68.8%39 9.34 33.7% 2.54 55.1% 16.48 20.5% 6.80 51.2%40 7.68 38.7% 3.74 42.2% 23.01 13.0% 3.94 79.6%41 6.89 41.7% 3.09 48.5% 18.66 9.8% 3.80 75.6%42 7.24 41.6% 3.43 49.6% 16.84 13.7% 3.81 71.6%43 7.39 39.8% 3.60 48.1% 17.79 12.7% 3.79 73.3%44 7.23 41.2% 4.21 4.9% 18.84 9.5% 3.02 79.4%45 7.52 35.5% 3.36 50.5% 15.62 11.1% 4.16 66.1%46 7.58 40.4% 3.24 50.5% 20.14 16.9% 4.34 74.3%
Test Flotation Bank PerformanceFloat Feed Float Con Float Tails

64 of 74
Upgrade WeightTest Silica Solids Silica Solids Silica Solids d SiO2 Recovery47 7.46 37.9% 3.12 47.8% 20.50 16.9% 4.34 75.0%48 7.77 35.8% 3.30 42.7% 21.33 14.2% 4.47 75.2%49 7.05 42.4% 3.10 46.9% 20.13 12.8% 3.95 76.8%50 7.80 39.9% 3.28 52.9% 19.32 18.7% 4.52 71.8%51 7.30 40.4% 4.14 41.1% 24.35 13.8% 3.16 84.4%52 7.06 42.8% 3.97 53.8% 22.93 12.1% 3.09 83.7%53 6.21 42.9% 3.97 51.2% 23.55 10.6% 2.24 88.6%54 7.27 40.3% 3.29 52.5% 20.25 14.6% 3.98 76.5%55 6.66 41.3% 4.50 40.9% 25.79 11.9% 2.16 89.9%56 6.96 40.0% 5.39 51.6% 24.68 7.1% 1.57 91.9%57 6.70 43.3% 5.36 52.9% 24.25 7.3% 1.34 92.9%58 7.67 40.3% 4.18 52.8% 21.48 7.7% 3.49 79.8%59 7.76 36.3% 4.90 49.8% 24.43 10.4% 2.86 85.4%60 6.71 41.1% 3.97 49.4% 23.13 13.7% 2.74 85.7%61 6.41 39.9% 4.41 44.0% 25.20 9.6% 2.00 90.4%62 6.80 40.5% 5.03 45.4% 25.03 9.5% 1.77 91.2%63 6.56 39.2% 3.67 39.1% 23.96 7.7% 2.89 85.8%64 6.63 40.0% 4.73 45.0% 26.90 11.4% 1.90 91.4%65 7.91 39.6% 4.13 44.0% 24.27 16.0% 3.78 81.2%66 6.77 40.0% 4.08 43.7% 23.49 12.7% 2.69 86.1%67 6.78 44.2% 4.25 44.0% 22.21 10.8% 2.53 85.9%68 6.86 39.2% 4.10 41.9% 22.13 10.6% 2.76 84.7%69 6.44 37.8% 3.46 37.9% 20.19 14.6% 2.98 82.2%70 6.91 41.6% 3.81 59.2% 21.64 18.0% 3.10 82.6%71 6.89 40.7% 3.80 40.4% 22.96 18.4% 3.09 83.9%72 7.22 41.5% 4.37 38.0% 24.28 17.8% 2.85 85.7%73 6.66 40.6% 3.54 49.1% 21.18 14.3% 3.12 82.3%74 7.20 41.7% 3.87 45.4% 21.88 14.2% 3.33 81.5%75 7.33 40.7% 4.23 49.0% 22.52 13.6% 3.10 83.1%76 7.94 37.4% 5.65 39.5% 25.04 9.3% 2.29 88.2%77 8.48 33.9% 5.70 35.9% 27.47 9.7% 2.78 87.2%78 6.89 39.4% 4.09 36.7% 22.77 11.4% 2.80 85.0%79 6.85 36.2% 3.96 36.0% 25.17 15.0% 2.89 86.4%80 6.99 38.8% 4.00 41.7% 24.82 15.3% 2.99 85.6%81 6.69 39.2% 3.34 39.9% 20.41 19.9% 3.35 80.4%82 6.08 3.9% 2.80 36.2% 17.89 17.8% 3.28 78.3%83 6.35 31.1% 2.83 32.8% 17.64 15.2% 3.52 76.2%84 5.72 37.2% 3.47 35.7% 18.65 9.1% 2.25 85.2%85 6.96 43.0% 3.69 42.3% 23.82 17.2% 3.27 83.8%86 6.24 31.2% 4.40 26.4% 18.58 12.6% 1.84 87.0%87 6.48 41.9% 3.80 42.2% 23.74 13.4% 2.68 86.6%88 6.63 43.7% 4.49 44.6% 21.17 10.0% 2.14 87.2%89 7.09 41.5% 4.93 39.5% 23.27 12.8% 2.16 88.2%90 6.17 41.9% 4.26 40.7% 22.90 9.2% 1.91 89.8%91 6.48 41.8% 5.22 43.3% 23.53 15.7% 1.26 93.1%92 5.63 46.1% 4.03 45.7% 25.15 10.8% 1.60 92.4%
Test Flotation Bank PerformanceFloat Feed Float Con Float Tails

65 of 74
Upgrade WeightTest Silica Solids Silica Solids Silica Solids d SiO2 Recovery93 6.22 44.8% 4.83 45.0% 23.46 12.3% 1.39 92.5%94 5.64 42.1% 4.53 45.9% 21.36 12.7% 1.11 93.4%95 6.05 39.6% 4.89 43.8% 20.67 11.3% 1.16 92.6%96 6.31 42.0% 4.88 44.5% 22.07 15.9% 1.43 91.7%97 6.03 44.1% 5.01 47.3% 20.38 13.2% 1.02 93.4%98 6.59 44.8% 4.04 45.0% 22.41 17.9% 2.55 86.1%99 6.37 47.2% 3.83 45.7% 22.15 16.2% 2.54 86.1%
100 6.70 44.1% 5.14 43.7% 24.50 14.2% 1.56 91.9%101 7.47 42.8% 4.96 37.7% 24.79 15.0% 2.51 87.3%102 7.32 41.8% 4.88 38.7% 25.47 13.7% 2.44 88.1%103 6.13 39.9% 4.33 39.8% 22.72 17.4% 1.80 90.2%104 6.43 41.1% 4.69 42.3% 22.46 15.7% 1.74 90.2%105 6.10 45.3% 5.35 44.1% 24.61 12.1% 0.75 96.1%106 6.63 43.4% 5.26 43.5% 25.80 9.5% 1.37 93.3%107 7.59 43.7% 6.28 42.4% 26.23 11.6% 1.31 93.4%108 8.19 39.9% 5.83 25.2% 25.91 18.1% 2.36 88.2%109 7.84 42.5% 5.74 26.0% 26.02 18.7% 2.10 89.6%110 7.44 44.1% 4.44 45.5% 25.59 25.6% 3.00 85.8%111 6.62 43.8% 5.12 26.6% 25.22 14.8% 1.50 92.5%112 6.26 44.6% 5.21 29.1% 23.45 21.5% 1.05 94.2%113 6.59 43.8% 4.05 44.7% 24.36 15.8% 2.54 87.5%114 6.53 42.6% 3.90 39.3% 23.58 19.1% 2.63 86.6%115 6.71 44.9% 5.01 45.4% 25.04 13.8% 1.70 91.5%116 6.13 41.2% 4.59 46.4% 21.35 11.0% 1.54 90.8%117 6.10 47.5% 5.05 44.1% 22.81 15.8% 1.05 94.1%118 5.80 45.2% 5.03 45.3% 21.66 13.4% 0.77 95.4%119 6.72 42.5% 5.19 44.4% 21.91 12.2% 1.53 90.8%120 5.80 40.3% 3.61 38.9% 21.10 13.4% 2.19 87.5%121 6.71 41.0% 4.95 42.8% 22.18 13.0% 1.76 89.8%122 6.61 43.3% 4.64 36.4% 26.78 21.2% 1.97 91.1%123 6.66 44.3% 5.06 29.2% 25.51 15.7% 1.60 92.2%124 6.43 44.7% 4.79 28.8% 24.97 17.1% 1.64 91.9%125 6.73 45.1% 4.59 49.5% 26.46 14.6% 2.14 90.2%126 6.66 38.3% 4.53 37.7% 22.70 17.2% 2.13 88.3%127 6.63 37.9% 3.40 39.2% 20.00 16.5% 3.23 80.5%128 6.63 43.8% 3.25 49.9% 24.28 15.1% 3.38 83.9%129 7.07 43.0% 3.08 46.4% 21.63 18.5% 3.99 78.5%130 7.36 45.4% 3.15 52.2% 22.66 17.6% 4.21 78.4%131 7.10 44.2% 3.92 45.8% 23.86 24.5% 3.18 84.1%132 7.26 36.8% 3.14 44.1% 20.46 24.3% 4.12 76.2%133 6.95 43.9% 4.50 43.0% 23.66 24.2% 2.45 87.2%
Test Flotation Bank PerformanceFloat Con Float TailsFloat Feed

66 of 74
Upgrade WeightTest Silica Solids Silica Solids Silica Solids d SiO2 Recovery
1 5.46 44.73 3.98 52.03 15.29 18.43 1.48 86.9%2 5.72 45.60 3.77 59.45 10.25 21.95 1.95 69.9%3 5.12 33.70 3.41 45.90 13.44 18.90 1.71 83.0%4 5.40 37.50 3.47 51.60 12.48 21.30 1.93 78.6%5 5.22 47.40 4.30 48.20 19.42 17.30 0.92 93.9%6 5.28 42.30 4.03 46.70 18.32 20.00 1.25 91.3%7 5.63 26.60 2.40 43.80 10.29 15.80 3.23 59.1%8 6.04 39.10 2.95 38.70 10.90 17.10 3.09 61.1%9 5.82 31.60 3.77 36.10 13.18 17.80 2.05 78.2%
10 6.08 43.60 4.76 43.70 18.73 20.50 1.32 90.6%11 6.02 28.00 2.81 51.80 8.81 10.50 3.21 46.5%12 6.08 30.10 2.52 49.30 8.62 10.00 3.56 41.6%13 5.49 43.60 3.46 46.10 16.64 11.80 2.03 84.6%14 5.02 39.90 2.59 44.90 14.05 11.20 2.43 78.8%15 5.55 44.61 3.54 49.33 14.03 21.18 2.01 80.8%16 5.42 29.30 2.43 39.80 11.85 19.90 2.99 68.3%17 6.11 37.70 3.82 42.00 16.50 20.50 2.29 81.9%18 6.18 33.40 2.88 36.50 14.75 12.00 3.30 72.2%19 6.26 28.40 3.28 38.10 14.93 12.40 2.98 74.4%20 4.92 17.80 1.88 18.30 9.52 7.40 3.04 60.2%21 6.21 21.10 3.19 29.20 10.30 14.00 3.02 57.5%22 6.43 38.81 2.82 49.96 14.32 11.85 3.61 68.6%232425 5.54 42.29 3.83 42.08 17.38 7.11 1.71 87.4%26 5.32 39.70 3.59 40.85 21.50 1.03 1.73 90.3%27 5.15 40.23 3.07 43.45 15.49 23.03 2.08 83.3%28 5.84 42.99 3.89 47.10 17.08 25.32 1.95 85.2%29 5.62 41.30 3.70 45.20 16.23 24.80 1.92 84.7%30 6.15 40.60 4.09 43.60 15.95 22.10 2.06 82.6%31 6.82 37.10 4.50 44.50 18.54 23.00 2.32 83.5%32 5.79 40.96 3.22 44.38 17.39 20.66 2.57 81.9%33 6.01 28.60 2.79 44.80 8.14 17.20 3.22 39.8%34 5.51 29.50 2.06 48.60 7.42 19.10 3.45 35.6%35 6.39 29.90 1.81 52.90 7.80 21.00 4.58 23.5%36 5.95 40.41 3.94 43.81 17.73 22.35 2.01 85.4%37 5.71 42.20 3.79 45.10 17.80 22.80 1.92 86.3%38 5.77 44.70 3.98 45.30 17.39 22.20 1.79 86.7%39 5.35 42.70 3.18 48.10 14.19 16.90 2.17 80.3%40 4.79 40.80 2.58 47.90 12.35 20.00 2.21 77.4%41 4.67 36.50 2.51 40.50 11.64 19.70 2.16 76.3%42 5.55 43.02 3.84 46.89 16.97 20.43 1.71 87.0%43 5.50 41.00 3.30 47.90 15.18 21.90 2.20 81.5%44 5.13 46.00 3.97 48.60 6.45 18.10 1.16 53.2%45 5.94 44.00 4.31 47.00 20.21 20.90 1.63 89.7%46 6.01 41.91 3.44 48.35 16.49 18.62 2.57 80.3%
Control Flotation Banks PerformanceFloat Feed Float Con Float Tails
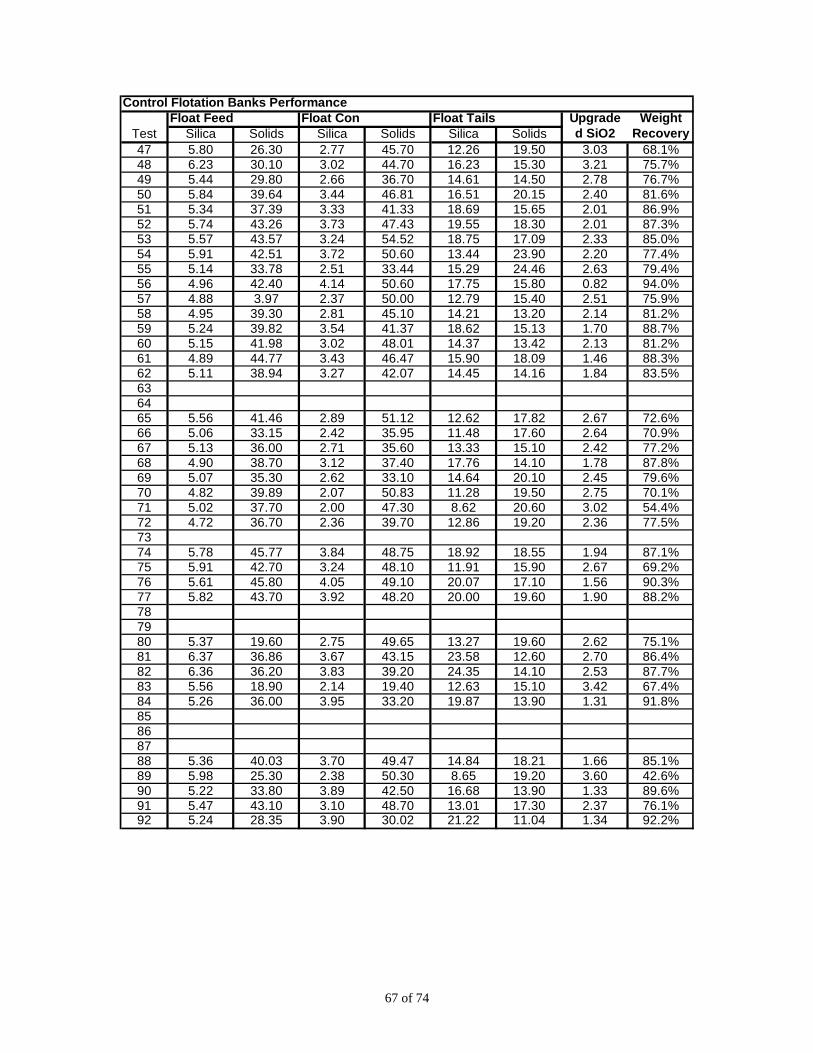
67 of 74
Upgrade WeightTest Silica Solids Silica Solids Silica Solids d SiO2 Recovery47 5.80 26.30 2.77 45.70 12.26 19.50 3.03 68.1%48 6.23 30.10 3.02 44.70 16.23 15.30 3.21 75.7%49 5.44 29.80 2.66 36.70 14.61 14.50 2.78 76.7%50 5.84 39.64 3.44 46.81 16.51 20.15 2.40 81.6%51 5.34 37.39 3.33 41.33 18.69 15.65 2.01 86.9%52 5.74 43.26 3.73 47.43 19.55 18.30 2.01 87.3%53 5.57 43.57 3.24 54.52 18.75 17.09 2.33 85.0%54 5.91 42.51 3.72 50.60 13.44 23.90 2.20 77.4%55 5.14 33.78 2.51 33.44 15.29 24.46 2.63 79.4%56 4.96 42.40 4.14 50.60 17.75 15.80 0.82 94.0%57 4.88 3.97 2.37 50.00 12.79 15.40 2.51 75.9%58 4.95 39.30 2.81 45.10 14.21 13.20 2.14 81.2%59 5.24 39.82 3.54 41.37 18.62 15.13 1.70 88.7%60 5.15 41.98 3.02 48.01 14.37 13.42 2.13 81.2%61 4.89 44.77 3.43 46.47 15.90 18.09 1.46 88.3%62 5.11 38.94 3.27 42.07 14.45 14.16 1.84 83.5%636465 5.56 41.46 2.89 51.12 12.62 17.82 2.67 72.6%66 5.06 33.15 2.42 35.95 11.48 17.60 2.64 70.9%67 5.13 36.00 2.71 35.60 13.33 15.10 2.42 77.2%68 4.90 38.70 3.12 37.40 17.76 14.10 1.78 87.8%69 5.07 35.30 2.62 33.10 14.64 20.10 2.45 79.6%70 4.82 39.89 2.07 50.83 11.28 19.50 2.75 70.1%71 5.02 37.70 2.00 47.30 8.62 20.60 3.02 54.4%72 4.72 36.70 2.36 39.70 12.86 19.20 2.36 77.5%7374 5.78 45.77 3.84 48.75 18.92 18.55 1.94 87.1%75 5.91 42.70 3.24 48.10 11.91 15.90 2.67 69.2%76 5.61 45.80 4.05 49.10 20.07 17.10 1.56 90.3%77 5.82 43.70 3.92 48.20 20.00 19.60 1.90 88.2%787980 5.37 19.60 2.75 49.65 13.27 19.60 2.62 75.1%81 6.37 36.86 3.67 43.15 23.58 12.60 2.70 86.4%82 6.36 36.20 3.83 39.20 24.35 14.10 2.53 87.7%83 5.56 18.90 2.14 19.40 12.63 15.10 3.42 67.4%84 5.26 36.00 3.95 33.20 19.87 13.90 1.31 91.8%85868788 5.36 40.03 3.70 49.47 14.84 18.21 1.66 85.1%89 5.98 25.30 2.38 50.30 8.65 19.20 3.60 42.6%90 5.22 33.80 3.89 42.50 16.68 13.90 1.33 89.6%91 5.47 43.10 3.10 48.70 13.01 17.30 2.37 76.1%92 5.24 28.35 3.90 30.02 21.22 11.04 1.34 92.2%
Control Flotation Banks PerformanceFloat Feed Float Con Float Tails

68 of 74
Upgrade WeightTest Silica Solids Silica Solids Silica Solids d SiO2 Recovery93 4.87 27.81 3.24 28.71 18.87 11.48 1.63 89.6%94 5.08 31.06 3.97 31.65 20.92 9.22 1.11 93.5%95 5.08 15.64 4.12 16.12 22.12 8.33 0.96 94.6%96 5.20 26.37 3.45 30.65 18.18 11.30 1.75 88.1%97 4.98 29.14 3.51 28.82 18.56 11.03 1.47 90.2%98 5.44 28.28 3.31 31.72 18.92 12.06 2.13 86.4%99 5.67 28.44 3.10 31.75 18.33 12.52 2.56 83.2%
100 5.45 28.45 3.67 31.79 21.04 11.33 1.78 89.8%101 5.39 29.35 3.53 28.21 20.84 11.75 1.86 89.3%102 5.28 23.02 2.74 25.02 17.22 12.46 2.54 82.5%103 4.85 29.78 3.71 29.85 24.96 8.70 1.14 94.7%104 5.03 27.44 3.58 27.84 22.19 7.30 1.45 92.2%105 4.96 27.64 4.08 28.21 25.97 9.63 0.87 96.0%106 5.05 29.95 3.75 30.65 22.90 9.96 1.30 93.2%107 5.31 29.35 3.15 32.56 20.17 10.74 2.16 87.3%108 5.28 27.53 2.83 27.40 15.93 10.95 2.45 81.3%109 5.19 27.00 3.17 28.57 19.19 11.11 2.02 87.4%110 5.32 30.49 3.34 35.17 18.79 11.17 1.98 87.2%111 5.41 26.87 3.36 30.66 18.31 8.88 2.05 86.3%112 5.23 26.87 4.72 21.42 17.47 8.10 0.51 96.0%113 5.27 26.59 3.15 28.97 18.67 11.24 2.12 86.3%114 5.53 25.82 3.34 27.02 21.01 12.11 2.19 87.6%115 5.29 27.37 3.44 28.33 21.11 10.81 1.85 89.5%116 5.23 29.81 3.81 32.69 19.32 10.32 1.42 90.9%117 5.04 28.17 3.36 31.72 18.00 10.95 1.68 88.5%118 5.16 28.64 3.67 31.55 18.78 9.28 1.49 90.1%119 5.20 27.47 3.47 29.98 17.50 11.16 1.72 87.7%120 4.60 14.24 2.39 16.06 13.33 8.29 2.21 79.8%121 5.84 10.69 3.42 19.32 16.37 8.10 2.42 81.3%122 5.01 16.01 3.95 14.30 18.31 10.56 1.06 92.6%123 5.68 25.70 3.68 29.60 16.87 13.41 2.00 84.8%124 5.38 28.91 3.54 34.05 17.36 12.48 1.84 86.7%125 5.60 30.25 3.58 36.20 17.40 13.14 2.02 85.4%126 5.75 26.91 3.41 32.80 18.78 13.55 2.34 84.8%127 5.93 29.75 4.10 33.39 19.41 11.94 1.83 88.0%128 5.99 30.11 4.07 34.90 15.75 17.65 1.93 83.5%129 6.02 27.24 3.22 32.46 16.29 13.36 2.80 78.6%130 5.96 29.58 3.80 34.50 16.69 13.62 2.17 83.2%131 5.70 30.15 3.90 35.04 14.06 12.84 1.79 82.3%132 5.50 29.13 3.31 33.73 13.44 13.74 2.20 78.3%133 5.96 25.93 3.80 31.42 16.73 13.43 2.17 83.3%
Control Flotation Banks PerformanceFloat Feed Float Con Float Tails
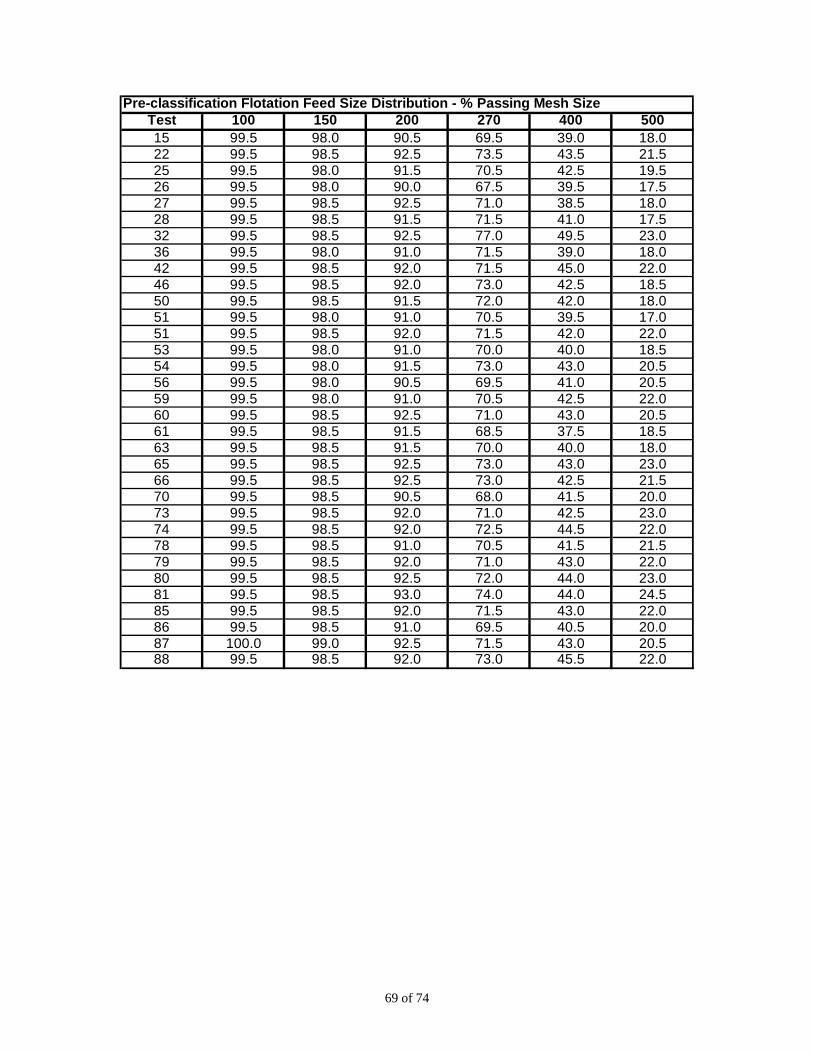
69 of 74
Test 100 150 200 270 400 50015 99.5 98.0 90.5 69.5 39.0 18.022 99.5 98.5 92.5 73.5 43.5 21.525 99.5 98.0 91.5 70.5 42.5 19.526 99.5 98.0 90.0 67.5 39.5 17.527 99.5 98.5 92.5 71.0 38.5 18.028 99.5 98.5 91.5 71.5 41.0 17.532 99.5 98.5 92.5 77.0 49.5 23.036 99.5 98.0 91.0 71.5 39.0 18.042 99.5 98.5 92.0 71.5 45.0 22.046 99.5 98.5 92.0 73.0 42.5 18.550 99.5 98.5 91.5 72.0 42.0 18.051 99.5 98.0 91.0 70.5 39.5 17.051 99.5 98.5 92.0 71.5 42.0 22.053 99.5 98.0 91.0 70.0 40.0 18.554 99.5 98.0 91.5 73.0 43.0 20.556 99.5 98.0 90.5 69.5 41.0 20.559 99.5 98.0 91.0 70.5 42.5 22.060 99.5 98.5 92.5 71.0 43.0 20.561 99.5 98.5 91.5 68.5 37.5 18.563 99.5 98.5 91.5 70.0 40.0 18.065 99.5 98.5 92.5 73.0 43.0 23.066 99.5 98.5 92.5 73.0 42.5 21.570 99.5 98.5 90.5 68.0 41.5 20.073 99.5 98.5 92.0 71.0 42.5 23.074 99.5 98.5 92.0 72.5 44.5 22.078 99.5 98.5 91.0 70.5 41.5 21.579 99.5 98.5 92.0 71.0 43.0 22.080 99.5 98.5 92.5 72.0 44.0 23.081 99.5 98.5 93.0 74.0 44.0 24.585 99.5 98.5 92.0 71.5 43.0 22.086 99.5 98.5 91.0 69.5 40.5 20.087 100.0 99.0 92.5 71.5 43.0 20.588 99.5 98.5 92.0 73.0 45.5 22.0
Pre-classification Flotation Feed Size Distribution - % Passing Mesh Size

70 of 74
Test 100 150 200 270 400 50015 99.0 97.5 92.0 68.5 34.0 14.522 100.0 99.0 94.5 72.5 40.5 19.025 99.0 97.5 92.0 70.5 38.5 17.526 99.5 98.0 91.0 69.5 36.0 16.527 99.5 98.0 93.0 72.0 38.0 16.528 99.5 98.0 93.0 73.0 36.0 14.032 99.0 98.0 93.5 78.0 46.5 20.536 99.5 98.0 93.5 74.5 37.5 14.042 99.5 98.5 93.5 72.5 38.5 15.046 99.0 98.0 93.5 72.5 38.5 15.550 99.5 98.5 93.5 71.5 37.0 15.551 99.0 98.0 92.0 70.0 36.0 17.551 99.5 98.0 92.5 71.0 36.0 16.053 99.5 98.0 91.5 68.0 35.5 17.054 99.5 98.5 93.5 72.0 39.5 16.556 99.0 97.5 90.0 66.5 38.0 18.559 99.5 98.0 91.5 70.0 41.0 19.560 99.5 98.5 92.5 71.0 38.5 18.061 99.5 98.5 92.0 68.0 36.0 17.563 99.5 98.5 91.5 68.0 37.5 16.065 99.5 98.5 93.0 72.0 39.0 18.566 100.0 99.0 93.5 72.0 39.5 18.070 99.5 98.0 91.0 67.5 37.0 17.573 99.5 98.5 93.0 71.0 38.0 18.074 99.5 98.5 93.5 73.5 40.0 19.578 99.5 99.0 92.0 69.5 38.0 20.079 99.5 98.5 92.5 70.5 39.5 20.580 99.5 98.5 93.5 72.0 38.5 17.581 99.5 98.5 93.5 72.0 41.0 21.585 99.5 98.5 93.0 71.5 41.0 21.086 99.5 98.5 92.0 68.5 38.5 19.087 100.0 99.0 93.5 72.5 43.0 20.588 99.5 98.5 93.0 72.0 43.0 20.5
Pre-classification Flotation Concentrate Size Distribution - % Passing Mesh Size

71 of 74
Test 100 150 200 270 400 50015 99.5 97.0 83.0 60.0 42.5 30.522 99.5 98.0 86.0 64.0 45.5 32.025 99.5 97.5 85.0 62.0 45.5 34.026 99.5 97.5 83.5 60.5 44.5 33.027 99.5 98.0 85.0 62.0 44.0 33.028 100.0 98.5 86.5 65.5 49.0 35.032 100.0 98.5 86.5 63.5 46.0 33.036 100.0 98.5 85.5 65.5 47.5 33.542 99.5 98.5 87.5 68.5 53.0 39.046 100.0 98.5 86.5 65.5 48.5 35.050 99.5 98.0 86.0 65.5 49.0 34.051 99.5 98.0 85.0 62.0 45.5 35.051 100.0 98.5 85.5 63.5 48.5 38.553 99.8 97.5 83.5 61.5 46.0 36.554 99.5 98.0 86.5 68.0 51.5 37.056 99.5 97.5 84.5 63.0 47.0 37.059 99.5 98.0 86.5 67.0 51.0 41.560 99.5 98.0 86.5 65.0 49.5 38.561 100.0 98.5 86.0 66.0 52.0 44.563 99.5 98.0 86.0 63.0 45.0 35.065 99.5 98.5 86.5 64.0 46.0 35.566 99.5 98.0 86.5 66.0 49.0 38.570 99.5 98.0 85.0 63.5 49.0 38.573 99.5 98.0 86.0 65.5 51.5 41.074 99.5 98.0 85.5 64.0 49.0 38.578 99.5 98.0 86.0 65.5 51.0 41.579 99.5 98.0 85.5 62.0 46.0 36.580 99.5 98.0 86.0 63.0 48.0 38.581 99.5 98.0 87.5 67.0 49.0 38.085 100.0 98.5 85.0 62.5 46.5 35.586 99.5 98.5 89.5 71.0 56.0 47.587 100.0 98.5 85.5 63.5 47.5 36.088 100.0 99.0 90.5 73.5 57.5 46.0
Pre-classification Flotation Tails Size Distribution - % Passing Mesh Size

72 of 74
Test 100 150 200 270 400 50015 100.0 99.5 96.0 84.5 67.0 54.022 99.5 98.5 94.0 80.5 64.0 51.025 99.5 98.5 94.5 81.5 64.5 51.526 99.5 99.0 95.5 84.5 66.5 52.027 100.0 99.5 96.0 83.5 65.5 52.028 100.0 99.5 96.5 86.0 67.0 53.532 99.5 99.0 95.5 84.5 67.5 53.536 99.5 99.0 95.0 82.5 65.5 53.042 100.0 99.5 96.5 87.0 70.5 57.046 100.0 99.5 96.0 85.5 69.5 56.550 100.0 99.5 96.5 86.5 68.0 55.051 100.0 99.5 96.0 84.0 67.5 55.552 100.0 99.0 95.5 84.5 67.5 55.053 99.5 98.5 94.0 82.0 65.0 51.554 99.5 99.0 95.5 85.0 69.0 55.554 99.5 99.0 95.5 85.0 69.0 55.556 99.5 99.0 93.5 79.5 63.5 51.059 99.5 99.0 94.5 82.0 66.5 53.560 100.0 99.5 95.5 82.5 66.0 53.061 100.0 99.5 95.5 84.5 67.5 54.063 99.5 99.0 93.5 78.5 62.0 49.565 100.0 99.5 96.5 85.5 68.5 55.566 99.5 99.0 96.0 85.0 67.5 54.570 100.0 99.5 96.0 84.5 67.5 55.074 100.0 99.5 95.5 82.5 66.0 53.580 100.0 99.5 96.0 85.5 68.0 54.581 100.0 99.5 96.0 83.0 67.0 55.088 99.5 99.0 95.5 84.5 68.5 54.5
Control Flotation Feed Size Distribution - % Passing Mesh Size

73 of 74
Test 100 150 200 270 400 50015 100.0 99.5 96.0 85.5 66.5 51.022 99.5 98.5 94.5 82.0 61.5 44.525 99.5 99.0 95.0 82.5 66.5 51.526 99.5 99.0 96.0 86.0 70.0 54.027 99.5 99.0 96.0 83.0 61.0 44.528 99.5 99.0 96.0 86.5 67.5 50.032 100.0 99.5 96.5 87.0 69.0 51.036 99.5 99.0 95.5 84.0 66.0 50.542 100.0 99.5 96.5 87.5 71.0 55.046 100.0 99.5 96.5 86.5 68.0 52.550 100.0 99.5 97.0 89.0 74.0 54.551 100.0 99.5 96.5 86.0 68.5 53.052 100.0 99.5 96.0 85.0 67.5 54.053 100.0 99.0 95.0 81.5 63.5 49.554 99.5 98.5 95.0 85.5 66.0 50.554 100.0 99.0 96.0 87.0 68.5 52.556 99.5 99.0 94.0 81.0 66.5 46.559 100.0 99.5 95.0 83.5 65.5 49.560 99.5 99.0 95.0 81.5 64.5 49.061 100.0 99.5 95.5 84.0 65.0 50.563 99.5 98.5 92.5 79.0 60.0 44.565 99.5 99.0 96.0 85.5 66.0 49.566 99.5 99.0 96.5 87.0 67.0 48.070 99.5 99.0 96.0 83.5 63.0 45.574 99.5 99.0 95.0 83.0 65.5 52.080 100.0 99.5 96.5 85.5 67.5 50.081 100.0 99.5 96.0 84.0 66.0 52.588 100.0 99.5 96.5 86.0 69.5 54.0
Control Flotation Concentrate Size Distribution - % Passing Mesh Size
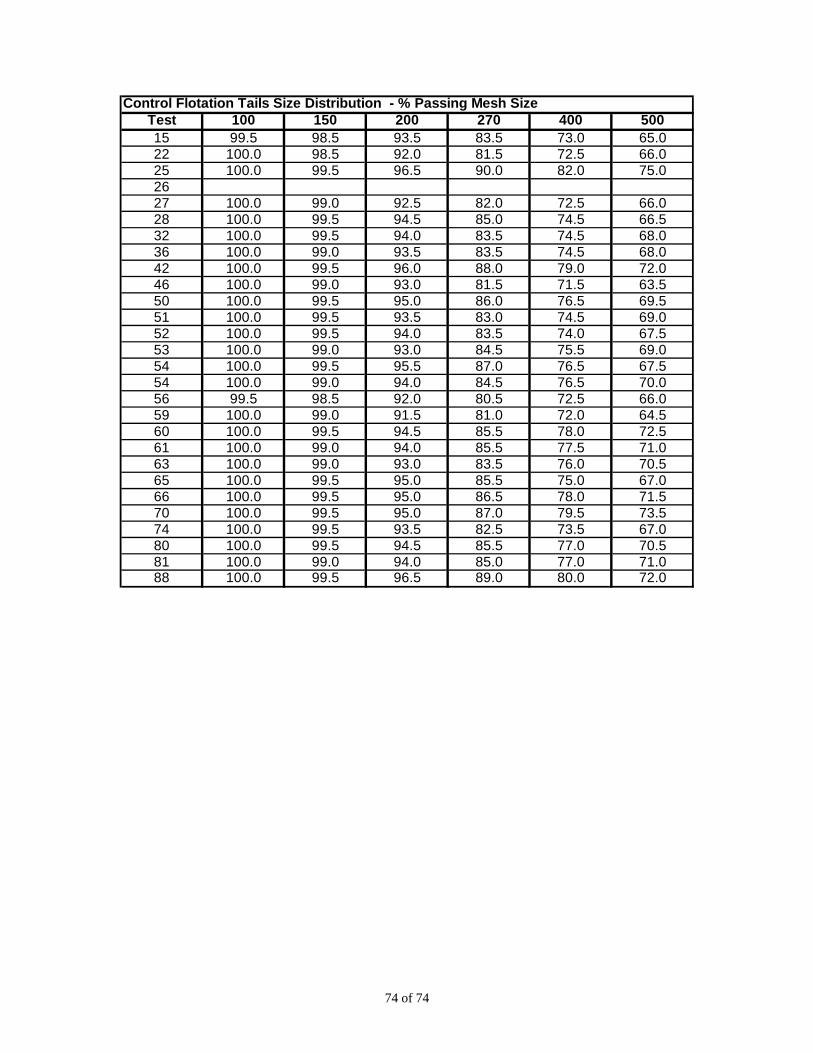
74 of 74
Test 100 150 200 270 400 50015 99.5 98.5 93.5 83.5 73.0 65.022 100.0 98.5 92.0 81.5 72.5 66.025 100.0 99.5 96.5 90.0 82.0 75.02627 100.0 99.0 92.5 82.0 72.5 66.028 100.0 99.5 94.5 85.0 74.5 66.532 100.0 99.5 94.0 83.5 74.5 68.036 100.0 99.0 93.5 83.5 74.5 68.042 100.0 99.5 96.0 88.0 79.0 72.046 100.0 99.0 93.0 81.5 71.5 63.550 100.0 99.5 95.0 86.0 76.5 69.551 100.0 99.5 93.5 83.0 74.5 69.052 100.0 99.5 94.0 83.5 74.0 67.553 100.0 99.0 93.0 84.5 75.5 69.054 100.0 99.5 95.5 87.0 76.5 67.554 100.0 99.0 94.0 84.5 76.5 70.056 99.5 98.5 92.0 80.5 72.5 66.059 100.0 99.0 91.5 81.0 72.0 64.560 100.0 99.5 94.5 85.5 78.0 72.561 100.0 99.0 94.0 85.5 77.5 71.063 100.0 99.0 93.0 83.5 76.0 70.565 100.0 99.5 95.0 85.5 75.0 67.066 100.0 99.5 95.0 86.5 78.0 71.570 100.0 99.5 95.0 87.0 79.5 73.574 100.0 99.5 93.5 82.5 73.5 67.080 100.0 99.5 94.5 85.5 77.0 70.581 100.0 99.0 94.0 85.0 77.0 71.088 100.0 99.5 96.5 89.0 80.0 72.0
Control Flotation Tails Size Distribution - % Passing Mesh Size