Embed Size (px)
Citation preview

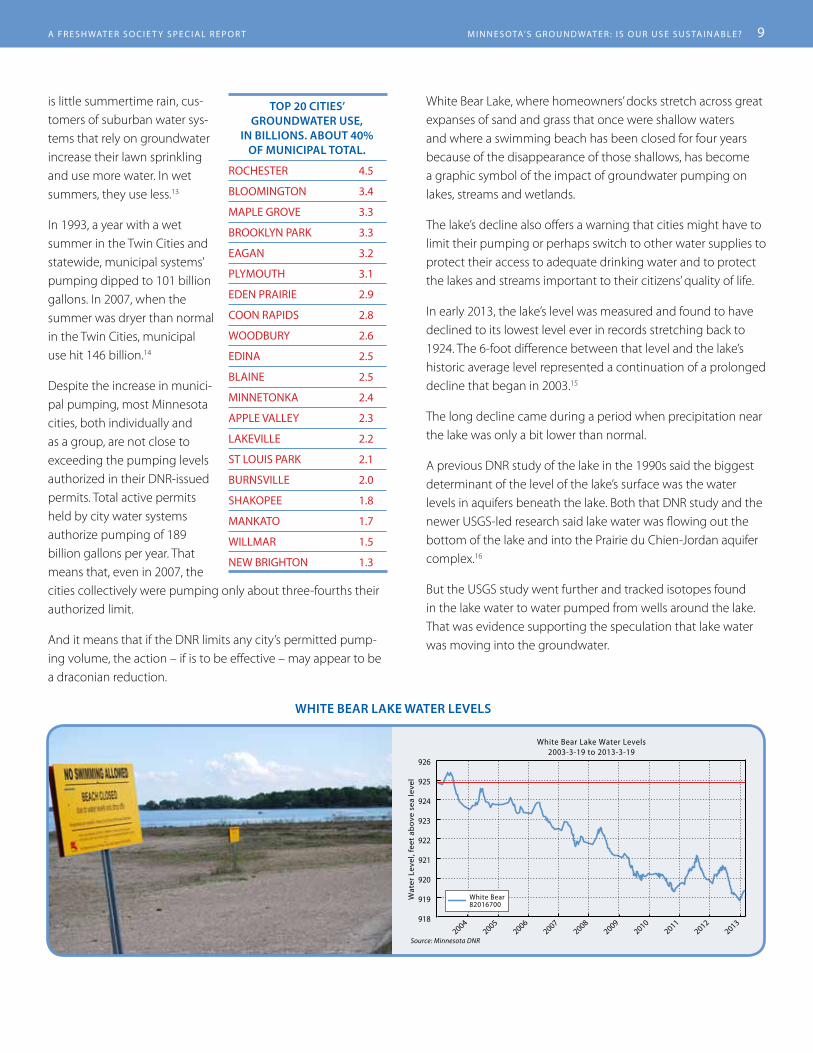
White Bear Lake water levels2003 – 2013
InsIde:
Our conclusions and recommendations. Page 2
Over-pumping threatens groundwater sustainability. Page 3
Areas of concern across the state. Page 5
Groundwater pumping grows faster than population. Page17
Enforcement shortcomings undermine sustainability effort. Page 19
Minnesota’s Groundwater: Is our use sustainable?A Freshwater Society special report / April 2013
Educating and inspiring people to value, conserve and protect water resources

2 M i n n E s OtA’s G r O u n d wAt E r : i s O u r u s E s u s tA i n A b l E ? A F r E s h wAt E r s O c i E t y s p E c i A l r E p O r t
our conclusIons and recommendatIons
The big decline White Bear Lake experienced in recent years graphically illustrates the impact the pumping of groundwater for all the activities of modern life can have on cherished surface waters.
It is a powerful reminder that – even in Minnesota, the Land of 10,000 Lakes – our groundwater and our lakes, streams and wetlands are limited resources.
This report on groundwater by the Freshwater Society is a significant effort to inform Minnesotans about the demands on our groundwater resources and the limitations those resources face. We offer these findings, and make these recommenda-tions, to our fellow citizens and to our policy-makers:
 current levels of groundwater pumping already are unsustainable in some parts of the state. Further increases – beyond the 31 percent increase our analysis estimated occurred in permitted and reported pumping from 1988 through 2011 – could deprive both humans and eco-systems of the water they need to thrive. we urge all Minnesotans to practice conservation in all their uses of water. we urge policy-makers to set limits on water appropriation permits that will ensure sustainable use.
 the department of natural resources’ talk of creating groundwater management areas in parts of the state where groundwater is stressed by over-use or pollution must lead to action, not just discussion. it is important for the legislature to appropriate money for work on ground-water management area, but lack of an additional appro-priation is not sufficient reason for the agency to fail to act.
Âwe urge the department of natural resources to devote significantly more effort enforcing the law requiring permits for water appropriations of 10,000 gallons per day or 1 million gallons per year. well owners who flout the permitting law get an unfair advantage over their busi-ness competitors. Failure to report unpermitted pumping deprives the dnr of data it needs to make informed decisions on water-appropriation requests.
 the dnr’s ability to enforce the law requiring well owners to obtain permits for groundwater appropriations is hampered by a time-consuming enforcement process that requires misdemeanor prosecution of violators by sometimes-unwilling county attorneys. we urge lawmakers to give the dnr the authority it has sought to impose civil fines against violators.
 At present, a Minnesotan who wants to install a high-capacity well is required to notify the Minnesota health department of plans to drill the well, then drill the well and install a pump, and then – later – seek a permit from the dnr to use the well. the well-owner’s investment of time and money in drilling the well puts pressure on the dnr to approve a permit. we urge the dnr, the health department and lawmakers to consider legislation that would require a permit to pump before a high-capacity well is drilled.
 As an incentive to conservation and sustainable use of groundwater, we urge lawmakers to consider increasing the water use reporting Fee, as it applies to consumptive uses of water. the current minimum fee of $140 for pump-ing of up to 50 million gallons is far too low to discourage waste or over-use.
Gov. Mark dayton’s 2013 proposal to increase water- appropriation fees and to devote the new revenue to sig-nificantly increasing groundwater monitoring and research on the interaction between groundwater and lakes, streams and wetlands deserves strong support from citizens and lawmakers.
we endorse increasing the surcharge on the significantly increased summertime use of water that occurs in most cities. regardless of the outcome of the governor’s initia-tive, we urge public water systems to ratchet up their conservation-pricing schedules to discourage all wasteful and excessive uses of water, including lawn sprinkling. brown lawns in August are a small price to pay for conser-vation that will protect groundwater for our children and grandchildren.

A F r E s h wAt E r s O c i E t y s p E c i A l r E p O r t M i n n E s OtA’s G r O u n d wAt E r : i s O u r u s E s u s tA i n A b l E ? 3
White Bear Lake, the second-largest lake in the Twin Cities, has lost more than a fourth of its volume in the last decade, and much of the dramatic decline has been blamed on increased groundwater pumping by cities around the lake.1
In response, Ali Elhassan, the Metropolitan Council’s new top water supply planner, now is urging some Twin City suburbs that pump their water from wells, including some of those communi-ties around White Bear Lake, to consider tapping the Mississippi River, as the cities of Minneapolis and St. Paul do.2
That’s one part of a growing debate over the sustainability of groundwater pumping in Minnesota.
A surge of new permits issued by the Minnesota Department of Natural Resources for farmers, mostly in Central Minnesota, to pump groundwater to irrigate their crops is another part.
Over the last five and one-half years, the DNR issued 761 new or revised permits for irrigators to pump 26 billion gallons of groundwater per year.3
Irrigation wells, which water only about 3 percent of the state’s cropland, pump more than 25 percent of the groundwater
reported pumped by high-capacity wells in the state most years. They are the second-biggest user of groundwater and – by far – the fastest-growing use.4
Officials of the DNR, accused in a lawsuit of not doing enough to prevent the shrinkage of White Bear Lake, have been closely fol-lowing the lake’s drawdown and also the spurt of new requests for irrigation pumping. They now are starting to say, more persistently and more publicly than in the past, that existing and planned groundwater use is not sustainable in some parts of Minnesota.
The DNR plans in 2013 to use a 3-year-old law to begin creat-ing “groundwater management areas” in two heavily irrigated regions of the state, agency officials say. The agency hopes to win community support for intensive monitoring of the impact of existing pumping and, perhaps, support for future limitations on pumping.
In those areas, DNR will have special authority, if the agency chooses to exercise it, to reduce existing pumping limits and put limits on new water appropriations in order to prevent some wells from drying up other wells and to protect both aquifers and surface waters fed by the aquifers.
over-pumpIng threatens groundwater sustaInabIlIty
Municipal pumping has been blamed for shrinking White Bear Lake by more than one-fourth.

4 M i n n E s OtA’s G r O u n d wAt E r : i s O u r u s E s u s tA i n A b l E ? A F r E s h wAt E r s O c i E t y s p E c i A l r E p O r t
The regions planned for the first two groundwater management areas, according to Jason Moeckel, a DNR section manager are:
 The Bonanza Valley, a heavily irrigated area north of Willmar in Central Minnesota.
 A combination of the heavily irrigated Straight River Watershed in North-Central Minnesota and the Park Rapids municipal water system, troubled by nitrate contamination from farm fertilizers.
Moeckel is leading the agency’s effort to institute those groundwater management areas and win acceptance of more-sustainable groundwater use.
The DNR has put together a map of the state showing those two areas, White Bear Lake and 13 other “groundwater areas of concern” where communities have sought planning or regula-tory help from the DNR, where groundwater contamination is known to exist, or where hydrologists have long suspected pumping is, or could become, unsustainable.
Those other spots on the map are:
Rochester; Hibbing; the Buffalo Aquifer near Moorhead; Bemidji; Granite Falls; the Interstate 94 corridor between Minneapolis-St. Paul and St. Cloud; Little Rock Creek in Morrison and Benton counties in Central Minnesota; Luverne and the Rock County Rural Water District in Southwestern Minnesota; Mankato, Mar-shall, Perham; Seminary Fen, between Chaska and Chanhassen; and South Washington County. See Page 5.
It is not clear how aggressive the DNR is prepared to be in pursuing groundwater management areas, how committed the agency is to regulating the sustainable use of groundwater that state law demands, or how willing legislators may be to allow the DNR to proceed with initiatives that might limit existing pumping permits for agricultural irrigation and perhaps other water uses.
In several interviews with the Freshwater Society, DNR officials said they must win local backing for any actions they take if they are to succeed in promoting more-sustainable use. And they expressed concern that, if they move too fast or too ag-gressively, their authority might be restricted by lawmakers or constrained by a court challenge by water users.
“The DNR can’t just say we’re going to have a groundwater management area and say ‘Hop to it, folks,” Steve Hirsch, the director of the DNR’s Division of Ecological and Water Resources, said in an interview.
“The DNR needs to use its regulatory authority to ensure that there is sustainable groundwater use, but we also need to recognize that regulations alone will not solve our groundwater problems,” Hirsch said.
Referring to the public water systems around White Bear Lake, Hirsch said: “It’s not practical for the DNR to step in and tell a local community ‘You’ve got to stop pumping right now.’”
a check-in after four years
In 2008, the Freshwater Society published a report, titled Water Is Life: Protecting A Critical Resource For Future Generations, that evaluated the then-current status of both groundwater and surface water in Minnesota.5
The 2008 report concluded that there was a “startling lack of consensus among groundwater experts on whether our current use is sustainable and how to measure the groundwater we can safely use.”
The report also described the state’s well-by-well approach to issuing permits, and urged more consideration of the cu-mulative impact of many wells drawing from the same aquifer. The report recommended what Elhassan , the Metropoli-tan Council water planner, is urging now: That more communities look to river water to reduce their reli-ance on groundwater.
This paper is a follow-up to that 2008 report.
In 2008, the Freshwater Society published a report, titled Water is Life: Protecting A Critical Resource for Future Generations.
‘The DNR needs to use its regulatory authority to ensure that there is sustainable groundwater use, but we also need to recognize that regulations alone will not solve our groundwater problems.’
—Steve Hirsch, director of the Minnesota DNR’s Division of Ecological and Water Resources.

A F r E s h wAt E r s O c i E t y s p E c i A l r E p O r t M i n n E s OtA’s G r O u n d wAt E r : i s O u r u s E s u s tA i n A b l E ? 5
Sources: The map and the identification of the communities on it come from a DNR effort to summarize and update information on areas around the state where issues of groundwater availability or groundwater quality have arisen in recent years. Descriptions of those issues were compiled by the Freshwater Society from DNR “project scoping forms” and other sources.
1
3
2
4
5
6
7
8
9
10
11
12
13
1415
16
1. Bemidji 2. Bonanza Valley 3. Buffalo Aquifer 4. Granite Falls 5. Hibbing 6. I-94 Corridor 7. Little Rock Creek 8. Luverne/Rock County RW 9. Mankato10. Marshall11. Park Rapids12. Perham13. Rochester14. Seminary Fen15. South Washington Co.16. White Bear Lake
Groundwater areas of ConCern
1. Bemidji. Some residential wells in Northern Township in Bemidji County have been contaminated since the 1990s by chemicals leaching from the former Kummer Sanitary Landfill, a Superfund site. Homes in the area have been connected to the city water system. In addition, the state Health Department has established a special well construction area due to significant nitrate contami-nation in a shallow aquifer in Eckles Township. All of the City of Bemidji’s wells draw from a deep unconfined aqui-fer vulnerable to this nearby groundwater contamination.
2. Bonanza Valley. This agricultural area, north of Will-mar, has been heavily irrigated for years. Groundwater levels dip significantly during summertime pumping. Since at least 2009, the Department of Natural Resources has been concerned that irrigation pumping is, or could be, unsustainable.
3. The Buffalo Aquifer. The City of Moorhead relies on this aquifer for part of its water supply. It and other aqui-fers, which have limited amounts of available water, are critically important when drought lowers the flow in the Red River, the city’s primary water supply.
4. Granite Falls. When Granite Falls Energy built an ethanol plant it initially relied on groundwater. Based upon the initial aquifer testing, DNR recommended the company connect to a different water source. Declining groundwater levels and well interference complaints led the company to switch to the Minnesota River. The firm continues to rely on wells as a backup, and during 2012 the plant occasionally pumped groundwater.
5. Hibbing. This Iron Range community has asked the DNR to referee a dispute over one of the city water sys-tem’s wells whose output is affected by the draining of a mine pit by Hibbing Taconite Co. The East Swan River, a trout stream, potentially could be affected by the city’s pumping.
6. Interstate 94 Corridor. Research by the DNR and the U.S. Geological Survey is under way on this fast-growing area between the Twin Cities and St. Cloud because of its limited groundwater and the vulnerability of shallow aqui-fers to contamination from the land’s surface.
7. Little Rock Creek, north and a little east of St. Cloud, is a trout stream in a heavily irrigated area. The stream has been designated as impaired because of excess nitrates, too little dissolved oxygen and temperatures that are too high. A draft Total Maximum Daily Load study suggests limits on groundwater use could be necessary as part of a remedy.
8. Luverne/Rock County Rural Water District. The City of Luverne and the Rock County Rural Water District draw water from a shallow aquifer that is connected to the Rock River. Nitrate contamination of the river and the adequacy of the water supply in the event of a drought are concerns identified by the DNR. U.S. Geological Sur-vey research suggested that groundwater pumping could lower flows in the river, threatening a population of Topeka Shiners, a minnow species that is listed as endangered.
9. Mankato. The City of Mankato pumps its water both from the deep Mt. Simon aquifer and from a series of Ramney wells, which draw water from sediments adja-cent to the Blue Earth River. At certain times of the year, water from the shallow aquifer is contaminated with ni-trates and has to be blended with the Mt. Simon water. A 2011 DNR report examined the sustainability of the Mt. Simon water supply and concluded it was sustainable at then-current pumping levels, but could be over-extended by population growth, industrial development or drought.
10. Marshall. The City of Marshall pumps from two aquifers that supply the majority of the water for the community. Pumping by the city and an Archer Daniels Midland corn-milling plant have caused a decline in a shallow aquifer system and affected “seeps,” areas where groundwater comes to the land’s surface, on the east side of the Redwood River. These declining water levels led Marshall Municipal Utilities to develop a new well field 15 miles north of the city.
11. Straight River and Park Rapids. The Straight River, a trout stream, is a concern because of the possibility that heavy irrigation will deplete the stream, raise the tempera-ture of its water and endanger its trout. Park Rapids has nitrate contamination from farm fertilizers in some of the city water system’s wells that exceed the health standard.
12. Perham. The Minnesota departments of Agriculture and Health have long worked with the city to address nitrate contamination of city wells. The city is in an agricultural area where many potato fields are within
the City’s Wellhead Protection Area and Drinking Water Source Management Area. The potatoes are heavily fertilized, and irrigation helps carry the nitrate fertilizer to the groundwater.
13. Rochester. The U.S. Geological Survey has been work-ing with Rochester officials to build a groundwater model that will predict the city’s ability to provide water, even dur-ing an extended drought, for a rapidly growing population. The model also is intended to help the city avoid contami-nation of its water supply by other water users.
14. Seminary Fen, between Chaska and Chanhassen. Minnesota River fens near the Twin Cities, including Seminary Fen, are threatened by increasing withdrawals from bedrock and glacial aquifers. Groundwater flow to calcareous fens and springs along the river are reduced, especially when wells are pumping at peak rates.
15. South Washington County. This area is on the map because the Prairie du Chien-Jordan aquifer may lack capacity to accommodate expected population growth, especially in Woodbury and Cottage Grove. Predictions of water level declines are derived from modeling by the Metropolitan Council. The impact of pumping on trout streams in southern Washington County is a special concern.
16. White Bear Lake. USGS research that is still con-tinuing identified significantly increased pumping by city water systems around the lake as a major cause of a big drop in the lake’s water level.

6 M i n n E s OtA’s G r O u n d wAt E r : i s O u r u s E s u s tA i n A b l E ? A F r E s h wAt E r s O c i E t y s p E c i A l r E p O r t
It includes a statistical analysis of groundwater use from 1988 through 2011, based on yearly reports to the DNR by well own-ers who pump 10,000 gallons per day or 1 million gallons per year. Owners of wells pumping less than those thresholds are not required by law to get permits from the DNR or to report their pumping.
The statistical analysis estimated that permitted and reported groundwater use grew 31 percent over that period – an annual increase of about 2.8 billion gallons year after year – while Min-nesota’s population grew by 24 percent.
An accompanying report on Page 17 of this report details that statistical analysis. Another accompanying report on Page 19 examines factors that make the DNR’s self-reported data on pumping less complete than they could, and should, be.
Groundwater gets some respect
Groundwater, often a taken-for-granted resource, is getting a lot of attention these days.
Part of that attention results from a drought that in parts of Minnesota began in the fall of 2011 and in most of the state extended through the summer and fall of 2012. The drought wasn’t as bad in Minnesota as it was in Iowa and Illinois, but it dried up wells in some places, shrunk lakes and wetlands and wrung the moisture out of soil in fields and forests.
And the drought’s toll on soil moisture threatens to continue into the 2013 growing season.
A big part of the new attention to groundwater also comes from the passage in 2008 of the Clean Water, Land and Legacy constitutional amendment that has provided new money – about $35 million so far – to state agencies for the protection of drinking water.
With three-quarters of Minnesotans getting their drinking water from wells, that new spending on drinking water means much of the new money is being spent to begin or accelerate programs to research and protect groundwater.
A 2010 law change, sought by the DNR, gave the agency a stronger, statutory mandate to pursue sustainability.
The law, the statute that provides for the groundwater manage-ment area, gives the DNR commissioner authority to “limit total annual water appropriations and uses within a designated area to ensure sustainable use of groundwater that protects
ecosystems, water quality and the ability of future generations to meet their own needs.” 6
That statute’s protection for ecosystems mirrors an increased emphasis the DNR, the U.S. Geological Survey and other agen-cies are putting on considering the impact of groundwater pumping, not just on other wells, but on the streams, lakes and wetlands fed by groundwater.
The merger in 2010 of two DNR divisions, Waters and Ecological Resources, increased the agency’s focus on protecting surface waters from depletion by groundwater pumping.
Throughout 2012, there was new talk among DNR officials of moving away from a water-use permitting process in which the agency generally considered each new request for a permit on a case-by-case basis, whose outcome was largely determined by whether test pumping from a new well interfered with pumping from nearby wells.
Instead, the DNR is moving toward weighing and trying to pre-dict the cumulative future impact on an aquifer of all the wells already drawing from it, plus those well owners lining up for
A well-drilling crew drill a test boring in Afton State Park as part of groundwater research by the Minnesota Geological Survey. Three-fourths of Minnesota residents rely on ground-water for their water supply.

A F r E s h wAt E r s O c i E t y s p E c i A l r E p O r t M i n n E s OtA’s G r O u n d wAt E r : i s O u r u s E s u s tA i n A b l E ? 7
new permits to share in the aquifer’s water. The new approach attempts to foresee, and prevent, significant, widespread declines in aquifer levels, rather than taking remedial action after a drawdown occurs.
“We definitely need to approach this issue differently than we have in the past,” Hirsch said at a November 2012 groundwater conference sponsored by the Environmental Initiative. “We have a system where we basically go permit-by-permit. We need to figure out how to do this differently.”
Groundwater pumping increasing
The DNR’s new emphasis on evaluating the cumulative impact of all the wells pumping from an aquifer in an area comes after nearly a quarter century in which the groundwater pumping reported to the DNR by well owners across Minnesota has fluc-tuated widely from year to year, but exhibited a definite upward trend over that period.
The Freshwater Society’s statistical analysis includes margins of error. But the analysis provides estimates of how reported groundwater pumping grew from 1988 through 2011, after factoring out the impact of widely varying summertime precipitation.
The analysis estimates that overall reported groundwater pumping increased by 2.8 billion gallons each year, 31 percent for the 23-year period. Pumping by city water systems, the big-gest single component of overall groundwater use, increased an estimated 1.5 billion gallons each year, or 33 percent for the entire period.
The estimated increase in pumping for agricultural irrigation, the second-biggest use of groundwater year after year, was 1.5 billion gallons each year. But, because irrigation use is a smaller part of total pumping, that 1.5 billion-gallon increase each year adds up to a 73 percent growth from 1988 through 2011.
Pumping for industrial uses by companies relying on their own wells, not public water systems, decreased about 110 million gallons per year from 1989 through 2011, an 11 percent decrease, the statistical analysis estimates.7
No other category of groundwater pumping changed significantly.
Groundwater action on the front burner
In just the four years since the Fresh Water Society’s Water Is Life report was published in October 2008, a lot has happened with groundwater in Minnesota:
 In November 2008, Minnesota voters approved the constitu-tional amendment raising the state sales tax to increase state funding for clean water, wildlife habitat, parks and trails, and the arts. It is hard to overstate the impact that passage of that amendment has had on efforts to guarantee the sustainabil-ity of Minnesota’s groundwater. Not only did the amendment put money into groundwater research and groundwater pro-grams, but polling showing that drinking water concerns led voters to approve the tax increase likely influenced policy-makers to move groundwater up on their lists of priorities.
MInneSoTA GRounDWATeR PuMPInG TRenDS: 1988-2011
 Total groundwater pumping varied widely from year to year, but averaged about 235 billion gallons per year.
 Pumping by city water systems averaged 123 billion gallons per year, and averaged 53 percent of total reported groundwater pumping.
 Agricultural irrigation pumped an average of 63 billion gallons per year, averaging 26 percent percent of total reported pumping.
 Industrial pumping averaged about 22 billion gallons per year, averaging 9.5 percent of the total reported pumping.
 The next-biggest component of the total – a division the DNR calls “Special Categories” and that includes pollution containment, fish farms, snow making, livestock watering and sewage treatment – accounted for an average of 7.3 billion gallons pumped each year, about 3 percent of all groundwater use on average.
 Golf course sprinkling used an average of 4.7 billion gallons per year, 2 percent of total groundwater use on average.
 All other uses combined averaged about 14.7 billion gallons per year, 6 percent of the total on average.

8 M i n n E s OtA’s G r O u n d wAt E r : i s O u r u s E s u s tA i n A b l E ? A F r E s h wAt E r s O c i E t y s p E c i A l r E p O r t
 The University of Minnesota Water Resources Center and the Freshwater Society jointly convened two workshops in late 2008 and early 2009 for groundwater professionals who discussed strategies for measuring and achieving sustainable groundwater use. Those strategies emphasized estimating the recharge of aquifers from precipitation every year and comparing that recharge to the groundwater flowing out of the aquifers to support ecosystems and being pumped out of them for human uses – rather than focusing on the amount of water stored within the aquifers.8
 In the spring of 2008, the U.S. Geological Survey measured water levels in about 100 Twin Cities wells the agency had last measured in 1988 and 1989.9
 In the fall of 2008, the Metropolitan Council released a draft Master Water Supply Plan, approved in final form two years later, that attempted to project water use demand in 186 metro communities by 2030 and 2050. The plan did not predict any crisis, but it included some stark maps predicting lowered aquifers and diminished wetlands that would result if the communities made no changes in their water use as their populations increased.10
 In 2010, the DNR issued three significant reports, all dealing with sustainable water use and technical and policy strate-gies for measuring and achieving sustainability. The reports, prepared under the leadership of Dave Leuthe, the now-retired assistant director of the DNR’s merged Division of
Ecological and Water Resources, stressed that any water pumped for human use is water taken from long-term storage or water that, otherwise, would support springs, streams, lakes and wetlands. The reports said that, in some areas, pumping already was occurring at unsustainable levels. Those reports prompted the DNR to assemble its map of “groundwater areas of concern.”11
 In 2010, the USGS and other agencies began a study of a pro-longed decline in the water level in White Bear Lake. Eventu-ally the USGS concluded the decline largely resulted from increases in groundwater pumping by nearby communities that lowered the water level in an aquifer beneath the lake and caused lake water to flow into the aquifer.
 In 2011, the university’s Water Resources Center completed a report to the Legislature on water sustainability. The report, funded by revenue from the Legacy amendment, empha-sized the connections between ground and surface water and called for much more research on groundwater. “The state’s water balance is poorly known…Recharge rates and flow between aquifer systems are particularly unknown,” it said. The report got little attention from lawmakers, but groundwater professionals from a number of agencies contributed to writing the report and it reinforced their focus on the interaction between groundwater and surface waters and on sustainable use.12
That 2012 drought and the decline in White Bear Lake focused public attention on groundwater in a way it had not been before. That public concern emboldened the DNR to consider imposing the groundwater management areas and setting new limits on both new and existing pumping.
Municipal groundwater use
Across Minnesota, municipal water systems are the biggest groundwater users. Those approximately 640 systems pumped 126 billion gallons in 2011, a little more than half of all the groundwater use reported to the DNR.
Duluth, St. Cloud, Minneapolis and St. Paul and a few close-in suburbs served by the two big cities’ water systems use mostly surface water. But three-fourths of all Minnesotans, including most metro-area suburbanites, rely on wells for drinking water.
Like total groundwater use, the portion used by city water systems varied significantly from 1988 through 2011, moving in inverse relationship to summertime precipitation. When there
Hydrogeologist Kelton Barr leads a brainstorming session during a 2009 groundwater workshop sponsored by the University of Minnesota Water Resources Center and the Freshwater Society.
A F r E s h wAt E r s O c i E t y s p E c i A l r E p O r t M i n n E s OtA’s G r O u n d wAt E r : i s O u r u s E s u s tA i n A b l E ? 9
918
919
920
921
922
923
924
925
926
20042005
20062007
20082009
20102011
20122013
White Bear82016700
White Bear Lake Water Levels2003-3-19 to 2013-3-19
Wat
er L
evel
, fee
t ab
ove
sea
leve
l
Source: Minnesota DNR
is little summertime rain, cus-tomers of suburban water sys-tems that rely on groundwater increase their lawn sprinkling and use more water. In wet summers, they use less.13
In 1993, a year with a wet summer in the Twin Cities and statewide, municipal systems’ pumping dipped to 101 billion gallons. In 2007, when the summer was dryer than normal in the Twin Cities, municipal use hit 146 billion.14
Despite the increase in munici-pal pumping, most Minnesota cities, both individually and as a group, are not close to exceeding the pumping levels authorized in their DNR-issued permits. Total active permits held by city water systems authorize pumping of 189 billion gallons per year. That means that, even in 2007, the cities collectively were pumping only about three-fourths their authorized limit.
And it means that if the DNR limits any city’s permitted pump-ing volume, the action – if is to be effective – may appear to be a draconian reduction.
White Bear Lake, where homeowners’ docks stretch across great expanses of sand and grass that once were shallow waters and where a swimming beach has been closed for four years because of the disappearance of those shallows, has become a graphic symbol of the impact of groundwater pumping on lakes, streams and wetlands.
The lake’s decline also offers a warning that cities might have to limit their pumping or perhaps switch to other water supplies to protect their access to adequate drinking water and to protect the lakes and streams important to their citizens’ quality of life.
In early 2013, the lake’s level was measured and found to have declined to its lowest level ever in records stretching back to 1924. The 6-foot difference between that level and the lake’s historic average level represented a continuation of a prolonged decline that began in 2003.15
The long decline came during a period when precipitation near the lake was only a bit lower than normal.
A previous DNR study of the lake in the 1990s said the biggest determinant of the level of the lake’s surface was the water levels in aquifers beneath the lake. Both that DNR study and the newer USGS-led research said lake water was flowing out the bottom of the lake and into the Prairie du Chien-Jordan aquifer complex.16
But the USGS study went further and tracked isotopes found in the lake water to water pumped from wells around the lake. That was evidence supporting the speculation that lake water was moving into the groundwater.
TOP 20 CITIES’ GROUNDWATER USE,
IN BILLIONS. ABOUT 40% OF MUNICIPAL TOTAL.
rOchEstEr 4.5
blOOMinGtOn 3.4
MAplE GrOVE 3.3
brOOKlyn pArK 3.3
EAGAn 3.2
plyMOuth 3.1
EdEn prAiriE 2.9
cOOn rApids 2.8
wOOdbury 2.6
EdinA 2.5
blAinE 2.5
MinnEtOnKA 2.4
ApplE VAllEy 2.3
lAKEVillE 2.2
st lOuis pArK 2.1
burnsVillE 2.0
shAKOpEE 1.8
MAnKAtO 1.7
willMAr 1.5
nEw briGhtOn 1.3
WHITE BEAR LAKE WATER LEvELS

10 M i n n E s OtA’s G r O u n d wAt E r : i s O u r u s E s u s tA i n A b l E ? A F r E s h wAt E r s O c i E t y s p E c i A l r E p O r t
Then the USGS, in an unusual-ly strong and direct conclusion for the agency, said the most likely cause for the biggest part of the lake’s decline was an increase in pumping by municipal water systems in communities around the lake.
Pumping by public water systems in eight communi-ties around the lake that draw their water from the Prairie du Chien-Jordan aquifer complex – Centerville, Hugo, Lino Lakes, Mahtomedi, North St. Paul, Vadnais Heights, White Bear Lake and White Bear Township – more than doubled from 1980-84 to 2006-10. Average annual pumping by those eight cities increased from 1.7 billion gallons to 3.7 billion gallons.17
Even so, those cities around the lake were not close to exceeding their DNR permits, which authorized pumping of 4.8 billion gallons per year.
In late 2012, the Robins, Kaplan, Miller & Ciresi law firm filed a lawsuit on behalf of a group called the White Bear Lake Restoration Association that blames the DNR for allow-ing cities around the lake to pump too much groundwater. The suit seeks to force the DNR to find other sources of water for the communities – mainly from St. Paul – or to approve pumping Mississippi River water into the lake to raise its level.
Areas Where Groundwater Pumping is Likely to Directly Impact Surface Water Features
0 10 205 Miles
Metropolitan Council, 2/13/2009View datasets online at http://gis.metc.state.mn.us/makeamap
Source:Metropolitan Council
City & Township Boundaries
Rivers
Lakes
High Potential for Groundwater-Surface Water Interaction
Note: This map was created through aregional assessment of geologic and water table conditions. Additional areas ofgroundwater and surface water interactionmay exist due to local conditions. This map highlights areas where bedrock aquifer pumping is most likely to impact surface water resources.
A1-11
2030 Model-projected Drawdown in the Prairie du Chien-Jordan Aquifer
0 10 205 Miles
Metropolitan Council, 8/26/2009View datasets online at http://gis.metc.state.mn.us/makeamap
Source:Metropolitan Council
Note: These model results assume long-term average conditions and continueddevelopment of traditional water supplies.Summer conditions may excacerbateshort-term drawdown.
City & Township Boundaries
< 5 feet
5 - 10 feet
10 - 20 feet
20 - 30 feet
30 - 40 feet
> 40 feet
Drawdown Exceeds 50% Available Head
A1-12
Metropolitan Council’s 2010 Master Water Supply Plan predicted draw-downs of groundwater and surface waters.

A F r E s h wAt E r s O c i E t y s p E c i A l r E p O r t M i n n E s OtA’s G r O u n d wAt E r : i s O u r u s E s u s tA i n A b l E ? 11
City water systems in the seven core Twin Cities metropolitan counties – Anoka, Carver, Dakota, Hennepin, Ramsey, Scott and Washington – accounted for 32 percent of all the groundwater reported pumped in Minnesota in 2011. Their pumping was 58 percent of all reported municipal pumping.
The Metropolitan Council’s Master Water Supply Plan, approved in 2010, was aimed at plotting the sustainability of water sup-plies in the face of population growth expected in the commu-nities by 2030 and 2050.
It was based on a huge computer model, still being developed and refined in 2013, that predicts future water levels in aquifers based on current groundwater measurements, historic patterns of rainfall and evaporation, land uses and population growth es-timates. It also projects the impact on surface waters of declines in the aquifers.
The plan received little public attention when it was released in draft form in 2008 or when it was approved two years later.
But it predicted declines in aquifer water levels and significant negative impacts on wetlands across the metropolitan area by 2030, and especially by 2050, if cities continued their then-current patterns of groundwater use and grew in population as they were predicted to grow.
The plan predicted that, under a business-as-usual scenario, water levels in the Prairie du Chien-Jordan aquifer complex, the main bedrock aquifer providing groundwater for Twin City sub-urbs – would drop a modest 5 feet or less in much of the metro area by 2030. But the plan predicted drops of up to 20 feet in Woodbury, Cottage Grove, Apple Valley and parts of Afton, Rosemount and Lakeville.
And the plan predicted that by 2050, unless cities changed their consumption patterns or their water sources, those declines would worsen and there also would be significant declines in the Prairie du Chien-Jordan in some western Twin Cities sub-urbs, including Chanhassen, Medina and Maple Grove.
Several maps in the plan plotted areas where groundwater pumping was predicted to “directly impact surface water fea-tures.” The plan predicted a “high potential for groundwater-sur-face water interaction” across much of northern Anoka County, in many lakes in northeastern Ramsey County and northern Washington County, along the Minnesota River, in the rural townships of southern Dakota County, and – to a lesser extent – in western Hennepin County, around Lake Minnetonka.
Interestingly, the model did not predict significant declines in White Bear Lake. However, a subsequent study of groundwater-surface water interactions conducted for the Metropolitan Council by Barr Engineering labeled White Bear Lake “potentially vulnerable to groundwater pumping.”
The Master Water Supply Plan did not paint the predicted declines as a crisis. The plan’s first paragraph said: “The analysis that underlies this plan indicates that overall, the region has ad-equate supplies to meet future demand but there will be issues that need to be addressed and some communities may not be able to rely on traditional sources to meet projected demands.”
The plan got a mostly ho-hum reaction from the public and from elected officials. There was little media coverage of its predictions.
But now, as the Metropolitan Council is preparing a revision of the master plan for 2015, the council’s new top water planner is taking a more strident tone. Ali Elhassan, is beginning to say publicly that some communities – including some of those around White Bear Lake – should consider switching from groundwater to Mississippi River water for their residents.
He wants more communities to rely on the Mississippi, and perhaps the Minnesota and St. Croix rivers as well, as their primary water supplies and use groundwater as a backup when droughts lower the rivers.
Ali Elhassan, manager of water supply planning for the Metropolitan Council, above the Mississippi River. Elhassan has been urging some suburban communities to consider joining Minneapolis and St. Paul in using the river as their primary water source.

12 M i n n E s OtA’s G r O u n d wAt E r : i s O u r u s E s u s tA i n A b l E ? A F r E s h wAt E r s O c i E t y s p E c i A l r E p O r t
Elhassan has a chart he likes to use to make his point that the metro area has become more and more dependent on ground-water. It depicts groundwater and surface water, each as a per-centage of the seven counties’ total water delivered by public water systems, from the 1940s through 2010.
In the 1940s, surface water drawn from the Mississippi River, mostly by Minneapolis and St. Paul, made up 90 percent of all the water used by Twin Cities public water systems. In the 1950s, ‘60s and ‘70s, as farther-out suburbs drawing their water from wells developed and gained population, the percentage of surface water decreased and the percentage of groundwater increased.
In the 1980s, groundwater supplied more than half the water used in the metro area. In 2006–10, according to Elhassan’s chart, groundwater represented more than 70 percent of the Twin Cities’ water use, and surface water less than 30 percent.
Elhassan argues that groundwater use already is unsustainable in some places around the metro area and that water levels in bedrock aquifers are declining in places. The Metropolitan Council’s next master plan probably will project additional declines in aquifers and characterize that unsustainability in stronger terms than the last plan did, he said.
“In our 2010 plan, we didn’t identify White Bear Lake as a prob-lem area, and now we know it is,” he said.
Both the St. Paul and Minneapolis water systems have signifi-cant excess capacity to pump water from the Mississippi and treat it. Providing the connections to get that treated water into
suburbs’ water distribution systems would be a huge, and hugely expensive, project. But that is what Elhassan is urging some communities to begin exploring.
“It’s not going to be an easy thing to do,” Elhas-san said. “For me, at this level, I just want people to start looking at it.”
Irrigation, a fast-growing use of groundwater
Compared to many western states, little of Minnesota’s farmland is irrigated.
But, measured by reported pumping and the permits sought by well owners and issued by
the DNR in recent years, agricultural irrigation is Minnesota’s second-largest use of groundwater. And it is, by far, the fastest-growing segment of groundwater use.
Significant areas of Central and Southwestern Minnesota that once were “dry land” areas where farmers grew wheat, barley and hay now produce bumper crops of corn and soybeans, thanks to irrigation. Potato production in North-Central Minne-sota has dramatically expanded over the last two decades, and irrigation has expanded with it.
One company, the Fargo-based R. D. Offutt Co., the largest grower of potatoes in the United States, also is the largest irriga-tor in Minnesota. The firm, a related company and Offutt family members hold 242 active permits to pump 12 billion gallons of
Agricultural irrigation is Minnesota’s second-largest and fastest-growing use of groundwater.
images2.makefive.com
2Source: Metropolitan Council

A F r E s h wAt E r s O c i E t y s p E c i A l r E p O r t M i n n E s OtA’s G r O u n d wAt E r : i s O u r u s E s u s tA i n A b l E ? 13
groundwater per year for irrigation. Those permits cover more than 30,000 acres of potatoes and other crops.
The Offutt companies and family members reported to the DNR that they pumped about 5.6 billion gallons of groundwater in 2011, about 10 percent of all reported groundwater pumping for agricultural irrigation.
But the Offutt operation, as big as it is, is only a small part of the total irrigation pumping in Minnesota.
In all, about 2,300 well owners currently hold about 4,400 active permits to pump 192 billion gallons of groundwater per year to irrigate 554,000 acres of crops.
Over the last 10 years, agricultural irrigation accounted for about 68 percent of all the new groundwater withdrawals au-thorized by the DNR. From 2008 through 2012, the number of farmers seeking new permits to pump groundwater for irriga-tion was double, and sometimes more than triple, the previous rate of about 50 permit requests per year.18
Reported pumping for agricultural irrigation, not counting water-ing at nurseries and golf courses, was 58 billion gallons in 2011. The record year for irrigation pumping – so far – in the DNR data base was 2007, when 106 billion gallons were pumped.
In early 2013, the DNR was still collecting pumping records for 2012. Many people expect that 2012, which had a wet May fol-lowed by a very dry June-through-September period across the state, will rival or exceed 2007, both in reported irrigation use and reported total groundwater use.
Nearly 90 percent of Minnesota’s agricultural irrigation occurs in 13 counties. Those counties, in order of their water use in 2011, are: Otter Tail, Dakota, Sherburne, Hubbard, Pope, Stearns, Swift, Morrison, Wadena, Becker, Benton, Todd and Stevens. The heavily irrigated parts of those counties have sandy soils that quickly
drain rainfall out of the reach of the roots of farm crops.
About half the agricultural irrigation that occurs in Minnesota is for corn. Soybeans use about 18 percent, and potatoes and dry beans each use about 8 percent.19
How important, and how profitable, is irrigation for the farmers that practice it? Very important, and very profitable in the areas of Minnesota where it is widely practiced.
And high commodity prices, high land prices and the weather uncertainties of climate change are likely to encourage many farmers, even outside those traditional areas, to consider irrigation as an insurance policy against dry growing seasons.
Jerry Wright, a retired University of Minnesota Extension engi-neer who specialized in irrigation and now works as a secretary and consultant for the Irrigators Association of Minnesota, estimated that irrigation can boost corn yields by 100 bushels per acre in areas with sandy soils.
A one-page summary prepared by Wright on 42 years of corn yields on test plots at the Central Lakes College – Ag Center, formerly known as the Staples Irrigation Center, spells out irriga-tion’s advantage:
 From 1969 through 2010, irrigated corn produced an average of 145 bushels per acre. The average yield for dryland corn over that period was 61 bushels.
 From 2001 through 2010, irrigated corn on those test plots averaged 172 bushels per acre. The non-irrigated average yield was 56 bushels.
Wright estimated the cost of installing a well and center-pivot irrigation system capable of watering 130 acres at between $100,000 and $130,000. Operating costs for electricity to pump the water are about $21 per acre per year, according to a North Dakota State University pamphlet.
13 COUNTIES THAT ACCOUNTED FOR 89% OF AGRICULTURAL IRRIGATION FROM GROUNDWATER IN 2011, IN BILLIONS OF GALLONS
OttEr tAil 11.5
dAKOtA 6.4
shErburnE 5.9
hubbArd 4.6
pOpE 4.5
stEArns 3.6
swiFt 3.0
MOrrisOn 2.9
wAdEnA 2.6
bEcKEr 2.4
bEntOn 2.1
tOdd 1.7
stEVEns 0.7
In early 2013, the DNR was still collecting pumping records for 2012. Many people expect that 2012, which had a wet May followed by a very dry June-through-September period across the state, will rival or exceed 2007, both in reported irrigation use and reported total groundwater use.
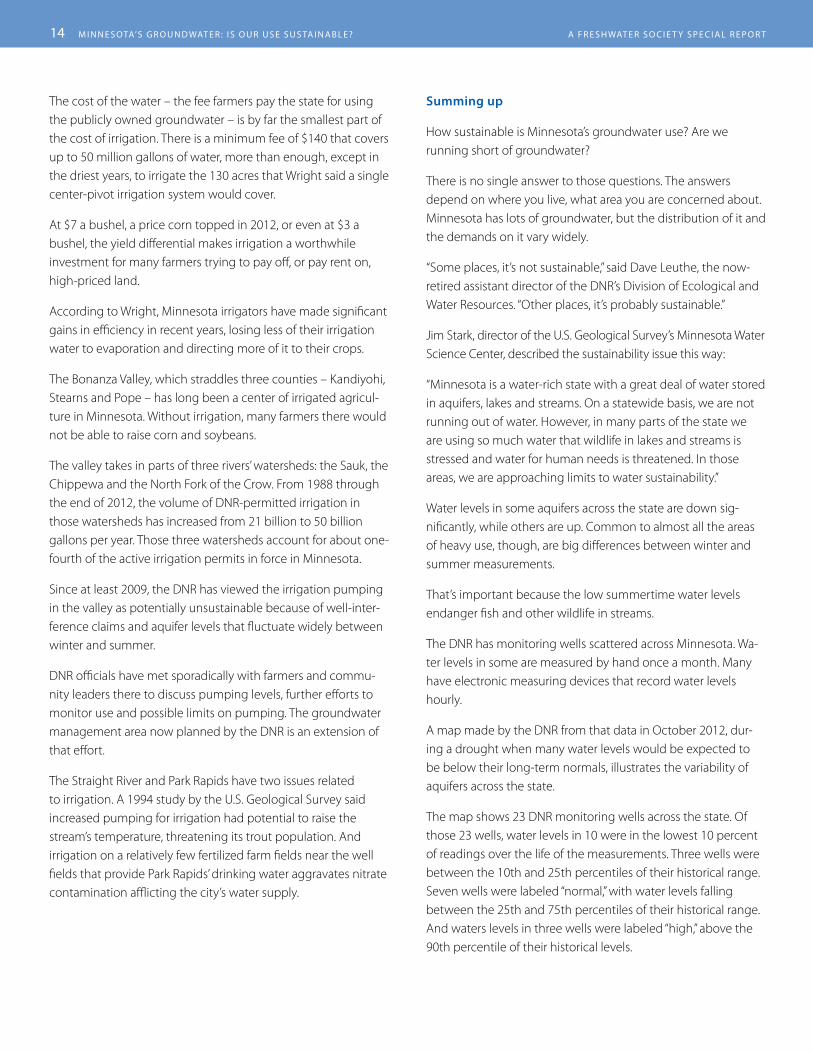
14 M i n n E s OtA’s G r O u n d wAt E r : i s O u r u s E s u s tA i n A b l E ? A F r E s h wAt E r s O c i E t y s p E c i A l r E p O r t
The cost of the water – the fee farmers pay the state for using the publicly owned groundwater – is by far the smallest part of the cost of irrigation. There is a minimum fee of $140 that covers up to 50 million gallons of water, more than enough, except in the driest years, to irrigate the 130 acres that Wright said a single center-pivot irrigation system would cover.
At $7 a bushel, a price corn topped in 2012, or even at $3 a bushel, the yield differential makes irrigation a worthwhile investment for many farmers trying to pay off, or pay rent on, high-priced land.
According to Wright, Minnesota irrigators have made significant gains in efficiency in recent years, losing less of their irrigation water to evaporation and directing more of it to their crops.
The Bonanza Valley, which straddles three counties – Kandiyohi, Stearns and Pope – has long been a center of irrigated agricul-ture in Minnesota. Without irrigation, many farmers there would not be able to raise corn and soybeans.
The valley takes in parts of three rivers’ watersheds: the Sauk, the Chippewa and the North Fork of the Crow. From 1988 through the end of 2012, the volume of DNR-permitted irrigation in those watersheds has increased from 21 billion to 50 billion gallons per year. Those three watersheds account for about one-fourth of the active irrigation permits in force in Minnesota.
Since at least 2009, the DNR has viewed the irrigation pumping in the valley as potentially unsustainable because of well-inter-ference claims and aquifer levels that fluctuate widely between winter and summer.
DNR officials have met sporadically with farmers and commu-nity leaders there to discuss pumping levels, further efforts to monitor use and possible limits on pumping. The groundwater management area now planned by the DNR is an extension of that effort.
The Straight River and Park Rapids have two issues related to irrigation. A 1994 study by the U.S. Geological Survey said increased pumping for irrigation had potential to raise the stream’s temperature, threatening its trout population. And irrigation on a relatively few fertilized farm fields near the well fields that provide Park Rapids’ drinking water aggravates nitrate contamination afflicting the city’s water supply.
Summing up
How sustainable is Minnesota’s groundwater use? Are we running short of groundwater?
There is no single answer to those questions. The answers depend on where you live, what area you are concerned about. Minnesota has lots of groundwater, but the distribution of it and the demands on it vary widely.
“Some places, it’s not sustainable,” said Dave Leuthe, the now-retired assistant director of the DNR’s Division of Ecological and Water Resources. “Other places, it’s probably sustainable.”
Jim Stark, director of the U.S. Geological Survey’s Minnesota Water Science Center, described the sustainability issue this way:
“Minnesota is a water-rich state with a great deal of water stored in aquifers, lakes and streams. On a statewide basis, we are not running out of water. However, in many parts of the state we are using so much water that wildlife in lakes and streams is stressed and water for human needs is threatened. In those areas, we are approaching limits to water sustainability.”
Water levels in some aquifers across the state are down sig-nificantly, while others are up. Common to almost all the areas of heavy use, though, are big differences between winter and summer measurements.
That’s important because the low summertime water levels endanger fish and other wildlife in streams.
The DNR has monitoring wells scattered across Minnesota. Wa-ter levels in some are measured by hand once a month. Many have electronic measuring devices that record water levels hourly.
A map made by the DNR from that data in October 2012, dur-ing a drought when many water levels would be expected to be below their long-term normals, illustrates the variability of aquifers across the state.
The map shows 23 DNR monitoring wells across the state. Of those 23 wells, water levels in 10 were in the lowest 10 percent of readings over the life of the measurements. Three wells were between the 10th and 25th percentiles of their historical range. Seven wells were labeled “normal,” with water levels falling between the 25th and 75th percentiles of their historical range. And waters levels in three wells were labeled “high,” above the 90th percentile of their historical levels.

A F r E s h wAt E r s O c i E t y s p E c i A l r E p O r t M i n n E s OtA’s G r O u n d wAt E r : i s O u r u s E s u s tA i n A b l E ? 15
18 Potentiometric Surfaces and Changes in Groundwater Levels in Selected Bedrock Aquifers
Figure 13. Groundwater-level changes in the Prairie du Chien-Jordan aquifer between the winter of 1988–89 and March 2008.
Base data from Minnesota Department of Natural Resources digital data, 1:24,000Universal Transverse Mercator projectionZone 15 Horizontal coordinate information is referenced to theNorth American Datum of 1983 (NAD 83)
Aquifer boundary from Mossler and Tipping, 2000, 1:25,0000
0 20 MILES
20 KILOMETERS
10
10
94°
93°45’
93°30’ 93°15’
93° 92°45’
44°45’
45°
45°15’
44°30’
Mississippi
River
St. Croix
River
Rum
Rive
r
Minnesota
River
ANOKA COUNTY
HENNEPINCOUNTY
CARVER COUNTY
SCOTT COUNTY DAKOTA COUNTY
RAMSEYCOUNTY
WASHINGTONCOUNTY
0 to -5-5.1 to -10-10.1 to -15-15.1 to -20-20.1 to -25Greater than -25
Greater than 2015.1 to 2010.1 to 155.1 to 100 to 5
!
EXPLANATION
Well with water-level measurements— Number is water-level change in feet (negative numbers represent a decline)
Groundwater-level change, in feet
2
Figure 13. Groundwater-level changes in the Prairie du Chien-Jordan aquifer between the winter of 1988-89 and March 2008.
!
!
!
!
!
!
!
! !
!
!
!
!
!
!
!!!!
!
! !
!!!
!!
!
!
!
!
!
!
!
!
!
!
!
!
!
! ! !
!!
!!
!
!
!!
!
!
!
!
!
!
!
!
!
!
!
!
!! !
!
!
!
!
!
!
!3
-13
-6
-2
3
-3
9 83
6
1
-12
-8
-1
-3
0
0 2
-3
4
-5
48
-1 -7
-6
1
12 10
43
217-8
3
-2
-76
6
-4
-9
2
58
2
0
3
-24 -31
58
41
1212
-162
-22
-4
-9
35
2
2
2
-10
41
2
4
-19
6
-5
4
-19
Rises
Declines
For the metro area, the USGS synoptic measurements made in more than 100 wells in 2008 and compared to measurements taken in the same wells in the winter of 1988-89 showed the same variability.
The USGS research measured changes over the 19 years in 72 wells in the Prairie du Chien-Jordan complex of aquifers that supplies drinking water for most Twin Cities suburbs. Water levels were down – between 0.2 feet and 31 feet – in 29 wells. And water levels had risen – between 0.4 feet and 48 feet – in 37 wells.
The same research compared the 19-year changes in water lev-els in eight wells extending into the deeper Mt. Simon-Hinckley aquifer and found the same type of gains and losses. Water levels were up between 1 foot and 56 feet in six wells. Levels were down, by 35 feet and 57 feet, in two wells.
The synoptic measurements and mapping based on them found significant gains in Prairie du Chien-Jordan levels in Minneapolis, St. Paul and some of St. Paul’s nearby suburbs. The study found significant decreases in a large area centered on northern Woodbury, and another area near Burnsville.
Another part of the Prairie du Chien-Jordan synoptic research measured water levels in Twin Cities wells in March 2008 and again in August 2008. Those tests found big winter-to-summer declines in much of Hennepin County, in northwestern Dakota County, in Woodbury and in southeastern Washington County, south of Afton.
In the four years since the Freshwater Society lamented the lack of consensus among groundwater experts on the question of sustainable use, have we learned more about groundwater and have the people managing it gotten any closer to agreement on how to achieve sustainable use?
The U.S. Geological Survey in 2008 measured Prairie du Chien-Jordan water levels last measured 19 years before. In the chart at left, blue indicates areas where levels had risen and yellow and brown indicate declines. The USGS also measured winter-to-summer water level changes in 2008. In the chart at right, the reds and browns depict seasonal declines. That indicates summertime stress on lakes, streams and wetlands.
Groundwater-Level Changes 15
Figure 10. Groundwater-level changes in the Prairie du Chien-Jordan aquifer between March 2008 and August 2008.
Base data from Minnesota Department of Natural Resources digital data, 1:24,000Universal Transverse Mercator projection Zone 15 Horizontal coordinate information is referenced to theNorth American Datum of 1983 (NAD 83)Aquifer boundary from Mossler and Tipping, 2000, 1:25,000
0
0 20 MILES
20 KILOMETERS
10
10
94°
93°45’
93°30’ 93°15’
93° 92°45’
44°45’
45°
45°15’
44°30’
Mississippi
River
St. Croix
River
Rum
Rive
r
Minnesota
River
ANOKA COUNTY
HENNEPINCOUNTY
CARVER COUNTY
SCOTT COUNTY DAKOTA COUNTY
RAMSEYCOUNTY
WASHINGTONCOUNTY
0 to -5-5.1 to -10-10.1 to -15-15.1 to -20-20.1 to -25Greater than -25
Greater than 2015.1 to 2010.1 to 155.1 to 100 to 5
!
EXPLANATION
Well with water-level measurements— Number is water-level change in feet (negative numbers represent a decline)
Groundwater-level change, in feet
Rises
Declines
!
!
!
!
!
!
!
!
!
!
!
!
!
!
!
!
!
!
!
!
!
!
!
!
!
!
!
!
!!
!
!
!
!
!
!
!!!
!
! !
!!!
!!
!
!
!
!
!
!
!
!!
!
!!
!
!
!
!
!
!! !
!!
!!
!
!
!
!!
!
!
!
!
!
!
!
!
!
!
!
!! !
!
!
!
!
!
!
!
!
!
!
!
!
!
!
!
! !
!
!!
!
!
!
!
!
!
!
!
!
!
!!
!
!
!!
!
!
!
!
!
!
!
!
!!
!
!
!
!
!
!
!
!
!
!
!!
!
!
!
!
!
!
!
!
!
!
!
!
!
!
!
!
!
!
!
!
!
!
!!
!
!
!
!
!
!
! -4
-36
-2
-7
-24
-5
-29-31
-4
-10
-9
-8
-4
-4
-23
-10
-29
-16
-30
0
1
-23
0
-12
-1
-1
-6
-1
0
-1
-9 -8
-17
0
-3
-1
-1
-7
-12
-5
-4
-13
-3-4
-21
-3
-22
-9
-5
0
-5
-3
-657
-10
-8
-1-1
-1
0
-12
-6
-14
-7
0
5
-4
0
-1 1
-2
0-5
-2-5
-3
-3
1
-3
-1
-3
0
-19
-3-5
-26
-11
-4 -291
0
-2
-30
-25
-2
-10
-1
-8 -45
0
-46
0 2
-3
-9
-2
-4 -3
-4
-9
-18-2-44
-31
-16
-29
-26-4
-5
-9
-3
-8-5
-7
-1
1-6
-7
1
0
-32 -38
-16-10
-6
-5-11
-1-30
-60
-15
-16
-3
-4
-3
1
-2
-3-24
1
0
-1
0
-1
-1
-6
-2
-19
-1
-3
-7
-4
-2
0
-6
-45
-10
-9
0
-11
-6
-230
-9
-8
-9
-11
57
16 M i n n E s OtA’s G r O u n d wAt E r : i s O u r u s E s u s tA i n A b l E ? A F r E s h wAt E r s O c i E t y s p E c i A l r E p O r t
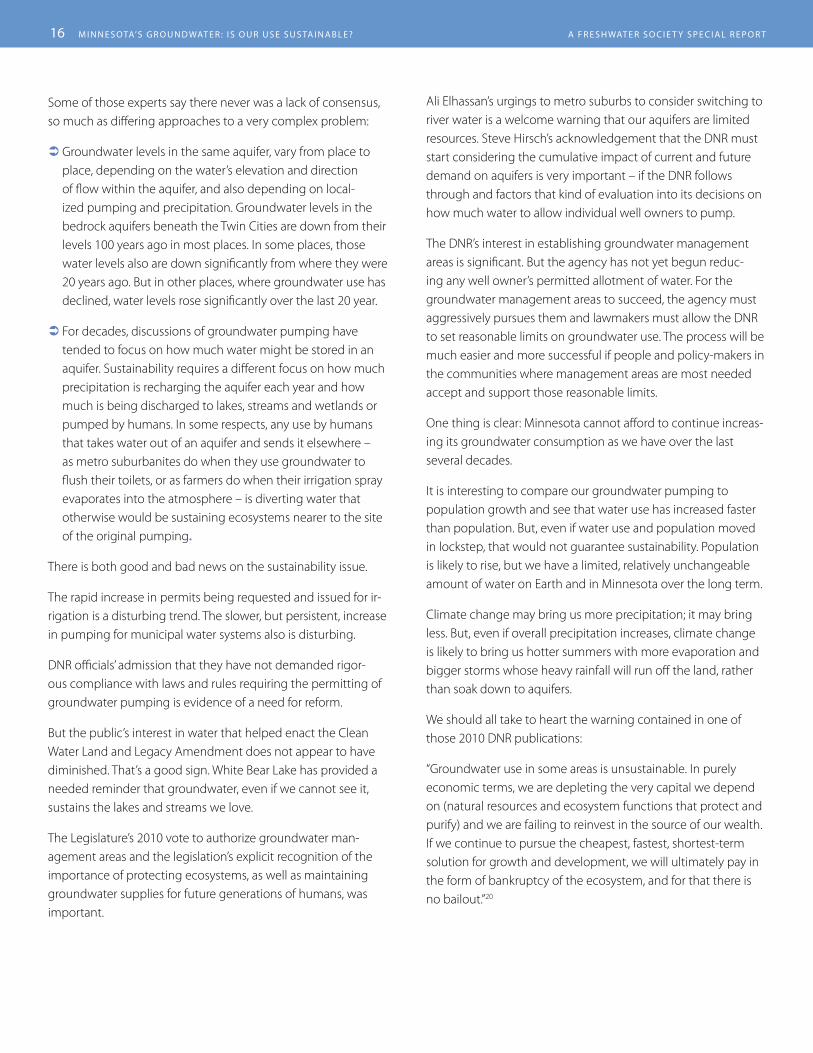
Some of those experts say there never was a lack of consensus, so much as differing approaches to a very complex problem:
 Groundwater levels in the same aquifer, vary from place to place, depending on the water’s elevation and direction of flow within the aquifer, and also depending on local-ized pumping and precipitation. Groundwater levels in the bedrock aquifers beneath the Twin Cities are down from their levels 100 years ago in most places. In some places, those water levels also are down significantly from where they were 20 years ago. But in other places, where groundwater use has declined, water levels rose significantly over the last 20 year.
 For decades, discussions of groundwater pumping have tended to focus on how much water might be stored in an aquifer. Sustainability requires a different focus on how much precipitation is recharging the aquifer each year and how much is being discharged to lakes, streams and wetlands or pumped by humans. In some respects, any use by humans that takes water out of an aquifer and sends it elsewhere – as metro suburbanites do when they use groundwater to flush their toilets, or as farmers do when their irrigation spray evaporates into the atmosphere – is diverting water that otherwise would be sustaining ecosystems nearer to the site of the original pumping.
There is both good and bad news on the sustainability issue.
The rapid increase in permits being requested and issued for ir-rigation is a disturbing trend. The slower, but persistent, increase in pumping for municipal water systems also is disturbing.
DNR officials’ admission that they have not demanded rigor-ous compliance with laws and rules requiring the permitting of groundwater pumping is evidence of a need for reform.
But the public’s interest in water that helped enact the Clean Water Land and Legacy Amendment does not appear to have diminished. That’s a good sign. White Bear Lake has provided a needed reminder that groundwater, even if we cannot see it, sustains the lakes and streams we love.
The Legislature’s 2010 vote to authorize groundwater man-agement areas and the legislation’s explicit recognition of the importance of protecting ecosystems, as well as maintaining groundwater supplies for future generations of humans, was important.
Ali Elhassan’s urgings to metro suburbs to consider switching to river water is a welcome warning that our aquifers are limited resources. Steve Hirsch’s acknowledgement that the DNR must start considering the cumulative impact of current and future demand on aquifers is very important – if the DNR follows through and factors that kind of evaluation into its decisions on how much water to allow individual well owners to pump.
The DNR’s interest in establishing groundwater management areas is significant. But the agency has not yet begun reduc-ing any well owner’s permitted allotment of water. For the groundwater management areas to succeed, the agency must aggressively pursues them and lawmakers must allow the DNR to set reasonable limits on groundwater use. The process will be much easier and more successful if people and policy-makers in the communities where management areas are most needed accept and support those reasonable limits.
One thing is clear: Minnesota cannot afford to continue increas-ing its groundwater consumption as we have over the last several decades.
It is interesting to compare our groundwater pumping to population growth and see that water use has increased faster than population. But, even if water use and population moved in lockstep, that would not guarantee sustainability. Population is likely to rise, but we have a limited, relatively unchangeable amount of water on Earth and in Minnesota over the long term.
Climate change may bring us more precipitation; it may bring less. But, even if overall precipitation increases, climate change is likely to bring us hotter summers with more evaporation and bigger storms whose heavy rainfall will run off the land, rather than soak down to aquifers.
We should all take to heart the warning contained in one of those 2010 DNR publications:
“Groundwater use in some areas is unsustainable. In purely economic terms, we are depleting the very capital we depend on (natural resources and ecosystem functions that protect and purify) and we are failing to reinvest in the source of our wealth. If we continue to pursue the cheapest, fastest, shortest-term solution for growth and development, we will ultimately pay in the form of bankruptcy of the ecosystem, and for that there is no bailout.”20

A F r E s h wAt E r s O c i E t y s p E c i A l r E p O r t M i n n E s OtA’s G r O u n d wAt E r : i s O u r u s E s u s tA i n A b l E ? 17
Pumping of Minnesota’s groundwater increased – on average – about 2.8 billion gallons each year from 1988 through 2011, a statistical analysis of reporting pumping estimates.
Actual pumping totals reported to the Department of Natural Resources each year vary widely, increasing in dry years when the demand for agricultural irrigation and lawn sprinkling rises and decreasing in wetter years.
But an analysis of the reported pumping suggests that, after evening out the impact of precipitation, total groundwater water use increased faster than the growth in the state’s popula-tion. The two biggest components of overall use – water dis-tributed by city water systems and agricultural irrigation – also increased faster than population growth.
Over that 23-year period, total reported groundwater use increased an estimated 31 percent. State population increased 24 percent.1
The 1988-through-2011 time span comes from the bookends on a massive Department of Natural Resources spreadsheet that records all the surface and groundwater reported pumped from the ground or diverted from lakes and streams under state-issued permits. Each year, an additional year’s worth of pumping data is added to the spreadsheet.
groundwater pumpIng grows faster than populatIon
Those totals are not a complete sum of water use in Minnesota because state law and rules require reporting only when water use equals 10,000 gallons per day or 1 million gallons per year. That means the water pumped from wells for private homes and for many small businesses is not covered by the report.
Additionally, there is evidence that some significant number of well owners do not obtain permits required by law and do not make the required reports on their pumping. And there is little effort by the DNR, or ability for the agency, to check the accu-racy of well owners’ self-reported pumping totals. See Page 19.
Nevertheless, the DNR spreadsheet offers a better picture than many states provide of how much water is reported used in the state every year and the kinds of uses people make of that water.
The only alternative source of water-use data is the U.S. Geologi-cal Survey, which publishes state-by-state estimates of water use every five years. The USGS estimates, which start with DNR data and then add data from other sources, include an estimate of pumping from private wells.
For 2005, the last year for which the USGS estimates are avail-able, the USGS estimate of total groundwater use in Minnesota was 20 percent higher than the pumping reported to the DNR. Part of the difference was the private, domestic use; part was a
vastly higher USGS estimate of the groundwater used in fish farming.
Why is it necessary to resort to statistical analysis to estimate whether groundwater use has gone up or gone down over time? The answer lies in the great year-to-year variability in reported pumping totals.
It is relatively easy to go to the DNR data and com-pute, for example, that total reported groundwater pumping in Minnesota in 2011 was 229 billion gallons. Or that the total for 1988 was 250 billion. Or that 1993 pumping totaled 165 billion.
In a graph of those widely varying numbers, it is apparent that there was an upward trend in overall groundwater use, and in its two biggest compo-nents, pumping by city water systems and pump-ing for agricultural irrigation. The jagged lines on the graph dip for a time after 1988, generally rise
0.0
50.0
100.0
150.0
200.0
250.0
300.0
350.0
1988
1989
1990
1991
1992
1993
1994
1995
1996
1997
1998
1999
2000
2001
2002
2003
2004
2005
2006
2007
2008
2009
2010
2011
All groundwater
Public water systems
Agricultural irrigation Industrial
Other
(gallons)Groundwater Pumping
18 M i n n E s OtA’s G r O u n d wAt E r : i s O u r u s E s u s tA i n A b l E ? A F r E s h wAt E r s O c i E t y s p E c i A l r E p O r t
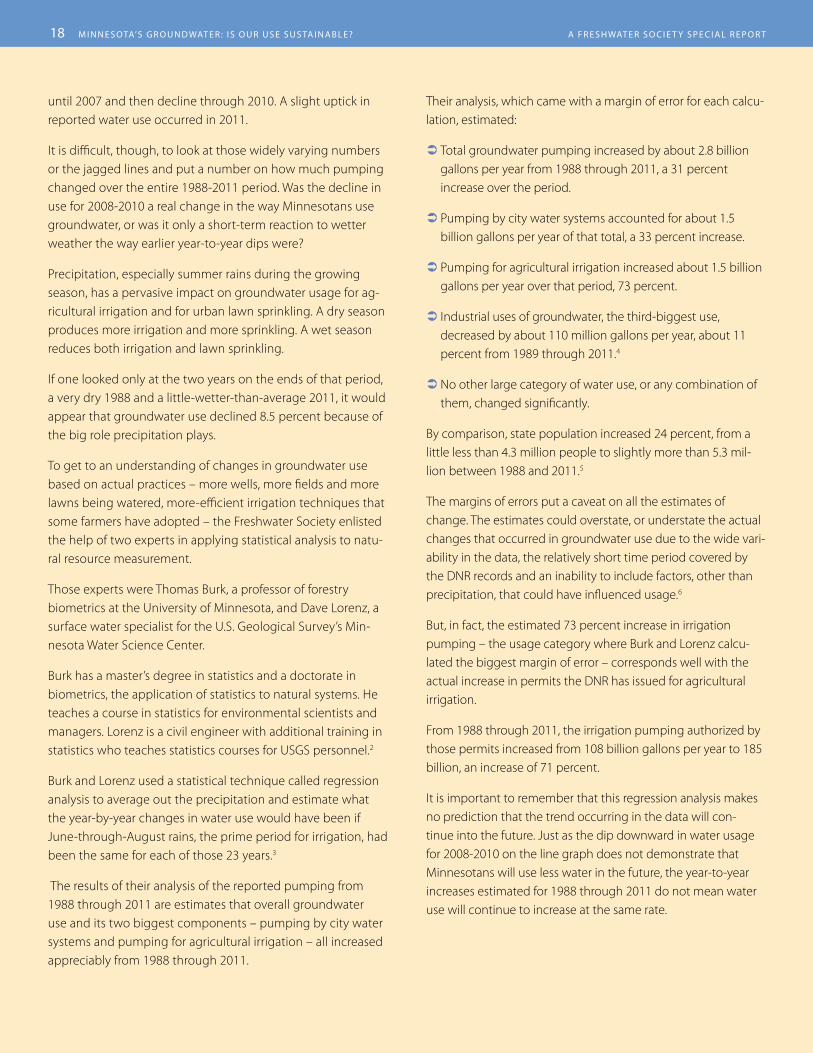
until 2007 and then decline through 2010. A slight uptick in reported water use occurred in 2011.
It is difficult, though, to look at those widely varying numbers or the jagged lines and put a number on how much pumping changed over the entire 1988-2011 period. Was the decline in use for 2008-2010 a real change in the way Minnesotans use groundwater, or was it only a short-term reaction to wetter weather the way earlier year-to-year dips were?
Precipitation, especially summer rains during the growing season, has a pervasive impact on groundwater usage for ag-ricultural irrigation and for urban lawn sprinkling. A dry season produces more irrigation and more sprinkling. A wet season reduces both irrigation and lawn sprinkling.
If one looked only at the two years on the ends of that period, a very dry 1988 and a little-wetter-than-average 2011, it would appear that groundwater use declined 8.5 percent because of the big role precipitation plays.
To get to an understanding of changes in groundwater use based on actual practices – more wells, more fields and more lawns being watered, more-efficient irrigation techniques that some farmers have adopted – the Freshwater Society enlisted the help of two experts in applying statistical analysis to natu-ral resource measurement.
Those experts were Thomas Burk, a professor of forestry biometrics at the University of Minnesota, and Dave Lorenz, a surface water specialist for the U.S. Geological Survey’s Min-nesota Water Science Center.
Burk has a master’s degree in statistics and a doctorate in biometrics, the application of statistics to natural systems. He teaches a course in statistics for environmental scientists and managers. Lorenz is a civil engineer with additional training in statistics who teaches statistics courses for USGS personnel.2
Burk and Lorenz used a statistical technique called regression analysis to average out the precipitation and estimate what the year-by-year changes in water use would have been if June-through-August rains, the prime period for irrigation, had been the same for each of those 23 years.3
The results of their analysis of the reported pumping from 1988 through 2011 are estimates that overall groundwater use and its two biggest components – pumping by city water systems and pumping for agricultural irrigation – all increased appreciably from 1988 through 2011.
Their analysis, which came with a margin of error for each calcu-lation, estimated:
 Total groundwater pumping increased by about 2.8 billion gallons per year from 1988 through 2011, a 31 percent increase over the period.
 Pumping by city water systems accounted for about 1.5 billion gallons per year of that total, a 33 percent increase.
 Pumping for agricultural irrigation increased about 1.5 billion gallons per year over that period, 73 percent.
 Industrial uses of groundwater, the third-biggest use, decreased by about 110 million gallons per year, about 11 percent from 1989 through 2011.4
ÂNo other large category of water use, or any combination of them, changed significantly.
By comparison, state population increased 24 percent, from a little less than 4.3 million people to slightly more than 5.3 mil-lion between 1988 and 2011.5
The margins of errors put a caveat on all the estimates of change. The estimates could overstate, or understate the actual changes that occurred in groundwater use due to the wide vari-ability in the data, the relatively short time period covered by the DNR records and an inability to include factors, other than precipitation, that could have influenced usage.6
But, in fact, the estimated 73 percent increase in irrigation pumping – the usage category where Burk and Lorenz calcu-lated the biggest margin of error – corresponds well with the actual increase in permits the DNR has issued for agricultural irrigation.
From 1988 through 2011, the irrigation pumping authorized by those permits increased from 108 billion gallons per year to 185 billion, an increase of 71 percent.
It is important to remember that this regression analysis makes no prediction that the trend occurring in the data will con-tinue into the future. Just as the dip downward in water usage for 2008-2010 on the line graph does not demonstrate that Minnesotans will use less water in the future, the year-to-year increases estimated for 1988 through 2011 do not mean water use will continue to increase at the same rate.

A F r E s h wAt E r s O c i E t y s p E c i A l r E p O r t M i n n E s OtA’s G r O u n d wAt E r : i s O u r u s E s u s tA i n A b l E ? 19
Minnesota has strict rules requiring permits for well owners who pump large amounts of water and requiring those own-ers to file annual water use reports, but gaps in enforcement undermine the effectiveness of those rules, a Freshwater Society review of state groundwater regulation and practices has found.
The Minnesota Department of Natural Resources, charged with enforcing the statutes and rules on water use and reporting, often has not put a priority on seeking compliance or followed through when enforcement would have required prosecution, DNR officials acknowledge.
Some of that is changing. In 2012, the DNR hired two “compli-ance hydrologists” to conduct intensive searches for unper-mitted pumping in two areas of Minnesota that have lots of agricultural irrigation and where the DNR thinks groundwater use is unsustainable or is becoming unsustainable.
Those areas are the Bonanza Valley, north of Willmar, and the Straight River region near Park Rapids.
Until those recent efforts, the agency often did not invest the time and resources required to demand rigorous compliance with the permitting and pumping laws, the Freshwater review concluded.
Nor has the Legislature granted the DNR’s requests for a law change that would make it easier for the agency to enforce the laws through civil, administrative channels, rather than criminal prosecutions.
“We have laws, but we don’t have sharp teeth,” Julie Ekman, a water regulations supervisor in the DNR’s St. Paul office, said during a question-and-answer session that followed her Oct. 2, 2013, presentation at a Midwest Ground Water Association conference. “We don’t have a real strong enforcement system.”
The DNR routinely receives notification from the Minnesota Health Department when a well driller files notice of drilling a high-capacity well. At that point, the DNR sends out a letter informing the well owner that he or she is required to seek a DNR permit to pump 10,000 gallons per day or 1 million gallons per year.1
If there is no permit application, the DNR normally sends a follow-up letter. There the enforcement effort often stops.
“After that, we move on to other work,” Ekman said at the conference.
enforcement shortcomIngs undermIne sustaInabIlIty effort
In several interviews and in correspondence, Ekman and her supervisor, Dale Homuth, said the DNR knows some well own-ers fail to obtain required permits for pumping. And, at least in the recent past, the agency’s enforcement effort has not been robust, they said.
Under current law, they said, the DNR’s ultimate compliance mechanism is a time-consuming process that requires a con-servation officer to build a case that an unpermitted well owner is pumping, or has pumped, more than the 10,000 gallons of water per day or 1 million gallons per year.
Then the conservation officer has to persuade a county attorney to file a misdemeanor criminal charge against the well owner. If the well owner contests the case, a judge will determine if the law was broken and, if there is a conviction, impose a penalty. In the past, when the DNR gone through those steps, the penalty has been as little as a $50 fine, often an insufficient deterrent, Homuth said.
DNR supervisors also cited workload demands and agency bud-get cuts by the Legislature for the lack of enforcement effort, and they said that pursuing individual well owners for ignoring the permitting and reporting laws sometimes conflicts with more important priorities, such as winning well owners’ support for pumping restrictions in areas where there is not enough water to go around.
Results of the DNR’s enforcement inaction are:
 Some significant number of well owners required by state law and rule to get state permits and pay annual fees for their groundwater pumping never bother to apply for the permits or pay the fees.
 There is little ability – or effort – by the DNR to verify the ac-curacy of water use totals reported by well owners who do have appropriation permits.
 Those deficiencies compromise a statewide water use data base compiled and published each year by the DNR that in many ways is more detailed, comprehensive and publicly ac-cessible than many states attempt to produce. The deficien-cies make the data less useful for measuring and modeling groundwater demand in areas where pumping is suspected of being, or becoming, unsustainable.

20 M i n n E s OtA’s G r O u n d wAt E r : i s O u r u s E s u s tA i n A b l E ? A F r E s h wAt E r s O c i E t y s p E c i A l r E p O r t
Homuth, a DNR section manager, estimated – based on the DNR’s recent compliance checks – that perhaps 10 percent of the agricultural irrigation wells in use in west-central Minnesota, are not covered by water-appropriation permits they should have. Permits for pumping for agricultural irrigation make up about 65 percent of the DNR’s active appropriation permits, and most of the irrigation occurs in west-central Minnesota.
To evaluate the accuracy and completeness of the DNR’s ap-propriation records, the Freshwater Society compared two state data bases and came up with a significantly higher estimate of wells that appeared not covered by required permits.
One data base used for the Freshwater comparison was a state Health Department listing of nearly 138,000 wells drilled from 2000 through 2010. The other data base was the DNR’s list of permits the agency issued, on a fiscal year basis, for water ap-propriations between July 1999 and the end of 2012.
The comparison focused on irrigation, commercial and indus-trial wells with a casing diameter of at least 8 inches, a size that well experts said most well owners would not consider drilling unless they planned to pump at least 10,000 gallons per day.2
Health Department records show 1,829 wells of that size or big-ger were reported drilled from 2000 through 2010.
The Freshwater comparison took a conservative approach that attempted to give the benefit of the doubt to well owners who may have mistakenly thought – as DNR supervisors say they suspect well owners sometimes do – that a new well did not need a water appropriation permit because it replaced an unused well or because the well owner had an appropriation permit for another well.
Of the 1,829 large irrigation, commercial and industrial wells drilled from 2000 through 2010, the Freshwater comparison turned up 495 wells whose owners appeared not to have been issued DNR water appropriation permits by the end of 2012.
The vast majority of those wells, 464 of the 495, were designat-ed at the time they were drilled as irrigation wells. Twenty-two were industrial wells, and nine were commercial wells. The 495 wells that appeared not to have received permits represented 27 percent of those 1,829 high-capacity wells that were drilled.
The Freshwater comparison looked only at the two data bases. The two investigations that Homuth cited were more extensive. They involved the compliance hydrologists checking aerial photos for evidence of irrigation and sometimes visiting farms.
Nevertheless, the Freshwater comparison suggests the problem of unpermitted pumping, especially for irrigation, may be more widespread than Homuth’s 10 percent estimate.
Problems with water appropriation permitting and reporting have their root both in the laws and state rules that require the permitting and reporting and in the DNR’s lack of enforcement. Better laws and rules could facilitate better enforcement.
Under Minnesota state law, all ground and surface waters are publicly owned. A statute says no person, business or govern-ment entity may “appropriate or use waters of the state without a water use permit” issued by the DNR commissioner. A rule elaborating on that stature sets 10,000 gallons per day or 1 million gallons per year as the minimum water use at which a permit is required.
Well drillers drilling most wells in Minnesota, from the smallest drinking water well for a home or a cabin to the biggest indus-trial or irrigation well, are required to file a notice with the state Health Department that a well is planned. That notice informs the Health Department where the well will be drilled and what its intended purpose is.
Failing to file the notice can yield a range of sanctions for a driller, up to a maximum $10,000 fine imposed by the Health Department through administrative action.
Within 30 days of drilling a well, the driller must file a well log detailing the depth and size of the well and the aquifer from which it pumps.
State statutes give the Health Department authority to inspect wells for compliance with health and safety regulations. Except for monitoring wells, which make up only about 10 percent of the wells drilled each year, there is no Health Department or DNR permit required for drilling a well.
Wisconsin and Michigan require permits for so-called “high capacity” wells capable of pumping 100,000 gallons per day before a well is drilled.
That allows those states to consider the impact of such a well on other nearby wells and, in Michigan’s case, on the fish in streams fed by groundwater. Wisconsin’s law requires an environmen-tal review before approving high-capacity wells close to trout streams or in locations where they will reduce the flow of springs.
In Minnesota, the DNR weighs those same factors before award-ing an appropriation permit. A state statute directs the agency

A F r E s h wAt E r s O c i E t y s p E c i A l r E p O r t M i n n E s OtA’s G r O u n d wAt E r : i s O u r u s E s u s tA i n A b l E ? 21
to consider “long-range seasonal requirements for domestic, agricultural, fish and wildlife, power, navigation and quality con-trol purposes” when awarding permits for use of either ground or surface water.
But Minnesota’s consideration of a water-use permit comes after the well owner has invested thousands of dollars in drilling a well. That puts pressure on the DNR to issue the permit.
So far, the Health Department and the DNR have not asked the Legislature to require a pre-drilling permit. But Chris Elvrum, man-ager of the Health Department’s Well Management Section, said he believed officials in both agencies are open to a change in the well construction and water appropriation permitting process.
“We recognize that there is a problem for water management,” Elvrum said. “Once the well is drilled, the DNR can be left in a difficult position.”
In the past, the DNR on three occasions has sought law changes to give the agency a different enforcement remedy, an oppor-tunity to pursue enforcement administratively and seek civil penalties of up to $10,000 for rule and statute violations rather than by pursuing misdemeanor criminal charges for permitting violations, Homuth said.
The Legislature has not authorized that change.
The DNR goes to considerable lengths to collect and publish water usage reports from well owners, and succeeds in collect-ing reports each year from almost all the permitted water users.
But those reports are only as good as the well owners make them.
A statute imposes a requirement that water users must mea-sure their use with a flow meter or some other means accept-able to the DNR and report the usage it to the DNR each year.
Measurements are supposed to be accurate within a margin of 10 percent. Still another statute gives the DNR authority to examine wells and requires well owners to provide information sought by the agency.3, 4
In practice, the DNR rarely second-guesses the water use re-ports submitted by well owners.
The DNR currently is engaged in a $900,000 process to develop an on-line permitting and reporting system. It will speed up permitting for well owners who seek permits, and it will elimi-nate a large part of the paper processing and data entry work that DNR staff now put into collecting water usage reports.
But work plans for the on-line system do not address the DNR’s ability to ensure the basic accuracy of the well owners’ monitor-ing and reporting of their pumping.
The DNR, in a 2010 report titled “Evaluation of Models and Tools for Assessing Groundwater Availability and Sustainability,” acknowl-edged problems in the reporting of pumping by well owners.
“The accuracy of reported water use data depends more than it should on the equipment and the operator,” the report said. “Some of the currently allowable water use measurement methods are not accurate. Water use data would be improved if all water users metered the water used and kept the meters in good repair.” 5
How big a problem is it if a significant number of well owners flout the rule requiring permits for water use in excess of 10,000 gallons per day or 1 million gallons per year? Or if the well owners do not accurately report their water use?
First, a lot of water use may be going unreported.
In 2011, farmers reported pumping 58 billion gallons of groundwater for irrigation. If Homuth’s estimate of 10 percent for unpermitted irrigation pumping is accurate, the unreported usage would have been more than 6 billion gallons. If the Fresh-water estimate of 27 percent is accurate, the unpermitted and unreported usage could have been more than 18 billion.
On a statewide basis, even numbers of that magnitude may not be a big problem. But in areas of the state where the demand for water is great, the supply is limited and the DNR needs to limit pumping – the areas the DNR is beginning to focus on more seri-ously – shortcomings in the data become very important.
Incomplete or inaccurate reports of existing pumping make it difficult for the DNR to determine if existing well owners are abiding by the limits already set in their water use permits and difficult for the agency to accurately predict new levels that will protect ecosystems and avoid drying up other wells.
The 2010 DNR publication asked the question why is it impor-tant to quantify pumping, and then answered the question this way: “Issues of sustainability revolve around how much pumping occurs…continued pumping for human needs has a direct impact on groundwater-dependent and surface-water-dependent ecosystems.” 6

22 M i n n E s OtA’s G r O u n d wAt E r : i s O u r u s E s u s tA i n A b l E ? A F r E s h wAt E r s O c i E t y s p E c i A l r E p O r t
NOTES
Over-pumping threatens groundwater sustainability
1. A U.S. Geological Survey report, titled “Groundwater and Surface-Water Interactions near White Bear Lake, Minnesota, through 2011,” is expected to be available on-line in May at: http://mn.water.usgs.gov . Read a June 2012 article about the research in the Freshwater Society’s newsletter at http://freshwater.org/2012/05/29/groundwater-pumping-blamed-in-white-bear-lake-drop/ View video of a USGS presentation on the research to the White Bear Lake Conservation District board at http://mn.water.usgs.gov/projects/pdf/WBLCDmeeting2212012.pdf
2. Freshwater Society interviews.
3. From the DNR’s data base, available at: www.dnr.state.mn.us/waters/watermgmt_section/appropriations/wateruse.html The numbers are unduplicated permits issued from July 1, 2007, through December 2012.
4. Major crop irrigation permits, issued by the DNR through the end of 2012, cover about 554,000 acres. The National Agricultural Statistics Service’s 2007 Census of Agriculture reported that Minnesota had 19,267,018 acres of harvested cropland. Not every acre covered by a permit is irrigated every year. The Census is available at: www.agcensus.usda.gov/Publications/2007/Full_Report/Volume_1,_Chapter_1_State_Level/Minnesota/ From 1988 through 2011, according to figures reported by the DNR, major crop irrigation averaged 26 percent of total groundwater pumping. The percentage ranged from a low of less than 10 percent in 1993 to about 35 percent in 2007.
5. Available at http://freshwater.org/wp-content/uploads/joomla/PDFs/publications/Water-is-Life-Report.pdf
6. 2011 Minnesota Statutes, 103G.287, Subd. 4.
7. For industrial uses, the statistical analysis left out 1988 pumping, because it was significantly higher than any of the yearly totals that came after it.
8. “Groundwater Sustainability: Toward a Common Understanding” is available on the Freshwater web site at: http://freshwater.org/wp-content/uploads/joomla/PDFs/workshopsummaryandappendix.pdf
9. “Potentiometric Surfaces and Changes in Groundwater Levels in Selected Bedrock Aquifers in the Twin Cities Metropolitan Area, March-August 2008 and 1988–2008.”Available at http://pubs.usgs.gov/sir/2009/5226/.
10. The plan is available at: www.metrocouncil.org. The maps are available at: http://www.metrocouncil.org/Wastewater-Water/Publications-And-Resources/Appendix1_maps-pdf.aspx
11. The three reports are: “Water Availability Assessment Report,” “Long-Term Protection of the State’s Surface Waters and Groundwater Resources,” and “Evaluation of Models and Tools for Assessing Groundwater Availability and Sustainability.”
12. “The Minnesota Water Sustainability Framework.” Available at: htttp://wrc.umn.edu/watersustainabilityframework/index.htm.
13. The DNR estimated in 2007 that on days of average to peak water usage, Minnesota communities use roughly 2.6 times more water during the summer than in the winter. And in the Twin Cities outdoor water use, mostly for lawn watering, accounts for 20 percent to 30 percent of total annual municipal pumping. Cited in the Domestic Use Technical Work Team Report prepared as part of the Minnesota Water Sustainability Framework. The report was accessed at: http://wrc.umn.edu/prod/groups/cfans/@pub/@cfans/@wrc/documents/asset/cfans_asset_290475.pdf.
14. Weather data is from the Western Regional Climate Center. Available at www.wrcc.dri.edu/cgi-bin/divplot1_form.pl?2102
15. Records maintained at the DNR’s LakeFinder web site.
16. “Lake-Ground Water Interaction Study at White Bear Lake, Minnesota.” Available at: http://files.dnr.state.mn.us/publications/waters/wbl_98.pdf
17. The numbers come from DNR pumping data provided by Perry Jones, who led the White Bear Lake research. The five-year averages and the change between them were calculated by the Freshwater Society.
18. Permits are from Fiscal 2003 through the first half of Fiscal 2013.
19. Percentages, from 2010, are from a PowerPoint presentation prepared by Bruce Montgomery of the Minnesota Department of Agriculture.
20. “Long-Term Protection of the State’s Surface Water and Groundwater Resources.” Available at http://files.dnr.state.mn.us/publications/waters/long-term_protection_surface_ground_water_201001.pdf

A F r E s h wAt E r s O c i E t y s p E c i A l r E p O r t M i n n E s OtA’s G r O u n d wAt E r : i s O u r u s E s u s tA i n A b l E ? 23
Groundwater pumping grows faster than population
1. Census-derived annual population estimates from the state demographer.
2. Burk and Lorenz analyzed data that Freshwater had derived from the DNR spreadsheet and from the Minnesota Climatology Working Group. They are not responsible for any conclusions Freshwater reached from their analyses.
3. For overall water use and irrigation use, the regression analyses adjusted reported pumping totals for the varying year-to-year precipitation totals during June, July and August in 13 Minnesota counties that account for nearly 90 percent of agricultural irrigation pumping. The municipal use totals were adjusted for May through September precipitation in 10 counties that accounted for about two-thirds of the pumping by municipal water systems. Other factors, such as temperature and wind speeds, affect evaporation and water use for both irrigation and lawn sprinkling; they were not included in the analyses.
4. Industrial pumping in 1988 was much higher than in the other years. It was not included in the analysis.
5. State demographer.
6. The margins of error are: plus or minus 8 percent for all groundwater use, plus or minus 9 percent for municipal use, plus or minus 36 percent for agricultural irrigation, and plus or minus 3 percent for industrial use. The margins of error are large, but not out of line with similar regression analyses of natural resource data. They are large for a number of reasons:
• Theywereintendedtobeconservativeestimatesoferrorover time in widely variable data.
• The1988-2011periodisrelativelyshortforsuchananalysis.
• Theveryhighpumpingreportedin1988,thefirstyearofthe data, is so much higher than most of the totals that follow it that it contributes uncertainty to the analysis.
Enforcement shortcomings undermine sustainability effort
1. The law requiring permits for water appropriations is Minnesota Statute 1093G.271. It gives the DNR commissioner authority to set a minimum amount for which a permit is not required. That minimum is found at Minnesota Rules 6115.0620.
2. Health Department well logs show that 8-inch wells routinely are tested when they are drilled and found capable of pumping 250 gallons per minute – 360,000 gallons per day – or more.
3. Minnesota Statute 103G.281.
4. Minnesota Statute 103G.275.
5. At page 26.
6. At page 26.

Freshwater society500 shadywood road
Excelsior, Minnesota 55331952-471-9773 | 888-471-9773
printEd with sOy-bAsEd inK On pApEr FrOM sustAinAbly GrOwn FOrEsts.