Embed Size (px)
Citation preview

Copyright2014Regents of theUniversityofMinnesota
Quality Control of Illumina Data using Galaxy
August 18, 2014
Contents
1 Introduction 21.1 What is Galaxy? . . . . . . . . . . . . . . . . . . . . . . . . . . . . . . . . . . . . . 21.2 Galaxy at MSI . . . . . . . . . . . . . . . . . . . . . . . . . . . . . . . . . . . . . . 21.3 Scope of this tutorial . . . . . . . . . . . . . . . . . . . . . . . . . . . . . . . . . . . 21.4 Where to get more information . . . . . . . . . . . . . . . . . . . . . . . . . . . . . 2
2 Getting Started With Galaxy 32.1 Accessing Galaxy at MSI . . . . . . . . . . . . . . . . . . . . . . . . . . . . . . . . . 32.2 Import FASTQ Files From Data Library . . . . . . . . . . . . . . . . . . . . . . . . 42.3 Set File Attributes . . . . . . . . . . . . . . . . . . . . . . . . . . . . . . . . . . . . 6
3 Evaluating FASTQ File Quality 73.1 Running FastQC . . . . . . . . . . . . . . . . . . . . . . . . . . . . . . . . . . . . . 93.2 Viewing and Understanding FastQC results . . . . . . . . . . . . . . . . . . . . . . 10
4 Cleaning FASTQ Datasets 124.1 Why Is Cleaning Required? . . . . . . . . . . . . . . . . . . . . . . . . . . . . . . . 124.2 Remove Low Quality Tails . . . . . . . . . . . . . . . . . . . . . . . . . . . . . . . . 134.3 Remove Adapter Contamination . . . . . . . . . . . . . . . . . . . . . . . . . . . . . 154.4 Resyncing Left and Right FASTQ Files . . . . . . . . . . . . . . . . . . . . . . . . . 16
5 Review FastQC Results From Cleaned Datasets 17
6 Workflows 206.1 Extract Workflow from Current History . . . . . . . . . . . . . . . . . . . . . . . . . 206.2 View and Edit the Workflow . . . . . . . . . . . . . . . . . . . . . . . . . . . . . . . 216.3 Running a Workflow . . . . . . . . . . . . . . . . . . . . . . . . . . . . . . . . . . . 22
7 Sharing Workflows and Histories 257.1 Share a History . . . . . . . . . . . . . . . . . . . . . . . . . . . . . . . . . . . . . . 257.2 Share a Workflow . . . . . . . . . . . . . . . . . . . . . . . . . . . . . . . . . . . . . 25
8 Cleaning Up Histories: Deleting Data From Galaxy 268.1 Deleting Intermediate Files and Histories from Galaxy . . . . . . . . . . . . . . . . 26
1

Copyright2014Regents of theUniversityofMinnesota
1 Introduction
1.1 What is Galaxy?
Galaxy is a web-based interface that allows users to create complex computational pipelines toanalyze biological data. Galaxy is designed to help you create reproducible workflows that can beused with multiple datasets, shared with others and published. Common bioinformatics softwaresuch as BLAST, BWA and GATK can be accessed though the Galaxy interface along with manyother tools for converting between different formats, manipulating data and basic statistics.
1.2 Galaxy at MSI
There are many instances of Galaxy, the one available to you though MSI is maintained by MSI andconnects directly to the computational resources at MSI. The tools available will vary dependingon which instance of Galaxy you use. While transferring workflows from one instance of Galaxyto another is easy, MSI has no control over which tools are available in other Galaxy instances. Ifthere is a tool that you have used in a different instance of Galaxy that is not available in the MSIinstance send a request to [email protected].
1.3 Scope of this tutorial
• Give participants experience with the basic functionality of Galaxy
– Accessing Galaxy at MSI
– Galaxy layout
– Loading files into current Galaxy history
– Creating a workflow
– Sharing histories and workflows
– Where to get more information
• Basic processing and quality control on Illumina sequencing data
– Evaluating read quality
– Adapter removal
– Low quality read removal
– Read trimming
1.4 Where to get more information
• From other Galaxy users: https://wiki.galaxyproject.org/
• From MSI: https://www.msi.umn.edu/content/bioinformatics-analysis
2

Copyright2014Regents of theUniversityofMinnesota
2 Getting Started With Galaxy
Sections of GalaxyGalaxy has three main sections; Tools Pane, Histories Pane, and the Center Pane.
• Tools Pane
– Found on the left side of the browser.
– Contains all of the different tools that can be used within Galaxy. These include toolsthat do simple text manipulations and arithmetic to tools with more complex functionsspecific to the analysis of next generation sequence data and statistics.
– Combining these different tools allows you to analyze your data.
– Tools are organized into several heading or they can be found using the search bar atthe top of the pane.
• Histories Pane
– Found on the right side of the browser.
– Contains the history of the tools you have used and the results.
– Histories can be saved, shared and turned into workflows that can also be saved, sharedand reused.
• Center Pane
– Found in the center of the browser.
– When using a tool the options for that tool and information about the tool will be inthe Center Pane.
– Clicking on the Eye Icon in the history pane will give of view of the data in the CenterPane.
2.1 Accessing Galaxy at MSI
a) Open a web browser and navigate to the MSI Galaxy galaxy.msi.umn.edu
b) Log in with your MSI username and password
c) Tools Pane
d) Center pane
e) History Pane
f) The side panels can be collapsed via arrows in the bottom corner to provide a better view ofthe Center Panel.
g) Search bar to find tools.
3
Copyright2014Regents of theUniversityofMinnesota
h) The total quantity of data your group has stored in Galaxy is displayed in the top right corner.
i) You can always get back to the main screen using Analyze Data in the top menu bar.
2.2 Import FASTQ Files From Data Library
Getting data into MSI Galaxy- Data Libraries
• Sequencing Data from UMGCSequencing data from UMGC can be accessed in Galaxy though the creation of a data library.In general, each PI with access to Galaxy account will have one data library that can containmany different pieces of data. When you or your PI receives an email from UMGC indicatingthat your sequencing data is available you can have that data moved into your PI’s Galaxydata library by forwarding the email to [email protected] with a request to add the datato Galaxy. You can then access the sequencing data library from the Shared Data tab in theblue bar at the top of the Galaxy page. If your PI doesn’t currently have a data library anew one will be created the first time you request to have data added to Galaxy.
• External DataThe Get Data heading in the Tool Pane is a good resource for obtaining external data frompublic databases such as the UCSC genome browser and SRA. You can also upload small(<2GB) files directly from your computer. When data is uploaded using the tools under GetData they will appear in your current history.
4

Copyright2014Regents of theUniversityofMinnesota
• Larger External DatasetsData files that are larger than 2GB will have to be placed into a data library to be accessed inGalaxy. In your groups home directory there is a galaxy folder (/home/yourGroup/galaxy).To get data into your PI’s data library move it into the galaxy folder in your groups homedirectory then send a ticket to [email protected] with the location of the data to be addedto your PI’s data library.
a) At the top of the screen select Shared Data then in the menu Data Libraries
b) Select RISS-tutorial-galaxy101 from the list of data libraries
c) Expand the FastQ folder and check the boxes next to the first two files, Tutorial file R1.fastqand Tutorial file r2.fastq
d) Select Go next to Import to current history below the data files to move the data to yourcurrent history.
e) Select Analyze Data in the blue bar to move back to the main Galaxy view.
5

Copyright2014Regents of theUniversityofMinnesota
2.3 Set File Attributes
AttributesSetting the file attributes will tell the different tools in Galaxy what format the data is in. Galaxydoes some work to auto detect the files that can be used as inputs for different tools. If you findthat the file you want to use as an input is not available in a drop down menu check to see if youhave set the file attributes. Information about different files types can be found though the USCSgenome browser and from Current Protocols in Bioinformatics.
Special note about FASTQFASTQ files contain quality information for each sequenced base encoded using the charactersfound in the fourth line of each block. The preferred encoding for MSI Galaxy is Sanger. If youare looking at Illumina data created in 2012 or later your FASTQ files already using the Sangerencoding. If you sequencing was done before 2012 then you should use FASTQ Groomer to convertto the Sanger encoding (Sanger & Illumina 1.8+).
Canonical genomesBoth Mouse (mm9) and Human (hg19, hg18) have canonical versions in Galaxy. For most NGSanalyses you will want to use the canonical versions of the genome if available. These genomescontain only the standard chromosomes (i.e., somatic, sex and mitochondria ) and do not includeparts of the genome that have unknown locations, haplotype specific chromosomes or randomchromosomes.
a) In the History Pane click on the pencil icon next to Tutorial file R2.fastq. This will bring upthe files Attributes in the Center Pane.
b) This is a human dataset so select Human hg19 in GATK canonical in the drop down menuunder Database/Build:. You can scroll or if you begin to type “hg19” then you will only seethe options with “hg19” in the name.
c) Click Save
d) Switch to the Datatype tab by selecting it from the top of the Center Pane
e) Select fastqsanger from the drop down menu. You can scroll or if you begin to type “faster”then you will see the options with “fastq” in the name. NOTE: do not select fastqcsanger.
f) Click Save
g) Change the attributes and data type for the other fastq file to match.
6

Copyright2014Regents of theUniversityofMinnesota
3 Evaluating FASTQ File Quality
FASTQ Format and Quality ScoresThis tutorial is geared towards Illumina data in FASTQ format, other sequencing methods (i.e.,Roche 454) may produce reads with a different patterns of errors or a different file format. Qualitycontrol tools for other NGS data types can be found under the NGS: QC and manipulation headingin the Tool Pane.
A sequence record in a FASTQ file consist of four lines 1) an @accession line 2) sequence data3) + place holder line 4) quality score line. FASTQ quality scores encode the estimated chance ofa miscalled base at each location. Single ASCII characters are used to encode the quality scores,as opposed to raw numbers, so that there is always a 1-to-1 relationship between the number ofbases in the read and the length of the quality score. Quality score reflect the probability thata base call was incorrect, calculated as a Phred quality score ( Phred Q = -10log(p), where p isthe probability that the inferred base is incorrect). The higher the Phred score the smaller the
7

Copyright2014Regents of theUniversityofMinnesota
probability that the base call was incorrect. A Phred score of 10 indicates a 1 in 10 chance of anincorrect base call while a oared score of 50 indicates a 1 in 100,000 chance of an incorrect basecall.
Unfortunately, FASTQ files from different sources sometimes encode quality scores slightlydifferently. Sanger and current Illumina FASTQ format uses a Phred+33 encoding, which meansthat the lowest Phred score of 0 is encoded as ASCII character 33 (!), while Solexa and pre-2012Illumina software uses Phred+64 encoding (Phred 0 encoded as @). But in all cases, the higherthe Phred quality scores the higher quality the base call. In Galaxy you can use FASTQ Groomerto ensure your data is in the Sanger/Illumina 1.8 + encoding.
FastQC Metrics
• Basic StatisticsGives the name of the input file, encoding used for the quality score, total sequence count,average sequence length and GC content (%).
• Per Base Sequence QualityA important figure showing the average quality score at each position across all reads. Ingeneral, quality scores are lower at the start and each of reads. Sudden dips in the middleof a read can signify failed cycles in the sequencing run (machine errors).
• Per Sequence Quality ScoresHistogram charting the average quality across a read. Low quality reads can be removed buta majority (at least 75%) of you data should be of high quality.
• Per Base Sequence ContentThe frequency of each nucleotide at each position across all of the reads. Extremely highnucleotide bias can be a sign of trouble, short stretches with high bias can be caused by thepresence of linkers, barcodes or adapter contamination. There is usually some minor bias inthe first 11-13bp of RNA-seq data due to not-quite random hexamer sequence priming butthis bias is accounted for in the downstream analysis.
• Per Base GC ContentAverage GC content (%) at each position along the reads. GC content should be stableacross the read and large changes indicate issues.
• Per Sequence GC ContentThis figure will show you both the theoretical distribution of GC content and the GC contentof your data. These distributions should be similar.
• Per Base N ContentRate of ambitious base calls (N) for each position along the reads. This count should bevery low (<10), to many N calls indicates issues with the sequencing run (usually machineerrors).
• Sequence Length DistributionsHistogram of the sequence lengths. Illumina reads that have not been trimmed will all havethe same length, once trimmed you want a majority of your reads to be full length and asmall percentage to be shorter.
8

Copyright2014Regents of theUniversityofMinnesota
• Sequence Duplication LevelsFrequency of exact sequence duplicates in the dataset. High duplication rates can be causedby PCR artifacts and/or low library diversity. Low levels of duplication can be removed but,high levels indicate issues with the library preparation.
• Overrepresented SequencesA list of overrepresented sequences if they exist in the data. These are the sequences thatare contributing to the data in the Sequence Duplication Level graph.
• K-mer ContentShows the amount (% of reads) and sequence of overrepresented K-mers. High levels ofoverrepresented sequences usually arise from adapter contamination and these levels shoulddrop after adapters are removed from your data.
3.1 Running FastQC
a) From the Tools Pane select the NGS: QC and manipulation header.
b) Select the FastQC: Read QC tool.
c) Alternatively, use the search bar at the top of the tool pane to find FastQC.
d) Select the file to analyze from the drop-down menu: Tutotial file R2.fastq
e) Rename the output file to something meaningful such as “Precleaning R2”.
f) Select Execute
g) Repeat this process for the Tutorial file R1.fastq file changing the name of the output to reflectthe use of the new file (“Precleaning R1”).
9

Copyright2014Regents of theUniversityofMinnesota
3.2 Viewing and Understanding FastQC results
In the following review of the FastQC results we will present the result of both the Left ( R1)and Right ( R2) FASTQ files side by side. We do this to accentuate the differences between thetwo datasets and to highlight the importance of checking the quality of both sets of reads. It isnormal for one set of reads to be considerably different in quality from the other. Usually, the Leftreads are higher quality due to being sequenced first.
a) In the History Pane select the Eye Icon next to the name of the output from using the FastQC:ReadQC tool. This will allow you to view the results in the Center Pane.
b) Scroll to the “Per base sequence quality”.
c) Note how the quality of the reads drops towards the 3’ ends of the reads
d) Dips like this are indicative of a failed cycle on the sequencing machine.
10

Copyright2014Regents of theUniversityofMinnesota
e) Scroll to “Per sequence quality scores”.
f) Note the bimodal distribution with a population of low quality reads.
g) Scroll to “Sequence duplication levels”.
h) Note the presence of duplicated reads, here up to 5 copies. Some duplication is expected andthis is a relatively low level of duplication. Large number of sequences in the 10+ column wouldindicate issues.
11

Copyright2014Regents of theUniversityofMinnesota
i) Scroll down to “Kmer content”
j) Note the presence of over enriched k-mere at the 3’ end of the reads, this is indicative of3’ adapter contamination. Adapter sequences may also be identified as an ”OverrepresentedSequence”.
4 Cleaning FASTQ Datasets
4.1 Why Is Cleaning Required?
Low Quality Tails and Failed CyclesFor a variety of reasons, including decay of reagents as they sit on the sequencing machine, thequality of base calls tends to decrease as sequencing progresses. As a result the 5’ ends will tend tohave higher quality than the 3’ ends and forward reads will tend to have better quality than reversereads. Low quality base calls can impair the accuracy of mapping algorithms so it is important toto remove them. Low quality tails can be removed though the removal of the 3’ ends from all ofthe reads but, that would result in the removal of many reads that were of higher quality as well.
12

Copyright2014Regents of theUniversityofMinnesota
More sophisticated methods only remove the tails that show evidence of low quality. In Galaxythere are tools that can accomplish either style of read trimming.Cycles fail because of sequencing machine error, such as failure to incorporate a base, or failure toimage a specific region. For most analysis failed cycles can be ignored as they will not have largeeffects.
Adapter ContaminationIllumina libraries consist of the DNA of interest (green) with ligated adapter (red + yellow) onthe 5’ and 3’ ends to proved priming site for the sequencing reactions. The forward adapter(left) provides a region that binds to the Illumina flow cell plate (blue) and a region to whichthe sequencing primer binds to start the sequencing reactions. The reverse adapter (right) hasthe same structure with the addition of a barcode sequence (yellow). Adapter contaminationoccurs when the DNA fragment of interest is shorter than the length of the sequencing read.This results in the opposite primer included in the sequence of the final read, leading to adaptercontamination.Removal of adapter contamination in Galaxy can be accomplished using CutAdapt and thesequence of the primers.
Illumina TrueSeq adapters:Forward: 5’ AATGATACGGCGACCACCGAGATCTACACTCTTTCCCTACAC-GACGCTCTTCCGATCT 3’Reverse: 5’ GATCGGAAGAGCACACGTCTGAACTCCAGTCACNNNNNNATCTCGTATGC-CGTCTTCTGCTTG 3’
4.2 Remove Low Quality Tails
a) Open the NGS: QC and manipulation section of the Tool Pane, or use the search bar.
b) Select FASTQ Quality Trimmer
c) In the FASTQ drop down menu select the Right FASTQ file, Tutorial file R2.fastq
d) Set Trim ends to 3’only.
e) Set Window size to 3.
13

Copyright2014Regents of theUniversityofMinnesota
f) Set Quality Score to 20.
g) Select Execute.
h) Repeat these steps on the Left FASTQ file. To rerun a tool from your history you can selectthe underlined name of the output in the History Pane, expanding the box. Then select theRecycle Icon which will load the tool with the setting preloaded. For FASTQ Quality Trimmerinstance you will just need to change the name of the input files.
14

Copyright2014Regents of theUniversityofMinnesota
4.3 Remove Adapter Contamination
a) Select FASTA manipulation from the Tool Pane.
b) Select Cutadapt to bring up the tool options in the Center Pane.
c) Under Fastq file to trim: select Right ( R2) FASTQ file that has already been trimmed forquality.
d) Select Add new 3’ Adapters
e) Under Choose 3’ Adapters select “TrueSeq Universal Adapter Reverse Complement”
f) Set “Minimum overlap length” to 5
g) Set “Output filtering options:” to ‘’Set Filters”.
h) Set “Minimum length” to 25
i) Select Execute.
j) Run CutAdapt again (Recycle Icon) using the Left ( R1) quality trimmed FASTQ file. Use“TrueSeq Index Adapter” as the 3’ adapter.
15

Copyright2014Regents of theUniversityofMinnesota
k) Cutadapt will produce a report as well as the cleaned up FASTQ file.
l) Open the Cutadapt report by selecting the Eye Icon in the history pane.
m) Note the length distribution of removed sequence.
4.4 Resyncing Left and Right FASTQ Files
Trimming and other quality control measures can result in the removal of reads from thedataset. Additionally, some processing steps may change the order of the reads in the dataset.Many programs expect to find the same read names in the same order for both the Left and Right
16

Copyright2014Regents of theUniversityofMinnesota
FASTQ files. To ensure that the read names are in ‘sync’ MSI Galaxy has the resync: Paired-endresynchronization tool.
a) Select the MSI header from the Tool Pane.
b) Select resync: Paired-end resynchronization.
c) Select as Input 1: the quality and adapter trimmed Right FASTQ file
d) Select as Input 2: the quality and adapter trimmed Left FASTQ file
e) Select Execute
5 Review FastQC Results From Cleaned Datasets
In this section we will compare the results from FastQC between the original FASTQ file andthe quality and adapter trimmed FASTQ files. You should always examine the results post FASTQfile clean up before moving forward with more complex analysis. Here we will be showing boththe results from the original FASTQ files as well as those from the quality and adapter trimmedFASTQ files.
a) Use FastQC to examine the quality statistics for the quality and adapter trimmed FASTQ files.Select the Eye Icon to view the results.
b) Scroll down to “Per base sequence quality”. Note the improvement in the average quality ofthe read tails.
17

Copyright2014Regents of theUniversityofMinnesota
c) Scroll down to “Per sequence quality scores”. Verify removal of low quality peak.
18

Copyright2014Regents of theUniversityofMinnesota
d) Scroll down to “Sequence Length Distribution”. Note the degree of trimming that has occurred.
e) Scroll down to “Kmer Content”. Note the absence of overrepresented tail k-mers.
19

Copyright2014Regents of theUniversityofMinnesota
6 Workflows
Creating a WorkflowThe ability to create, reuse, share and publish workflows is on of Galaxy’s largest strengths.Creating workflows allows you and anyone you want to collaborate with to exactly recreate analysis.You can think of workflows as your computational lab notebook, they are how you document yourcomputational work. Workflows are also handy when you have to clean up your Galaxy space.Saving the raw input data and the workflow that leads to a final result allows you to delete theintermediate files yet retain the ability to recreate the entire analysis at any time. Workflowscan be extracted from histories or created from scratch. Either method will result in a useableworkflow so how you choose to build one is up to you.Workflows are made up of connected tools, each tool is represented as a box and data moving fromone tool to another is represented by the arrows. The inputs required for the tool can be foundabove the horizontal line in the box while the possible outputs are found below the line. Outputsfrom each tool can be saved and/or used as in the input for the next tool. Selecting the box willdisplay the settings associated with the tool allowing you to preset parameters to reuse each timethe workflow is run.
6.1 Extract Workflow from Current History
a) Select the Gear Icon from the top of the history pane.
b) Select Extract Workflow from the menu.
c) In Workflow name enter “QC and Cleanup”.
d) Select Create Workflow.
20

Copyright2014Regents of theUniversityofMinnesota
6.2 View and Edit the Workflow
a) Select Workflow from the top bar.
b) Select the workflow that you just created and select Edit from the drop down menu.
c) The initial view of the workflow may be very messy. You can drag the boxes around on thescreen to make the workflow easier to interpret. You can also move the blue box in the bottomright corner to view other sections of the workflow.
d) The workflow will follow the same logic as the history you created it from. Can you trace thesteps you took for each initial FASTQ file though the QC and clean up process?
e) Select a FastQC:Read QC box which will open the Details Pane on the right. Is this for theLeft or Right reads?
f) Select the Input dataset box that is attached (connected arrows) to the FastQC:Read QC boxyou just viewed.
g) Label the Input dataset either Left or Right to correspond with the information from theFastQC:Read QC box you just viewed.
h) Do the same for the other Input dataset.
i) The next time you need to run QC and clean up FASTQ data you might need to use differentadapter sequences. Selecting the Cutadapt box to view the Details Pane.
j) In the Details Pane for Cutadapt change the adapter sequence to “Set at runtime” using thesmall arrow next to Choose 3‘ Adapter. Do the same for the Cutadapt box associated with theother Input dataset.
k) Select the Gear Icon then Save from the menu.
21

Copyright2014Regents of theUniversityofMinnesota
6.3 Running a Workflow
a) Select Analyze Data from the top bar to return to the main Galaxy screen.
b) Create a new history by selecting the Gear Icon then Create New from the menu.
c) Name the history “Workflow Test”
d) Import “Tutorial file workflow R1.fastq” and “Tutorial file workflow R2.fastq” into the current“Workflow Test” history from the data library(Section 2.2. Don’t forget to set the file attributes(Section 2.3).
22

Copyright2014Regents of theUniversityofMinnesota
e) Select Workflow from the top bar to display your saved workflow from the data library.
f) Select the QC and Cleanup workflow you just created then select Run from the drop downmenu.
g) In the Center Pane select the “ R1.fastq” file for the Left Read Input using the drop downmenu.
h) Select the “ R2.fastq” file for the Right Read Input using the drop down menu.
i) Scroll down the the Cutadapt steps and select the appropriate adapters.
j) Scroll to the bottom of the main view and select Run workflow
k) Select Analyze Data in the top bar to return to the main Galaxy view.
23

Copyright2014Regents of theUniversityofMinnesota
l) You will be able to watch the progress of the workflow in the History Pane.
24

Copyright2014Regents of theUniversityofMinnesota
7 Sharing Workflows and Histories
It is possible to share workflow and histories with other Galaxy users. This allows you toshare data, results and methods with collaborators or anyone who might want to recreate yourmethodology. Galaxy histories and workflows can be shared via a link or they can be saved asstand alone files that can then be uploaded to any Galaxy instance.
7.1 Share a History
a) To share your current history select the Gear Icon then Share or Publish
b) To share the history though a web link select Make History Accessible via Link. You can sharethis link with anyone who has access to Galaxy at MSI allowing them to view the history andthe data in it.
c) Make History Accessible and Publish will also create a link to the history but it will also publishthe history making it public to anyone with access to Galaxy at MSI under the Shared Datatab.
7.2 Share a Workflow
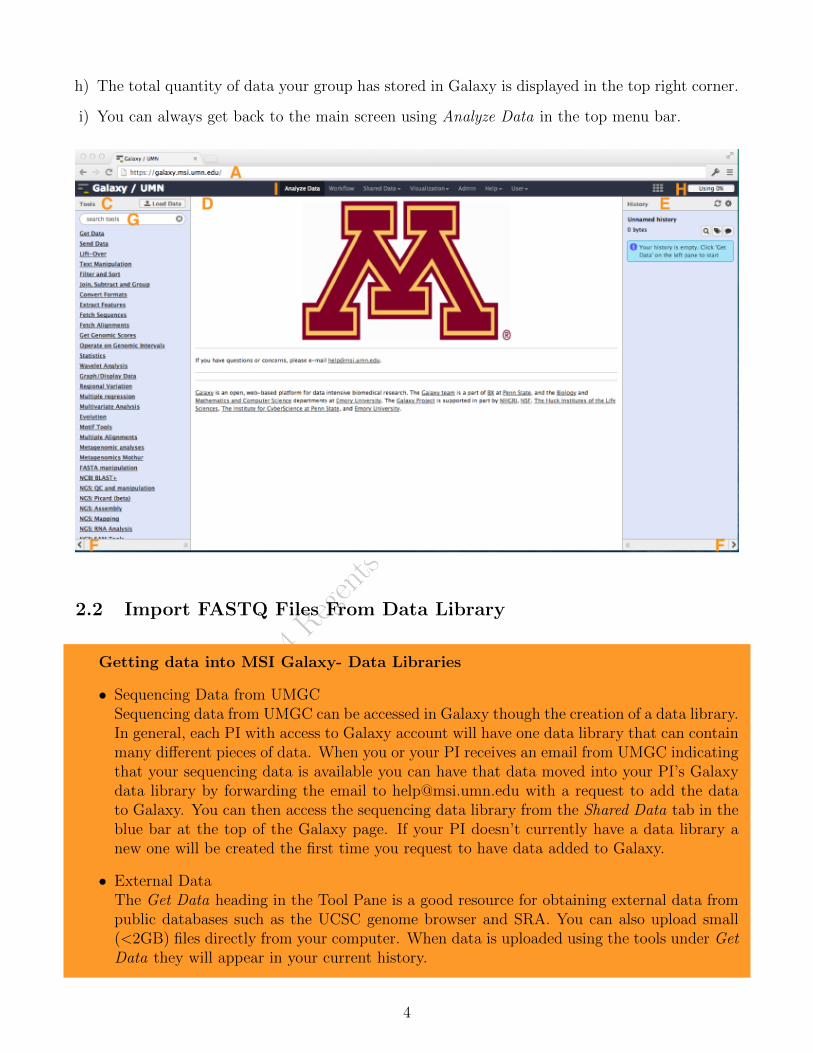
a) When you select a workflow from the list one of the options is Share or Publish
b) To share the workflow though a web link select Make Workflow Accessible via Link. You canshare this link with anyone who has access to Galaxy at MSI allowing them to view and usethe workflow.
c) Make Workflow Accessible and Publish also creates a link to the workflow but it will also publishthe workflow making it public to anyone with access to Galaxy at MSI under the Shared Datatab.
25
Copyright2014Regents of theUniversityofMinnesota
d) You can also download a workflow to be imported into another Galaxy instance or to be archivedby selecting Download or Export.
8 Cleaning Up Histories: Deleting Data From Galaxy
Galaxy is a shared resource so the amount of data you and your group can have in Galaxyis limited. We estimate that even a relatively simple RNAN-seq analysis will use 4-5 times thestorage of the raw sequencing files. Many of these files are intermediate and can be discarded oncethe analysis is complete. Also, since Galaxy allows you to create workflows it is easy to recreateintermediate files if they are needed later. It is good practice to extract workflows from historiesthen discard the histories once you have completed the analyses.Your groups current Galaxy usage is displayed in the top bar on the far right. You can view thesize of your different Galaxy histories when you view you saved Galaxy histories using the GearIcon and below the name of your current history. If you delete a Galaxy history before you extracta workflow you will not be able to do so later.
8.1 Deleting Intermediate Files and Histories from Galaxy
a) Select Analyze Data in the top bar to get to the main Galaxy view.
b) Select the Gear Icon and then Saved Histories from the menu.
c) Select the history you created when you tested your workflow then select Switch to open thehistory in the Galaxy History Pane.
d) To delete specific pieces of data from a Galaxy history you can select the X.
e) Notice that when the data set is deleted that the size of the history does not change. This isbecause Galaxy has a recycling bin type function.
f) To permanently delete a dataset first unhide the hidden datasets by selecting the Gear Iconthen Include Deleted Datasets.
26

Copyright2014Regents of theUniversityofMinnesota
g) Select the here link displayed in the history pane for the data you would like to delete. Thiswill actually reduce the size of the history.
h) You can delete an entire history from the same page where you can view your saved histories.
i) Select the Gear Icon then Saved Histories
j) Select the history that you want to delete. Delete Permanently will remove the history imme-diately while Delete will place the history in the recycling bin.
k) While data can be restored from the recycle bin MSI will clear out the recycle bin monthly soif you choose to delete a history you should just Delete Permanently.
27

Copyright2014Regents of theUniversityofMinnesota
28