Embed Size (px)
Citation preview

Minkowski Diagrams
By R. Steve Turley
Physics 222, Winter 2011
Contents
1 Introduction 2
2 Stationary Coordinate System 3
2.1 Event . . . . . . . . . . . . . . . . . . . . . . . . . . . . . . . . . . . . . . 32.2 Moving Object . . . . . . . . . . . . . . . . . . . . . . . . . . . . . . . . . 42.3 Extended Object . . . . . . . . . . . . . . . . . . . . . . . . . . . . . . . . 6
3 Coordinate Transformation 6
3.1 Light Cone . . . . . . . . . . . . . . . . . . . . . . . . . . . . . . . . . . . 73.2 Accelerating Reference Frames . . . . . . . . . . . . . . . . . . . . . . . . 9
4 Special Relativity E�ects 11
4.1 Length Contraction . . . . . . . . . . . . . . . . . . . . . . . . . . . . . . . 114.2 Time Dilation . . . . . . . . . . . . . . . . . . . . . . . . . . . . . . . . . . 114.3 Adding Speeds . . . . . . . . . . . . . . . . . . . . . . . . . . . . . . . . . 134.4 Simultaneity . . . . . . . . . . . . . . . . . . . . . . . . . . . . . . . . . . . 13
List of Figures
1 Minkowski diagram for a stationary coordinate system . . . . . . . . . . . 32 A single event in a stationary reference frame . . . . . . . . . . . . . . . . 43 object moving at β = 1/4 . . . . . . . . . . . . . . . . . . . . . . . . . . . 54 Stationary object at the position x = 2. . . . . . . . . . . . . . . . . . . . 55 Stationary object of length 4 starting at x = −2 . . . . . . . . . . . . . . . 66 extended object with β = 1/4 . . . . . . . . . . . . . . . . . . . . . . . . . 77 x′ and t′ axis for β = 0.5 . . . . . . . . . . . . . . . . . . . . . . . . . . . . 88 light cone . . . . . . . . . . . . . . . . . . . . . . . . . . . . . . . . . . . . 89 two events in Region 1 . . . . . . . . . . . . . . . . . . . . . . . . . . . . . 910 two events in Region 3 . . . . . . . . . . . . . . . . . . . . . . . . . . . . . 1011 two events which occur in di�erent regions . . . . . . . . . . . . . . . . . . 10
1

12 object of length 10 moving at β = 0.6 . . . . . . . . . . . . . . . . . . . . 1213 moving object 4 sec after starting at origin . . . . . . . . . . . . . . . . . . 1214 speed of moving object in moving reference frame . . . . . . . . . . . . . . 1315 two simultaneous events . . . . . . . . . . . . . . . . . . . . . . . . . . . . 14
1 Introduction
Your textbook presents the Lorentz transformation using an algebraic approach. Equa-tion 1.37, for instance, gives the coordinates of an object in a coordinate system movingin the x direction with speed v.
x′ = γ(x− vt) (1)
y′ = y (2)
z′ = z (3)
t′ = γ
(t− vx
c2
)(4)
This is called a Lorentz transformation. Since, y and z aren't modi�ed by the transfor-mation, let's just consider what happens to x and t as a result of Equations 1 and 4.These two equations are linear in x and t (the variables t and x appear to the �rst powerand are only multiplied by constant functions of γ, v, and c.One can get helpful insights by looking at this transformation graphically. Then the
ideas of time dilation, length contraction, simultaneity constraints, and and other rela-tivistic phenomena become evident geometrical relationships. Events and moving objectshave constant locations on these graphs, independent of the coordinate system (i.e. in-dependent of the inertial reference frame). Their times and lengths measured in a giveninertial reference frame are determined by their coordinates as measured on the coordi-nate axes appropriate for that reference frame. This kind of graphical transformation iscalled a Minkowski diagram. A graphical representation of an object's position and timeis called a space-time diagram.In this handout, I will start by discussing what an event, a moving point, and a station-
ary or moving extended object look like in a single reference frame which is stationarywith respect to the observer. Section 3 then discusses how this graph changes when thex and t coordinates are transformed according to Equations 1 and 4. Section 4 thenapplies this transformed coordinate graph to show graphically how length contraction,time dilation, speed limitations, and simultaneity issues appear in this graphical format.The graphics shown in the handout were generate using the java program special.jar,
which you can launch from our course web page using the link �Minkowski.� You canalso run it directly from the URL http://volta.byu.edu/special.You will �nd de�nitions of special nomenclature used in this article on page 14.You can �nd an alternative explanation of Minkowski diagrams in Wikipedia at
http://en.wikipedia.org/wiki/Minkowsk$\_$diagram.
2
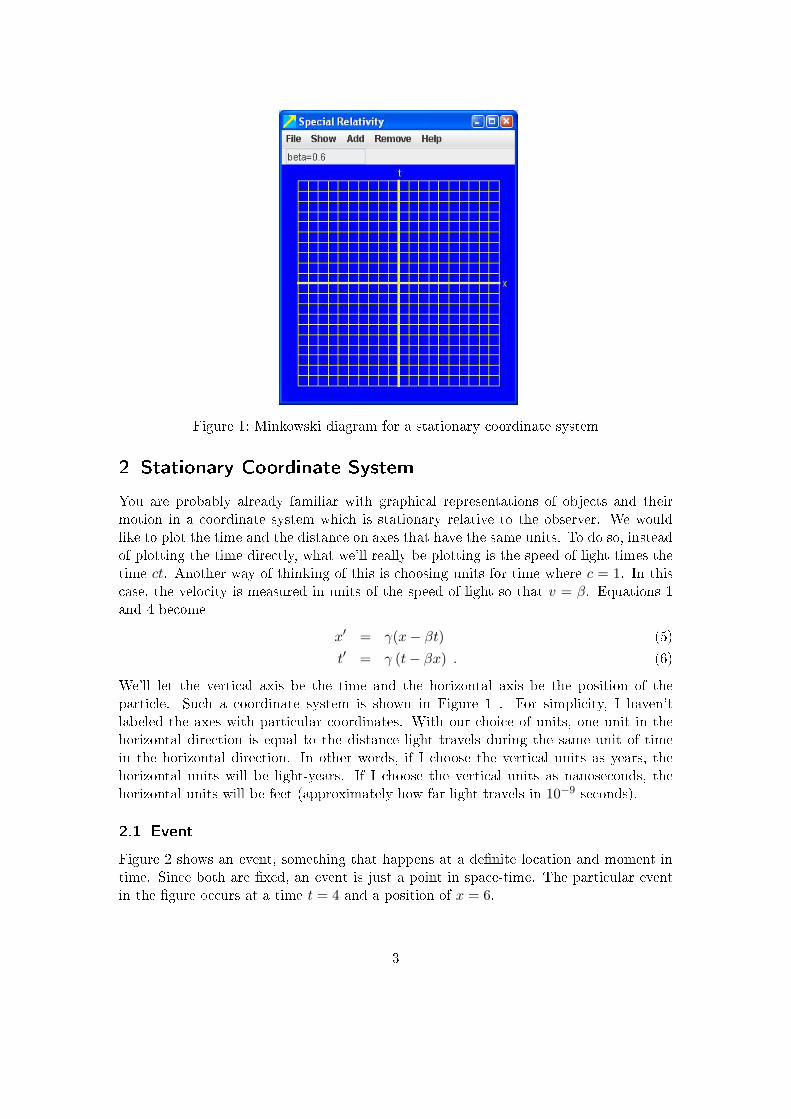
Figure 1: Minkowski diagram for a stationary coordinate system
2 Stationary Coordinate System
You are probably already familiar with graphical representations of objects and theirmotion in a coordinate system which is stationary relative to the observer. We wouldlike to plot the time and the distance on axes that have the same units. To do so, insteadof plotting the time directly, what we'll really be plotting is the speed of light times thetime ct. Another way of thinking of this is choosing units for time where c = 1. In thiscase, the velocity is measured in units of the speed of light so that v = β. Equations 1and 4 become
x′ = γ(x− βt) (5)
t′ = γ (t− βx) . (6)
We'll let the vertical axis be the time and the horizontal axis be the position of theparticle. Such a coordinate system is shown in Figure 1 . For simplicity, I haven'tlabeled the axes with particular coordinates. With our choice of units, one unit in thehorizontal direction is equal to the distance light travels during the same unit of timein the horizontal direction. In other words, if I choose the vertical units as years, thehorizontal units will be light-years. If I choose the vertical units as nanoseconds, thehorizontal units will be feet (approximately how far light travels in 10−9 seconds).
2.1 Event
Figure 2 shows an event, something that happens at a de�nite location and moment intime. Since both are �xed, an event is just a point in space-time. The particular eventin the �gure occurs at a time t = 4 and a position of x = 6.
3

Figure 2: A single event in a stationary reference frame
2.2 Moving Object
Using our units, an object moving with a constant speed β have x and t related by
x = x0 + βt (7)
t = −x0β
+1
βx (8)
In other words, the object will appear as a line on the space-time diagram with a slope1/β and an intercept of t0 = −x0/β. As an example, Figure 3 shows an object movingwith a speed of β = 1/4. It has a position of x = 2 at t = 0 giving x0 = 2 and t0 = −8.We call the line representing the history of the position of an object for all time its
�world line.� A valuable feature of Minkowski diagrams is that the world line of an objectdoes not depend on the reference frame selected. Since changing reference frames is justchanging coordinate axes, the world line itself remains constant.A special case of a moving object would be a stationary object, or an object with
v = 0. In this case, the slope of the line would be 1/β = 1/0 = ∞. In other words,it would be a vertical line. Another way of thinking about the object is as somethingwith a �xed value of x for all time. An example of an object which is stationary at theposition x = 2 is shown in Figure 4 .If the object was accelerating, the world line would be a curved line rather than a
straight line. I didn't include the ability to draw lines for accelerating particles in myprogram, so we won't worry about what these look like graphically here.
4

Figure 3: An object moving with a constant speed of c/4 in a stationary coordinatesystem
Figure 4: Stationary object at the position x = 2.
5
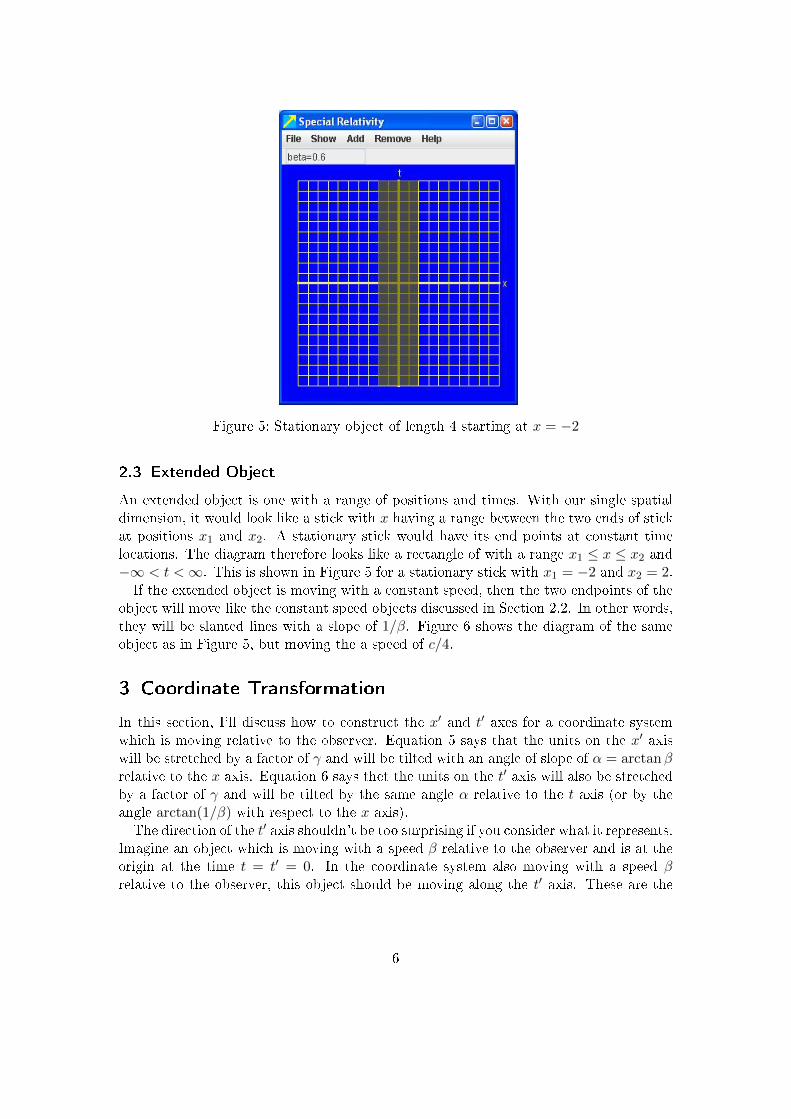
Figure 5: Stationary object of length 4 starting at x = −2
2.3 Extended Object
An extended object is one with a range of positions and times. With our single spatialdimension, it would look like a stick with x having a range between the two ends of stickat positions x1 and x2. A stationary stick would have its end points at constant timelocations. The diagram therefore looks like a rectangle of with a range x1 ≤ x ≤ x2 and−∞ < t <∞. This is shown in Figure 5 for a stationary stick with x1 = −2 and x2 = 2.If the extended object is moving with a constant speed, then the two endpoints of the
object will move like the constant speed objects discussed in Section 2.2. In other words,they will be slanted lines with a slope of 1/β. Figure 6 shows the diagram of the sameobject as in Figure 5, but moving the a speed of c/4.
3 Coordinate Transformation
In this section, I'll discuss how to construct the x′ and t′ axes for a coordinate systemwhich is moving relative to the observer. Equation 5 says that the units on the x′ axiswill be stretched by a factor of γ and will be tilted with an angle of slope of α = arctanβrelative to the x axis. Equation 6 says thet the units on the t′ axis will also be stretchedby a factor of γ and will be tilted by the same angle α relative to the t axis (or by theangle arctan(1/β) with respect to the x axis).The direction of the t′ axis shouldn't be too surprising if you consider what it represents.
Imagine an object which is moving with a speed β relative to the observer and is at theorigin at the time t = t′ = 0. In the coordinate system also moving with a speed βrelative to the observer, this object should be moving along the t′ axis. These are the
6

Figure 6: Object of length 4 centered on the origin at time t = 0 and moving with aspeed of v = c/4
points with x′ = 0 for all time t′. In other words, the world line for a moving objectwhich is at the origin at t = t′ = 0 should be along the t′ axis.Figure 7 shows what the x′ and t′ axis would look like for a coordinate system moving
at half the speed of light (β = 0.5). I have also included the grid lines representingspace-time coordinates with constant x′ and constant t′. Note how the grid lines arefarther apart on the x′ and t′ axes than they are measured along the t and x axes. Thisis because of the factor of γ in Equations 5 and 6. If the coordinate system is movingwith a speed −β instead of β, the x′ and t′ axes will be rotated to the other side of thex and t axes.
3.1 Light Cone
In interesting set of reference points in space-time diagrams are the paths light beamswould follow. These paths lie along what is called the �light cone.� These are thepoints moving at the speed of light with β = 1. In three spatial dimensions (four totaldimensions) these paths have the equation
x2 + y2 + z2 = t2 (9)
which describes a cone at a 45◦ angle between an two axes. In two dimensions, this justreduces to
x2 = t2 (10)
x = ±t . (11)
7
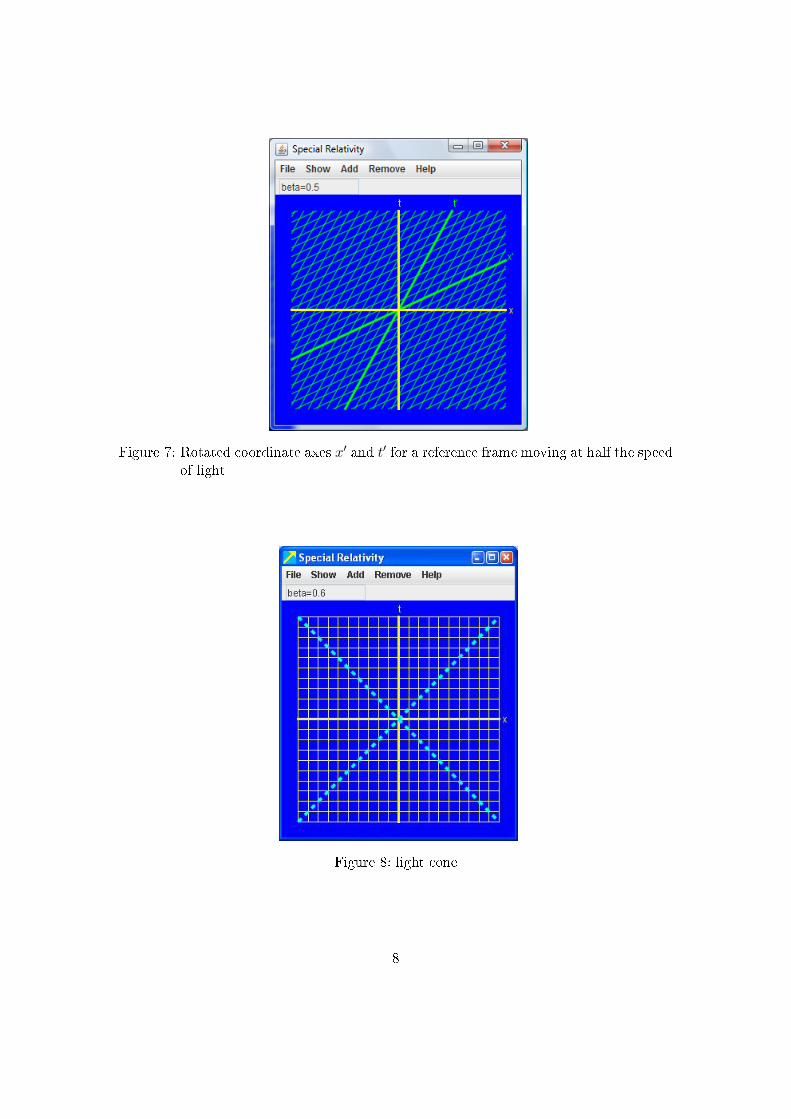
Figure 7: Rotated coordinate axes x′ and t′ for a reference frame moving at half the speedof light
Figure 8: light cone
8
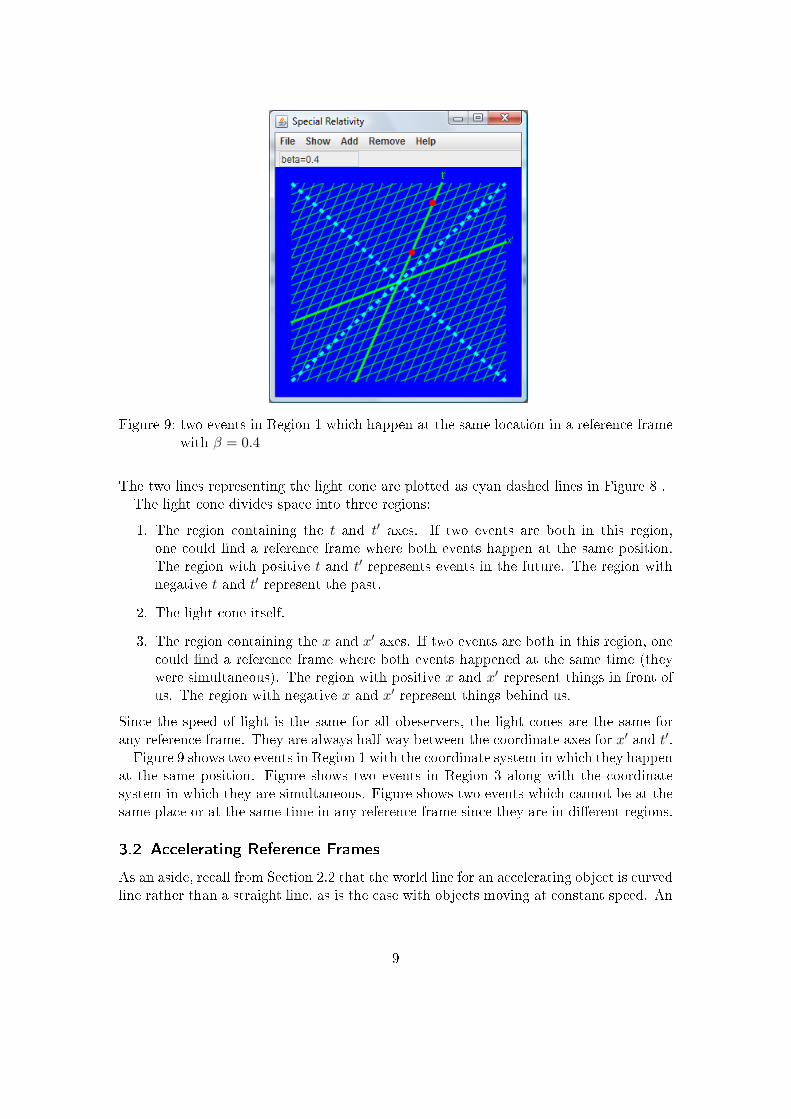
Figure 9: two events in Region 1 which happen at the same location in a reference framewith β = 0.4
The two lines representing the light cone are plotted as cyan dashed lines in Figure 8 .The light cone divides space into three regions:
1. The region containing the t and t′ axes. If two events are both in this region,one could �nd a reference frame where both events happen at the same position.The region with positive t and t′ represents events in the future. The region withnegative t and t′ represent the past.
2. The light cone itself.
3. The region containing the x and x′ axes. If two events are both in this region, onecould �nd a reference frame where both events happened at the same time (theywere simultaneous). The region with positive x and x′ represent things in front ofus. The region with negative x and x′ represent things behind us.
Since the speed of light is the same for all obeservers, the light cones are the same forany reference frame. They are always half-way between the coordinate axes for x′ and t′.Figure 9 shows two events in Region 1 with the coordinate system in which they happen
at the same position. Figure shows two events in Region 3 along with the coordinatesystem in which they are simultaneous. Figure shows two events which cannot be at thesame place or at the same time in any reference frame since they are in di�erent regions.
3.2 Accelerating Reference Frames
As an aside, recall from Section 2.2 that the world line for an accelerating object is curvedline rather than a straight line, as is the case with objects moving at constant speed. An
9

Figure 10: two events in Region 3 which happen at the same time in a reference framewith β = 0.4
Figure 11: two events which occur in di�erent regions
10
accelerating coordinate system moving with the object would be one in which such anaccelerating object would be stationary. In this case, the coordiate axis would not onlyhave to be rotated, but also warped so that they would no longer be straight lines, butrather would follow the trajectory of an accelerating object.General Relativity is Einstein's extension of Special Relativity to include the e�ects
of accelerating coordinate systems. It turns out that accelerating coordinate systemsare what is needed to correctly handle gravitational forces. (I'd love to explain why,but that will take me way beyond the focus of this handout. . . ) What I want to pointout, however, is that the geometry of accelerating reference frames involves coordinatesthat have to curve to match the acceleration of this frame. This is essentially the ideabehind the phrase �warping of space and time� people sometimes use to describe GeneralRelativity. It's really nothing mysterious or magic, just a re�ection of the fact that thetrajectories of accelerating objects are curved paths in space-time diagrams.It may be giving you a headache to think about coordinate systems that are warped
as well as being rotated. If so, don't worry about it for now. You won't have themathematical tools of di�erential geometry needed to describe these kinds of coordinatesystems for a while yet. You can just �le this idea away as an interesting tidbit you'lllearn more about later.
4 Special Relativity E�ects
This section uses the graphical coordinate transformations developed in Section 3 todemonstrate the e�ects of time dilation, length contraction, adding speeds, and simul-taneity issues. Each of these e�ects is easily seen geometrically in Minkowski diagrams.
4.1 Length Contraction
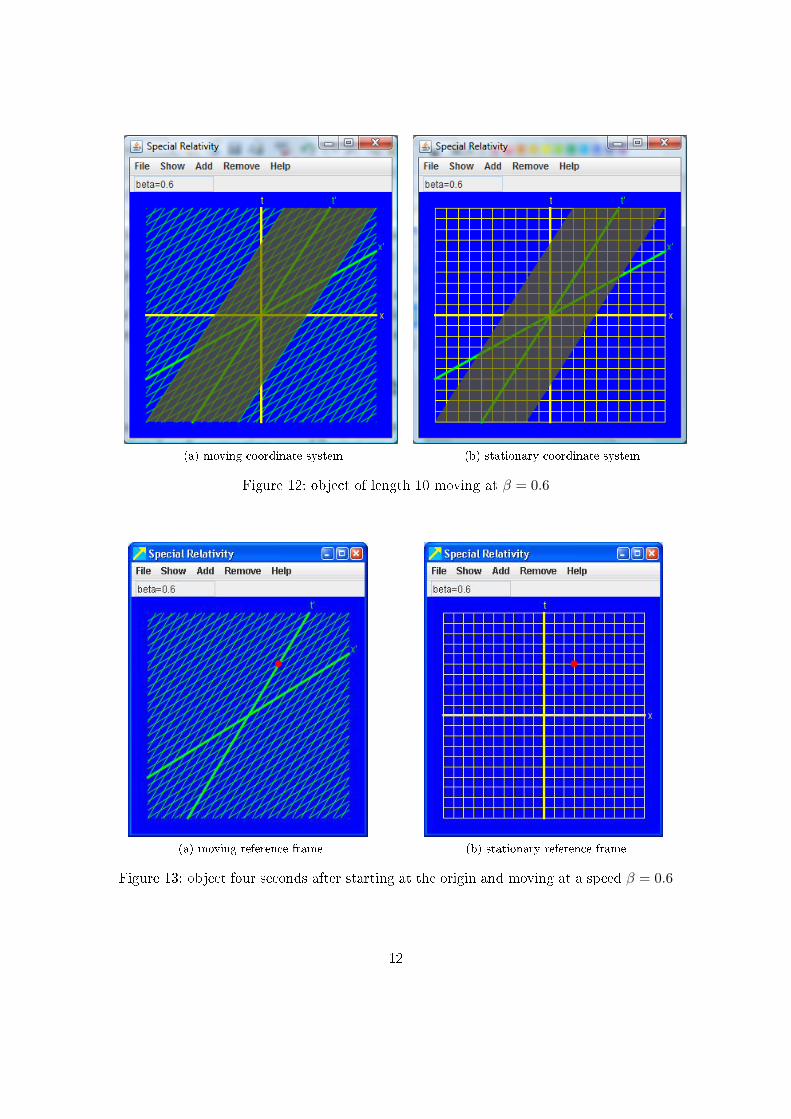
To see length contraction, let's create an object of length 8 in a coordinate system movingat β = 0.6. The object has an extent from -5 to 5 as measured along the x′ axis in themoving frame as shown in Figure 13a . The same object is shown in Figure 13b with thegrid drawn for the stationary coordinate system. An observer on the ground measuresthe same stick to have a length of 8. It goes from -4 to 4 along the x axis.
4.2 Time Dilation
I will give an example of time dilation using a speci�c example. Let's take an object atrest and at the origin in a reference frame moving at β = 0.6. Four seconds later, asmeasured in that reference frame, the object will be at the coordinate (x′ = 0, t′ = 4).This is illustrated in Figure 13a . Looking at this same event in the observer's referenceframe (see Figure 13b), we see that �ve seconds have elapsed rather than the four secondsmeasured in the moving frame. (Since the frame is moving, the object is also no longerat the origin.)
11
(a) moving coordinate system (b) stationary coordinate system
Figure 12: object of length 10 moving at β = 0.6
(a) moving reference frame (b) stationary reference frame
Figure 13: object four seconds after starting at the origin and moving at a speed β = 0.6
12

(a) moving coordinate system (b) stationary coordinate system
Figure 14: world line of an object moving at β = 0.6 in a reference frame moving at speedβ = 0.5
4.3 Adding Speeds
It is possible to use Minkowski diagrams to the �nd the speed of objects in di�erentreference frames. For example, let's start with an object moving at β = 0.6 in a referenceframe moving at a speed β = 0.5. We want to �nd out how fast it's going relative to astationary observer. As explained in Section 2.2, the world-line of a moving obvect hasa slope of 1/β, where β is the object's speed in units of the speed of light. Therefore anobject with a speed of β = 0.6 has a slope of 1/(3/5) = 5/3. Such a world line is shownin Figure 14a along with the coordinate system of the moving reference frame. Notethat it has a slope of 5/3 since it passes through the origin an the point (x′ = 3, t′ = 5).The same world line is shown in Figure 14b, but this time in the stationary coordinatesystem. The slope of the line as measured in this coordinate system is 1.2 correspondingto a speed β = 0.83. This is pretty close to the analytical answer using Equation 1.43 inyour textbook which gives
ux =u′x + β
1 + uxβ= 0.85 (12)
for our units.
4.4 Simultaneity
It is also easy to compare whether two events are simulaneous in di�erent coordinatesystems. Consider the two events shown in Figure 15a which happen at the same time,t = 4 in the stationary coordinate system, but in di�erent positions. Figure 15b shows
13

(a) stationary reference frame (b) moving reference frame
Figure 15: two simultaneous events
that one event happens at time t′ = 2.2 and the other at t′ = 6.7 in a rerence framemoving at β = 0.4.
Nomenclature
c: the speed of light
event: something that occurs at a speci�c location and time
General Relativity: a generalization of special relativity in which reference framesneed not be in uniform motion (i.e. they can be accelerating). This generalizationis needed to adequately explain gravitational forces.
light cone: the set of paths light beams follow in space-time diagrams. In four dimen-sions, these are cones where x2 + y2 + z2 = t2. In two space-time dimensions,these are just the lines with x2 = t2 (x = ±t).
linear equation: an equation in which all of the variables appear to �rst order and areonly multiplied by constants (not by each other)
Minkowski diagram: a graphical way to visualize Special Relativity E�ects by lookingat events in two di�erent coordinate systems.
space-time diagram: a graphical representation of an object's position and time
14

world line: the line representing the position of an object as a function of time. In aMinkowski diagram, the world line of an object is independent of the coordinatesystem (reference frame) chosen.
15

Index
accelerating reference frames, 9acceleration, 4adding speeds, 13
coordinate systemmoving, 6stationary, 3
coordinate transformation, 6
extended object, 6
general relativity, 11
length contraction, 2, 11light cone, 7Lorentz transformation, 2
Minkowski diagram, 2moving coordinate system, 6
reference framesaccelerating, 9
simultaneity, 2, 13speeds
adding, 13stationary coordinate system, 3
time dilation, 2, 11
world line, 4
16