Embed Size (px)
Citation preview

MINISTRY OF EDUCATION AND SCIENCE OF THE RUSSIAN
FEDERATION
Ulyanovsk State University
Institute for Medicine, Ecology and Physical Education
T.Biktimirov`sMedicineFaculty
T.P.Gening, T.V.Abakumova, S.O.Gening
WORKSHOP ON NORMAL PHYSIOLOGY
Methodological guidance for students of medical faculty
Ulyanovsk, 2019

2
УДК 612.8
ББК 28.903я73
G 36
Printed by the decision of the Academic Council
of Institutefor Medicine, Ecology and Physical EducationUlSU
(document№ 2/212, 16.10.2019)
Rewievers:
Associate Professor of the Department of
MorphologyIME&PhEUlSUPh.DT.I.Kuznetsova
Head of the Department of Animal Morphology, Physiology and Pathology of the
Ulyanovsk State Agrarian University named after P.A. Stolypin, Doctor of
Biological Sciences, ProfessorN.A.Lubin
Gening T.P.
G36 Workshop on normal physiology:methodological guidancefor students of
medical faculty. / T.P.Gening, T.V.Abakumova, S.O.Gening. – Ulyanovsk: UlSU, 2019. – 35 p.
The methodical manual presents the course of work in the classroom classes,
questions for colloquiums in normal physiology for foreign medical students as
materials for preparing for practical classes and independent work. The manual
provides the formation of the necessary competencies provided for by the Federal
State Educational Standard.
© Gening T.P., Abakumova T.V.,
Gening S.O. 2019
©Ulyanovsk State University, 2019 CONTENTS

3
III semester
1 Laboratory research Subject and methods of research in physiology. . . . . . . . . . . . . . . . . . . . . 4
2 Laboratory research General properties of tissue. . . . . . . . . . . . . . . . . . . . . . . . . . . . . . . . . . . .5
3 Laboratory research Physiology of muscles.
Types of muscular contraction. Mechanism of muscular contraction . . . . . . . . . . . . . . . . . . . . . 6
4 Laboratory research Force and muscle work. Exhaustion . . . . . . . . . . . . . . . . . . . . . . . . . . . . 7
5 Laboratory research Properties of peripheral nerves and neuromuscular synapses . . . . . . . . . 9
6 Laboratory research Questionsto the Colloquium. . . . . . . . . . . . . . . . . . . . . . . . . . . . . . . . . . 10
7 Laboratory research General physiology of the central nervous system. . . . . . . . . . . . . . . . . .11
8 Laboratory research Properties of the nervous centers.
The principles of coordination in CNS` . . . . . . . . . . . . . . . . . . . . . . . . . . . . . . . . . . . . . . . . . . . . 12
9 Laboratory research Process of inhibition CNS` . . . . . . . . . . . . . . . . . . . . . . . . . . . . . . . . . . . .12
10 Laboratory research Spinal cord and its functions. . . . . . . . . . . . . . . . . . . . . . . . . . . . . . . . . . 13
11 Laboratory research Myelencephalon and its functions . . . . . . . . . . . . . . . . . . . . . . . . . . . . . 16
12 Laboratory research Midbrain, cerebellum and their functions. . . . . . . . . . . . . . . . . . . . . . . . 17
13 Laboratory research Diencephalon (betweenbrain) and its functions.
Physiology of vegetative nervous system. . . . . . . . . . . . . . . . . . . . . . . . . . . . . . . . . . . . . . . . . . . 18
14 Laboratory research Questionsto the Colloquium. . . . . . . . . . . . . . . . . . . . . . . . . . . . . . . . . .19
15Laboratory research Physiology of analyzers. . . . . . . . . . . . . . . . . . . . . . . . . . . . . . . . . . . . . .20
16Laboratory research Physiology of analyzers. . . . . . . . . . . . . . . . . . . . . . . . . . . . . . . . . . . . . .22
17Laboratory research Higher nervous activity. . . . . . . . . . . . . . . . . . . . . . . . . . . . . . . . . . . . . . 24
18Laboratory research Questionsto the Colloquium. . . . . . . . . . . . . . . . . . . . . . . . . . . . . . . . . 26
List of works on normal physiology for the IV semester . . . . . . . . . . . . . . . . . . . . . . . . . . . . . . .27

4
Laboratory research number 1
Subject and methods of research in physiology
Work 1.Preparing a neuromuscular preparation.
Objective: to prepare the preparation of the gastrocnemius muscle and sciatic nerve.
Object of the study: Frog
Equipment: Dissecting set, 0.65% sodium chloride solution (Ringer's solution), cotton wool,
operating table.
Stages:
1. Take scissors and immobilize the frog to destroy the brain. Cut off the top of the head behind
the eyes.
2. Enter the probe in the spinal canal and destroy the spinal cord.
3. Cut the spine 1 cm above the fold and place cut the contents of the chest and abdominal
cavities
4. To remove the skin from the hind legs and parts of the spine.We get rheoscopic frog`s legs.
5. Separate the legs from each strictly on cerebrospinal trunk and prepare neuromuscular
preparation of each leg.
Results: Neuromuscular preparation – spine, sciatic nerve, femur, gastrocnemius muscle,
Achilles tendon.

5
Conclusion: learned to prepare a neuromuscular preparation
Work 2. The definition of excitability of nervous and muscle tissue
Objective: to compare the threshold of excitability of the nervous and muscle tissue.
Object of the study: Neuromuscular preparation
Equipment: electrostimulator, electrodes.
Stages:
1. Let`s find the excitation threshold for the nerve. Place the electrodes on the nerve.
Measure the amplitude of the current at which the muscle contract the first time. This is an
indirect method of muscle irritation.
2. Move the electrodes to the muscle and evaluate the threshold of muscle stimulation. This is a
direct method of muscle irritation.
Results:
Threshold of irritation Amplitude
Muscle
Nerve
Conclusion: The lower the excitation threshold, the higher the excitability
Work 3.An estimate of the relationship between the strength of the stimulus and the
amplitude of the tissue reaction (the law of power relations)
Objective: determine the relationship between the strength of stimulation and the amplitude of
muscle contraction.
Object of the study: Neuromuscular preparation
Equipment: Neuromuscular preparation.
Stages:
Register muscle contraction at the threshold, submaximal, maximal and supramaximal stimuli.
Conclusion: as the strength of the stimulus amplitude increases, muscle contraction increases
Laboratory research number 2
General properties of tissue
Work 1.Experience of Matteucci (secondary tetanus).
Objective: to show the possible effect of currents that exert an exciting effect on the muscles of
one neuromuscular preparation through the nerve of another.
Object of the study: two preparation "sciatic nerve - gastrocnemius muscle "
Equipment: electrostimulator, electrodes, dissecting set, frog, Ringer's solution, operating table.
Stages:
1. Place preparations on a dry glass plate in accordance with the scheme:
2. Irritate a nerve of the first preparation with induction current of average power for 2-3
seconds.
3. Observe the reaction of the muscles of both preparations.
Results:

6
Conclusion:conducted an experiment Matteucci (secondary tetanus). Biocurrents of the first
neuromuscular preparation can be transmitted to a second neuromuscular preparation and cause
muscle contraction
Work 2.The first experiment of Galvani.
Purpose: to experimentally reproduce the classic works of Galvani.
Object of the study: Neuromuscular preparation of the frog
Equipment: dissecting set, Ringer's solution,galvanic (metallic) tweezers.
Stages:
Prepare the preparation of the hind legs of a frog (with mandatory preservation sciatic nerve
plexus in spinal region). The copper jaws of the Galvani tweezers bring under the sciatic nerve in
the spinal cord, and the other concern muscle. See the contraction of the muscle.
Results:
Conclusion:an electromotive force between two oppositely charged metal, which causes a
reduction in the legs
Laboratory research number 3
Physiology of muscles.Types of muscular contraction.Mechanism of muscular contraction.
Work 1. Singlemuscle contraction
Objective: register asinglemuscle contraction
Object of the study: Neuromuscular preparation of frog
Equipment: tripod, electrostimulator, myography, ice crystals, Ringer's solution
Stages:
1. Increase the intensity of the stimuli by using the right buttons and apply only one
stimulus at a time.

7
2. Measure the duration of the three phases of the twitch by moving the cursor of time
measuring using the right arrows
3. Place a few ice crystals on the muscle. Evaluate the amplitude of the contraction again
and the increase in duration of the three phases (latent period, contraction period,
relaxation period). Remove the ice crystals from the muscle with physiological solution.
Results: analyze the resulting myogram
Conclusion: A single muscle contraction was registered, which consists of three phases: a
latency period, a shortening phase and a relaxation period.
Work 2.Incompleteand completetetanus
Objective: register incomplete and completetetanus
Object of the study: Neuromuscular preparation of frog
Equipment: electrostimulator, myography, Ringer's solution
Stages:
Set the frequency of the stimuli at 5; 6,5; then 10 stimuli/second, applying each time a complex of stimuli
for 5-6 seconds.
Results: analyze the resulting myogram
Conclusion:Incompletetetanus is ……
Completetetanusis ……
Laboratory research number 4
Force and muscle work. Exhaustion
Work 1.The role of the motor end plate in initializing tiredness.
Objective: demonstration of the fact that the neuromuscular synapse
Object of the study: Neuromuscular preparation
Equipment: Kymograph, universal tripod mount, a lever, an induction coil
Stages:
Apply a complex of electrical stimuli on the motor neuron of a skeletal muscle, mean while
recording the resulting myogram, until the muscle does not contract anymore (it gets tired). After
this apply the electrical stimuli on the muscle.
Results: Scheme of the experience, myogram
Conclusion: the neuromuscular synapse gets tired due to the chemical mediator depletion from
the presynaptic membrane.
Work 2.Dynamometry.
Objective: Determine the strengthof muscle contraction
Object of the study: human
Equipment: dynamometer
Stages:
Set thedynamometerto the zero position. Hold thedynamometerat arm's lengthin front of him.
Squeezethe maximumpower ofthe right and lefthand.
Results: Recordpowerindicators
Conclusion: measured the power of muscles with a dynamometer
Work 3.Electromyography.Motor unit recruitment. Fatigue.Dynamometry.
Objective: to record the force produced by clench muscles, EMG, and integrated EMG when
inducing fatigue.

8
Object of the study: human
Equipment: BiopacStudentLabSystem, electrodes, gel, alcohol, cotton wool, adhesive tape,
headphones, hand dynamometer
Stages: Registerelectromyographyelectrodes, imposethe schemeon the forearmof the test.
Screw terminalsconnectto the electrodes. Listenelectromyography.
Results:
Table 1
Analysis of Increasing Clench Force
Seg.1 Forearm 1 (Dominant) Seg.2 Forearm 2
Peak
#
Force (kg)
Increments
Assigned
Force at
Peak
[CH 1]
mean
(kg)
Raw
EMG
[CH 3]
p-p (mV)
Int. EMG
[CH 40]
mean[CH
1] (mV)
Force
at
Peak
[CH 1]
mean
(kg)
Raw
EMG
[CH 3]
p-p
(mV)
Int. EMG
[CH 40]
mean[CH
1] (mV)
1.
2.
3.
4.
5.
6.
7.
8.
9.
Table 2
Continued clench at maximum force
Seg.2 Forearm 1 (Dominant) Seg.4 Forearm 2
Maximum
Clench Force
50% of
max clench
force
Time to Fatigue.
Maximum
Clench Force
50% of max
clench force
Time to Fatigue.
CH 1 value calculate CH 40
delta T*
CH 1 value calculate CH 40 delta
T*
Note: * - you don`t need to indicate the delta T (time to fatigue) polarity. The polarity of
the delta T measurement reflects the direction the “I-beam” cursor was dragged to select
the data. Data selected left to right will have a positive (“+”) polarity, while data selected
right to left will have a negative (“-“) polarity.
Conclusion:
EMG-the curveis displayed graphicallyrecordingthe changesin thetime differenceof electricfield
potentials. Dynamometry means the measurement of power, and the graphic record derived from
the use of a dynamometer is called a dynagram. In this lesson, the power of contraction of clench
muscles will be determined by a hand dynamometer equipped with an electronic transducer for
recording.

9
Laboratory research number 5
Properties of peripheral nerves and neuromuscular synapses
Work 1.The proof of the law of the nerve functional integrity.
Objective: to show the role of physiological nerve integrity in carrying out the excitation on it.
Object of the study: Neuromuscular preparation
Equipment: electrostimulator, Ringer`s solution, cotton wool, alcohol.
Stages:
1.We are ready to rheoscopic legs. We share the frog legs strictly in the middle of the spinal
canal.
2. Let`s try to impose after agent. In this case it will be with alcohol cotton. Impose electrodes.
The muscle is not reduced. Consequently disturbed physiological integrity.
3. If we cut the nerves that confirm the integrity of the anatomic.
Conclusion: The nerve fulfills its functions if the anatomical and physiological integrity is
preserved
Work 2.The proof of the law of bilateral conduction along the nerve.
Objective: to show the directions in which the excitation conducts along the nerve.
Object of the study: Neuromuscular preparation
Equipment: electrostimulator, Ringer`s solution
Stages:
1. We are ready to rheoscopic legs.
We share the frog legs strictly in the middle of the spinal canal.
2. Distinguish nerve of the thigh muscle. Cut under the nerve of the thigh in half.
3. Select suprathreshold stimulus.
Results: There is a reduction of the femoral muscles on the both sides.
Conclusion: Experimentally proved the law of bilateral conduction of excitation along the nerve.
Work 3. Determination of Conduction Velocity and the way it depends on Axon diameter
and on the Presence or Absence of Myeline
Objective: measurement of conduction velocity using the following types of nerves
Object of the study: thin myelinated frog nerve, unmyelinated rat nerve, thickmyelinated rat
nerve
Equipment: electrostimulator, signal amplifier, a support to fix to nerve, Ringer`s solution
Stages:
Electrical stimuli are applied on different types of nerves and conduction velocity is measured by
using two electrodes placed at a known distance from each other. Knowing the distance and
measuring the time we can determine the conduction velocity.
Results:
Time (msec) Distance (mm) Conduction velocity (m/sec)
Thin unmyelinate rat nerve
Thick myelinated rat nerve
Myelinate frog nerve
Conclusion: the speed of the drive is greater than the thickness of the fiber.

10
Work 4. The effect of anesthetic substances and low temperature on the excitability of the
nerve
Objective: evaluation of the influence of temperature and some anesthetic substances on the
excitability of the nerve and the conduction velocity
Object of the study: frog`s sciatic nerve
Equipment: electrostimulator, signal amplifier, a support to fix to nerve, Ringer`s solution
Stages:
Application of an electrical stimulus of a certain point of the frog`s sciatic nerve under one of the
following conditions:
-after the nerve is moistened with lidocain
-after the nerve is moistened with efer
After placing a few ice crystals on the nerve
Results:
Parameters Time (msec) Distance (mm) Conduction velocity (m/sec)
Norma
lidocain
ice crystals
efer
Conclusion: Anesthetic substances disrupt the physiological integrity of the nerve, ice inhibits
the current of ions through the channels
Laboratory research number 6
Questionsto the Colloquium
1. Subject of physiology and classification of physiological disciplines.
2. Relation of physiology with other sciences.
3. Value of a normal physiology course for medicine.
4. Notion of excitability.
5. Excitability indicators.
6. Law of the power relations.
7. Law “everything or nothing”.
8. Membrane potential, its origin and properties.
9. Action potential, its origin and properties.
10. Local response and its characteristic.
11. Curve of excitability and origin of itsphases.
12. Effect of a direct current on tissue.
13. Concept about a motor and neuromotor unit.
14. Physiological properties of muscles.
15. Irritation of muscles and ways of registration.
16. Single muscular contraction.
17. Change of muscle fiber excitability at its contraction.Optimum and pessimum of
muscular contraction.
18. Summation and tetanus.
19. Modern theory of muscular contraction and relaxation.
20. Force and muscle work.
21. Exhaustion of the isolated muscle and exhaustion in the whole organism.

11
22. Adaptation and trophic influence of sympathetic nervous system on skeletal muscles.
23. Heat generation at excitement and contraction of muscles.
24. Physiological features of smooth muscles.
25. Differences of the smooth musclefrom theskeletal muscle.
26. Classification of nervous fibers.
27. Distribution of excitement on myelin and non-myelin nervous fibers.
28. Laws of excitement conduction on nervous fibers.
29. Synapse. Structure, classification. Excitement transfer mechanism.
Laboratory research number 7
General physiology of the central nervous system
Work 1.Analysis of the reflex arc of somatic reflex.
Objective: to demonstrate the importance of anatomical and functional integrity of each link of
the reflex arc for the implementation of reflex.
Object of the study: spinal preparation of frog
Equipment: a tripod with a hook, dissecting set, a glass of acid, a glass for water, 1% solution of
sulfuric acid, wool, the ligature.
Stages:
1. Cut off the upper jaw of the frog by the eyes and wait for the exit from the frog's spinal
shock.
2. Immerse the leg in the acid and observe the presence of the reflex. Clean the leg with water.
3. Cut the skin around the shin and remove the skin from the distal end of the legs, dip it into the
acid. Describe the results, wash the leg with water.
4. Cut the skin on the thigh and separate the sciatic nerve on the other leg, hold the ligature under
it and tighten it. Lower the leg into the acid, describe the results. Wash the leg with water.
5. Destroy the spinal cord and check the reflexes.
Results:
Condition of reflexes study
1. Spinal reflex arc
2. Removing skin receptors
3. Removing the sciatic nerve
4. Destroying spinal cord
Conclusion: The destruction of at least one component of the reflex arc makes it impossible to
implement the reflex
Work 2.Study of reflextimebyTürk.
Objective: to evaluate the time of excitation of the reflex arc.
Object of the study: spinal preparation of frog
Equipment: a tripod with a hook, dissecting set, a glass of acid, a glass for water, 0,1%, 03,%,
0,5%, 1% solution of sulfuric acid, wool.
Stages:
1. Lower thelegof the froginaconcentrationacid solution3 times.
2. ComparereflextimebyTürkat differentacid concentrations
Results: Digital data
0.1% 0.3% 0.5% 1%
1

12
2
3
mean
Conclusion:The higher the concentration, the shorter the reflex time
Laboratory research number 8
Properties of the nervous centers. The principles of coordination in CNS`
Work 1.The study of the phenomenon of summation of excitation in the nerve centers.
Objective: to show the possibility of obtaining a reflex response to multiple subthreshold
stimulation.
Object of the study: Spinal preparation of frogs
Equipment: a tripod with a hook. An induction coil, a glass, a saline solution.
Stages:
Prepare the spinal frog and wait for the exit from the frog spinal shock.
A) Spatial summation:
- put one finger in the acid and fix the time (T1);
- put the whole leg in the acid and fix the time (T2).
B) Temporalsummation:
1. Place one leg in a beaker with acidified solution.
2. Place the electrodes in the solution and pass current through it, find the threshold of force at
which the flexion reflex occurs.
3. Reduce the current and make sure that a single subthreshold pulse does not cause a reflex.
4. Exposure to the leg with the help of a number of subthreshold stimuli to obtain a reflex.
Results:
Characterof stimulation Strength stimuli (cm or V) Presence of reflex
Single threshold stimuli
Single subthreshold stimuli
Series of subthreshold stimuli
Conclusion: Summation phenomenon can be observed with simultaneous subthreshold
stimulation of several receptor zones of the skin or rhythmic subthreshold stimulation of the
same receptors. In both cases, subthreshold stimuli will cause a response reflex reaction.
Laboratory research number 9
Process of inhibition in CNS`
Work 1. The proof of the existence of inhibitory processes in the central nervous system
(experience of Sechenov)
Objective: to investigate the effect of irritation of the optic tubercles during spinal reflex. To
demonstrate the inhibition in the CNS and its reversibility.
Object of the study: the thalamic preparation of the frog
Equipment: a tripod with a hook, dissecting kit, saline solution, 0.5% solution of sulfuric acid, a
glass of acid, a glass for water, the salt crystals.
Stages:
1.In intact frog cutting open the skull to expose the brain.
13
2.Perform a section along the rear edge of the cerebral hemispheres, without damaging the
diencephalon. Make the bleeding stop with cotton swab.
3.Hang thalamic drug for the lower part of the jaw and wait for the exit of the shock (5-6 min).
4.Measure the time of the flexion reflex, plunging back foot in acid. Wash the foot. Perform a
few samples, establish the average value of the reflex time.
5.In visual bumps put salt, dried the incision. Several times determine the time of reflex. Wash
the foot.
6. Remove the crystal, wash the cut with saline, determine the time of reflex.
Results:
Original reflex time Reflex time when applying
crystals
Reflex time after removing
crystals
1.
2. 3.
meaning
Conclusion:T2 is greater than T1, because more time is needed for the formation of EPSP on
motor neuron and their summation on the axonhillock
Work 2. The study of the nature of the interaction of reflex acts (experiment of Goltz).
Objective: to study the effect of one reflex to another.
Object of the study: Spinal preparation of frog
Equipment: a tripod with a hook, a tweezers, 0.5% solution of sulfuric acid, a water glass.
Stages:
1. Suspend the preparation for the jaw and wait for exit of spinal shock.
2.Immerse hind legs of the preparation in the acid and determine the time of the flexion reflex.
Wash the leg with water.
3.Repeat the experience, previously holding the other back foot with tweezers.
Results: Digital data
Conclusion:The time of the reflex of the withdrawal of the leg from the acid increases when the
other leg is clamped with tweezers due to mutual inhibition
Laboratory research number 10
Spinal cord and its functions
Work 1.Spinal shock.
Objective: to demonstrate spinal shock
Object of the study: frog,
Equipment: a tripod with a hook, a tweezers, scissors
Stages:
Suspend the preparation for the jaw and wait for exit frog of spinal shock.
Results:Condition of reflexes study
Conclusion: experimentally observed spinal shock
Work 2.The study of receptive fields of spinal reflexes.
Objective: to show whether each reflex act has its receptive field.
Object of the study: Spinal preparation of frog
14
Equipment: a tripod with a hook, a glass of acid, water glass, 1% sulfuric acid solution, pieces
of filter paper, tweezers.
Stages:
1. Suspend the preparation for the jaw and wait for exit frog of spinal shock.
2.The pieces of paper wet in acid and successively place on the area of the Achilles tendon, calf,
thigh of the front foot, abdomen, chest and side surfaces of the body. Observe the reactions.
3.After each sample rinse off the acid with water.
4.The intervals between samples 2-3 min.
Results: Describe is occuring reactions.
Conclusion:experimentally confirmed the segmental principle of the spinal cord
Work 3.The study of reflexes in humans.
Objective: to observe and evaluate some of the reflexes in humans with diagnostic value in
neurological practice.
Object of the study: human
Equipment: Neurological hammer, shield.
Stages and Results:
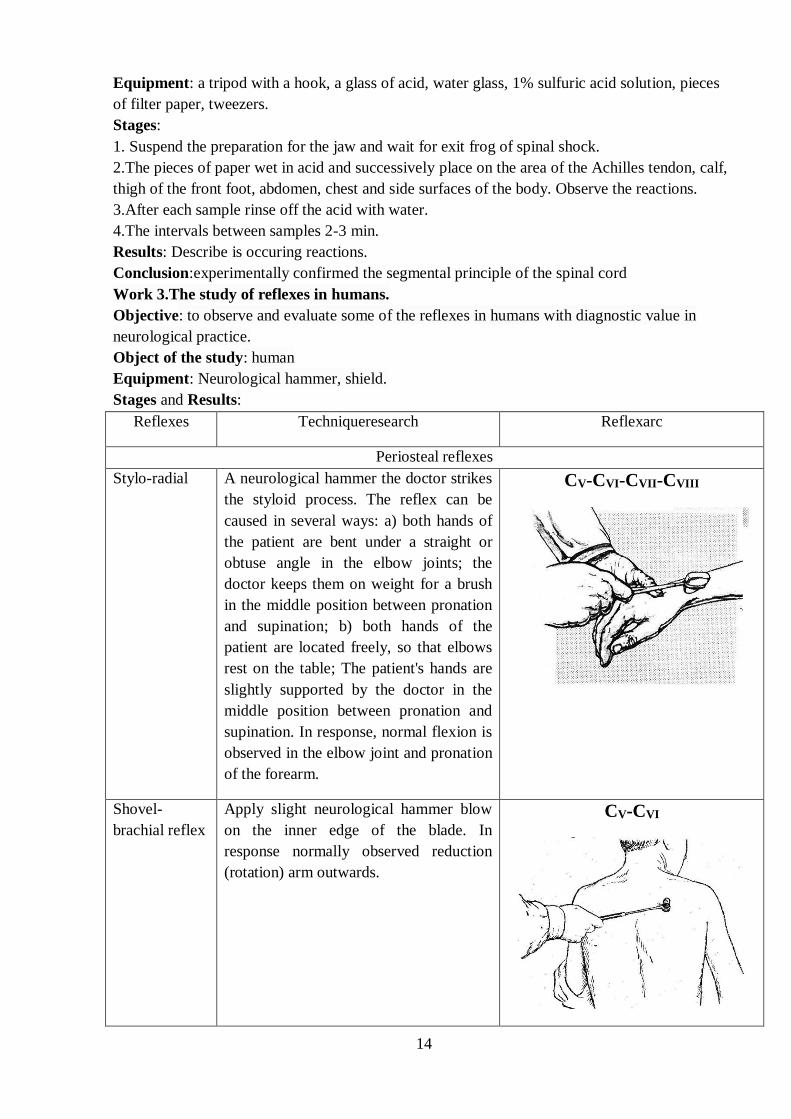
Reflexes Techniqueresearch Reflexarc
Periosteal reflexes
Stylo-radial A neurological hammer the doctor strikes
the styloid process. The reflex can be
caused in several ways: a) both hands of
the patient are bent under a straight or
obtuse angle in the elbow joints; the
doctor keeps them on weight for a brush
in the middle position between pronation
and supination; b) both hands of the
patient are located freely, so that elbows
rest on the table; The patient's hands are
slightly supported by the doctor in the
middle position between pronation and
supination. In response, normal flexion is
observed in the elbow joint and pronation
of the forearm.
CV-CVI-CVII-CVIII
Shovel-
brachial reflex
Apply slight neurological hammer blow
on the inner edge of the blade. In
response normally observed reduction
(rotation) arm outwards.
CV-CVI

15
Reflections caused by a lower limb
Knee-jerk The subject sits on a high chair so that his
legs hanging freely or were laid one upon
another. Neurological hammer cause
slight blow on the tendon below the
kneecap. In response, there is a decrease
in the rate of extensor muscles.
Achille reflex The subject kneels on a chair so that his
feet dangled. Very hit a hammer on the
Achilles tendon and watch the extension
of the foot caused by a reduction in the
gastrocnemius muscle.
Reflexes caused to the upper extremities
The reflex
reaction of the
biceps
Ask the subject to sit in front of the
experimenter, and put his hand on the
table, relax it. The experimenter
substitutes the palm of your hand under
the elbow of the subject and holds his
forearm, his thumb on the biceps tendon.
The experimenter hits the hammer on his
finger and says the tendon tension and
flexion of the forearm at the elbow
resulting from the reduction of the biceps.
The experimenter left hand supports the
test arm in a horizontal position so that
his forearm was hanging freely down.
Flipping hammer on the tendon three-
headed muscle of the elbow just above
the olecranon and watch extension arm at
the elbow.

16
The reflex
reaction of
three-headed
arm muscle
The experimenter left hand supporting
the shoulder of the test the first in a
horizontal position so that his forearm
was hanging freely down. Flipping
hammer on the tendon three-headed
muscle of the elbow just above the
olecranon and watch extension arm at the
elbow.
Reflex reactions to skin irritation
Plantar reflex Apply on the skin of the foot closer to the
inside of the bar irritation special wand or
a blunt pencil. In response, there is
flexion of the fingers to the foot. If the
thumb is raised up, and the rest of the
fingers apart, such a reaction is called
extensor type of plantar reflex or
Babinski reflex.
Abdominal
reflex
The subject is on the skin right or left
side of the abdomen is applied fairly
strong bar-irritation. There is a reflex
contraction of the abdominal muscles,
resulting in a shift towards the umbilicus,
which is applied to irritation.
Cremasteric
reflex
The patient is lying back on the couch,
the stroke is applied to the skin irritation
inner thigh. In response, there is a reflex
contraction of cremaster muscle.
L1-2
Conclusion:experimentally verified spinal reflexes
Laboratory research number 11
Myelencephalon and its functions
Work 1.Unipolarstimulation ofthe medulla oblongatain the frog.
Objective: It demonstrates thatin the medulla oblongataareblinkingand swallowingcenters.
Object of the study: the frog, rheonome
Equipment: Dissecting set, cotton wool.
Stages:
Inthe froglays barethe structure ofthe brain. We introduceone electrodein theregionof the
medulla oblongata, the second electrode(indefferenty) strengtheningof the legof the frog. We
pick upa little moresubthresholdcurrent.

17
Results: With unipolar stimulation of the medulla oblongata, we observe acts of swallowing and
blinking
Conclusion: In the medulla oblongata are the centers of swallowing and blinking
Laboratory research number 12
Midbrain, cerebellum and their functions
Work 1.Influence of destruction of semicircular canals on frog locomotion
Objective: to observe the behavior of the frog in the conditions of destruction of the semicircular
canals
Object of the study: the frog
Equipment: Dissecting kit, a basin of water.
Stages:
Pull out the lower jaw with tweezers. Preparatory curved needle is introduced into the white
tubercle at the bottom of the oral cavity. Rotating movements destroy the labyrinth. Drop the
frog into the water and observe the nuances of swimming movements.
Results: The frog will swim in the direction of the destroyed semicircular canals
Conclusion: The labyrinth controls the tone of the muscles of the crotch of the opposite side.
The tone of the muscles of the trunk of the same name is weakened.
Work 2.Research of installation-tonic reflexes.
Objective: to observe the tonic reflexes and to establish their role in maintaining the equilibrium
of the body in space.
Object of the study: guinea pig
Equipment: Rotating table, a plate 70x70 cm
Stages:
1.Static reflexes of posture: place the guinea pig on the table and mark the original position of his
head, body and limbs. Tilt the head of the guinea pigback, observe the change of position of the
limbs.
2.Static rectifier reflexes:
(a) put the guinea pig on table and note the sequence of the return of the head and torso to the
starting position.
b) Repeat the test, holding the guinea pig's head.
C) Put the guinea pig on his side, holding his head. Place the plate on the top. Observe the nature
of the responses.
3.Stato-kinetic lift reflexes: put the guinea pig on the plate, quickly raise it up, note the nature of
the reactions. Repeat the observation with the lowering plates.
4.Stato-kinetic reflexes on rotation: rotate the guinea pig on the table, pay attention to the
movement of the head and eyes.
Results:
Conditions of study Reflex reactions
1. 2. a)
b) c)
3. 4.

18
Conclusion:Stato-kinetic reflexes were observed experimentally
Work 3.Nystagmuseyes
Objective: to observenystagmuseyein the guinea pigwhenthe angularacceleration
Object of the study: guinea pig
Equipment: swivel chair
Stages:guinea pigsit ona chairand rotate. To observeeye movementin the directionopposite to the
rotation, with a rapidreturnto the originalposition
Results: Observed sweeping movements of the head and involuntary vibrational movements of
the eyes. The reaction after rotational vertigo is explained by the divergence of information from
visual analyzers and semicircular canals.
Laboratory research number 13
Diencephalon (betweenbrain) and its functions. Physiology of vegetative nervous system
Work 1.Galvanic skin response & the polygraph.
Objective: to become familiar with procedures for recording the galvanic skin response
Object of the study: Human
Equipment: Biopac Student Lab – 3 electrodes per subject, electrode lead set, respiration
transducer, electrode gel, GSR transducer, 9 sheets of different colored paper, computer system
Stages:
The subject must not be able to see the record as it is being recorded. The environment must be
quiet. Sensory input to the subject must be kept at a minimum since almost any change in the
environment may evoke a response. The subject should remain as still as possible during
recording, relaxed with arms resting on the armrests. Subject should answer a question in a quest
tone with minimal movement of the mouth. Subject should be at his/her resting heart rate in a
relaxed mental and physical state, and should not have performed any recent physical or mental
exertion
Results:
Tabl.1 Segment 1 Data
Procedure Heart Rate (CH 41 Value) Respiratory Rate (CH 40
BMP)
GSR (CH 3
Value)
Resting (baseline)
Quietly say name
Count from 10
Face touched
Tabl.2 Segment 2 Data
Square color Heart Rate (CG41
Value)
Respiratory Rate (CH
40 BMP)
GSR (CH 3 Value)
White
Black
Red
Blue
Green
Yellow
Orange
Brown

19
Purple
Tabl.3 Segment 3 data
Question Answer Truth Heart Rate
(CG41
Value)
Respiratory Rate
(CH 40 BMP)
GSR (CH
3 Value)
Student? Yes Now Yes Now
Blue eyes? Yes Now Yes Now
Brothers? Yes Now Yes Now
Earn “A”? Yes Now Yes Now
Motorcycle? Yes Now Yes Now
Less than 25? Yes Now Yes Now
Another planet? Yes Now Yes Now
Aliens visit? Yes Now Yes Now
“Fear Factor”? Yes Now Yes Now
Truthful? Yes Now Yes Now
Conclusion: Skin-galvanic reaction is the reaction of the skin in response to a change in the
emotional state of the subject.
Laboratory research number 14
Questionsto the Colloquium
1. Concept of the central nervous system. Definition of a reflex.
2. Structure of a reflex arch.
3. The neuron is a structurally functional unit of CNS`.
4. Features of excitement emergence in neuron.
5. Mechanisms of excitement emergence in receptors.
6. Nervous centers. Properties of the nervous centers (unilateral excitement conduction, the
slowed-down excitement conduction, transformation of a rhythm, after-effect,
summation, tone of the nervous centers).
7. The general principles of coordination in CNS`.
8. Definition and types of inhibition in CNS`.
9. Postsynaptic inhibition.
10. Presynaptic inhibition.
11. Sechenov Central inhibition.
12. Simple inhibition chains.
13. Spinal cord. Conduction and reflex functions.
14. Functions of ventral and dorsal roots of a spinal cord.
15. Segmental and intersegmental principle of a spinal cord.
16. Spinal shock.
17. Medulla. Bulbar animal.
18. Conduction function of a medulla oblongata.
19. Reflex function of a medulla oblongata.
20. Tonic reflexes of the brainstem.
21. Reticular formation of the brainstem.
22. Midbrain. Conduction function of midbrain.
23. Reflex activity of midbrain.
24. Cerebellum and its function.
25. Hypothalamus. Hypothalamusparticipationin the regulation ofautonomic functions.
26. Thalamus. Functionalcharacteristics ofmajor nucleargroups.

20
27. Comparative characteristics ofthe sympathetic and parasympatheticdivisions of the
autonomicnervous system. The synergyandantagonismof theirrelativeinfluence.
Laboratory research number 15
Physiology of analyzers
Work 1.Study of visual acuity. Objective: to master the method of the study of visual acuity in humans and to define it.
Object of the study: human
Equipment: Sivtsev's table, panel, pointer.
Stages:
1. Hang the table on a well-lit wall.
2. Offer the test subject to depart at 5 meters from the table and look with his one eye, closing
the other with the flap.
3. Start the study with an average line. Depending on how the subject sees the letters of this line,
proceed to the lines located above or below.
4. Repeat the test for the other eye.
Results: (the calculation of visual acuity for each eye)
Conclusion:using Sivtsev's table determined visual acuity
Work 2.Pupillary reflexes.
Objective: observe the reaction of the pupil to the action of light
Object of the study: human
Stages:
1. The direct reaction of the pupil to light: cover eyes with a shield for a while, then quickly
remove it. Note the reaction of the pupils.
2. Friendly reaction of the pupil: cover one eye with a shield for a while to observe the width of
the pupil of the other eye. Describe the reaction.
3. The reaction of the pupil in accommodation and convergence: put before the subject at some
distance the hammer and slowly bring it to his nose. Monitor eye movements and changes in the
width of the pupil. Describe the reaction.
Conclusion:experimentally investigated the reaction of the pupil to light
Work 3. The study of visual fields
Objective: to master the technique of the study of visual fields in humans and to determine their
boundaries in the test.
The object of the study: human
Equipment: perimeter, white and colored stamps, the flap.
Stages:
1. The test subject puts his back to the light, chin sets on the stand perimeter so that the lower
edge of the orbit was at the level of the upper part of the reticle plate. The other eye is closed
with flap. Look to fix the white dot in the center of the perimeter.

21
2. Set the arc of the perimeter horizontally, take the white mark and slowly move it along the
inner surface of the arc to the periphery, until it will be out of sight of the examinee. Measure the
field of vision inwards and outwards in degrees.
3. Repeat the test at a vertical position of the arc.
4. Similarly, determine the boundaries of the field of vision of the other eye.
5. Using colorful stamps, define the border of color fields for both eyes.
Results: (graphic images of fields of view for both eyes) Left
Right
Conclusion:We estimated the fields of black-and-white and color vision for the right and left
eyes.
Work 4.Electrooculogram.
Objective: to compare eye movements while fixed on a stationary object and tracking objects;
measure duration of saccades and fixation during reading
The object of the study: human
Equipment:Biopac Student Lab, electrode gel, electrode lead set, vinyl electrodes

22
Stages:
1. The subject should be positioned to see the computer screen easily without moving his/her
head.
2. Subject should focus on one point of the object, and maintain that focus while following it
around
3. Horizontaltracking.The testrecords theview of theobject. The headholdsan objectin the centerand
moveshorizontally, and returns to the centerin about3seconds.
Verticaltracking.The objectis moved from thecenterup and down. Reading.Subjecttextreadingfor 20seconds.
4. Data analysis.
Results:Measure theamplitude andtime intervalsof data onhorizontal and verticaltracking. Inthe segment
of"reading" getsaccades.
Conclusion:The potential difference that occurs when the eye moves is recorded with the help of
electrooculography.
Laboratory research number 16
Physiology of analyzers
Work 1. The binaural hearing
Objective: To verify the nature of the binaural hearing
The object of study: the man
Equipment: fork, stethoscope with tubes of different lengths, cotton, alcohol.
Stages:
The subject was put on a chair with his back to the experimenter. Tips rubber stethoscope tubing
is inserted into the ears of the test and bring to fonendosсopу sounding tuning fork. Ask the
subject to indicate which side he hears the sound. Then, one of the tubes is replaced stethoscope
longer and experience repeated. The test reports again, in what direction is the sound source.
Results: sound source test points from the short tube stethoscope.
Conclusion: binaural hearing allows to localize the source of sound in space due to the
detection of differences in the main characteristics of the sound signals coming to different ears
and the sound image is shifted towards a stronger or earlier sound.
Work 2.The tactile sensitivity.Termoesteziometry.
Objective: To determine the location of the frequency of tactile dots and tactile spatial threshold
sensitivity for different areas of the body.
The object of study: the human
Equipment: 2 tubes with hot (46-50 °) and cold (6-10 °) water, a compass Weber, line, cotton,
alcohol.
Stages:
1. Determine cold point: this core instrument or, apex conical tubes touch to different parts of the
skin, which impose pre-stencil with a square hole. Each time you touch the subject should report
that he feels - touch or cold. Calculation of thermal dots produced in the same way by filling
termoesteziometr water heated to 50C.
2. Ask the subject sitting on a chair, close your eyes. Esthesiometry with the highest note of the
legs touch the different skin areas. At the same time see to it that both legs esthesiometry
touched and the skin at the same time and with the same pressure. Continue touching the various
test skin areas in a pre-selected sequence, gradually pushing esthesiometry legs, each time
adding 1 mm. Celebrating at what distance between the legs on any part of the skin human first

23
distinguishes a double touch.
Results:
1. Note any areas of thermal receptors in the skin more, which is less than: dorsum of the hand;
Palm surface brush
2. Found the value of spatial sensitivity: dorsum of the hand; Palm surface brush
Conclusion:The spatial threshold of tactile sensitivity is the minimum distance between two
points of the skin, with simultaneous stimulation of which, there is a sensation of two touches.
Work 3. Determination of differential thresholds of sensations (Weber-Fechner law)
Objective: To determine the patterns of differentiated perception of irritation threshold.
The object of study: the man
Equipment: board, pillow, a set of weights (5, 10, 20, 30, 50, 100, 500, 1000 g).
Stages:
1. The subject must close his eyes. Put the glass plate on the palm and set the initial weight (for
example, 10 g).
2. Add to the original weight other weights, from the smallest to the feeling of the object that
gained weight.
3. Perform the same operations, starting with large weight loads (for example, 100 and 500 g).
Results: Fix the weight at which it does not feel that the load is added.
Conclusion:Experimentally confirmed the Weber-Fechner law, according to which the sensation
increases in proportion to the logarithm of the stimulus strength.
Work 4. The determination of the threshold of taste sensitivity
Objective: to determine and compare the lowest concentration of substances of different taste
sensations.
Object of the study: human
Equipment: Eye dropper, 0,001; 0,01; 0,1; 1% solutions of sugar, salt and citric acid.
Stages:
1. Put a drop of 0.001% solution of sugar on the tip of the tongue of the test subject, and offer
him to make gulp. Receive a report about the taste sensations. In their absence, increase the
concentration of the solution prior to the appearance of taste sensations. Rinse mouth.
2.Perform similar tests with other substances.
Results:
Substance Taste sensation Threshold of sensitivity
Sugar Salt
Citric acid
Conclusion:experimentally determined thresholds of taste sensitivity
Work 5. The Weber Test
Objective: to demonstrate the ability to conduct sound through bone.
Object of the study: human
Equipment: Fork, wooden hammer, wool.
Stages:

24
1.The basis of a sounding tuning fork set on
the head of the test subject in the midline. The
subject must compare the subjective feeling
of the sound in both ears.
2.Close one of the auditory passages of the
test subject with a cotton swab. Repeat the
test and compare the sensation of sound in the
ears.
Results:
a b c
a - The same perception of sound on both sides indicates the symmetry of hearing, b - With
conductive hearing loss, sound is lateralized to the affected ear (right). c - With sensorineural
hearing loss, sound is lateralized to the side of the ear, which hears better (left).
Conclusion:Experimentally compared the perception of pure sounds in air and bone conduction.
Laboratory research number 17
Higher nervous activity
Work 1.The study of mobility of nervous processes (Tapping test).
Objective: to become familiar with one method of studying the mobility of nervous processes.
Object of the study: human
25
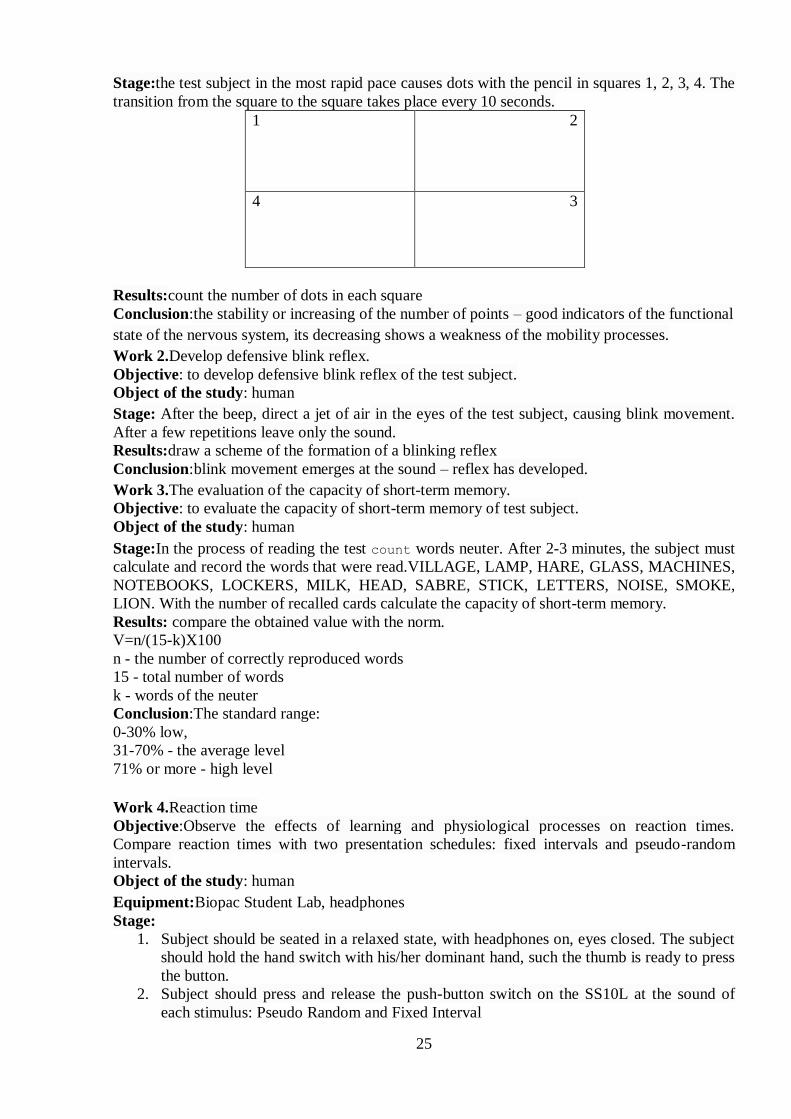
Stage:the test subject in the most rapid pace causes dots with the pencil in squares 1, 2, 3, 4. The
transition from the square to the square takes place every 10 seconds.
1 2
4 3
Results:count the number of dots in each square
Conclusion:the stability or increasing of the number of points – good indicators of the functional
state of the nervous system, its decreasing shows a weakness of the mobility processes.
Work 2.Develop defensive blink reflex.
Objective: to develop defensive blink reflex of the test subject.
Object of the study: human
Stage: After the beep, direct a jet of air in the eyes of the test subject, causing blink movement.
After a few repetitions leave only the sound.
Results:draw a scheme of the formation of a blinking reflex
Conclusion:blink movement emerges at the sound – reflex has developed.
Work 3.The evaluation of the capacity of short-term memory.
Objective: to evaluate the capacity of short-term memory of test subject.
Object of the study: human
Stage:In the process of reading the test count words neuter. After 2-3 minutes, the subject must
calculate and record the words that were read.VILLAGE, LAMP, HARE, GLASS, MACHINES,
NOTEBOOKS, LOCKERS, MILK, HEAD, SABRE, STICK, LETTERS, NOISE, SMOKE,
LION. With the number of recalled cards calculate the capacity of short-term memory.
Results: compare the obtained value with the norm.
V=n/(15-k)X100
n - the number of correctly reproduced words
15 - total number of words
k - words of the neuter
Conclusion:The standard range:
0-30% low,
31-70% - the average level
71% or more - high level
Work 4.Reaction time
Objective:Observe the effects of learning and physiological processes on reaction times.
Compare reaction times with two presentation schedules: fixed intervals and pseudo-random
intervals.
Object of the study: human
Equipment:Biopac Student Lab, headphones
Stage:
1. Subject should be seated in a relaxed state, with headphones on, eyes closed. The subject
should hold the hand switch with his/her dominant hand, such the thumb is ready to press
the button.
2. Subject should press and release the push-button switch on the SS10L at the sound of
each stimulus: Pseudo Random and Fixed Interval

26
Results:
Summary of Subject`s Results
STIMULUS
NUMBER
REACTION TIMES (ms)
Pseudo Random Fixed Interval
Segment 1
(1st trial)
Segment 2
(2nd trial)
Segment 3
(1st trial)
Segment 4
(2nd trial)
1
2
3
4
5
6
7
8
9
10
Mean
Conclusion:The reaction time-the time from exposure to the stimulus before the objectively
recorded reply actions
Laboratory research number 18
Questionsto the Colloquium
1. Definition of the analyzer according to I.P.Pavlov. Functions of the analyzer.
2. Visual analyzer
a) Receptor apparatus. Photochemical processes in a retina
b) Conduction part of the visual analyzer
c) Cortical representation of the visual analyzer
d) Accommodation. Visual field. Visual acuity
3. Acoustic analyzer. Structure. Functions.
4. Vestibular analyzer. Structure. Functions.
5. Somatosensory analyzer
6. Taste analyzer
7. Olfactory analyzer
8. Concept of reflex. Classification of reflexes.
9. Rules of development of conditioned reflexes.
10. The scheme and mechanisms of short circuit of temporary communications at
development of conditioned reflexes
11. Types of higher nervous activity. The doctrine about the first and second alarm systems.
12. Inhibition in HNA.
13. Concept of dominant (A.A. Ukhtomsky).
14. Memory. Types and mechanisms of memory.
15. Emotions. Emotional tension.
16. Sleep. Sleep phases.
17. Dynamic stereotype.
List of works on normal physiology for the IV semester

27
Work 1. The study of reflex effects on the heart
Objective: to identify the nature of changes in cardiac activity in the exercise of reflexes Danini-
Aschner and Goltz.
A. Reflex Danini-Aschner (eye-heart reflex)
The object of the study: human
Stages:
1. Count the pulse for 15 seconds.
2. Position the hands on the head and with your thumbs produce a gradually increasing, but not
strong pressure on the eyeballs with closed eyes for 5-10s, then quickly stop the pressure.
3. Count the pulse for every 15 sec for 2 min.
Conclusion:When the Danini-Ashner reflex is performed, there is a decrease in the heart rate
B. TheGoltz reflex (the reflex on the heart from the abdominal cavity)
The object of study: the frog.
Equipment: dissecting set.
Stages:
1. Open the chest cavity of the frog, count the number of heartbeats for 10 seconds.
2 Apply a few strokes of the handle of the tweezers on the abdomen of a frog, count the number
of heartbeats for 10 seconds.
3. Open the abdominal cavity of the frog, squeeze and pull with the tweezers stomach or
intestinal loop, count the number of beats for 10 seconds.
Conclusion: Mechanical irritation of the solar plexus when striking the abdominal wall of the
frog with tweezers results in reflex retardation or complete cardiac arrest. The reflex arc of this
reflex consists of the receptors of the solar plexus, sensitive fibers of the celiac nerve, the
ascending paths of the spinal cord, the medulla oblongata, the motor fibers of the vagus nerve.
Work 2.Investigation of humoral influences on the activity of the heart
Objective: recording the mechanical activity of the isolated frog heart on a graphical surface,
while the heart is being perfused with isotonic fluid containing various concentration of ions
(Ca2+, K+), and chemical mediators (epinephrine and acetylcholine).
The object of study: isolated heart of the frog.
Equipment: ammonium oxalate, CaCl2, KCl, acetylcholine, epinephrine, Ringer`s solutions.
Stages: the graphical recordings consist of:
1. recording the cardiogram, while perfusing the isolated heart with Ringer`s solution;.
2.recording the cardiogram, while perfusing the isolated heart with calcium ions free solutions
(we accomplish this by using an ammonium oxalate solution);
3. recording the cardiogram, while perfusing the isolated heart with calcium chloride solution;
4. recording the cardiogram, while perfusing the isolated heart with a potassium chloride
solution;
5. recording the cardiogram, while perfusing the isolated heart with epinephrine solution;
6. recording the cardiogram, while perfusing the isolated heart with an acetylcholine solution.
Results:
- while perfusing the heart with a calcium chloride solution the heart increases its
contraction amplitude of its contraction; by immediately repeating the administration of
calcium in the solution calcium rigidity appears (the heart stops in systole);

28
- while perfusing the heart with a potassium chloride solution the heart decreases the
amplitude of its contraction; by immediately repeating the administration of potassium in
the solution the potassic inhibition appears (the heart stops in diastole);
- while perfusing the heart with a solution of epinephrine the heart increases the amplitude
and frequency of its contraction;
- whileperfusing the heart with a solution of acetylcholine the heart decreases the
amplitudeand frequency of its contraction.
Conclusion: these changes in the cardiac activity lead the conclusion that even if the
heart presents a functional autonomy, its activity can be influenced by the specific action of
some humoral factors.
Work 3.The effect of the vagal excitation on cardiac activity
Objective:demonstration of the effect of the vagus on the cardiac activity
The object of study: heart of the frog, sciatic nerve
Equipment: universal tripod, serphin, dissecting kit, Ringer solution, amplifier, traductor
Stages:
We apply electrical stimuli on the vagus, recording on a graphical surface the mechanical
activity of the heart during all aplication
Results: Analyzing the cardiogram
-after the electrical stimuli`s on the vagus for 2-3 sec we witness a decrease of the amplitude of
the cardiac contractions and the cardiac pause in diastole (this effect is due to acetylcholine
elimination from the vagal-myocardic synapse);
-after the electrical stimuli`s on the vagus for a longer period of time we witness a decrease of
the amplitude of the cardiac contractions and the cardiac pause in diastole for a few seconds and
then the heart will continue its activity regardless the continuous application of electrical
stimuli`s on the vagus.
Conclusion:The phenomenon is called the “escape of the heart from the vagal influence”.
Work 4.The effect of sciatic nerve irritation on the vessels of the frog's swimming
membrane
Objective: to clarify the features of blood flow in the vessels of the capillary bed and the
influence of the sciatic nerve on the rate of blood flow.
The object of the study: frog
Equipment: microscope, Ringer's solution, tablet, dissection kit, ligatures, needles.
Stages:
1) The frog is immobilized, gently destroying the spinal cord.
2) Place on the operating table with the backrest up. Above the hole in the plaque stretch the
swimming membrane of the hindlimb and fix it with pins.
3) Under a microscope, the blood circulation in the vessels of the swimming membrane is
observed.
4) On the back of the thigh make a cut of the skin, push the muscles, expose the sciatic
nerve, take it to the ligature. Then, under nerve, lead the electrodes and cause
irritation.Continue to observe.
5) The nerve is cut and observed, as the vessels dilate and the movement of blood on them
slows down. Continue to observe.
Results: After a while (the latent period is 20-30 s), the acceleration of the blood flow through
the capillaries is noted. After the end of the stimulation (after 30-40 seconds), the rate of
movement of the blood is restored, since the lumen of the vessels is expanding.

29
Conclusion:Prove the presence of nerve effects on the vascular tone can be on the sciatic nerve,
which is a mixed nerve, since it includes both vasodilator and vasoconstrictor nerve fibers. The
nature of vasoconstrictor influences is more pronounced and determines the constant vascular
tone. In connection with this, when the sciatic nerve is cut, the vessels of the hind limbs of the
animal expand, since the influence of the vasoconstrictor nerve fibers is excluded, and the
subsequent irritation of the nerve leads to narrowing of these vessels.
Work 5.The effect of acetylcholine, atropine and adrenaline on the arterial pressure
Objective: underline the effect on the arterial pressure of the next substances: acetylcholine,
atropine and adrenaline.
The object of the study: dog
Equipment: intravenously administer the mentioned substances to a dog while recording the
arterial pressure evolution of the arterial pressure on a graphical surface:
1) Isolate the carotid artery of a dog and connect a hudwig manometer in order to measure
the arterial pressure.
2) Isolate the saphenous vein and introduce a catheter for later administration of the
mentioned substances/
Stages:
- Give acetylcholine intravenously; witness a decrease of arterial pressure induced by a
mechanism similar to the excitation of the vagus (acetylcholine being the chemical
mediator of the parasympathetic system). As the hypertensive mechanisms are also
active, the oscilloscopic indicators will be high;
- Give adrenaline intravenously: it induces a major hypertension and the oscilloscopic
indicators are high (due to the parasympathetic regulator hypotensive mechanisms);
- Give atropine intravenously: observe that the arterial pressure increases following the
stopping of the parasympathetic nervous system (atropine being a parasympatholytic
substance);
- Following the atropine give adrenaline again: arterial pressure rises, but the oscilloscopic
indicator is very low, but the parasympathetic regulator hypotensive mechanisms are
blocked by the atropine who`s effect is still present.
Conclusion: The effects of adrenaline, acetylcholine and atropine on blood pressure
Work 6.Theinfluence of the cardiac output, the peripheral resistance and the vascular
elasticity on arterial pressure
Objective:demonstration of the way in which these three factors values the values of this
parameter.
Stages:
Set the mentioned parameters by clicking the right buttons, observing the evolution of arterial
pressure with two characteristic values (systolic and diastolic pressure)
Results:
Special situation
Parameters
Arterial pressure
Rest
Digesti
on
Gestati
on
Physical
stress
Intense
physical effort
Cardiac output (ml/sec)
Vascular
resistance
Normal
Vasodilatation
Vasoconstriction
Vascular Normal

30
elasticity Decreases vascular
elasticity
Very low vascular
elasticity
Conclusion: the arterial pressure is generated by ventricular contractions, arterial wall elasticity,
peripheral resistance
Work 7.Respiratory cycle
Objective: to record and measure ventilation utilizing pneumograph and air temperature
transducers.
The object of the study: human Equipment: BIOPAC Student Lab, alcohol, cotton wool.
Stages: 1. Validate Calibration. Subject should sit in a relaxed state, breathing normally.
2. Click Record. Record for 15 sec.
3. Subject hyperventilates for 30 sec. then recovers from hyperventilation for 30 sec.
4. Subject hypoventilates for 30 sec. then recovers from hyperventilation for 30 sec.
5. Have subject cough once and then begin reading aloud.
Results: Using the I-Beam cursor, select the area of inspiration, expiration, interval between the
maximal inspiration and max temperature change in each data segment.
A. Eupnea
Rate Measure
ment
CH.# Cycle 1 Cycle 2 Cycle 3 Mean
Inspiration Duration ΔT CH 40
Expiration Duration ΔT CH 40
Total Duration ΔT CH 40
Breathing Rate BPM CH 40
B. Comparison of Ventilation Rates
Note: ΔT is cycle duration, BPM is breathing rate, and Cough has only one cycle
Hyperventilation
Segment 2
Hypoventilation
Segment 3
Cough
Segment 4
Read Aloud
Segment 4
Measurement ΔT BPM ΔT BPM ΔT BPM ΔT BPM
Cycle 1
Cycle 2
Cycle 3
Mean
C. Relative Ventilation Depths
Depth Cycle 1 Cycle 2 Cycle 3 Mean
Calculate p-p [CH 40]
Eupnea
Segment 1
Hyperventilation
Segment 2
Hypoventilation
Segment 3
Cough
Segment 4
D. Association of Respiratory Depth and Temperature
Measurement Channel Eupnea
Segment 1
Hyperventilation
Segment 2
Hypoventilation
Segment 3

31
Conclusion:we were measure ventilation by recording the rate and depth of the respiratory cycle
using a pneumograph transducer.
Work 8.Reflex salivation.
Purpose: to master the method used for mass research of summary salivation in humans, to
mention hard-reflexive nature of the work of the salivary glands in humans.
The content of the work: in the oral cavity with gauze collect saliva released in 2 minutes at
rest, with breath delay, with telling about the sliced lemon, when kneading cranberries in the
bowl. Wipes impregnated with saliva are weighed.
Results: regulation of salivation is subject of conditioned and unconditioned reflex influences.
Work 9.Motor function of the digestive tract in rats.
Objective: To characterize the motor function and diversified gastrointestinal tract
Theobjectofthestudy: rat
Equipment:Ringer-Locke solution (3-4 liters), gauze, a set of tools
Stages:
Intraperitoneally administered rat thiopental. Fix a rat on a narrow wooden plank ventral surface
up. The abdomen was opened by a white line of the abdomen. Pre-prepare a bath of warm water
and Ringer-Locke at a temperature of 38 C. The animal on the board at an angle of 45 degrees
plunge to the shoulder girdle. The intestines and stomach commit all kinds of motor activity. In
the intestines are working epinephrine and pilocarpine.
Results:Observing segmented (long annular reduction of separate distance from each other),
pendulum (swing as much as the individual loops), peristaltic (rapid reduction of running a ring
along the colon), propulsion (slowly advancing strong reduction ring). Adrenaline reduces and
pilocarpine increases the motility of the gastrointestinal tract.
Conclusion:Experimentally observed motility of the gastrointestinal tract
Work 10.Demonstration of the:
- Effect of hydrostatic pressure, osmotic pressure and diameters of the glomerular
afferent and efferent arterioles on urine flow
Objective: Demonstration of the influence of the glomerular filtration rate, the hydrostatic blood
pressure and oncotic blood pressure on urine flow
The object of the study: nephron
Stages:
The intensity of the blood flow is determined before and after modifying of the glomerular
afferent and efferent arterioles, hydrostatic blood pressure and oncotic blood pressure.
Results:Determine the intensity of diuresis (ml/min)
1) Decreases of the afferent arterioles diameter 2) Decreases of the efferent arterioles diameter 3) Increases of blood pressure
4) Increases of Osmotic pressure
- Influence of the aldosterone and the antidiuretic hormone on the urine flow
Objective: Demonstration of the effect of aldosterone and ADH on urine flow
The object of the study: nephron
Stages:
Determination of the urine flow before and after aldosterone administration and then before and
after ADH administration
Results:Determine the intensity of diuresis (ml/min)
- Influence of glucose on urine flow

32
Objective: Demonstration of the enhancement of urine flow and of glucose level in the urine as
a result of an increase in blood glucose
The object of the study: nephron
Stages:
Urine flow and glucose level in the urine are estimated before and after the intravenous
administration of a concentrated glucose solution
Results:Determine the intensity of diuresis (ml/min)
Spend Trommer probe in the urine in normal and glucose administration
Conclusion:Demonstrated the effect of various factors on the process of urine formation
Work 11.The effect of Thyroxine, TSH and Propyltiouracil on metabolism
Objective: Demonstration of the influence of thyroxine, TSH and propyltiouracil on metabolism
at three different rats.
The object of the study: one rat is normal, the second had the thyroid gland extirpated and the
third had the pituitary gland extirpated
Equipment:respiratory room with a closed circuit, which has simple manometer, a grill, sodium
limestone
Stages:
Metabolism of the three rats is measured before and after administering them thyroxine, TSH
and propiltiouracil
Results:Determine the metabolic rate:
Metabolic rate=ml.Ox60x1000/ rat body weight
-normal rat
-thyroidectomyxed rat
-hypophysectomyzed rat
Conclusion:The intensity of metabolism is propotional with the amount of oxygen which is
consumed by the organism in a time unit
Work 12.Determination of basal metabolism according to the tables of Harris and Benedict
Objective: to use formula to estimate metabolic rate at rest, and from that a daily energy
expenditure.
The object of the study: Human
Equipment:formula of Harris and Benedict
Stages:
Basal Metabolic Rate (BMR) formula: The Harris-Benedict Equation has for a long time been
the standard formula and is widely used for estimating BMR. Use the calculations below to
calculate BMR, where: Wt = weight in kg, Ht = height in cm, A = age in years.
men: kcal/day = (13.75 x Wt) + (5 x Ht) - (6.76 x Age) + 66
women: kcal/day = (9.56 x Wt) + (1.85 x Ht) - (4.68 x Age) + 655
Harris-Benedict Principle: Use the following table to calculate your recommended daily calorie
intake to maintain current weight.
ExerciseLevel Details CalorieCalculation
(DailyNeeds)
Littletonoexercise BMR x 1.2
Lightexercise 1-3 daysperweek BMR x 1.375
Moderateexercise 3-5 daysperweek BMR x 1.55
Heavyexercise 6-7 daysperweek BMR x 1.725
Veryheavyexercise twice per day, extra heavy workouts BMR x 1.9
33
Results:We identify the main exchange on the basis of Harris and Benedict
Conclusion:Resting Metabolic Rate (RMR) and Basal Metabolic Rate (BMR) are measures of
resting energy expenditure, representing the minimum amount of energy required to keep your
body functioning, including the heart, lungs and temperature regulation
Work 13. Observation of different types of hemolysis
Objective: To identify the influence of hypotonic environment and some of the chemicals in the
red blood cell membrane.
Object of research: human blood.
Equipment: 4 vials, cotton, isotonic and hypotonic solutions of sodium chloride, ether,
ammonia, banked blood.
Stages:
In the first tube add 1 ml of isotonic solution (NaCl 0.9%); in the second tube add 1 ml of water,
in the third tube add 1 ml of 5% ammonia, in the fourth tube add 1 ml of hydrochloric acid and
add a drop of blood to each tube.
Evaluate hemolysis by the degree of transparency after 10 minutes.
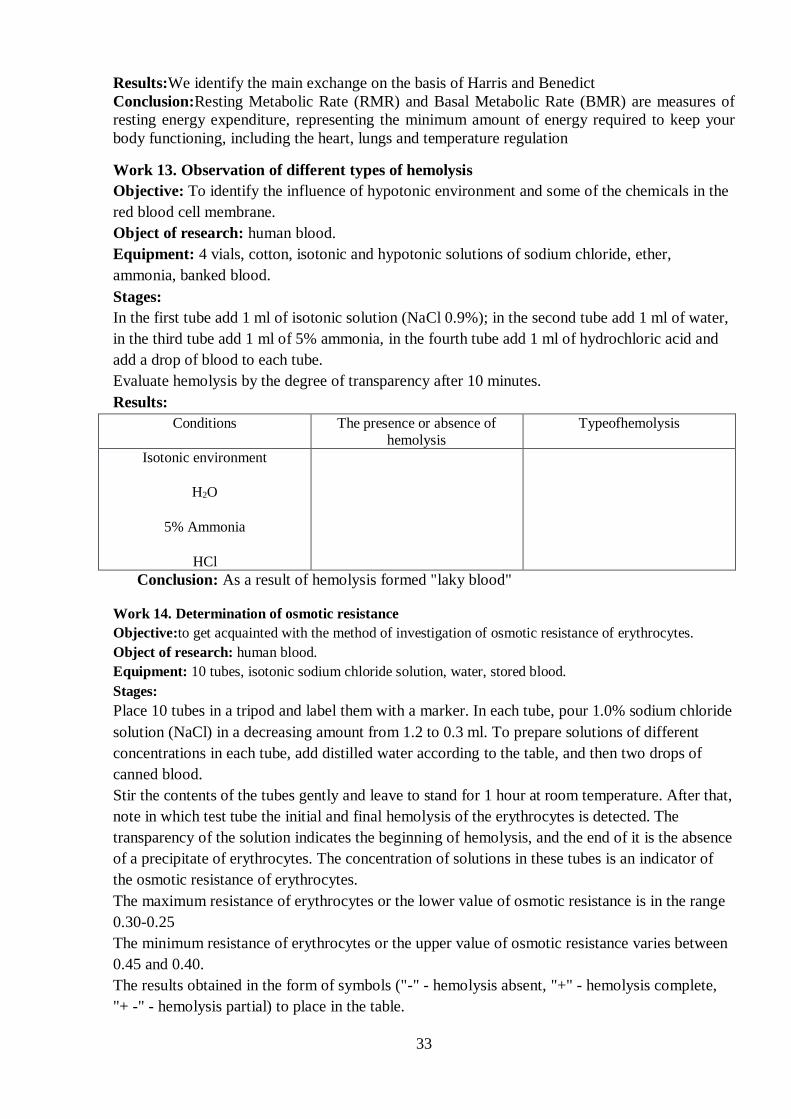
Results:
Conditions The presence or absence of
hemolysis Typeofhemolysis
Isotonic environment
H2O
5% Ammonia
HCl
Conclusion: As a result of hemolysis formed "laky blood"
Work 14. Determination of osmotic resistance
Objective:to get acquainted with the method of investigation of osmotic resistance of erythrocytes.
Object of research: human blood.
Equipment: 10 tubes, isotonic sodium chloride solution, water, stored blood.
Stages:
Place 10 tubes in a tripod and label them with a marker. In each tube, pour 1.0% sodium chloride
solution (NaCl) in a decreasing amount from 1.2 to 0.3 ml. To prepare solutions of different
concentrations in each tube, add distilled water according to the table, and then two drops of
canned blood.
Stir the contents of the tubes gently and leave to stand for 1 hour at room temperature. After that,
note in which test tube the initial and final hemolysis of the erythrocytes is detected. The
transparency of the solution indicates the beginning of hemolysis, and the end of it is the absence
of a precipitate of erythrocytes. The concentration of solutions in these tubes is an indicator of
the osmotic resistance of erythrocytes.
The maximum resistance of erythrocytes or the lower value of osmotic resistance is in the range
0.30-0.25
The minimum resistance of erythrocytes or the upper value of osmotic resistance varies between
0.45 and 0.40.
The results obtained in the form of symbols ("-" - hemolysis absent, "+" - hemolysis complete,
"+ -" - hemolysis partial) to place in the table.

34
Results.
№ tubes 1 2 3 4 5 6 7 8 9 10
Concentration of solution 0,6 0,55 0,5 0,45 0,4 0,35 0,3 0,25 0,2 0,15
1,0% NaCl, ml 1,2 1,1 1,0 0,9 0,8 0,7 0,6 0,5 0,4 0,3
H2O distil., ml 0,8 0,9 1,0 1,1 1,2 1,3 1,4 1,5 1,6 1,7
Results:
An hour later, note a tube with a concentration of sodium chloride at which partial hemolysis
occurs - the minimum limit of resistance of red blood cells. The maximum resistance is
determined by the concentration of sodium chloride in a test tube, where the precipitate is no
longer evident and the solution is intensely colored (laky blood).
Conclusion.Osmotic resistance of erythrocytes is the ability of the erythrocyte membrane to
counteract the destructive effect of hypotonic solutions. From 0.7-0.6% sodium chloride
solution, when erythrocytes swell (minimum osmotic resistance) to 0.48-0.44% sodium chloride
solution, when the most stable red blood cells are hemolysed (maximum osmotic resistance)
Work 15.Determination of coagulation time
Objective: Get introduced to the procedure of determining coagulation time
Equipment: Watch glass, glass hook, cotton, alcohol, stored blood.
Stages:
Pierce your finger with a scarifier. A drop of blood is transferred to the watch glass. Every 30
seconds, a glass hook to mix a drop of blood. Pay attention to the time of appearance of fibrin
threads.
Results: Time of infliction drops on the glass until the strands of fibrin - a coagulation time.
Conclusion: Coagulation time is 5 to 10 minutes
Work 16.Determination of bleeding time by Duke
Objective: Get introduced to the procedure of determining the bleeding time
Equipment: Stopwatch, scarifier, cotton, alcohol, filter paper is divided into 16 sectors
Stages:
Pierce the finger. The first drop of blood washed wool. Then, every 30 seconds, a finger is
applied to the next sector of the filter paper.
Conclusion:Determine the duration of bleeding and compared with the norm (4 min).
Work 17.Decalcification blood. Anticoagulant agents
Objective:Get introduced to the procedure of determining the anticoagulant action of substances on
human blood
Equipment:scarifier, sodium oxalate solution, sodium citrate, heparin solution, calcium chloride
solution, tubes, blood, cotton
Stages:
Mix the blood with the corresponding substance in a test tube. Watch for an hour for the clotting of blood.
Results:
Citrate and sodium oxalate bind calcium ions - the blood does not condense.
Heparin slows down clotting, inhibiting the activation of prothrombinase and converting it into
an active enzyme.
Addition of calcium chloride will promote coagulation.
Conclusion:Determined which substances accelerate coagulation, and which are anticoagulants

35
Literature
1. SándorBorbély, LászlóDétári, TündeHajnik, KatalinSchlett, Krisztián,Tárnok
Attila Tóth, Petra Varró, IldikóVilági. Physiology practical. Budapest, 2013 – 220 p.
2. Guide to practical exercises in normal physiology [Text]: textbook / ed. CM. Budylina,
V.M. Smirnova. - 3rd ed., Erased. - M.: Academy, 2010 .-- 336 p.