Embed Size (px)
Citation preview

Ministry of Economy Research & Economics Administration
* Data refers to 2015

The Israeli Economy at a Glance
ISRAEL 2
295,993 Gross Domestic Product
219,073 Business Sector Product
35,334 GDP Per Capita (U.S.$)
54,794 Investment in Fixed Capital
61,302 Imports of Goods (Net)
53,427 Exports of Goods (Net)
50,173 Industrial Exports**
22,517 of which, hi-tech
83,727 Imports of Goods and Services***
92,238 Exports of Goods and Services***
8,511 Trade & Services Surplus
5.3 Unemployment Rate )%(
-1.0 Inflation Rate (CPI-%)****
Source: Israel C.B.S
FACTS & FIGURES 2015
Figures refer to millions of U.S. $ unless otherwise stated*
*Average Exchange rate of 2015= 3.8868 NIS to U.S. $.
** Including mining and quarrying and net polished diamonds
***Source: Balance of payments
****Dec. 2015 compared to Dec. 2014

The Israeli Economy at a Glance
ISRAEL`S EXPORTS OF GOODS, 2015 (MILLIONS OF U.S. $)
TOTAL EXPORTS – 63,955*
Unclassified-$3,681 (5.8%) * Gross figures before reduction of returned goods **1. N. America including: U.S.A., Canada & Mexico ***2. Latin America including: Central America
NORTH
AMERICA**
19,112
29.9%
EFTA
1,574
2.5%
LATIN AMERICA***
1,493
2.3%
AFRICA
1,045
1.6%
OCEANIA
582
0.9%
E.U.
16,084
25.1%
CENTRAL & EASTERN
EUROPE
2,650
4.1%
ASIA
17,734
27.7%
Source: Israel C.B.S
3

The Israeli Economy at a Glance
CONTRIBUTION OF SPECIFIC REGION TO EXPORT GROWTH
Source: Israel C.B.S
2015 COMPARED TO 2005 Increment of $ 21,186 Million
E.U. 18.0%
E.F.T.A 2.9%
Asia 47.4%
Oceania 1.0%
Other European countries
4.2%
South and Central America
1.8%
Unclassified 10.0%
Africa 1.3%
North America 13.8%
4

The Israeli Economy at a Glance
INDUSTRIAL EXPORTS* BY MAJOR BRANCHES, 2015
Total Industrial Exports
50,173 Millions of U.S.$**
Exports Excluding Diamonds
45,179 Millions of U.S.$
*Manufacturing including mining and quarrying
**Including net polished diamonds Source: Israel C.B.S
chemicals 18%
pharmaceuticals
15%
metal products, machinery & electrical equipment
17%
food, drink,
textiles and other
7%
rubber, plastic and
fuel 5%
computor, electronic
and optical, medical
equipment 31%
transport equipmt
7%
chemicals 16%
pharmaceuticals 14%
metals products, machinery & electrical equipment
15%
food ,drink, textiles and
other 6%
rubber, plastic and
fuel 5%
computor, electronic
and optical, medical
equipment 28%
diamonds 10%
5

The Israeli Economy at a Glance
COMPOSITION OF INDUSTRIAL EXPORTS 2015 VS. 2005
TOTAL INDUSTRIAL EXPORTS EXCLUDING DIAMONDS:
IN 2005-$ 25,673 , IN 2015-$ 44,914 MILLION
Source: Israel C.B.S
2015 2005
22,517 10,634 High- technology industries
13,868 8,755 Medium- high technology industries
5,521 3,664 Medium- low technology industries
3,008 2,620 Low- technology industries
0
10,000
20,000
30,000
40,000
50,000
2005 2015
Low Technology
Medium low
Medium high
High technology
6

The Israeli Economy at a Glance
Source: Israel C.B.S
COMPOSITION OF INDUSTRIAL EXPORTS* 2015 VS. 2005
TOTAL INDUSTRIAL EXPORTS EXCLUDING DIAMONDS:
IN 2004-$ 23,731 , IN 2014-$ 46,800 MILLION
Pharmaceutical products
30%
Manufacture of computers,
electronic and optical products
14%
Manufacture of air and
spacecraft and related
machinery 56%
*Hi- tech. exports by branches 2014, are according to the new ISIC classification
2015 2005
22,517 10,634 High- technology industries
7

The Israeli Economy at a Glance
ISRAEL`S IMPORTS OF GOODS, 2015
Unclassified-$6,645 (10.7%)
* Gross figures before reduction of returned goods
** 1. N. America including: U.S.A., Canada & Mexico
2. Latin America including Central America
(MILLIONS OF U.S. $)
TOTAL IMPORTS – 62,036*
NORTH
AMERICA**
8,455
13.6%
EFTA
4,575
7.4%
LATIN
AMERICA
754
1.2%
AFRICA
269
0.4% OCEANIA
177
0.3%
E.U.
22,574
36.4%
CENTRAL & EASTERN
EUROPE
3,323
5.4%
ASIA
15,264
24.6%
Source: Israel C.B.S
8

The Israeli Economy at a Glance
BREAKDOWN OF IMPORT INCREASE BY
REGION
2015 COMPARED TO 2005 INCREMENT OF $ 17,001 Million
Source: Israel C.B.S
European Union 30.2%
EFTA 11.9%
Other European Countries
4.2%
Asia 41.5%
North America 12.2%
Unclassified Countries
1.3%
9

The Israeli Economy at a Glance
RESOURCES AND USE OF RESOURCES 2015
RESOURCES
(375 BILLION U.S.$)
USE OF RESOURCES
(375 BILLION U.S. $)
Source: Israel C.B.S
private consumption
43.1% exports 24.3%
public consumption
17.4%
gross domestic
investment 15.2%
GDP 78%
imports 22%
10

The Israeli Economy at a Glance
BUSINESS PRODUCT COMPOSITION 2015
Source: Israel C.B.S
finance and business services
27%
manufacturing, mining and quarrying
19% trade, commerce and food services
14%
transport, storage,
information and communications
19%
construction 7%
personal and other services
9%
agriculture, foresty and
fishing 2%
electricity and water
3%
11

The Israeli Economy at a Glance
QUARTERLY EMPLOYMENT &
UNEMPLOYMENT SINCE 2013*
Source: Israel C.B.S
3.40
3.45
3.50
3.55
3.60
3.65
3.70
3.75
3.80
I II III IV I II III IV I II III IV
Employment, (Millions)
* Data is seasonally adjusted
6.6 6.7
6 5.8 5.8
6 6.2
5.6 5.4
5.1 5.3 5.3
0
1
2
3
4
5
6
7
8
I II III IV I II III IV I II III IV
Unemployment (%)
2013 2014 2015 2013 2014 2015
12

The Israeli Economy at a Glance
CONSUMER PRICE INFLATION RATES 2005 - 2015
ANNUAL PERCENTAGE CHANGE*
*Year end compared to previous year end Source: Israel C.B.S
Y E A R S
2.4
-0.1
3.4
3.8 3.9
2.7
2.2
1.6 1.8
-0.2 -1.0
-2
-1
0
1
2
3
4
5
2005 2006 2007 2008 2009 2010 2011 2012 2013 2014 2015
13


The Israeli Economy at a Glance
G.D.P PER CAPITA, IN P.P.P** , 2015
U.S. DOLLARS
** Purchasing Power Parities including latest estimates
Source: IMF World Economic Outlook Database, October 2015
18
,33
5
20
,27
7
23
,56
4
25
,76
2
26
,07
4
27
,73
4
31
,47
9
33
,65
8
35
,27
0
36,5
28
38
,21
1
40
,95
8
45
,43
5
47
,03
3
55,9
04
0
10,000
20,000
30,000
40,000
50,000
60,000
Me
xic
o
Tu
rkey*
Ch
ile
Gre
ec
e
Hu
ng
ary
Po
rtu
ga
l
Cze
ch
re
pu
blic
*
Isra
el
Sp
ain
Ko
rea*
Jap
an
*
Un
ite
d K
ing
do
m
De
nm
ark
Germ
an
y
Un
ite
d S
tate
s*
15

The Israeli Economy at a Glance
Source: O.E.C.D.
* Estimates
REAL GDP GROWTH 2015
-0.1%
0.6% 0.8%
1.1%
1.5% 1.7% 1.8%
2.0%
2.4% 2.4% 2.5%
3.2%
5.6%
-1.0%
0.0%
1.0%
2.0%
3.0%
4.0%
5.0%
6.0%
Fin
lan
d
Jap
an
Italy
Fra
nce
Germ
an
y
Po
rtu
gal
Den
mark
To
tal
OE
CD
*
Un
ite
d S
tate
s*
Un
ite
d k
ing
do
m
Isra
el
Sp
ain
Irela
nd
16

The Israeli Economy at a Glance
UNEMPLOYMENT RATE (%)
Source: O.E.C.D. for Israel, C.B.S.
3.4 4.3 4.6
5.3 5.3 5.6 6.3 6.8 6.9
7.7
9.4 10.0 10
12.3 12.3
22.1
0
5
10
15
20
25J
ap
an
No
rwa
y
Ge
rma
ny
Isra
el
Un
ite
d S
tate
s
Un
ite
d K
ing
do
m
De
nm
ark
To
tal O
EC
D
Ne
the
rla
nd
Sw
ed
en
Ire
lan
d
Fin
lan
d
Fra
nc
e
Ita
ly
Po
rtu
ga
l
Sp
ain
17

The Israeli Economy at a Glance
HOURLY COMPENSATION COST IN
MANUFACTURING, 2012 IN U.S. DOLLARS
Source: U.S. Bureau of Labor Statistics
9.46
19.41 20.14 20.72
26.83
31.23 35.34 35.61
39.81
45.79
48.47
0
10
20
30
40
50
60T
aiw
an
Gre
ec
e
Isra
el
Ko
rea
Sp
ain
Un
ite
d K
ing
do
m
Jap
an
Un
ite
d S
tate
s
Fra
nce
Germ
an
y
Den
mark
18
The Israeli Economy at a Glance
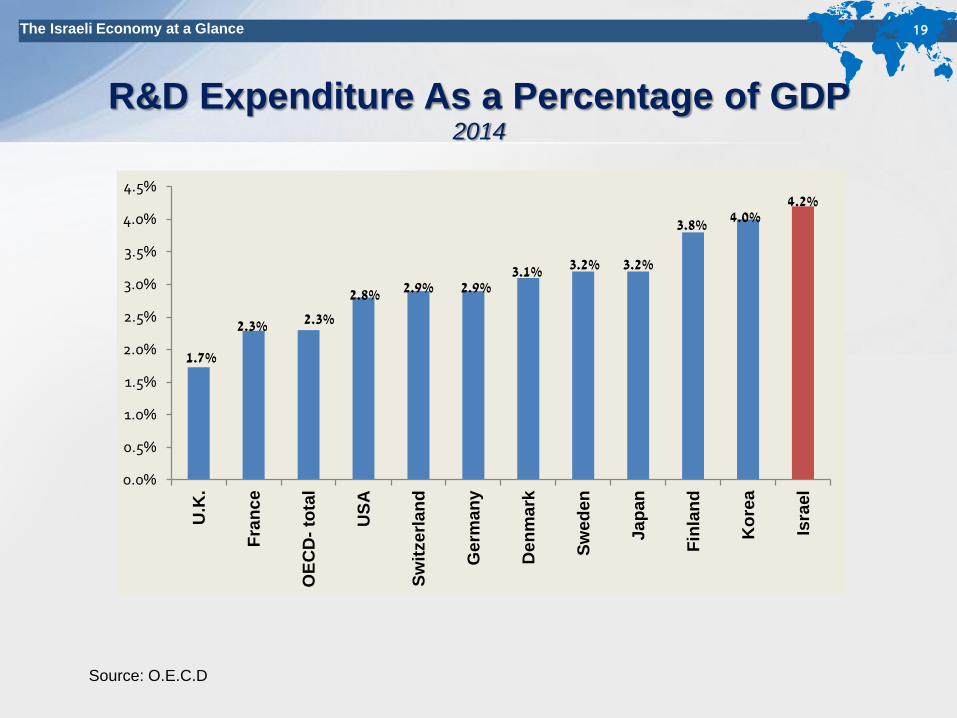
R&D Expenditure As a Percentage of GDP 2014
Source: O.E.C.D
1.7%
2.3% 2.3%
2.8% 2.9% 2.9% 3.1% 3.2% 3.2%
3.8% 4.0% 4.2%
0.0%
0.5%
1.0%
1.5%
2.0%
2.5%
3.0%
3.5%
4.0%
4.5%U
.K.
Fra
nc
e
OE
CD
- to
tal
US
A
Sw
itzerl
an
d
Ge
rman
y
De
nm
ark
Sw
ed
en
Ja
pan
Fin
lan
d
Ko
rea
Isra
el
19

The Israeli Economy at a Glance
RELATIVE WORLD COMPETITIVENESS Overall ranking 2014
Source: IMD World Competitiveness Yearbook
2014
IMD ranks factors among 58 countries
0
20
40
60
80
100It
aly
Czec
h R
ep
ub
lic
Ch
ile
Fra
nc
e
Be
lgiu
m
Jap
an
Ko
rea
Fin
lan
d
Isra
el
Un
ite
d K
ing
do
m
Ire
lan
d
De
nm
ark
Ge
rma
ny
No
rwa
y
US
A
9th 44th 22nd 24th 26th 28th 30th 35th 12th 17th 18th 19th 20th 1st 6th
20

The Israeli Economy at a Glance
RELATIVE WORLD COMPETITIVENESS By Factors, 2014
0
1
2
3
4
5
6
7
8
9
Ko
rea
Ita
ly
US
A
Sp
ain
Germ
an
y
Neth
erl
an
ds
Jap
an
Can
ad
a
Sw
ed
en
Fra
nce
Sin
gap
ore
Den
mark
Isra
el
Cyber Security
* The numbers on the left side of each graph refer to relative availability of skills as reported by survey IMD ranking on a scale of
1-10 Source: IMD World Competitiveness Yearbook 2014
21

The Israeli Economy at a Glance
0
1
2
3
4
5
6
7
8
9
Po
rtu
ga
l
Cze
ck R
ep
ub
lic
Sp
ain
Ko
rea
Ita
ly
Fra
nce
Ca
na
da
Jap
an
Sw
ed
en
De
nm
ark
US
A
Isra
el
Innovative Capacity
RELATIVE WORLD COMPETITIVENESS
* The numbers on the left side of each graph refer to relative availability of skills as reported by survey IMD ranking on a scale of
1-10
Source: IMD World Competitiveness Yearbook 2014
22

The Israeli Economy at a Glance
By Factors, 2014
Source: IMD World Competitiveness Yearbook 2014
RELATIVE WORLD COMPETITIVENESS
0
1
2
3
4
5
6
7
8
9
Italy
Ho
ng
Ko
ng
Irela
nd
Can
ad
a
Fra
nce
Sin
gap
ore
Germ
an
y
US
A
Isra
el
Sw
itzerl
an
d
Scientific Research
0
1
2
3
4
5
6
7
8
9
Fra
nce
Ko
rea
Po
rtu
gal
Sw
ed
en
UK
Can
ad
a
US
A
Isra
el
Irela
nd
Flexibility and Adaptability
* The numbers on the left side of each graph refer to relative availability of skills as reported by survey IMD ranking on a
scale of 1-10
23

The Israeli Economy at a Glance
By Factors, 2014
Source: IMD World Competitiveness Yearbook 2014
RELATIVE WORLD COMPETITIVENESS
0
2
4
6
8
Ita
ly
UK
Au
str
alia
Fra
nce
Ko
rea
De
nm
ark
Isra
el
Total R&D Personnel in Business Per Capita 2012
0%
20%
40%
60%
80%
US
A
Fra
nce
Ge
rma
ny
Ko
rea
Isra
el
Jap
an
Sin
gap
ore
Science Degrees 2011
0
2
4
6
8
Sp
ain
Ita
ly
U.K
.
Bra
zil
Den
ma
rk
US
A
Ge
rma
ny
Isra
el
Entrepreneurship
0.0%
0.5%
1.0%
1.5%
2.0%
2.5%
3.0%
3.5%
Ita
ly
Can
ad
a
Fra
nce
Ge
rma
ny
Jap
an
Ko
rea
Isra
el
Business Expenditure on R&D
* The numbers on the left side of each graph refer to relative availability of skills as reported by survey IMD ranking on a scale of 1-
10
24

The Israeli Economy at a Glance
By Factors, 2014
Source: IMD World Competitiveness Yearbook 2014
RELATIVE WORLD COMPETITIVENESS
0123456789
Fin
lan
d
Isra
el
De
nm
ark
US
A
Jap
an
UK
Ge
rma
ny
Information Technology Skills
0123456789
Ge
rma
ny
Ho
ng
Ko
ng
US
A
Sw
ed
en
Ire
lan
d
Isra
el
Fin
lan
d
Qualified Engineers
* The numbers on the left side of each graph refer to relative availability of skills as reported by survey IMD ranking on a
scale of 1-10
25

The Israeli Economy at a Glance
R&D PERSONELL RESEARCHERS PER 10,000 EMPLOYED PERSONS
Source: OECD S.T.I SCOREBOARD 2015
4.85
6.74 7.33 7.53 7.77 8.52 8.66 8.74
9.81 10.18
12.84
14.86 15.68
17.44
0
2
4
6
8
10
12
14
16
18
20IT
AL
Y
CZ
EC
H R
EP
UB
LIC
SP
AIN
SW
ITZ
ER
LA
ND
OE
CD
AV
ER
AG
E
GE
RM
AN
Y
U.K
US
A
FR
AN
CE
JA
PA
N
KO
RE
A
DE
NM
AR
K
FIN
LA
ND
ISR
AE
L
26


The Israeli Economy at a Glance
Main Indicators 2011-2015
Source: C.B.S., Ministry of Economy
Real annual percentage change Annual
average 2011 2012 2013 2014 2015
Gross Domestic Product 5.0 2.9 3.3 2.6 2.5 3.3
Business Sector Product 5.8 2.6 3.4 2.3 2.3 3.3
GDP per capita 3.1 1.0 1.3 0.6 0.5 1.3
Fixed Capital Investment 15.6 6.3 1.7 1.0 1.2 5.2
Buildings and other
construction works 11.0 8.6 7.5 -4.3 1.5 4.9
28

The Israeli Economy at a Glance
2010 2011 2012 2013 2014 2015
Average Population
(thousands) 7,622 7,763 7,910 8,060 8,212 8,377
Percentage change in average
population 1.9 1.8 1.8 1.8 1.9 2.0
Immigration (thousands) 16.6 16.9 16.6 16.8 24
Employed Persons
(thousands) 2,938 3,025 3,359 3,449 3,522 3,644
Unemployed Persons
(thousands) 209 180 247 228 222 202
Unemployment Rate )%( 6.6 5.6 6.9 6.2 5.9 5.3
Source: Israel C.B.S
Population, Immigration and Employment
29

The Israeli Economy at a Glance
All figures refer to total industry excluding diamonds. Source: C.B.S., Ministry of Economy
2015 2014 2013 2012 2011 2010 2009
2.0 1.1 1.1- 4.7 2.2 7.9 6.0- Production
1.9 9.1 3.2 4.6- 0.8- 12.7 8.3- Export
-0.2 0.1 0.3 0.7 1.7 1.6 4.8- Employment
2.2 1.0 0.7- 3.9 0.3 6.1 1.3- Productivity
2.6 0.1 24.5- 7.7- 53.4 7.6 26.2-
Gross
Investment
Main Industrial Indicators Real Annual Percentage Change
30

The Israeli Economy at a Glance
Source: Israel C.B.S
2009 2010 2011 2012 2013 2014 2015
Consumer goods 7,600 8,690 10,040 10,539 11,506 12,545 11,952
of which, durable 3,103 3,563 4,085 4,384 4,871 5,384 5,020
Production inputs 31,921 41,629 50,990 52,073 50,931 50,032 41,126
Investment goods 7,789 8,799 12,416 10,449 9,493 9,661 8,902
of which, machinery
& equipment 5,279 5,683 8,983 6,903 5,725 5,890 5,842
Total Imports 47,310 59,118 73,536 72,270 72,000 72,310 62,036
Imports of Goods (gross) By Major Category
Millions of U.S. $ (Current Prices)
31

The Israeli Economy at a Glance
2009 2010 2011 2012 2013 2014 2015
Agricultural export 1,230 1,327 1,381 1,373 1,495 1,368 1,168
1. Citrus 139 167 155 189 189 194 181
2. Flowers 146 103 106 128 126 108 88
Industrial export 44,399 53,640 62,441 58,656 61,773 64,172 60,292
1. Polished
Diamonds 9,431 12,962 16,689 14,393 15,713 17,090 15,113
2. Industrial export
excluding diamonds 34,968 40,678 45,752 44,263 46,060 47,082 45,179
Of which hi-tech 17,920 20,128 21,517 19,723 20,121 19,947 22,517
Other exports 2,307 3,464 3,980 3,200 3,700 3,455 2,495
Total Export 47,936 58,431 67,802 63,145 66,788 68,995 63,955
Source: Israel C.B.S, Foreign Trade.
Export of Goods (gross) Millions of U.S. $ (Current Prices)
32

The Israeli Economy at a Glance
Service Sector Exports Millions of U.S.$ (Current Prices)
2009 2010 2011 2012 2013 2014 2015
Travel & Tourist Services 4,444 5,106 5,305 5,446 5,666 5,695 5,366
Transportation Services 3,167 4,254 4,475 4,582 4,538 4,360 4,161
Other Business Services 15,075 15,209 17,539 22,828 24,229 25,275 24,890
Of which: Computer
Software
4,821 5,528 6,886 8,269 8,528 10,205 10,496
Research & Development 4,243 3,529 3,346 5,485 5,646 4,317 3,833
Total Services 21,983 25,373 27,386 32,909 34,484 35,376 34,473
Source: Israel C.B.S, Balance of Payments.
33