Embed Size (px)
Citation preview

MINISTRY OF AGRICULTURE AND RURAL DEVELOPMENT
Directorate of Economics
Research Paper Series
Republic of Mozambique
Comparing Yields and Profitability in MADER’s High- and Low-Input Maize Programs:
1997/98 Survey Results and Analysis
by
Julie Howard, José Jaime Jeje, Valerie Kelly and Duncan Boughton
Research Report No. 39March 2000

i
DIRECTORATE OF ECONOMICS
Research Paper Series
The Directorate of Economics of the Ministry of Agriculture and Rural Development maintainstwo publication series for research on food security issues. Publications under the Flash seriesare short (3-4 pages), carefully focused reports designed to provide timely research results onissues of great interest. Publications under the Research Paper series are designed to providelonger, more in-depth treatment of food security issues. The preparation of Flash reports andResearch Reports, and their discussion with those who design and influence programs andpolicies in Mozambique, is an important step in the Directorates's overall analysis and planningmission.
Comments and suggestions from interested users on reports under each of these series helpidentify additional questions for consideration in later data analysis and report writing, and in thedesign of further research activities. Users of these reports are encouraged to submit commentsand inform us of on-going information and analysis needs.
Sérgio ChitaráNational DirectorDirectorate of EconomicsMinistry of Agriculture and Rural Development

ii
ACKNOWLEDGMENTS
The Directorate of Economics is undertaking collaborative research on food security withMichigan State University’s Department of Agricultural Economics.
We wish to acknowledge the financial and substantive support of the Ministry of Agricultureand Rural Development of Mozambique and the United States Agency for InternationalDevelopment (USAID) in Maputo to complete food security research in Mozambique. Researchsupport from the Bureau for Africa and the Bureau for Global Programs of USAID/Washingtonalso made it possible for Michigan State University researchers to contribute to this research.
This study could not have been completed without the unstinting assistance we received frommany individuals, especially the farmers who permitted us to measure field areas, collect cropsamples for yield estimation, and subject them to long interviews. We are grateful to them andto the survey supervisor, interviewers, driver and data clerks listed individually on the followingpages. We would also like to thank Mr. Vittorino Xavier, Director of Agriculture in NampulaProvince, senior extension and research staff in Nampula Province, and Prof. Jim Oehmke ofMSU for their suggestions which improved the quality of field research and analysis undertakenin this paper. The final views expressed here are those of the authors and do not necessarilyreflect the official position of the Ministry of Agriculture and Rural Development nor of USAID.
Duncan BoughtonCountry CoordinatorDepartment of Agricultural EconomicsMichigan State University

iii
MADER/MSU RESEARCH TEAM MEMBERS
Sérgio Chitará, National Director, Directorate of Economics
Danilo Carimo Abdula, SIMA Coordinator
Rafael Achicala, SIMA Technician
Simão C. Nhane, SIMA Technician
Jaquelino Anselmo Massingue, MADER trainee Research and Agricultural Policy
Analyst
Arlindo Rodrigues Miguel, MADER trainee Research and Agricultural Policy Analyst
Raúl Óscar R. Pitoro, MADER trainee Research and Agricultural Policy Analyst
Pedro Arlindo, Research Associate
José Jaime Jeje, Research Associate
Anabela Mabote, Research Associate
Ana Paula Manuel Santos, Research Associate
Higino Francisco De Marrule, Research Associate
Paulo Mole, Research Associate
Maria da Conceição Almeida, Administrative Assistant
Francisco Morais, Assistant
Abel Custódio Frechaut, Assistant
Duncan Boughton, MSU Country Coordinator
Jan Low, MSU Analyst
Julie Howard, MSU Analyst
Donald Rose, MSU Analyst
David L. Tschirley, MSU Analyst
Michael T. Weber, MSU Analyst
iv
CONTRIBUTORS TO THE STUDY
Survey Supervisor: Carlos Jaquissone Fonseca
Interviewers: Damiao Rapieque Manuel Lopes Jose Cesar Jaime Martinho Daniel Casseremo Gustavo M. Caveta Estevao C. Bolacha Viegas Pedro Antonio P. Muehaiva Jacinto Joaquim Hilario Nameculo Anselmo Tabuca Belarmino Armando Jose Martinho Acacio Daniel Anteles Almeida Avelino Araujo Augusto Sabola Calisto Antonio Lancha Celestino Dimas Romao Poe Sabado Alfredo Sebastiao Tomas Cassamo Marcelino Caetano Juma Ignacio Ernesto dos Santos Arnaldo M. Jamal Joaquim Lampiao Cipriano Lampiao Olga M. Castro Cesar Areal Bonifacio Guerra Jacinto Bento Virgilio Caroa Boaventura Joao Jose Maricoa Faustino Tuela Pedro Casimiro Masmino Antonio Sebastiao S. Vicente Carlos Nacopala Basilio A.M. Queiros Antonio M. Mario
Data Entry Clerks: Hector Yazalde Ribeiro Andre Manuel
Driver: Palma Moreira

v
EXECUTIVE SUMMARY
Introduction and Objectives
Mozambique, one of the poorest countries in the world, must increase agricultural productivityto feed its growing population and spur economic recovery following years of civil war.Agricultural intensification is one way to increase productivity, but the use of technologies suchas improved seed and fertilizer is extremely limited.
The Department of Rural Extension (DNER) in the Ministry of Agriculture and RuralDevelopment (MADER) operates several programs to stimulate maize production through theuse of improved technologies in Mozambique’s high-potential regions. Until recently no formalanalysis had been carried out to assess the yield performance and profitability of the improvedtechnology packages. In 1996/97 the Department of Policy Analysis (DAP) in MADER’sDirectorate of Economics began a three-year study of yields and profitability in alternative maizeintensification programs in collaboration with DNER. This paper summarizes the results fromdata collected during the study’s second year, 1997/98. The analysis is based on a sample of 210smallholder farmers in Nampula Province using three different sets of production practices: (1)the DNER/Sasakawa-Global 2000 Program (DNER/SG) high-input package (improved open-pollinated maize, 100 kg/ha each 12-24-12 and urea fertilizer on credit), (2) improved plantingand weeding practices only (using local seed, without fertilizer); and (3) a control group offarmers using traditional practices (no improved seed or fertilizer).
The objectives of the research were to: (1) describe the characteristics, input use patterns andyield response by group; (2) analyze the relative contribution to yield of the differenttechnologies, environmental factors, and management practices; and (3) assess the profitabilityof the three different technology types at the farm level. We estimated econometric yield modelsto quantify the effects of key inputs and field practices on productivity. Financial budgets wereconstructed to assess the farm-level profitability of improved maize technology use.
Key Findings: Yield Results and Determinants
Average yields in the 1997/98 season ranged from 1.4 tons/ha for control group members(traditional practices, no purchased inputs) to 1.7 tons/ha for improved management only farmers(no purchased inputs) and 2.0 tons/ha for high-input farmers. Yields for all groups exceededaverage yields for Nampula Province in previous years by a wide margin. Provincial averageswere 0.8 ton/ha in 1994/95, 0.9 ton/ha in 1995/96 and 1.0 ton/ha in 1996/97. Our analysis ofsocioeconomic characteristics indicated that sample farmers are not significantly better off interms of resources than average farmers in Nampula Province. The relatively high sample yieldsfor farmers using no improved inputs (compared to provincial averages) suggest that the sitesincluded may have relatively better cropping conditions than other areas in the province.Therefore it will be important to use caution in generalizing from these findings to areas whereagroecological conditions are less favorable.
Although average high-input yields exceeded improved management only and control groupyields across the sample, when the results are disaggregated by region they reveal that high-inputyields are significantly higher than improved management yields only in Monapo/MecontaDistricts (Region 8). Average high-input yields in Region 8 were 2.7 tons/ha, compared to 2.0

vi
tons/ha for improved management only farmers and 1.8 tons/ha for control group members. Differences between groups in Regions 7 and 10 were not statistically significant.
Despite this apparent evidence of poor average performance from high-input technology, oureconometric analysis of yield determinants revealed a very strong and positive relationshipbetween higher yields and the use of improved seed and fertilizer together with increased plantdensity. The results suggest that high-input maize technology holds considerable potential forincreasing yields, but the performance of the improved input package in 1997/98 may have beencompromised by poor program implementation. In two of three regions, improved seed andfertilizer were delivered late and subsequently delayed planting by 2-5 weeks. The results alsoshow that use of high-input technology is riskier (i.e., yields are less stable) than low-input ortraditional methods. This is an especially important consideration if high-input technology isextended to farmers in more marginal agroecological areas or with fewer household resources forwhom a yield loss in one season could be catastrophic.
The analysis indicates that increasing plant density is critical to improving yields of high-inputmaize. While high-input program participants in our sample had significantly higher plantdensities than plots of improved management only or control groups, high-input densities werestill well below recommended levels: 30,808 plants/ha compared to the recommended level of50,000 plants/ha. Further investigation is required to determine the factors underlying thesediscrepancies and for the large variation in density across plots.
Seed and fertilizer recommendations in the high-input package were standard across the threeagroecological regions we examined, but the analysis suggests that differences between the threeagroecological regions are significant. Fine-tuning seed, fertilizer and crop managementrecommendations could improve yields, given the differences in soil types, rainfall, altitude andother agroecological characteristics between the three regions. Farmers also noted yield lossesdue to locally severe problems with termites and rats, wind damage in higher-elevation areas anddrought. More region-specific adaptive research is needed to identify specific solutions, e.g.,recommendations on pesticide use and ways to increase its availability at the local level, and onspecific varieties that could better withstand wind and drought conditions.
The lack of clarity regarding whether input credit would have to be repaid, combined with thelate delivery of inputs in two of the three regions, may have compromised the technicalperformance of the improved seed and fertilizer, and reduced farmer incentives to manage theirplots – especially weeding – as well as they might have.
Key Findings: Financial Analysis
The yield results indicate that farmers can significantly increase maize yields through theapplication of the recommended improved seed and fertilizer package, if inputs are delivered ontime and crop management recommendations are followed. The results of the financial analysisare more sobering. Under the conditions faced by smallholder farmers in 1997/98 (includinguncertainty about weather conditions, the timing of input delivery and commodity prices), theanalysis indicates that in most scenarios (sales in September, shortly after harvest, or inNovember, or January) the yield gains did not compensate for the high cost of the inputs, if netincome/ha is used as the measure of profitability. Farmers achieved higher returns (netincome/ha) when they used only improved management techniques without purchased seed or

vii
fertilizer. Only in Region 8 (Monapo/Meconta), where inputs were delivered on time andweather conditions were good, did the profitability of the high-input package exceed that ofimproved management alone, and then only if farmers waited until January to sell maize(benefitting from a price rise of 100% between September 1997 and January 1998).
The results of the financial analysis also suggest that all farmers – regardless of the technologypackage used – can potentially benefit from gains to storage and later sale of maize, especiallywhen insecticide is used to reduce grain losses to storage pests. Gains from storage are notassured, however. In 1997/98 seasonal price rises were impressive, but in 1998/99 because ofincreased production in Mozambique and the southern Africa region generally prices have beenmuch flatter.
The main finding from the financial analysis is that the use of improved technology on maize canresult in increased yields and profitability, but the level of risk and uncertainty surrounding useof improved maize technology, and the cost of supplying improved seed and fertilizer, are veryhigh. In 1997/98 the yield increases generated through the use of the technology packagegenerally did not compensate for the high cost of the inputs given prevailing output prices.
Conclusions
The results of this analysis suggest the need for policy and program actions, and further research,to reduce (1) the risks and uncertainty of input use at the farm level, and (2) the cost of inputsupply, to allow Mozambican smallholders to benefit from technological improvements that canpotentially increase yields, food security and incomes. Possible actions and research include:
Reducing production risk by fine-tuning agronomic recommendations. There weresignificant differences in yield response between the three agroecological regions studied. Because a large part of the differences may be attributable to variations in altitude, rainfall, andsoils, this suggests the need for fine-tuning the current blanket agronomic recommendations. Institutional incentives are required to motivate researchers and extensionists to modifytechnology recommendations for specific areas by synthesizing the results from on-station andon-farm trials, including INIA’s national geographically-referenced database on soil quality andresponse to fertilizer.
Focusing more adaptive research and extension effort on solving problems that seriouslyaffect maize yield. Our analysis indicates that plant density -- in conjunction with improvedseed and fertilizer use-- is the most important determinant of maize yield. Our results revealedvery high levels of variation in plant density among high-input farmers, 26,000-33,000 plants perhectare, compared to the recommended level of 50,000 plants per hectare. Closer extensionsupervision at planting time may be required, but adaptive research is also needed to addressother problems identified by farmers (e.g., termites, rats, early season mini-droughts).
Adjusting agronomic recommendations according to farmers’ ability to bear risk. Recommendations, particularly for expensive inputs such as commercial fertilizer, may also needto be adjusted on the basis of farmers’ capacity to bear risk. For example, farmers who havemore than one commercial crop, e.g., cotton and maize, may have a higher risk threshold. In theevent of a poor return on one crop(e.g., maize), maize input loans can be paid off with returnsfrom cotton. More research needs to be carried out to understand how farmers perceive risks and

viii
the attractiveness of alternative investments within the farming system, but preliminary resultssuggest the need for recommendations geared not only to agroecological differences but tovariations in farmers’ ability to spread risk among different crops in the farming system, oramong different on- and off-farm enterprises.
Improving research and extension on the costs, returns and risks of alternative technologiesin a cropping systems context. Through the efforts of the Cooperative League of the USA(CLUSA) and other NGOs, farmers in Nampula Province are becoming more aware of thepotential costs and returns from alternative commercial crops, e.g., cotton, maize, sunflower,sesame, pigeon pea-- and the importance of analyzing these during pre-season planning. Researchers and extensionists can contribute significantly to this discussion, by (1) collectingdata on labor inputs and carrying out financial analysis of trials (especially on-farm trials) of newtechnology and crop management techniques; (2) making information on yield and profitabilityavailable to farmers in an easy-to-understand extension bulletin format; (3) DNER, DAP andSIMA (Market Information System) collaboration to assess and extend information about theprice risk associated with alternative commodities; and (4) improving research and extension onalternative crops and technologies in a cropping systems context.
Reducing the cost of input supply. Our analysis showed that the cost of improved seed andfertilizer represented 68-80% of production costs (exclusive of family labor) for sample farmers. Reducing costs at strategic points in the input sector will clearly improve the farm-levelprofitability of improved technology. The research activity described in this paper did not focuson the impact of government and donor policies and programs on input supply, but these arediscussed at length in a recent DAP study on constraints and strategies for the development of theMozambican inputs sector. Key recommendations of that paper include (a) investments to reducetransport costs, including road, rail and shipping infrastructure, and incentives to the privatesector to expand and maintain rural transport fleets; (b) government withdrawal frommanagement of the KRII program for supply of fertilizer, pesticides and machinery; (c) reductionof policy barriers to regional trade in inputs by the private sector, and research to explore thepossibility of reducing shipping and transport costs through bulk ordering of fertilizer withpartners in neighboring countries; (d) expansion of programs to train input dealers in rural areas;and (e) programs to supply improved seed varieties to remote, less commercially developed areasof Mozambique.
Farmer associations are increasingly active in Nampula Province and present one of themost promising avenues for lowering input and output marketing costs. Farmer associationscan potentially lower the private sector costs of input supply and credit recovery, and increaseextension effectiveness, by (a) aggregating input demand from scattered rural villages; (b)organizing local delivery to member villages after inputs are delivered to a central location; (c)organizing extension assistance on a group basis; and (d) providing group guarantees for inputloans.

ix
TABLE OF CONTENTS
Section Page
EXECUTIVE SUMMARY . . . . . . . . . . . . . . . . . . . . . . . . . . . . . . . . . . . . . . . . . . . . . . . . . . . . . . v
1. INTRODUCTION . . . . . . . . . . . . . . . . . . . . . . . . . . . . . . . . . . . . . . . . . . . . . . . . . . . . . . 1
1.1. Objectives . . . . . . . . . . . . . . . . . . . . . . . . . . . . . . . . . . . . . . . . . . . . . . . . . . . . . . . . . 21.2. Methods . . . . . . . . . . . . . . . . . . . . . . . . . . . . . . . . . . . . . . . . . . . . . . . . . . . . . . . . . . . 2
1.2.1. Sample Selection . . . . . . . . . . . . . . . . . . . . . . . . . . . . . . . . . . . . . . . . . . . . . 21.2.2. Questionnaire Design and Data Collection . . . . . . . . . . . . . . . . . . . . . . . . . 5
1.3. Organization of the Paper . . . . . . . . . . . . . . . . . . . . . . . . . . . . . . . . . . . . . . . . . . . . . 6
2. CHARACTERISTICS OF SAMPLE FARMERS AND TYPICAL AGRICULTURALHOUSEHOLDS IN NAMPULA PROVINCE . . . . . . . . . . . . . . . . . . . . . . . . . . . . . . . . 7
3. YIELD RESULTS AND DETERMINANTS . . . . . . . . . . . . . . . . . . . . . . . . . . . . . . . . . . . . . 9
3.1 Yield Results . . . . . . . . . . . . . . . . . . . . . . . . . . . . . . . . . . . . . . . . . . . . . . . . . . . . . . . 93.2. Econometric Analysis of Maize Yield Determinants . . . . . . . . . . . . . . . . . . . . . . . . 9
3.2.1. Analysis by Technology Type . . . . . . . . . . . . . . . . . . . . . . . . . . . . . . . . . 113.2.2. Results from the Cross-Region Yield Model . . . . . . . . . . . . . . . . . . . . . . 113.2.3. Results from the Regional Yield Models . . . . . . . . . . . . . . . . . . . . . . . . . 15
3.3. Summary . . . . . . . . . . . . . . . . . . . . . . . . . . . . . . . . . . . . . . . . . . . . . . . . . . . . . . . . . 16
4. FINANCIAL ANALYSIS . . . . . . . . . . . . . . . . . . . . . . . . . . . . . . . . . . . . . . . . . . . . . . . . . . . 21
4.1. Data and Methods Used . . . . . . . . . . . . . . . . . . . . . . . . . . . . . . . . . . . . . . . . . . . . . . 214.2. Using the Complete High-Input Seed and Fertilizer Package is Financially Risky 22
4.2.1. Region 7 (Ribaue) . . . . . . . . . . . . . . . . . . . . . . . . . . . . . . . . . . . . . . . . . . 244.2.2. Region 8 (Monapo/Meconta) . . . . . . . . . . . . . . . . . . . . . . . . . . . . . . . . . . 244.2.3. Region 10 (Malema) . . . . . . . . . . . . . . . . . . . . . . . . . . . . . . . . . . . . . . . . 25
4.3. Gains from Storage . . . . . . . . . . . . . . . . . . . . . . . . . . . . . . . . . . . . . . . . . . . . . . . . . 254.3.1. Gains from Sale in November and January . . . . . . . . . . . . . . . . . . . . . . . 254.3.2. Potential Gains from Use of Storage Insecticide . . . . . . . . . . . . . . . . . . . 26
4.4. Improved Seed and Fertilizer Represent 68-80% of Total Production Costs . . . . . 264.5. Labor Use and Management . . . . . . . . . . . . . . . . . . . . . . . . . . . . . . . . . . . . . . . . . . 264.6. Credit Repayment . . . . . . . . . . . . . . . . . . . . . . . . . . . . . . . . . . . . . . . . . . . . . . . . . . 274.7. Summary . . . . . . . . . . . . . . . . . . . . . . . . . . . . . . . . . . . . . . . . . . . . . . . . . . . . . . . . . 29
5. CONCLUSIONS . . . . . . . . . . . . . . . . . . . . . . . . . . . . . . . . . . . . . . . . . . . . . . . . . . . . . . . . . . . 31
REFERENCES . . . . . . . . . . . . . . . . . . . . . . . . . . . . . . . . . . . . . . . . . . . . . . . . . . . . . . . . . . . . . . 42

x
LIST OF TABLES
Table Page
Table 1. Agroecological Characteristics and Maize Technology . . . . . . . . . . . . . . . . . . . . . . . . 5Table 2. Sample Composition . . . . . . . . . . . . . . . . . . . . . . . . . . . . . . . . . . . . . . . . . . . . . . . . . . . . 5Table 3. Selected Characteristics of Participant Households Versus the Broader Population of
Agricultural Households . . . . . . . . . . . . . . . . . . . . . . . . . . . . . . . . . . . . . . . . . . . . . . . . . . 7Table 4. Average Maize Yields by Technology Type . . . . . . . . . . . . . . . . . . . . . . . . . . . . . . . . 10Table 5. Disaggregation of Maize Technology Types by Agroecological Region . . . . . . . . . . 10Table 6. Cross-Region Regression Analysis of Factors Affecting Maize Yields . . . . . . . . . . . . 13Table 7. Input Receipt and Planting Dates . . . . . . . . . . . . . . . . . . . . . . . . . . . . . . . . . . . . . . . . . 14Table 8. Regression Analysis of Factors Affecting Maize Yields -- Region 7 . . . . . . . . . . . . . 18Table 9. Regression Analysis of Factors Affecting Maize Yields -- Region 8 . . . . . . . . . . . . . 19Table 10. Regression Analysis of Factors Affecting Maize Yields -- Region 10 . . . . . . . . . . . 20Table 11: Summary of Results from Farm-Level Maize Enterprise Budgets . . . . . . . . . . . . . . . 23Table 12: Break-even Maize Producer Prices . . . . . . . . . . . . . . . . . . . . . . . . . . . . . . . . . . . . . . . 28Table 13: Total Family, Mutual and Wage Labor Days Used in Maize Production . . . . . . . . . . 28Table 14. Results Under Optimal Conditions . . . . . . . . . . . . . . . . . . . . . . . . . . . . . . . . . . . . . . . 29Table 15. Regression Analysis of Factors Affecting Plant Density -- Regions 7,8,10 . . . . . . . . 35Table 16. Regression Analysis of Factors Affecting Plant Density -- Region 7 . . . . . . . . . . . . 36Table 17. Regression Analysis of Factors Affecting Plant Density -- Region 8 . . . . . . . . . . . . 37Table 18. Regression Analysis of Factors Affecting Plant Density -- Region 10 . . . . . . . . . . . 38Table 19. Summary of Farm Level Enterprise Budget for Region 7 (Ribaue), by Technology Type . . . . . . . . . . . . . . . . . . . . . . . . . . . . . . . . . . . . . . . . . . . . . . . . . . . . 40Table 20. Summary of Farm Level Enterprise Budget for Region 8 (Monapo/Meconta), by
Technology Type . . . . . . . . . . . . . . . . . . . . . . . . . . . . . . . . . . . . . . . . . . . . . . . . . . . . . . . 42Table 21. Summary of Farm Level Enterprise Budget for Region 10 (Malema), by Technology
Type . . . . . . . . . . . . . . . . . . . . . . . . . . . . . . . . . . . . . . . . . . . . . . . . . . . . . . . . . . . . . . . . 44
FIGURE
Figure Page
Figure 1. Survey Sites . . . . . . . . . . . . . . . . . . . . . . . . . . . . . . . . . . . . . . . . . . . . . . . . . . . . . . . . . . 4
APPENDIX
Appendix Page
APPENDIX 1: YIELD DETERMINANTS MODELS . . . . . . . . . . . . . . . . . . . . . . . . . . . . . . . . 34APPENDIX 2: FARM-LEVEL FINANCIAL BUDGETS . . . . . . . . . . . . . . . . . . . . . . . . . . . . 39

1The 1996/97 results are reported in Howard, Julie A, José Jaime Jeje, David Tschirley, PaulStrasberg, Eric W. Crawford and Michael T. Weber. 1998. What Makes Agricultural Intensification Profitablefor Mozambican Smallholders? NDAE Working Papers No. 31 and 32 (Volumes 1 and 2). Maputo: MADER
1
Comparing Yields and Profitability in MADER’s High- and Low-Input Maize Programs:1997/98 Survey Results and Analysis
1. INTRODUCTION
Mozambique, one of the poorest countries in the world, must increase agricultural productivity tofeed its growing population and spur economic recovery following years of civil war. Maize isMozambique’s most important food crop. Maize is planted on over one-third of Mozambique’stotal cultivated area, supplying 25% of all calories and 61% of calories from cereal (DEA 1998,FAOSTAT 1999). Intensification is one way to increase productivity, but the use of technologiessuch as improved seed and fertilizer is extremely limited.
The Department of Rural Extension (DNER) in the Ministry of Agriculture and RuralDevelopment (MADER) operates several programs to stimulate maize production through the useof improved technologies in Mozambique’s high-potential regions, including (1) DNER’s basicapproach of extending improved planting and weeding practices (with local or improved seed, butwithout fertilizer) to participating farmers; and (2) the DNER/Sasakawa-Global 2000 Program(DNER/SG) in which participating farmers receive fertilizer and improved seeds on credit for useon a half hectare of their land.
Until recently no formal analysis had been carried out to assess the yield performance andprofitability of the improved technology packages. In 1996/97 the Department of Policy Analysis(DAP) in MADER’s Directorate of Economics began collaborating with DNER on a three-yearstudy of yields and profitability in alternative maize intensification programs. During the firstseason (1996/97) we analyzed the farm-level impacts of the DNER/SG Program, interviewing223 DNER/SG participants in Manica and Nampula Provinces.1 Key findings from 1996/97included:
� Average DNER/SG maize yields (with improved inputs) were 2.3. tons/ha, muchhigher than the provincial averages (without improved inputs), which ranged from.4 to 1.3 tons/ha;
� Yields varied greatly even within the same agroecological zone and amongfarmers using the same seed variety and fertilizer rate. DNER/SG Program yieldsranged from .5 to 4.9 tons/ha;
� The profitability of improved input use varied significantly depending on yieldlevels, the agroecological region and the timing of maize sales. During 1996/97,storing maize for several months dramatically increased farmer gains. Whenfarmers sold immediately after harvest (June), only 36% made a profit. At theDecember price, 80% profited. Farmers in the bottom two yield terciles earnedattractive returns only if they waited until December to sell.

2
This paper summarizes the results from data collected and analyzed during the study’s secondyear. The 1997/98 analysis is based on a stratified sample of 210 smallholder maize farmers inNampula Province. In contrast to the 1996/97 research, when the sample was composed entirelyof farmers using the DNER/SG high-input package (improved seed, fertilizer, improvedpractices), the 1997/98 sample strata represent three different sets of production practices: (1) theDNER/SG high-input, improved management package; (2) an improved management onlyprogram implemented by the extension service (improved practices, local seed, no fertilizer); and(3) a control group of farmers who did not participate in any formal program. These farmergroups will be referred to as (1) high-input; (2) improved management only; and (3) control types.
1.1. Objectives
Our specific research objectives were to:
1. Describe (a) the characteristics of high-input, improved management only and controlgroup participants; (b) input use patterns; and (c) yield response by group;
2. Analyze the relative contribution to yield of (a) different types of technologies, (b)environmental factors, and (c) management practices; and
3. Assess the profitability of the three different plot types at the farm level.
1.2. Methods
1.2.1. Sample Selection
Agroecological regions. Sample farmers were selected from three different agroecological regionsof Nampula Province: Ribaue District (Region 7), Monapo and Meconta Districts (Region 8),and Malema District (Region 10). All three regions are considered to have good to excellentconditions for maize production. Figure 1 shows the location of survey sites and Table 1describes the major agroecological characteristics of each region.
Technology types. The sample was drawn from three distinct groups of farmers within eachagroecological region. High-input farmers participated in a special DNER/SG program thatprovided 15 kg of improved open-pollinated seed, 50 kg of 12-24-12 and 50 kg of urea on creditfor use on ½ hectare of the farmer’s own land. The credit was to be repaid at harvest with a flatinterest rate of 15% (equivalent to an annual rate of 22.5%). High-input farmers received moreintensive extension assistance than farmers in the other two groups. Farmers were directed toplant in rows soon after the onset of the rainy season (late November to late December) and toapply one spoonful of 12-24-12 per hill at planting time. The recommended hill spacing was 90cm x 40 cm, with two seeds per hole, resulting in a target plant density of 50,000 plants/ha. Ureawas to be applied as a side dressing when plants were knee high. Farmers were asked to weed atleast twice.
In 1997/98, sample farmers in the improved management only group used local seed and followedmanagement practices specified during regular meetings with the individual extension agent, but

3
did not use fertilizer. Members of the control group used local seed and traditional practices, butno fertilizer.
Sampling procedure. Sample farmers were selected as follows. First, a complete listing ofextension agents working in the three agroecological regions was made. To select farmers for thehigh-input sample, each extension agent was asked to draw up a list of all farmers participating inthe high-input program under his/her supervision. Each agent then randomly selected 2 farmersfor inclusion in the sample.
A two-stage process was used to select farmers for the improved management only sample. Eachextension agent first compiled a list of all farmer groups assisted by him/her. Two of thesegroups were randomly selected. The agent then drew up an alphabetical list of all farmersgrowing maize in a sole stand who regularly participated in these groups. One farmer per groupwas randomly selected for the sample.
To select the control group, extension agents were asked to list all farmers growing sole-croppedmaize within a 1 kilometer radius of the first high-input participant. One of these control farmerswas selected for the sample, and the process was repeated for the second high-input participant. The procedure was repeated for the improved management only participants -- all farmers within1 kilometer were listed and one was randomly selected for inclusion in the control group.
The objective was to draw a sample of roughly equal size for each of the three agroecologicalregions, with each farmer group equally represented. Table 2 summarizes the sample size byregion and technology type. The sample was composed of 82 farmers in Ribaue (Region 7) and96 farmers in Monapo/Meconta (Region 8). The sample for Malema (Region 10) was muchsmaller -- 30 farmers -- because there were very few high-input participants in this region. Allhigh-input farmers in Malema were chosen for inclusion in the sample.

4
Figure 1. Survey Sites

2Two households were dropped from the original sample (210 households) because of missing yielddata.
5
Table 1. Agroecological Characteristics and Maize Technology
Characteristic�
Region �
Altitude(metersabove sealevel)
Avg.rainfall(mm)
Avg.temp.duringcroppingseason
Soils Major crops
Ribaue (Region 7)
200-1,000 1,000-1,400
20-25�C sandy toheavier clay
maize,sorghum,cassava,cowpea,groundnut,cotton
Monapo/Meconta (Region 8)
coastal 800-1,200
>25�C sandy, heaviersoils in low-lying areas
cassava, maize
Malema(Region 10)
>1,000 >1,200 15-22.5�C
heavy maize
Source: MAP 1996
Table 2. Sample Composition
Characteristic�
Region �
Total numberof farmers
High-input participants
Improvedmanagementonly group
Control group
Ribaue (Region 7) 82 34 27 21
Monapo/Meconta (Region 8) 96 32 34 30
Malema (Region 10) 30 13 10 7
Total 2082 79 71 58
Source: Survey data
1.2.2. Questionnaire Design and Data Collection
Primary data collection was carried out in two rounds between May and August 1998. Forty-twoarea extension agents served as enumerators, working under the supervision of DAP/DNER staff. Training and questionnaire pre-testing were carried out during May and early June. Primary datacollection began in mid-June and continued until August. Additional data on transport and othersubsector costs were collected from November 1998 to March 1999 through informal interviewswith private sector importers, transporters, wholesalers and retailers, and a review of secondarydocuments.

6
Yield estimation. During the first round of data collection, enumerators marked, harvested andweighed the grain from 3 randomly-selected 49 square meter areas per field for yield estimation.
Collection of area, agronomic, demographic and input use data. During the second round of datacollection, enumerators measured the area of the sample plot; gathered information about the soilcharacteristics and history of the sample plot; collected demographic data on the household;compiled general information for the whole farm on area/input use for major crops and changes inlivestock holdings over the past five years; and collected specific information for the high-input,improved management only or control plot regarding (a) dates of major field activities and receiptof inputs obtained on credit; (b) household and non-household labor inputs and costs; (c) amountsused and costs of other inputs (including animals, tractor, fertilizer, seed); (d) farmer assessmentof the impact of weather events and pests on production; and (e) farmer perception of theimportance of purchased inputs.
Analytical methods. We used several complementary analytical methods to address the researchobjectives. Econometric yield models were estimated to quantify the effects of key inputs andfield practices on productivity, and financial budgets were constructed to assess the farm-levelprofitability of the maize technology.
1.3. Organization of the Paper
In the following section we summarize key socioeconomic indicators for the sample farmers andcompare these characteristics to average values for Nampula Province and Mozambique. Insection 3 we present maize yield results and discuss the key factors affecting yields. Results ofthe farm-level profitability analysis are presented in section 4. The paper concludes (section 5)with a summary of the main findings and a discussion of implications for policies and futureprograms aimed at increasing the use of improved technologies.

7
2. CHARACTERISTICS OF SAMPLE FARMERS AND TYPICAL AGRICULTURALHOUSEHOLDS IN NAMPULA PROVINCE
Extension programs sometimes introduce new technologies to richer, more highly educatedfarmers first, then extend the technologies to poorer farmers after the yield advantage andprofitability of the package have been demonstrated. It is important to know whether DNER/SGhigh-input program participants are “better-off” farmers. If they are, the survey findings mayhave limited applicability beyond this higher income group. Extension techniques that aresuccessful with this group may also need to be modified for poorer farmers. To assess whetherour high-input group farmers are “better off” than average farmers, we compared keycharacteristics of farmers in the high-input, improved management only and control groups withsimilar indicators for Nampula Province farmers from the 1996 National Survey of SmallholderAgriculture (Table 3).
There were few significant resource differences between farmers in the three groups. The onlystatistically significant difference was years of education. High-input users were more highlyeducated than other farmers. Other resource differences -- land, labor, and wealth as reflected bylivestock holdings -- were not significant. In general farmers in the 1997/98 sample were morelikely to use fertilizer than Nampula farmers surveyed in 1995, perhaps reflecting the expansionof commercial agricultural crops in recent years. Farmers with average resources, even those notin a formal program, are experimenting with improved inputs. This bodes well for the futureextension of high-input technologies to areas with similar agroecological conditions.
Table 3. Selected Characteristics of Participant Households Versus the Broader Populationof Agricultural Households
DNER/SGHigh-InputProgram
ImprovedManagementOnly
ControlGroup
NampulaProv./Moz.
Average farm area (ha/household) 2.5a 2.5a 2.1a 2.1b
Mean household size (persons/household) 5.6c 5.1c 4.6c 4.7d
Average hectares cultivated per capitae .5 .5 .5 .45
Mean years of school completedf 3.6g 2.4g 2.8g
Mean livestock units per householdh 2.4 2.8 2.0i
% using chemical fertilizer in 97/98j 100.0 9.3 5.4 0.3k
% using improved maize seed in 97/98 100.0 12.7l 19.0l <20m
Notes:a Source: Survey data. Median estimates based on farmers’ own estimates of total farm area. Does not include land plantedwith fruit-bearing trees. Differences between program groups were not significant.b Source: DEA 1998. c Source: Survey data. Differences between program types were not significant. d Source: DEA 1998.e Values are medians for the 3 program groups. Ratios are calculated at the household level first, then all observations areranked to find the median. Source of Nampula Province estimates: DEA 1998. fSource: Survey data. Differences between the three groups were significant at the .007 level.gSource: Survey data. hCalculated using the following weights: cattle=1, sheep/goats=.5, horses/mules=.7, pigs=.5, fowl=.15, rabbits=.1. Differencesbetween program groups were not significant.iNot available. jSource: Survey data. kSource: DEA 1998.lSource: Survey data. For low-input and non-program participants, may include recycled improved varieties.mSource: Dominguez and Chidiamassamba 1997

3 The coefficient of variation expresses the standard deviation as a percentage of the mean.
8
3. YIELD RESULTS AND DETERMINANTS
In the following sections we present and analyze the maize yield results obtained by high-input,improved management only and control group farmers in our sample. In section 3.1, we examinemaize yield levels and variability. In sections 3.2 and 3.3., we analyze the key factors affectingyields and quantify their relative impacts.
3.1 Yield Results
Average yields in the 1997/98 season ranged from 1.4 tons/ha for control group members to 1.7tons/ha for improved management only farmers and 2.0 tons/ha for high-input farmers (Table 4). Yields for all groups exceeded average yields for Nampula Province in previous years by a widemargin. Provincial averages were 0.8 ton/ha in 1994/95, 0.9 ton/ha in 1995/96 and 1.0 ton/ha in1996/97 (Howard et al. 1998).
Although average high-input yields exceeded improved management only and control groupyields across the sample, when the results are disaggregated by region they reveal that high-inputyields are significantly higher than improved management yields only in Monapo/MecontaDistricts (Region 8). Average high-input yields in Region 8 were 2.7 tons/ha, compared to 2.0tons/ha for improved management only farmers and 1.8 tons/ha for control group members. Differences between groups in Regions 7 and 10 were not statistically significant (Table 5).
Yield variability as measured by the coefficient of variation3 was high across the sample, butinstability -- thus risk -- was greater for high-input farmers than in the other groups. In the overallsample, average high-input yields deviated from the mean by 57%, compared to 45% forimproved management only farmers and 48% for control group participants (Table 4). Whenresults are disaggregated by region, yield variability is again greater for high-input farmerscompared to other groups in Regions 7 and 8 (Table 5), but in Region 10 it is higher for controland improved management only groups. This result may be influenced by the relatively smallsample size in Region 10 compared to the other regions.
3.2. Econometric Analysis of Maize Yield Determinants
The objective of the analysis in this section is to identify the key factors influencing maize yieldsand to quantify the relative impact of these factors. To accomplish this we constructed yieldmodels at cross-regional and regional levels. In section 3.2.1.we explain how we dealt with thedisaggregation of technology effects in our analysis. Sections 3.2.2 and 3.2.3. summarize andinterpret the main results from the cross-regional and regional yield models.

9
Table 4. Average Maize Yields by Technology Type
Types of MaizeTechnology
Number ofplots using agiventechnology
Average yields(kg/ha) (c.v. inparentheses)
Average fertilizer applied (kg/ha)
DAP Urea
(1) High InputImproved seed, fertilizerand practices(coefficient of variation)
79 1980(57.3)
100 100
(2) ImprovedManagement OnlyLocal seed, no fertilizer,improved practices (c.v.)
71 1720(45.0)
0 0
(3) Control GroupLocal seed, no fertilizer,traditional practices(c.v.)
58 1447(48.1)
0 0
Source: Survey data
Table 5. Disaggregation of Maize Technology Types by Agroecological Region
Techno-logy type
Region 7 (Ribaue) Region 8 (Monapo/Meconta) Region 10 (Meconta)
Numberof plots
Averageyield/ha*
Averageplantdensity/ha
Numberof plots
Averageyield/ha**
Averageplantdensity/ha
Numberof plots
Averageyield/ha***
Averageplantdensity/ha
(1) HighInput(c.v.)
34 1343a
(53.2)29,632(40.5)
32 2701a
(47.1)32,847(36.6)
13 1872a
(25.7)26,211(32.5)
(2) Imp.Manage-mentOnly(c.v.)
27 1322b
(43.9)16,435(38.0)
34 1969b
(34.8)19,117(33.9)
10 1950b
(56.0)18,442(34.8)
(3)Control(c.v.)
21 1086c
(34.8)13,874(26.2)
30 1747c
(38.6)17,943(45.5)
7 1247c
(79.1)16,900(49.8)
Source: Survey dataNotes:* a=b=c (no statistically significant difference between groups)** a>b>c (yield for each group is statistically different from other groups)*** a=b=c (unable to show statistically significant difference due to small sample size)

4Our models exhibited severe multicollinearity among the major explanatory variables, especially betweenplant density and technology type. Higher plant density was a key extension message for high-input farmers; thusplant density was highly correlated with participation in the high-input program. The relationship is readilyapparent in Table 5. Including plant density and technology type as explanatory variables in the same equationinvariably resulted in a very unstable model, while excluding one or the other key variable resulted in a model withlittle explanatory power.
The approach we used to address this problem (suggested by Prof. Jim Oehmke) was to regress plantdensity on the other explanatory variables in the equation, then substitute the residuals from this equation back intothe yield equation instead of using the plant density variable directly. This approach permits the indirect effect ofother explanatory variables that are influencing yield through an impact on plant density to be captured (along withthe direct effects) by the coefficients for each variable in the yield equation, rather than being lumped together in thecoefficient for plant density. The variable created using the residuals from the plant density equation representsonly that part of the variability in plant density that is not explained by the other variables in the equation, i.e., thedirect effect of plant density on yield.
It is important to note that with this type of model it is generally not possible to draw conclusions about therelative contribution of the direct and indirect effects of different variables. However, in this case we suspect thatthe indirect effect of high-input technology (improved seed, fertilizer, improved practices) is strong because in thecross-region model technology type 1 (TECH1) was the only significant variable in the plant density equation. Theresults of all cross-region and region-specific plant density equations are presented in Appendix 1.
10
3.2.1. Analysis by Technology Type
Under experimental conditions it would be possible to include the technology variables -- seed, 12-24-12 and urea -- as separate variables in the regression equations to assess the relative impact ofeach input on yield. This proved impossible because of the lack of variability in the use of thesefactors among farmers in our sample. Farmers who used improved seed used exactly the samevariety, and those who used improved seed also used exactly the same quantities of 12-24-12 andurea. Consequently in our analysis input levels are represented by technology types: technology type1 represents high-input farmers who used improved seed and fertilizer; technology type 2 representsfarmers who used improved management practices only, and technology type 3 is the control group --farmers who used traditional technologies (no fertilizer or improved seed) and received no extensionassistance.
In addition to technology type, the other factors examined in our yield models fell into two broadcategories: (1) exogenous factors that farmers respond to but cannot completely control such asrainfall, soil type, disease and pest attacks; and (2) endogenous factors linked to managementpractices such as plant density, the timing of critical operations and amount of labor used.
3.2.2. Results from the Cross-Region Yield Model
Table 5 shows average yield and plant density for the three technology types by region. Table 6summarizes other key results from the cross-region yield model.4 The model explains half of thevariation in yield (adj. R2=.49). Because logged variables are included in the equation, we report thestandardized coefficients, indicating the relative contribution of each factor to overall yield.

5Twelve per cent of Region 7 sample farmers classified their plots as “low” fertility (vs. average or highfertility), compared to 5 and 7 per cent of farmers in Regions 8 and 10.
6Recent findings of a CERES maize simulation model for Ethiopia showed that there is little payoff toincreasing plant density when no fertilizer is applied. Also, in order to take advantage of the increased yieldpotential of improved varieties and fertilizer it is necessary to increase plant density significantly (Schulthess andWard 1999).
11
Technology and program implementation. The factors that had the strongest impact on yield wereclosely related to the technology package and program implementation. The most important factorwas location in agroecological region 8. The regional dummy variables reflect both agroecologicalimpacts (e.g., differences in altitude, rainfall, soil-- discussed below), and other factors that variedacross regions. The Region 8 variable probably reflects the positive impact of on-time input deliveryon maize yields in that region. In Regions 7 and 10 late input delivery led to planting delays of 2-5weeks for high-input farmers compared to farmers in the other groups (Table 7).
Yields in Regions 8 and 10 were significantly higher than in Region 7. Region 7 yields were also thelowest among all regions in our 1996/97 survey. A possible explanation is poorer soil fertilitycompared to the other regions. Soils in Region 7 are predominantly acid Acrisols, while more fertileLuvisols and Lixisols are common in Regions 8 and 10 (Geurts 1997). Relatively more Region 7sample farmers also reported having poor soils.5 In general, agroecological differences betweenRegion 7, 8 and 10 (yield differences between Regions 8 and 10 were also statistically significant)suggest the importance of fine-tuning seed, fertilizer and crop management recommendations to helpfarmers increase yields and profits. Another key factor influencing yields was plant density. The extension recommendation for high-input plots was 50,000 plants per hectare. Extension agents also recommended row planting andincreased plant densities to some improved management only groups. Table 5 indicates that high-input plant density fell well short of the target, but it was significantly higher (26,211-32,847plants/ha) than that of improved management only (16,435-19,117 plants/ha), whose densities werestatistically greater than those of control groups (13,874-17,943 plants/ha).
The model results also indicate that the use of improved seed and fertilizer (TECH1) clearly had alarge and positive influence on yield. The standardized coefficient for TECH1 (.343) is almost aslarge as for plant density (.379). As noted previously, the TECH1 and plant density variables arehighly correlated and the indirect and direct effects of TECH1 on plant density and on yield aredifficult to separate in this model. It is not possible to conclude that either plant density or theimproved seed/fertilizer technology had the more important impact on yield. This has practicalsignificance, since separate recommendations (a) to greatly increase plant density in the absence ofsoil fertility supplements or (b) use improved seed and fertilizer without a corresponding increase inplant density are unlikely to result in sustainable yield increases.6
The impact of improved practices and additional extension assistance provided to farmers in theimproved management only group (TECH2) also had a positive and significant effect on maize yields

12
Table 6. Cross-Region Regression Analysis of Factors Affecting Maize Yields All Zones (Adj. R2=.49, F=18.577)a
Variables Coef. SE Coef. Stdized Coeff. T Sig. T
Constant 6.526 .144 45.389 .000
REGION 81=Region 80=otherwise
.452 .065 .430 6.953 .000
PLANT DENSITYResidual from plant densityequation
.508 .070 .379 7.209 .000
TECH11=fertilizer+improved seed0=otherwise
.367 .074 .343 4.937 .000
OTHERDAM1=reported significantdamage from termites,wind,drought,flood,or rats0=no or little damage
-.284 .062 -.255 -4.566 .000
SOILFERT1=high or medium fertility0=low
.378 .106 .197 3.55 .000
TECH21=improved practice/extension assistance0=otherwise
.197 .072 .179 2.746 .007
REGION 101=Region 100=otherwise
.219 .086 .154 2.55 .012
WKPLANTweek of planting; 1=4th week October2=1st week Nov.,etc.
.0192 .011 .098 1.712 .089
EDUCgrade level completed
-.0192 .013 -.087 -1.529 .128
PLTLAHA number of adult-equivalentlabor days used for planting
-.0028 .003 .055 .989 .324
Source: Survey dataa 17 households of the total sample of 208 were excluded from the cross-regional and regional analyses because of extreme values inkey variables that suggested data errors.

13
Table 7. Input Receipt and Planting Dates
Group�Region�
High-input Low-input Non-programparticipants
Region 7 Plantingweek
3rd December 1st December 1st December
Receipt ofimprovedseed/fertilizer
3rd December
Region 8 Plantingweek
3rd December 2nd December 2nd December
Receipt ofimprovedseed/fertilizer
1st - 2nd December
Region 10 Plantingweek
1st January 1st December 3rd November
Receipt ofimprovedseed/fertilizer
4th December
in the sample. However, the smaller size of the standardized coefficient for TECH2 (.179) relative toTECH1 (.343) indicates that the impact of the extension assistance alone was far less important thanthe extension aid combined with improved seed and fertilizer provided to the high-input group.
Crop damage factors. Farmers were asked whether their maize plots had suffered extensive damage(affecting >10% of production) from a variety of causes, namely termites, high winds, drought,flooding of fields or rats (damage from disease, insects or weeds was recorded in separate variableswhich were not significant in this model). The model results indicate that these problems had strongand significant negative impacts on yields. Farmers clearly have little control over some of thesefactors, e.g., wind, drought, but pesticides to control termites and rats are available in Mozambique. Individual damage factors were isolated in some of the region-specific results presented in Section3.2.3.
Soil fertility. Farmers were asked to assess whether their maize plots had low, medium or high levelsof fertility. The model results suggest that farmers were good judges of their plots. Yields weresignificantly higher for plots which were reported to have medium or high fertility than plots withlow fertility.
Other factors. Other variables included in the yield equation were not significant at the standard .05cutoff level. Planting week was positively related to yield and was significant at the .09 level. Thisresult indicates that sample farmers who waited to plant had higher yield results than those who

14
planted earlier. This is contrary to expectation since the usual recommendation is to plant soon afterthe first substantial rainfall. Further analysis is needed, but the influence of technology type may beconfounding here. As noted earlier, farmers in the high-input group who used improved seed andfertilizer got their inputs late in Regions 7 and 10 and planted 2-5 weeks later than their counterpartsin improved management only and control groups. In spite of these delays high-input farmers gothigher yields than their counterparts in two of the three regions (but probably not as high as theycould have had inputs arrived on time). Where inputs did arrive on time and high-input farmersplanted at roughly the same time as other groups (Region 8) the yield differences were much moredramatic.
The level of education was negatively correlated with maize yields but significant only at the .13level. This again is an unexpected sign but consistent across the individual regions (see Section3.2.3.). One implication is that technology programs aimed at potentially fast adopters should notnecessarily use education level as a screening variable. The amount of labor used for planting waspositively correlated with yield, but it is a weak relationship (significance level=.32), possibly a resultof problems with the quality of labor data collected through the one-time end of season recallapproach.
3.2.3. Results from the Regional Yield Models
In addition to the cross-region model reviewed above, we also constructed separate yield models forRegions 7, 8 and 10 in order to better understand the factors affecting yield in each agroecologicalzone. Tables 8, 9 and 10 present the results of these yield models. Results from the plant densitymodels for each region can be found in Appendix 1.
Region 7. As in the cross-region model, the most important variables in the Region 7 model aretechnology-related. The use of fertilizer and improved seed (TECH1) and higher plant densities werestrongly correlated with higher yields (Table 8). Improved management practices alone (TECH2)also contributed to yield but had a much weaker effect than improved management combined withseed and fertilizer (sig.=0.1). Level of education was significant and negatively related to yield. Other key variables were related to the environment. Drought had a significant, negative impact onyield. Seventeen per cent of Region 7 farmers said they suffered significant production losses as aresult of drought. Farmers who reported high or medium soil fertility (88%) had significantly higheryields than those with less fertile maize plots. Termite damage negatively affected yields (significantat the .08 level); about one-fifth of Region 7 farmers said their production was badly damaged bytermites. The amount of planting labor used was negatively related to yields, but the relationship wasnot significant (.34).
Region 8. The yield models for Regions 7 and 8 are very similar, although the Region 8 model hasgreater explanatory power, accounting for 50% of yield variation compared to 30% in Region 7(Table 9). High plant density and use of improved fertilizer and seed inputs (TECH1) were again byfar the most important factors explaining higher yields. Improved management alone (TECH2) wasalso positively correlated with yield, but the relationship was much weaker (sig. = .14). Maize yields

15
from plots with medium or high soil fertility were significantly higher than on less fertile plots. Termite damage (reported in 18% of plots) had a negative impact on yield (sig.= .099). Educationlevels were again negatively correlated with yields (sig.=.1). Good rainfall distribution (reported by14% of farmers, with the remainder reporting average or poor distribution) was positively related toyields, but the level of significance was low (.16).
Region 10. The Region 10 yield model explained 60% of the variation in yield (Table 10). Unlikethe other models, improved seed and fertilizer use (TECH1) were not significant determinants ofyield in this model. High-input yields in this region (1.9 tons/ha) were also lower than improvedmanagement only yields (2.0 tons/ha), although the differences were not significant. One hypothesisis that the poor performance of seed and fertilizer technology in this region is related to the seriousdelay in input delivery and planting. Region 10 villages participating in the high-input program areremote, located in difficult terrain and served by few paved roads. High-input farmers receivedimproved seed and fertilizer during the last week of December and planted the first week of January,a full 4-6 weeks after improved management and control group farmers in the same areas planted(Table 7). Region 7 farmers also received inputs late, but planting by high-input farmers wasdelayed by just two weeks.
Environmental factors were the key determinants of yield in Region 10. Plots where production wasdamaged significantly by termites, wind, drought, or flooding or rats yielded significantly less thanplots with little damage. Flooding and wind were the major problems reported by farmers; 17%reported significant damage from wind and 13% from flooding. Maize planted in red soils yieldedsignificantly more than maize planted in black or white soils. Forty percent of Region 10 farmerssaid that they planted maize in red soils.
Program-related variables were also statistically significant determinants of yield, but were lessimportant than environmental factors. Higher plant densities were again associated with increasedyields, as was extension assistance for improved management only farmers (sig.= .08). Three-quarters of Region 10 farmers complained that rainfall distribution in 1997/98 was poor. The yieldmodel showed a positive correlation between yield and poor distribution but the relationship wassignificant only at the .11 level.
3.3. Summary
Several points emerge from the preceding analysis. First, average yields for sample farmers in allgroups -- high-input, improved management only and control -- exceeded average yields at theprovincial level reported for previous years by a wide margin. Our analysis of socioeconomiccharacteristics in the previous section indicated that sample farmers are not significantly better off interms of resources than average farmers in Nampula Province. The relatively high sample yields forfarmers using no improved inputs (compared to provincial averages) suggest that the sites includedmay have relatively better cropping conditions than other areas in the province. Therefore it will beimportant to use caution in generalizing from these findings to areas where agroecological conditionsare less favorable.

16
Second, an examination of average yields by region and technology type showed that yields fromhigh-input (improved seed, fertilizer, extension assistance) plots were significantly higher than yieldsfrom improved management plots (extension assistance only) only in one region -- Region 8. Despitethis apparent evidence of poor average performance from high-input technology, our econometricanalysis of yield determinants revealed a very strong and positive relationship between higher yieldsand the use of improved seed and fertilizer together with increased plant density. The results suggestthat high-input maize technology holds considerable potential for increasing yields, but theperformance of the improved input package may have been compromised by poor programimplementation in 1997/98. In two of three regions, improved seed and fertilizer were delivered late.Planting was subsequently delayed by 2-5 weeks.
The results also show that use of high-input technology is currently riskier (i.e., yields are less stable)than low-input or traditional methods. This is an especially important consideration if high-inputtechnology is extended to farmers in more marginal agroecological areas or with fewer householdresources for whom a yield loss in one season could be catastrophic.
Finally, the results of the yield analysis suggest several avenues for improving the performance ofhigh-input technology in Nampula Province. A key issue is how to assure that farmers receive inputson time so that the full benefits of the technology can be captured. The lack of a private rural inputsupply network and poor transportation infrastructure are major problems for MADR, SG2000 andother partners. These obstacles necessitate the virtual hand-delivery of inputs to farmers at greatdifficulty and cost. Options for accelerating the development of the input supply network will bediscussed in Section 5.
The analysis clearly shows that increasing plant density is critical to improving yields of high-inputmaize. While high-input program participants in our sample had significantly higher plant densitiesthan plots of improved management only or control groups, high-input densities were still well belowrecommended levels (30,808 plants/ha compared to the recommended level of 50,000 plants/ha). Further investigation is required to determine the cause for the differences and for the large variationin density across plots, e.g., unclear extension messages about seedbed preparation and plantingmethods, farmer lack of confidence in the recommendations for other reasons, or other disease andinsect problems. Some of the variability in yields and plant density may have resulted from themisapplication of seed and fertilizer provided by the MAP/SG program. We heard anecdotal reportsin the field, but have no hard evidence that sample farmers held back inputs or used them (in the caseof fertilizer) on other crops. Because extension agents (who were supervising the high-inputprogram) served as our survey enumerators it is unlikely that farmers would openly report suchdiscrepancies. In general, closer supervision by extension agents is needed to ensure that programinputs are correctly applied and other recommendations are understood and followed.
Seed and fertilizer recommendations in the high-input package were standard across the threeagroecological regions we examined, but our analysis suggests that differences between the threeagroecological regions – soil types, rainfall, altitude and other agroecological characteristics--contributed to significant differences in yield performance. Fine-tuning of seed and fertilizerrecommendations could help improve yields. Farmer responses also suggest the severity of local

17
problems with termites and rats, wind damage in higher-elevation areas and drought. More region-specific adaptive research is needed to identify specific solutions, e.g., recommendations on pesticideuse and ways to increase its availability at the local level, and on specific varieties that could betterwithstand wind and drought conditions.
Table 8. Regression Analysis of Factors Affecting Maize Yields -- Region 7Region 7 (Adj. R2=.3, F=4.956)
Variables Coef. SE Coef. Stdized Coeff. T Sig. T
Constant 6.879 .159 43.260 .000
TECH11=fertilizer+improved seed0=otherwise
.331 .108 .376 3.075 .003
PLANT DENSITYResidual from plant densityequation
.453 .121 .365 3.748 .000
EDUCgrade level completed
-.0535 .022 -.254 -2.482 .016
DROUGHT1=reported significantdamage from drought0=no or little damage
-.260 .132 -.226 -1.970 .053
SOILFERT1=high or medium fertility0=low
.294 .136 .219 2.163 .034
TERMITE1=reported significantdamage from termites0=no or little damage
-.239 .135 -.214 -1.772 .081
TECH21=improved practice/extension assistance0=otherwise
.192 .115 .205 1.671 .100
PLTLAHA number of adult-equivalentlabor days used for planting
-.0059 .006 -.099 -.968 .336
Source: Calculated from survey data

18
Table 9. Regression Analysis of Factors Affecting Maize Yields -- Region 8Region 8 (Adj. R2=.5, F=13.02)
Variables Coef. SE Coef. Stdized Coeff. T Sig. T
Constant 6.988 .170 41.07 .000
PLANT DENSITYResidual from plant densityequation
.655 .091 .557 7.199 .000
TECH11=fertilizer+improved seed0=otherwise
.455 .088 .497 5.156 .000
SOILFERT1=high or medium fertility0=low
.502 .160 .246 3.133 .002
TECH21=improved practice/extension assistance0=otherwise
.125 .084 .138 1.491 .140
TERMITE1=reported significantdamage from termites0=no or little damage
-.151 .090 -.133 -1.673 .099
EDUCgrade level completed
-.026 .016 -.133 -1.661 .101
RAINGD1=farmer reported goodrainfall distribution incurrent season0=average or poor rainfalldistribution
.144 .101 .116 1.425 .158
Source: Calculated from survey data

19
Table 10. Regression Analysis of Factors Affecting Maize Yields -- Region 10Region 10 (Adj. R2=.6, F=8.2)
Variables Coef. SE Coef. Stdized Coeff. T Sig. T
Constant 6.917 .206 33.630 .000
OTHERDAM1=reported significantdamage from termites,wind, drought, flood, or rats0=no or little damage
-.617 .161 -.486 -3.840 .001
REDSOIL1=if soil is red in color0=otherwise
.532 .151 .436 3.515 .002
PLANT DENSITYResidual from plant densityequation
.489 .182 .317 2.691 .013
TECH21=improved practice/extension assistance0=otherwise
.350 .193 .276 1.809 .083
RAINBAD1=farmer reported poorrainfall distribution incurrent season0=average or good rainfalldistribution
.278 .168 .205 1.658 .111
TECH11=fertilizer and improvedseed0=otherwise
.158 .203 .131 .776 .446
Source: Calculated from survey data

7During the 1997-98 crop and marketing season the average exchange rate was 1 USD = 12,000 meticais.
8September farmgate prices were based on prices received by CLUSA-assisted farmer associations in thethree regions; November prices were taken from Elanterna; January prices were estimated from Quente-Quenteprices reported for nearby regions. Because of low quantities of maize offered for sale in the sample regions noproducer prices were available for sample markets in Regions 7, 8 or 10 in this period.
20
4. FINANCIAL ANALYSIS
Section 3 presented yield results and analyzed the key factors contributing to yield differences acrossplots where farmers used different levels of inputs. These results demonstrated that the use ofimproved seed and fertilizer technology significantly increased maize yields in sample regions whereagroecological conditions were favorable and farmers received inputs and planted on time. Farmersusing improved technology also incur additional costs to obtain these yield increases, however. Additional costs include charges for the inputs themselves, interest, and the cost of additional laborthat may be required for fertilizer application, weeding and harvest. The analysis in this sectionconsiders whether gains from sale of improved maize compensate farmers for the costs of production,i.e., it is financially profitable for farmers to use improved technology on maize?
4.1. Data and Methods Used
The study used two measures, net income per hectare and net income per labor day, to evaluatefinancial profitability under different price and technology scenarios. A summary of key results fromthe maize financial budgets is presented in Table 11. Detailed budgets by agroecological region arepresented in Appendix 2. Financial results are reported by program type in Mozambican meticais(mt).7
Using plot-level data from the survey and additional secondary data, net income was calculated asfollows: (a) gross revenue was calculated by multiplying the crop yield per hectare by the farmgateprice8; and (b) costs of production reported by survey farmers or program administrators were thensubtracted from the gross revenue to obtain net income per hectare. These costs included the cost ofinputs such as seed, 12-24-12, and urea; interest costs on input loans if applicable; cash or the cashvalue of in-kind payments to non-family laborers working on the plot; and the depreciated value ofhand tools used in crop production and the cost of sacks used to transport the commodity to market.
In financial analysis no monetary value is imputed to family labor, but net income per day of familylabor is calculated by dividing the net income per hectare by the number of (family) adult equivalentdays used during crop production and harvest. Net income per day of family labor can be comparedto area wage rates (which approximate the opportunity cost of labor) to assess the relativeattractiveness of the technology at different yield and price levels.
We calculated net income under several different price scenarios, assuming that farmers harvesting inJune-July 1998 sold their crop in (a) September 1998, (b) November 1998, and (c) January 1999, to

9 Maize storage losses were assumed to be 2% per month, the average of various estimates from Abrahamet al. 1993.
21
assess potential gains from storage. In each case crop yields were adjusted to reflect storage losses9
and interest charges according to the length of the loan period. Gross revenue was also adjusted toreflect the opportunity costs associated with selling at different times of the year. Actual maize pricesrose throughout 1998, but this will not hold true each year. For example, following a sizableincrease in maize area and production in the 1998/99 season, traders offered northern Mozambicanfarmers 500 mt/kg in September 1999 (Noticias 8/28/99), 50% less than in September 1998. Netincome per hectare was also calculated for hypothetical drops in output price of 25% and 50% fromthe September 1998 values. Two additional scenarios were calculated in which it was assumed thatfarmers selling in November 1998 or January 1999 were able to decrease their storage losses by halfthrough the use of storage insecticide. Finally, net income was calculated under the assumption thathigh-input farmers did not repay their input loans.
A review of the budget presented in Table 11 leads to five key conclusions about maize profitability. These are presented below in Sections 4.2 through 4.6.
4.2. Using the Complete High-Input Seed and Fertilizer Package is Financially Risky
Using improved seed and fertilizer at the recommended rates was less profitable than using improvedor traditional management practices without improved seed and fertilizer, if farmers sold their maizein September shortly after harvest, the most common practice. Net income/ha and per labor day werehighest for improved management only groups in all three regions. Returns for high-input andcontrol group maize were positive in Regions 8 and 10, but the use of improved seed and fertilizertechnology was risky in Region 7 (Ribaue), where yields were much lower (1.3 tons/ha compared to2.7 tons/ha in Region 8 and 1.9 tons/ha in Region 10). In Region 7 farmers lost money on high-inputmaize plots if they sold maize in September.
High-input farmers in both Regions 7 and 10 were vulnerable to losses if September prices droppedby 25%, and high-input farmers in all regions lost money if September prices declined by 50%. Losses ranged from (negative) 185,266 mt in Region 8 to (negative) 759,108 mt in Region 7. Table12 shows break-even producer prices by technology type and region. Prices range from 60 to 325mt/kg for improved management only and control group maize, far below the high-input break-evenprice, which exceeded 500 mt/kg in all regions. High-input prices ranged from 595 mt/kg in Region8 to 935 mt/kg in Region 10 to 1,110 mt/kg in Region 7.
Median daily wage rates reported by our sample farmers ranged from 12,381 mt/day in Region 7(Ribaue) to 16,667 mt/day in Regions 8 (Monapo/Meconta) and 10 (Malema). When maize was soldin September, returns to family and mutual labor were generally lower than the median wage rate. The exception was Region 7, where returns per day for improved management only maize were13,686 mt. If September prices fall by 25%, returns per day are negative in Regions 7 (-6,781 mt)

Table 11: Summary of Results from Farm-Level Maize Enterprise BudgetsRegion 7 -- Ribaue District Region 8 -- Monapo/Meconta Districts Region 10 -- Malema District
Hi Input ImprovedManagementOnly
ControlGroup
Hi Input ImprovedManagementOnly
ControlGroup
Hi Input ImprovedManagementOnly
ControlGroup
Maize grain yielda (tons/ha) 1.3 1.3 1.1 2.7 2.0 1.7 1.9 2.0 1.21. September 1998 pricesSeptember price (mt/kg) 1,050 1,050 1,050 1,050 1,050 1,050 1,050 1,050 1,050Net income (mt/ha) (68,134) 1,272,828 1.030,941 1,204,399 1,660,743 1,434,016 214,509 1,399,380 1,210,142Net income/labor day (mt/day) (1,117) 13,686 9,458 16,059 10,315 7,628 4,564 12,957 10,4322a. November 1998 pricesNovember price (mt/kg) 1,714 1,714 1,714 1,520 1,520 1,520 1,714 1,714 1,714Net income (mt/ha) 667,211 2,010,923 1,637,274 2,204,760 2,400,548 2,090,409 1,245,762 2,488,099 1,906,364Net income/labor day (mt/day) 10,938 21,623 15,021 29,397 14,910 11,119 26,506 23,038 16,4342b. November 1998 prices/storage insecticide usedNet income (mt/ha) 704,017 2,047,153 1,667,036 2,263,530 2,443,390 2,128,422Net income/labor day (mt/day) 11,541 22,012 15,294 30,180 15,176 11,3213a. January 1999 pricesJanuary price (est.) (mt/kg) 2,100 2,100 2,100 2,100 2,100 2,100 2,100 2,100 2,100Net income (mt/ha) 985,418 2,352,652 1,917,998 3,367,180 3,269,044 2,860,985 1,700,971 2,992,906 2,228,308Net income/labor day (mt/day) 16,154 25,297 17,596 44,896 20,305 15,218 36,191 27,712 19,2103b. January 1999 prices/storage insecticide usedNet income (mt/ha) 1,087,231 2,452,805 2,001,104 3,573,490 3,417,817 2,993,118 1,843,059 3,139,634 2,323,833Net income/labor day (mt/day) 17,824 26,374 18,359 47,647 21,229 15,921 39,214 29,071 20,0334. If credit is not repaid (Sept.)Net income (mt/ha) 1,263,566 2,536,099 1,546,209Net income/labor day (mt/day) 20,714 33,815 32,898
Source: Survey data, CLUSA and SIMA reports (for price data)

23
and 10 (5,588 mt), and are negative for all regions if prices drop by 50%, ranging from -2,470(Region 8), to -12,444 (Region 7) and -15,939 in Region 10.
4.2.1. Region 7 (Ribaue)
In Region 7, net returns per hectare and per labor day were highest for the improved managementonly group under all price scenarios (Table 11). At September 1998 output prices, high-inputfarmers lost an average of 68,134 mt/ha. Maize yields were not significantly greater than thoseof low-input maize, and revenue from crop sales was insufficient to cover the costs of improvedseed and fertilizer. Net income was positive for the other plot types, 1.3 million mt/ha for theimproved management only group, and 1.0 million mt/ha for the control group . Returns per laborday ranged from a loss of 1,117 mt/day for the high-input group to positive returns of 13,686mt/day for the improved management group and 9,458 mt/day for the control group.
If September producer prices decline by 25% and 50%, losses incurred by high-input farmers are-413,621 and -759,108 mt/ha, respectively. Returns are lower but still positive for the othergroups. With a 25% price drop, net income per hectare ranges from 751,568 mt/ha for controlplots to 932,744 mt/ha for improved management plots. Returns per day fall below the mediandaily wage rate for all groups, ranging from losses of 6,781 mt/day (high-input) to gains of 6,895mt/day for improved management only farmers and 10,030 mt/day for the control group. Whenprices decline by 50%, returns per hectare fall to 592,659 mt (improved management only) and472,194 mt (control).
4.2.2. Region 8 (Monapo/Meconta)
At actual September 1998 prices, maize production was profitable for all three technology typesin Region 8, but returns were highest for the improved management group (Table 11). Netincome per hectare for improved management plots was 1.7 million mt, 38% higher than returnsfrom high-input maize (1.2 million mt) and 16% higher than control plot returns (1.4 million mt). Returns per labor day were lower than median wage rates of 16,667 mt/day for all groups butwere greatest for the high-input plots (see Section 4.5. for further discussion). Returns per laborday were 7,628 mt for the control group, 10,315 mt for improved management only plots and16,059 for high-input farmers.
If producer prices drop by 25%, returns per hectare and per labor day drop but maize productionremains profitable for all three technology types. Net income per hectare is 1.2 million mt forimproved management plots, 127% greater than high-input returns (509,567 mt) and 17% morethan returns from control plots (984,600 mt). High-input farmers will lose 185,266 mt/ha ifSeptember producer prices decline by 50%. Returns remain positive for the other groups, 535,185mt/ha for control plots and 647,693 mt/ha for improved management only farmers.
4.2.3. Region 10 (Malema)
In Region 10 (Malema), net income per hectare from improved management only plots was 1.4million mt at actual September prices, more than five times greater than returns from high-input

24
plots (214,509 mt/ha) and 16% more than returns for the control group (1.2 million mt/ha) (Table11). Returns per labor day were below the average daily wage rate of 16,667 mt/day, rangingfrom 4,564 mt/day (high-input plots) to 12,957 mt/day for improved management only maize.
If prices fall by 25%, high-input farmers lose 267,320 mt/ha, but maize production remainsprofitable for other groups, 897,743 mt/ha for improved management plots and 889,351 mt/ha forthe control group. With a price decline of 50%, high-input losses are -749,150 per hectare,compared to profits of 396,105 mt/ha for improved management plots and 568,561 mt/ha for thecontrol group.
4.3. Gains from Storage
Producer prices rose by 63% between September and November in Regions 7 (Ribaue) and 10(Malema) and by 45% in Region 8 (Monapo/Meconta). Between September and January pricesdoubled in all regions. Our analysis suggests that in 1997/98 farmers could have increased netincome significantly by holding their maize for sale later in the season, even after accounting forstorage losses and additional interest charges.
4.3.1. Gains from Sale in November and January
If farmers stored maize for sale in November, net income/ha for the improved management onlygroup was still higher than returns from other groups across all regions, but in Region 7 high-input farmers achieved profits of 667,211 mt/ha (compared to losses of 68,134 with Septembersales) (Table 11). Returns to Region 7 improved management and control groups were 58%higher than September returns. In Region 8 (Monapo/Meconta), November returns to high-inputmaize were 83% higher than in September, and net income/ha from improved management andcontrol plots was 45% higher. Returns from high-input plots in Region 10 were almost 5 timesgreater in November than September, and returns from improved management and control plotswere 58-78% higher in November.
Gains were even higher if farmers waited to sell maize in January (Table 11). When sold atJanuary prices high-input maize became the most profitable group in Region 8(Monapo/Meconta). In Regions 7 and 10, improved management maize remained more profitablethan high-input or control plots. Net income per hectare for Region 7 high-input farmers sellingin January was 48% higher than November returns; net income from improved management andcontrol plots was 17% higher than November and 85% higher than September returns. In Region8, gains from high-input maize sold in January exceeded November returns by 53% andSeptember returns by 180%. Improved management and control group returns were 36% higherthan in November and double those of September.
Gains to storage and sales in January were also impressive in Region 10. Returns from high-inputplots were 37% and 693% higher than November and September returns respectively. Improvedmanagement net income/ha in January was 20% higher than November and 114% higher thanSeptember. Control group farmers who sold in January achieved profits that were 17% higherthan November and 84% higher than September levels.

10This is a conservative estimate. Recent research suggests that the application of storage insecticidecan reduce storage losses to 2-13% of grain weight over a 5-9 month period (Abraham et al. 1993).
25
4.3.2. Potential Gains from Use of Storage Insecticide
None of the sample farmers used storage insecticide following the 1997/98 production year, butour results indicate that income gains from pesticide use (through reducing the amount of maizelost to storage pests) would be substantial in all regions (Table 11). If farmers used insecticideand storage losses were reduced by half10, net income per hectare for maize sold in Novemberwould increase by a further 2-6% over November net income/ha without storage insecticide, afterpesticide costs are deducted. Farmers who used storage insecticide and sold maize in Januarycould increase net incomes by 4-10% over returns when no insecticide is used.
4.4. Improved Seed and Fertilizer Represent 68-80% of Total Production Costs
Improved seed and fertilizer are by far the biggest cost component in the financial enterprisebudgets. Purchased seed and fertilizer make up 68-80% of total maize production costs (exclusiveof family labor) in the three regions. This suggests that even small reductions in the farmgate costof fertilizer and seed (e.g., by reducing transport and other marketing costs) could significantlyincrease farm profits. The input cost reduction does not change the relative ranking of profits forthe three technology groups, i.e., in most cases low-input maize is still the most profitable option. However, reducing seed and fertilizer costs by 25% would more than double net income/ha forhigh-input farmers in Regions 7 and 10 selling in September. Net income/ha for high-inputfarmers in Region 8 would rise by 28%. If farmers wait until January 1999 to sell, reducing seedand fertilizer costs by 25% results in a 35% increase in net income/ha for Region 7 high-inputfarmers and 10% and 20% increases for Region 8 and 10 high-input farmers, respectively.
4.5. Labor Use and Management
In earlier sections we discussed the probable yield impact of the delay in input delivery andplanting in two of the three regions. In addition to this problem, our analysis of labor data for thethree technology types (summarized in Table 13) suggests that farmers participating in the high-input program may have managed these plots less carefully than low-input and non-programplots. Total labor use results are highly variable and must be interpreted with caution since thelabor data is based on end-of-season recall. However, in all three zones high-input participantsappeared to use substantially fewer labor days/ha -- 39-55% fewer -- than low-input or non-program participants. This result is surprising since it is normally assumed that adoption of high-input technology requires additional labor for planting in rows, fertilizer application and weeding.
We do not have data on the reasons why farmers apparently devoted less labor to the high-inputplots. One possibility is that farmers believed that yields had already been significantlycompromised by the late input delivery and planting and held back resources as a result. Farmersmay also have used improved seed and fertilizer as a substitute for labor -- assuming that theycould achieve a target yield (not necessarily the maximum yield) by using the improved inputs

26
alone -- and transferred labor resources to other crops. As discussed earlier, we also heardanecdotal reports that some farmers used less than the recommended dose of fertilizer on high-input maize and diverted fertilizer to other crops.
Table 14 shows the performance of the high-input package under optimal conditions -- in thiscase, the results from Region 8's highest yield tercile -- where input delivery and planting weretimely and agroecological conditions and crop management were good. Under these conditionsyields of high-input maize (4.1 tons/ha) are significantly higher than low-input (2.8 tons/ha) ornon-participant plots (2.5 tons/ha). These results should be interpreted with caution because of thesmall sample size, but the profitability analysis suggests that at these higher yield levels high-input maize is as profitable as improved management only or control group maize if sold inSeptember, and high-input maize is the most profitable of the three groups if maize is sold inNovember or January. Net income per hectare from high-input plots is 17-23% higher thanimproved management or control returns in November, and 25-33% higher in January.
4.6. Credit Repayment
It is also possible that farmer expectations about credit repayment had an adverse effect on cropmanagement. In 1996/97 few DNER/SG high-input program participants actually repaid seed andfertilizer credit regardless of their yields (Howard et al. 1998). Given this experience, 1997/98high-input participants may not have anticipated having to repay the credit either. Informalinterviews revealed that very few farmers had repaid credit from the 1997/98 season as of March1999 or felt that they would be expected to repay credit in the future. As a result farmers mayhave been less careful about agronomic practices such as timely and adequate weeding of plotsthat could have increased yields.
If high-input farmers did not expect to repay their loans, our analysis suggests that the reducedmanagement strategy was rational. If credit was not repaid, net income/ha for high-input maizewas roughly equivalent to low-input earnings in Region 7, and 10-77% higher than net income/hafor low-input and non-participant plots in Regions 8 and 10, when maize was sold in September(Table 11). In all regions, net income per labor day for high-input plots (when credit was notrepaid) was much higher -- in most cases twice or three times -- that for low-input and non-program maize, and almost double the median wage rate in each region.

27
Table 12: Break-even Maize Producer Prices Region 7 -- Ribaue District Region 8 -- Monapo/Meconta Districts Region 10 -- Malema District
Hi-InputMaize
Lo-InputMaize
Non-participant
Hi-InputMaize
Lo-InputMaize
Non-participant
Hi-InputMaize
Lo-InputMaize
Non-participant
Maize grain yield (tons/ha) 1.3 1.3 1.1 2.7 2.0 1.7 1.9 2.0 1.2Break-even price (mt/kg) 1,100 70 85 595 190 215 935 325 60
Source: Survey data
Table 13: Total Family, Mutual and Wage Labor Days Used in Maize ProductionRegion 7 -- Ribaue District Region 8 -- Monapo/Meconta Districts Region 10 -- Malema District
Hi-InputMaize
Lo-InputMaize
Non-participant
Hi-InputMaize
Lo-InputMaize
Non-participant
Hi-InputMaize
Lo-InputMaize
Non-participant
Total adult-equivalent days 62 93 109 84 171 197 71 142 116Source: Survey data

28
Table 14. Results Under Optimal ConditionsRegion 8 -- Monapo/Meconta Districts
Results from Region 8 HighestYield Terciles
Hi-InputMaize
Lo-InputMaize
Non-participant
n 11 11 10Maize grain yield (kg/ha) 4.1 2.8 2.51. September 1998 priceSeptember price (mt/kg) 1,050 1,050 1,050Net income (mt/ha) 2,583,282 2,479,534 2,400,687Net income/day (mt) 30,753 15,595 12,0642. November 1998 priceNovember price (mt/kg) 1,520 1,520 1,520Net income (mt/ha) 4,116,047 3,516,914 3,338,124Net income/day (mt) 49,001 22,119 16,7753. January 1999 priceJanuary price (mt/kg) 2,100 2,100 2,100Net income (mt/ha) 5,903,484 4,734,749 4,438,630Net income/day (mt) 70,280 29,778 22,305
4.7. Summary
The analysis in Section 3 suggested that farmers can significantly increase maize yields throughthe application of the recommended improved seed and fertilizer package, if inputs are deliveredon time and crop management recommendations are followed. The results of the financialanalysis in Section 4 are more sobering. Under the conditions faced by smallholder farmers in1997/98 (including uncertainty about weather conditions, the timing of input delivery andcommodity prices), the analysis indicates that in most scenarios (sales in September, shortly afterharvest, or in November or January) the yield gains did not compensate for the high cost of theinputs, if net income/ha is used as the measure of profitability. Farmers achieved higher returns(net income/ha) when they used only improved management techniques without purchased seedor fertilizer. Only in Region 8 (Monapo/Meconta), where inputs were delivered on time andweather conditions were good, did the profitability of the high-input package exceed that ofimproved management alone, and then only if farmers waited until January to sell maize(benefitting from a price rise of 100% between September 1997 and January 1998).
We use two measures of profitability in the analysis, net income/ha (discussed above) and netincome per day of family labor. The latter can be compared to area wage rates (whichapproximate the opportunity cost of labor) to assess the relative attractiveness of technology atdifferent yield and price levels. For reasons that are not clear, farmers in the high-input groupreported fewer adult-equivalent days of labor than farmers in the other groups, although normallythe application of fertilizer and planting seeds in rows is assumed to require more labor. If thelabor data are correct, however, use of the high-input package becomes more attractive using thenet income/labor day as an indicator of profitability. The high-input package becomes the mostprofitable (using net income/labor day) alternative in Regions 8 and 10, when maize is held forsale in November or January. More research is required to determine if the labor data provided inthe end-of-season recall accurately reflects actual labor inputs by sample farmers.
The results of the financial analysis also suggest that all farmers – regardless of the technologypackage used – can potentially benefit from gains to storage and later sale of maize, especially

29
when insecticide is used to reduce grain losses to storage pests. Gains from storage are notassured, however. In 1997/98 seasonal price rises were impressive, but in 1998/99 (and into the2000 marketing season) because of increased production in Mozambique and the southern Africaregion generally prices increased very little through the season.
We hypothesize that the lack of clarity regarding whether input credit would have to be repaid,combined with the late delivery of inputs in two of the three regions, may have compromised thetechnical performance of the improved seed and fertilizer, and reduced farmer incentives tomanage their plots – especially weeding – as well as they might have. Even under optimalconditions, however, (the highest yield tercile of Region 8 high-input farmers, who receivedinputs on time and presumably used good management techniques) net income/ha from the high-input maize package was not significantly different from returns from the other technology groupswhen maize is sold in September, the most common practice. Profitability (net returns/ha) forhigh-input maize is significantly higher than the other groups only when farmers hold maize forsale in November and January, and there is a substantial commodity price rise in that period.
The main conclusion that we draw from the financial analysis is that the use of improvedtechnology on maize can be profitable, but the level of risk and uncertainty surrounding use ofimproved maize technology, and the cost of supplying improved seed and fertilizer, are currentlyvery high. In the final section, we identify the main areas of risk and uncertainty for smallholderfarmers and for input suppliers, and discuss possible strategies for reducing risk, uncertainty, andthe cost of supplying inputs. We also identify areas where additional research is needed.

30
5. CONCLUSIONS
Our analysis suggests that there is considerable potential for improved seed and fertilizertechnology to increase maize yields in northern Mozambique. However, under the conditionsfaced by smallholder farmers – including uncertainty about the weather, timing of input delivery,and commodity prices, and the high cost of the inputs themselves – the analysis shows that it isfinancially risky for smallholders to adopt the full package of seed and fertilizer recommendations(30 kg of improved open-pollinated variety seed, 100 kg 12-24-12, and 100 kg urea per hectare).In 1997/98 the yield increases generated through the use of the technology package generally didnot compensate for the high cost of the inputs given the prevailing output prices.
Sample farmers using improved management techniques only (without purchased inputs)achieved higher profits than farmers using either the high-input package or traditional techniques(no purchased inputs) in most regions and scenarios examined (sales in September, November,and January). An exception was Region 8, where good weather conditions and timely inputdelivery contributed to high maize yields. Even in Region 8, however, net income/ha for high-input users was higher only when farmers stored maize for sale in January, taking advantage ofthe doubling of maize prices between September 1998 and January 1999. Although significantmaize price rises occurred following the 1996/97 and 1997/98 production seasons, farmers cannotrely on them: e.g., maize prices have remained flat following the 1998/99 season due to higherproduction in southern Africa.
The results of this analysis suggest the need for policy and program actions, and further research,to reduce (1) the risks and uncertainty of input use at the farm level, and (2) the cost of inputsupply, to allow Mozambican smallholders to benefit from technological improvements that canpotentially increase yields, food security and incomes. Potential actions and research include:
Reducing production risk by fine-tuning agronomic recommendations. There weresignificant differences in yield response between the three agroecological regions studied. Because a large part of the differences may be attributable to variations in altitude, rainfall, andsoils, this suggests the need for fine-tuning the blanket country-wide agronomicrecommendations. Some researchers have already begun to modify recommendations (EstacaoAgraria and Extensao Rural/Nampula 1999; Penninkhoff, Augusto and Anman 1999), but a muchmore aggressive approach is needed, including high-level support from national and provincialresearch and extension directors. Institutional incentives are required to motivate researchers andextensionists to modify technology recommendations for specific areas by synthesizing the resultsfrom on-station and on-farm trials, including INIA’s national geographically-referenced databaseon soil quality and response to fertilizer.
Focusing more adaptive research and extension effort on solving problems that seriouslyaffect maize yield. Our analysis indicates that plant density -- in conjunction with improved seedand fertilizer use-- is the most important determinant of maize yield. Our results revealed veryhigh levels of variation in plant density among high-input farmers. The recommended plantdensity level was 50,000 plants per hectare, yet our high-input farmers registered densities of26,000-33,000 plants per hectare. Closer extension supervision at planting time may be required,but adaptive research is also needed to help solve other problems identified by farmers. Forexample, many farmers reported that termite attacks significantly reduced plant population. Otherproblems noted were related to weather and seed supply. Many farmers reported that they lost

31
seedlings because of an unexpected break in rains occurring soon after emergence. When farmersplant local seed they can easily replant these areas, but improved seed supplies are usually verylimited. After farmers plant a field once, it is difficult to find replacement seed locally or, in thecase of 1997/98, even at the provincial level. Our region-specific data indicate that farmer-reported drought had a significant impact on yields in Regions 7 and 10, which had poorer maizeyields. This result suggest a need for better agronomic and supply strategies to deal with drought– perhaps different planting times (these were areas where farmer received and planted improvedseed late), or shorter-season varieties that can be planted later after the main rains have begun.
Adjusting agronomic recommendations according to farmers’ ability to bear risk. Recommendations, particularly for expensive inputs such as commercial fertilizer, may also needto be adjusted on the basis of farmers’ capacity to bear risk. For example, farmers who have morethan one commercial crop, e.g., cotton and maize, may have a higher risk threshold. In the eventof a poor return on one crop (maize), maize input loans can be paid off with returns from cotton. More research needs to be carried out to understand how farmers perceive risks and theattractiveness of alternative investments within the farming system, but preliminary resultssuggest the need for recommendations geared not only to agroecological differences but tovariations in farmers’ ability to spread risk among different crops in the farming system or amongdifferent on- and off-farm enterprises.
Improving research and extension on the costs, returns and risks of alternative technologiesin a cropping systems context. Through the efforts of the Cooperative League of the USA(CLUSA) and other NGOs, farmers in Nampula Province are becoming more aware of thepotential costs and returns from alternative commercial crops, e.g., cotton, maize, sunflower,sesame, pigeon pea-- and the importance of analyzing these during pre-season planning. Researchers and extensionists can contribute significantly to this discussion, by (1) collecting dataon labor inputs and carrying out financial analysis of trials (especially on-farm trials) of newtechnology and crop management techniques; (2) making information on yield and profitabilityavailable to farmers in an easy-to-understand extension bulletin format; (3) DNER, DAP andSIMA (Market Information System) collaboration to assess and extend information about theprice risk associated with alternative commodities; and (4) improving research and extension onalternative crops and technologies in a cropping systems context. For example, cropping systems-based research can help answer questions such as (a) what rotations should be planned to maintainsoil fertility? (b) what combinations of commercial and subsistence crops, and technologies,should be considered in specific agroecological zones to meet the objectives and risk-carryingcapacity of different types of farmers?
Reducing the cost of input supply. Our analysis showed that the cost of improved seed andfertilizer represented 68-80% of production costs (exclusive of family labor) for sample farmers. Reducing costs at strategic points in the input sector will clearly improve the farm-levelprofitability of improved technology. The research activity described in this paper did not focuson the impact of government and donor policies and programs on input supply, but these arediscussed at length in a recent DAP study on constraints and strategies for the development of theMozambican inputs sector (2000). Key recommendations include (a) investments to reducetransport costs, including road, rail and shipping infrastructure, and incentives to the privatesector to expand and maintain rural transport fleets; (b) government withdrawal from managementof the KRII program for supply of fertilizer, pesticides and machinery; (c) reduction of policybarriers to the regional trade in inputs by the private sector, and research to explore the possibility

32
of reducing shipping and transport costs through bulk ordering of fertilizer with partners inneighboring countries; (d) expansion of programs to train input dealers in rural areas; and (e)programs to supply improved seed varieties to remote, less commercially developed areas ofMozambique.
Farmer associations are increasingly active in Nampula Province and present one of the mostpromising avenues for lowering input and output marketing costs. Farmer associations canpotentially lower the private sector costs of input supply and credit recovery, and increaseextension effectiveness, by (a) aggregating input demand from scattered rural villages; (b)organizing local delivery of inputs to member villages after inputs are delivered by the supplier toa central location; (c) providing group guarantees for input loans; and (d) organizing extensionassistance on a group basis. During the 1998/99 season, for the first time, 21 farmer associationsparticipated in the DNER/SG intensive maize program. Research is underway to assess theimpact of these farmer associations on program implementation, and on input and outputmarketing costs. Preliminary results will be reported in early 2000.

33
APPENDIX 1: YIELD DETERMINANTS MODELS

34
Table 15. Regression Analysis of Factors Affecting Plant Density -- Regions 7,8,10All Zones (Adj. R2=.34, F=11.538)a
Variables Coef. SE Coef. Stdized Coeff. T Sig. T
Constant 9.506 .153 62.000 .000
TECH11=fertilizer, improved seed0=otherwise
.680 .079 .676 8.568 .000
TECH21=improved practices0=otherwise
.116 .076 .112 1.512 .132
REGION 81=Region 80=otherwise
.108 .069 .109 1.559 .121
PLTLAHA number of adult-equivalentlabor days used for planting
-.0043 .003 .090 1.422 .157
OTHERDAM1=reported significantdamage from termites,wind,drought,flood,or rats0=no or little damage
-.061 .066 -.058 -.918 .360
SOILFERT1=high or medium fertility0=low
.0756 .113 .042 .666 .506
WKPLANTweek of planting; 1=4th week October2=1st week November etc.
-.0055 .012 -.030 -.457 .648
EDUCgrade level completed
-.0043 .013 -.021 -.324 .746
REGION 101=Region 100=otherwise
-.00566 .092 -.004 -.062 .951
Source: Survey data

35
Table 16. Regression Analysis of Factors Affecting Plant Density -- Region 7Region 7 (Adj. R2=.48, F=10.85)
Variables Coef. SE Coef. Stdized Coeff. T Sig. T
Constant 9.596 .161 59.641 .000
TECH11=fertilizer, improved seed0=otherwise
.834 .109 .805 7.649 .000
TERMITE1=reported significantdamage from termites0=no or little damage
-.189 .137 -.143 -1.381 .172
TECH21=improved practices0=otherwise
.155 .116 .141 1.334 .187
DROUGHT1=reported significant damage from drought0=no or little damage
-.142 .133 -.105 -1.060 .293
PLTLAHA number of adult-equivalentlabor days used for planting
-.0073 .006 -.104 -1.180 .242
EDUCgrade level completed
-.0151 .022 -.061 -.689 .493
SOILFERT1=high or medium fertility0=low
.0233 .137 .015 .170 .866
Source: Survey data

36
Table 17. Regression Analysis of Factors Affecting Plant Density -- Region 8Region 8(Adj. R2=.34, F=7.98)
Variables Coef. SE Coef. Stdized Coeff. T Sig. T
Constant 9.227 .213 43.296 .000
TECH11=fertilizer, improved seed0=otherwise
.623 .110 .629 5.642 .000
SOILFERT1=high or medium fertility0=low
.507 .201 .229 2.528 .014
RAINGD1=reported good rainfalldistribution in currentseason0=average or poor rainfalldistribution
.159 .127 .118 1.254 .214
TECH21=improved practices0=otherwise
.043 .105 .044 .410 .683
EDUCgrade level completed
-.0027 .019 -.013 -.138 .890
TERMITE1=reported significantdamage from termites0=no or little damage
.0028 .113 .002 .025 .980
Source: Calculated from MAP/MSU survey data

37
Table 18. Regression Analysis of Factors Affecting Plant Density -- Region 10Region 10(Adj. R2=.2, F=2.45)
Variables Coef. SE Coef. Stdized Coeff. T Sig. T
Constant 9.902 .231 42.872 .000
TECH11=fertilizer+improved seed0=otherwise
.641 .228 .667 2.807 .010
RAINBAD1=farmer reported poorrainfall distribution incurrent season0=average or good rainfalldistribution
-.338 .188 -.314 -1.795 .085
REDSOIL1=if soil is red in color0=otherwise
-.239 .170 -.246 -1.403 .173
TECH21=improvedpractice/extensionassistance0=otherwise
.203 .217 .201 .934 .360
OTHERDAM1=reported significantdamage from termites,wind, drought, flood, or rats0=no or little damage
-.086 .180 -.085 -.476 .639
Source: Survey data

38
APPENDIX 2: FARM-LEVEL FINANCIAL BUDGETS

Table 19. Summary of Farm Level Enterprise Budget for Region 7 (Ribaue), by Technology Type
Plot Type/ (A) Hi-Input (B) Improved Management Only (C) Control Group
Budget Item
(terciles) 1 2 3 mean 1 2 3 mean 1 2 3 mean
n used in calculations 11 12 11 34 9 9 9 27 7 7 7 21
1. GRAIN YIELD (kg/ha) 1 626 1,268 2,140 1,343 781 1,152 2,035 1,322 698 1,041 1,517 1,086
1. A. Sept. 1998 adjusted yield (kg/ha) 2 614 1,243 2,097 1,316 765 1,129 1,994 1,296 684 1,020 1,487 1,064
1.B. Nov. 1998 adjusted yield 589 1,193 2,014 1,264 735 1,084 1,915 1,244 657 980 1,428 1,022
1.C. Nov. 1998 adj. yield if storage lossesdecline by 50% 607 1,230 2,076 1,303 758 1,118 1,975 1,283 677 1,010 1,472 1,054
1.D. Jan. 1999 adjusted yield 566 1,146 1,934 1,214 706 1,041 1,839 1,195 631 941 1,371 982
1.E. Jan. 1999 adj. yield ifstorage losses decline by 50% 595 1,206 2,035 1,277 743 1,096 1,935 1,257 664 990 1,443 1,033
2. EST. FARMGATE PRICE 3 2.A. Sept. 1998 1,050 1,050 1,050 1,050 1,050 1,050 1,050 1,050 1,050 1,050 1,050 1,050
2.B. Nov. 1998 1,714 1,714 1,714 1,714 1,714 1,714 1,714 1,714 1,714 1,714 1,714 1,714
2.C. Jan. 1999 2,100 2,100 2,100 2,100 2,100 2,100 2,100 2,100 2,100 2,100 2,100 2,100
3. GROSS REVENUE4
3.A. Sept. 1998 sale 644,154 1,304,772 2,202,060 1,381,947 803,649 1,185,408 2,094,015 1,360,338 718,242 1,071,189 1,560,993 1,117,494
3.B. Nov. 1998 sale 993,354 2,012,718 3,396,859 2,131,767 1,239,695 1,828,590 3,230,191 2,098,433 1,107,947 1,652,397 2,407,960 1,723,827
3.C. Nov. 1998 sale if storage losses declineby 50% 1,024,726 2,075,643 3,503,057 2,198,414 1,278,452 1,885,758 3,331,178 2,164,038 1,142,586 1,704,057 2,483,242 1,777,720
3.D. Jan. 1999 sale 1,155,809 2,340,488 3,950,035 2,478,924 1,441,578 2,126,374 3,756,225 2,440,162 1,288,376 1,921,489 2,800,095 2,004,551
3.E. Jan. 1999 sale if storagelosses decline by 50% 1,216,349 2,465,450 4,160,171 2,610,578 1,518,940 2,240,593 3,955,731 2,569,690 1,357,436 2,023,871 2,949,963 2,111,788
4. TOTAL PACKAGE COSTS 5 1,158,000 1,158,000 1,158,000 1,158,000 23,122 37,130 15,800 23,700 26,070 14,220 45,030 16,590
4.A. Seed (mt/ha) 198,000 198,000 198,000 198,000 23,122 37,130 15,800 23,700 26,070 14,220 45,030 16,590
4.B. 12-24-12 and Urea Fertilizers 960,000 960,000 960,000 960,000 0 0 0 0 0 0 0 0
5. INTEREST 6
5.A. Sept. 1998 173,700 173,700 173,700 173,700 0 0 0 0 0 0 0 0
5.B. Nov. 1998 188,175 188,175 188,175 188,175
5.C. Jan. 1999 217,125 217,125 217,125 217,125
6. LABOR
6.A. Total family/mutual labor (days/ha) 7 41 73 67 61 94 94 79 93 139 61 123 109
6.B. Total wage labor (mt/ha) 8 158,546 14,185 93,955 86,698 39,272 21,343 0 20,205 2,143 28,571 0 10,238
7. HAND TOOLS AND SACKS (mt/ha) 29,437 30,762 38,020 31,683 48,919 48,704 45,050 43,605 46,667 47,990 90,161 59,725

7.A. Hand tools (mt/ha)9 20,716 18,972 18,459 19,313 33,406 29,549 22,410 26,250 35,000 29,149 52,500 38,313
7.B. Sacks (mt/ha)10 8,721 11,790 19,561 12,370 15,513 19,155 22,640 17,355 11,667 18,841 37,661 21,412
8. NET INCOME/HA 11
8.A. Sept. 1998 sale (875,529) (71,875) 738,385 (68,134) 692,336 1,078,231 2,033,165 1,272,828 643,362 980,408 1,425,802 1,030,941
8.B. Nov. 1998 sale (540,804) 621,596 1,918,709 667,211 1,128,382 1,721,413 3,169,341 2,010,923 1,033,067 1,561,616 2,272,769 1,637,274
8.C. Nov. 1998 sale if storage losses declineby 50% (523,342) 656,346 1,977,356 704,017 1,149,785 1,752,984 3,225,110 2,047,153 1,052,196 1,590,145 2,314,343 1,667,036
8.D. Jan. 1999 sale (407,299) 920,416 2,442,935 985,418 1,330,265 2,019,197 3,695,375 2,352,652 1,213,496 1,830,708 2,664,904 1,917,998
8.E. Jan. 1999 sale if storagelosses decline by 50% (360,669) 1,017,203 2,605,520 1,087,231 1,390,273 2,107,819 3,849,663 2,452,805 1,267,046 1,909,959 2,781,064 2,001,104
9. NET INCOME/FAMILY-MUTUALLABOR DAY12
9.A. Sept. 1998 sale (21,354) (985) 11,021 (1,117) 7,365 11,471 25,736 13,686 4,629 16,072 11,592 9,458
9.B. Nov. 1998 sale (13,190) 8,515 28,637 10,938 12,004 18,313 40,118 21,623 7,432 25,600 18,478 15,021
9.C. Nov. 1998 sale if storage losses declineby 50% (12,764) 8,991 29,513 11,541 12,232 18,649 40,824 22,012 7,570 26,068 18,816 15,294
9.D. Jan. 1999 sale (9,934) 12,608 36,462 16,154 14,152 21,481 46,777 25,297 8,730 30,012 21,666 17,596
9.E. Jan. 1999 sale if storagelosses decline by 50% (8,797) 13,934 38,888 17,824 14,790 22,424 48,730 26,374 9,115 31,311 22,610 18,359
10. NET INCOME/HA IF HIGH- INPUTCREDIT NOT REPAID SEPT. 1998 456,171 1,259,825 2,070,085 1,263,566
11. NET INCOME/LABOR DAY IFHIGH-INPUT CREDIT NOT REPAIDSEPT. 1998 11,126 17,258 30,897 20,714
Median Wage 13 12,381 12,381 12,381 12,381 12,381 12,381 12,381 12,381 12,381 12,381 12,381 12,381
Total labor (days/ha)14 60 73 67 65 98 100 79 94 139 61 123 110

Table 20. Summary of Farm Level Enterprise Budget for Region 8 (Monapo/Meconta), by Technology Type Plot type/ (A) Hi-Input (B) Improved Management Only (C) Control Group
Budget Item
(terciles) 1 2 3 mean 1 2 3 mean 1 2 3 mean
n used in calculations 10 11 11 32 11 12 11 34 10 10 10 30
1. GRAIN YIELD (kg/ha) 1 1,328 2,533 4,118 2,701 1,200 1,946 2,761 1,969 1,009 1,736 2,495 1,747
1.A. Sept. 1998 adjusted yield2 1,301 2,482 4,036 2,647 1,176 1,907 2,706 1,930 989 1,701 2,445 1,712
1.B. Nov. 1998 adjusted yield 1,250 2,384 3,876 2,542 1,129 1,832 2,599 1,853 950 1,634 2,348 1,644
1.C. Nov. 1998 adj. yield if storage losses declineby 50% 1,289 2,458 3,996 2,621 1,164 1,888 2,679 1,911 979 1,684 2,421 1,695
1.D. Jan. 1999 adjusted yield 1,200 2,290 3,722 2,441 1,085 1,759 2,496 1,780 912 1,569 2,255 1,579
1.E. Jan. 1999 adj. yield ifstorage losses decline by 50% 1,263 2,409 3,916 2,569 1,141 1,851 2,626 1,872 960 1,651 2,373 1,661
2. EST. FARMGATE PRICE (mt/kg) 3
2.A. Sept. 1998 1,050 1,050 1,050 1,050 1,050 1,050 1,050 1,050 1,050 1,050 1,050 1,050
2.B. Nov. 1998 1,520 1,520 1,520 1,520 1,520 1,520 1,520 1,520 1,520 1,520 1,520 1,520
2.C. Jan. 1999 2,100 2,100 2,100 2,100 2,100 2,100 2,100 2,100 2,100 2,100 2,100 2,100
3. GROSS REVENUE 4
3.A. Sept. 1998 sale 1,366,512 2,606,457 4,237,422 2,779,329 1,234,800 2,002,434 2,841,069 2,026,101 1,038,261 1,786,344 2,567,355 1,797,663
3.B. Nov. 1998 sale 1,923,880 3,669,569 5,965,765 3,912,951 1,738,445 2,819,179 3,999,873 2,852,499 1,461,743 2,514,951 3,614,518 2,530,887
3.C. Nov. 1998 sale if storage losses decline by50% 1,865,476 3,558,171 5,784,662 3,794,165 1,685,671 2,733,597 3,878,449 2,765,906 1,417,369 2,438,604 3,504,792 2,454,056
3.D. Jan. 1999 sale 2,451,237 4,675,439 7,601,049 4,985,535 2,214,973 3,591,948 5,096,284 3,634,402 1,862,423 3,204,328 4,605,298 3,224,632
3.E. Jan. 1999 sale if storagelosses decline by 50% 2,581,972 4,924,758 8,005,520 5,251,861 2,332,551 3,784,044 5,368,384 3,826,926 1,962,566 3,375,165 4,851,171 3,395,583
4. TOTAL PACKAGE COSTS 5 1,158,000 1,158,000 1,158,000 1,158,000 59,455 54,050 32,430 54,050 108,100 54,050 27,025 54,050
4.A. Seed (mt/ha) 198,000 198,000 198,000 198,000 59,455 54,050 32,430 54,050 108,100 54,050 27,025 54,050
4.B. 12-24-12 and Urea Fertilizers 960,000 960,000 960,000 960,000 0 0 0 0 0 0 0 0
5. INTEREST6
5.A. Sept. 1998 173,700 173,700 173,700 173,700 0 0 0 0 0 0 0 0
5.B. November 1998 188,175 188,175 188,175 188,175 0 0 0 0 0 0 0 0
5.C. January 1999 217,125 217,125 217,125 217,125 0 0 0 0 0 0 0 0
6. LABOR
6.A.Total family/mutual labor (days/ha) 7 61 97 84 75 145 188 159 161 213 176 199 188
6.B. Total wage labor (mt/ha) 8 237,111 58,600 264,182 187,533 188,455 343,056 293,091 276,873 427,650 287,333 98,810 271,264
7. HAND TOOLS AND SACKS (mt/ha) 44,103 71,250 58,258 55,697 34,000 40,247 36,014 34,435 35,232 41,925 40,833 38,333
7.A. Hand tools (mt/ha) 9 22,885 30,000 19,091 23,333 21,000 19,789 13,076 17,213 24,243 21,875 17,500 21,000

7.B. Sacks (mt/ha) 10 21,218 41,250 39,167 32,364 13,000 20,458 22,938 17,222 10,989 20,050 23,333 17,333
8. NET INCOME/HA 11
8.A. Sept. 1998 sale (246,402) 1,144,907 2,583,282 1,204,399 952,890 1,565,081 2,479,534 1,660,743 467,279 1,403,036 2,400,687 1,434,016
8.B. Nov. 1998 sale 238,087 2,082,146 4,116,047 2,204,760 1,403,761 2,296,244 3,516,914 2,400,548 846,387 2,055,296 3,338,124 2,090,409
8.C. Nov. 1998 sale if storage losses decline by50% 266,983 2,137,261 4,205,648 2,263,530 1,429,871 2,338,586 3,576,989 2,443,390 868,341 2,093,069 3,392,411 2,128,422
8.D. Jan. 1999 sale 794,898 3,170,464 5,903,484 3,367,180 1,933,063 3,154,595 4,734,749 3,269,044 1,291,441 2,821,020 4,438,630 2,860,985
8.E. Jan. 1999 sale if storagelosses decline by 50% 896,125 3,363,500 6,216,453 3,573,490 2,023,977 3,303,451 4,945,500 3,417,817 1,369,164 2,953,283 4,629,064 2,993,118
9. NET INCOME/FAMILY-MUTUALLABOR DAY 12
9.A. Sept. 1998 sale (4,039) 11,803 30,753 16,059 6,572 8,325 15,595 10,315 2,194 7,972 12,064 7,628
9.B. Nov. 1998 sale 3,903 21,465 49,001 29,397 9,681 12,214 22,119 14,910 3,974 11,678 16,775 11,119
9.C. Nov. 1998 sale if storage losses decline by50% 4,377 22,034 50,067 30,180 9,861 12,439 22,497 15,176 4,077 11,892 17,047 11,321
9.D. Jan. 1999 sale 13,031 32,685 70,280 44,896 13,332 16,780 29,778 20,305 6,063 16,029 22,305 15,218
9.E. Jan. 1999 sale if storagelosses decline by 50% 14,691 34,675 74,005 47,647 13,959 17,572 31,104 21,229 6,428 16,780 23,262 15,921
10. NET INCOME/HA IF HIGH-INPUTCREDIT NOT REPAID SEPT. 1998 1,085,298 2,476,607 3,914,982 2,536,099
11. NET INCOME/LABOR DAY IF HIGH-INPUT CREDIT NOT REPAID SEPT. 1998 17,792 25,532 46,607 33,815
Median Wage 13 16,667 16,667 16,667 16,667 16,667 16,667 16,667 16,667 16,667 16,667 16,667 16,667
Total labor (days/ha)14 71 111 84 89 145 192 159 161 241 180 199 213
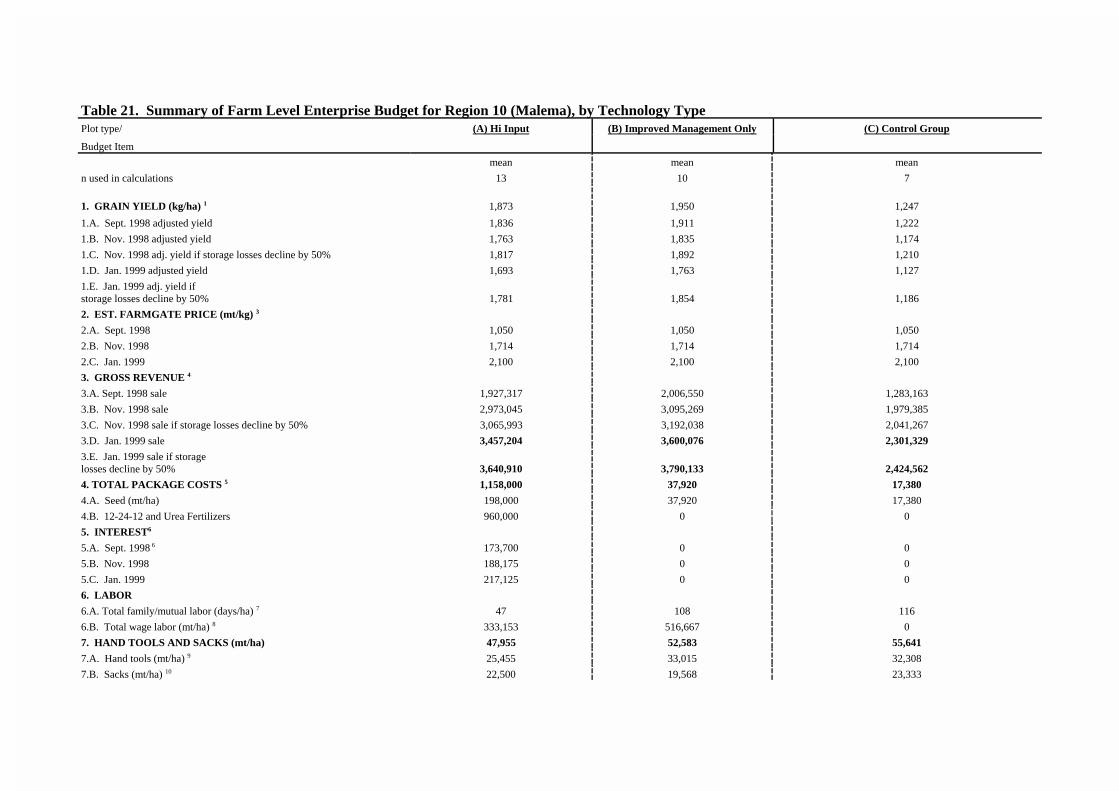
Table 21. Summary of Farm Level Enterprise Budget for Region 10 (Malema), by Technology Type Plot type/ (A) Hi Input (B) Improved Management Only (C) Control Group
Budget Item
mean mean mean
n used in calculations 13 10 7
1. GRAIN YIELD (kg/ha) 1 1,873 1,950 1,247
1.A. Sept. 1998 adjusted yield 1,836 1,911 1,222
1.B. Nov. 1998 adjusted yield 1,763 1,835 1,174
1.C. Nov. 1998 adj. yield if storage losses decline by 50% 1,817 1,892 1,210
1.D. Jan. 1999 adjusted yield 1,693 1,763 1,127
1.E. Jan. 1999 adj. yield ifstorage losses decline by 50% 1,781 1,854 1,186
2. EST. FARMGATE PRICE (mt/kg) 3
2.A. Sept. 1998 1,050 1,050 1,050
2.B. Nov. 1998 1,714 1,714 1,714
2.C. Jan. 1999 2,100 2,100 2,100
3. GROSS REVENUE 4
3.A. Sept. 1998 sale 1,927,317 2,006,550 1,283,163
3.B. Nov. 1998 sale 2,973,045 3,095,269 1,979,385
3.C. Nov. 1998 sale if storage losses decline by 50% 3,065,993 3,192,038 2,041,267
3.D. Jan. 1999 sale 3,457,204 3,600,076 2,301,329
3.E. Jan. 1999 sale if storagelosses decline by 50% 3,640,910 3,790,133 2,424,562
4. TOTAL PACKAGE COSTS 5 1,158,000 37,920 17,380
4.A. Seed (mt/ha) 198,000 37,920 17,380
4.B. 12-24-12 and Urea Fertilizers 960,000 0 0
5. INTEREST6
5.A. Sept. 1998 6 173,700 0 0
5.B. Nov. 1998 188,175 0 0
5.C. Jan. 1999 217,125 0 0
6. LABOR
6.A. Total family/mutual labor (days/ha) 7 47 108 116
6.B. Total wage labor (mt/ha) 8 333,153 516,667 0
7. HAND TOOLS AND SACKS (mt/ha) 47,955 52,583 55,641
7.A. Hand tools (mt/ha) 9 25,455 33,015 32,308
7.B. Sacks (mt/ha) 10 22,500 19,568 23,333

8. NET INCOME/HA 11
8.A. Sept. 1998 sale 214,509 1,399,380 1,210,142
8.B. Nov. 1998 sale 1,245,762 2,488,099 1,906,364
8.C. Nov. 1998 sale if storage losses decline by 50% 1,297,092 2,541,539 1,940,538
8.D. Jan. 1999 sale 1,700,971 2,992,906 2,228,308
8.E. Jan. 1999 sale if storagelosses decline by 50% 1,843,059 3,139,634 2,323,833
9. NET INCOME/FAMILY-MUTUAL LABOR DAY 12
9.A. Sept. 1998 sale 4,564 12,957 10,432
9.B. Nov. 1998 sale 26,506 23,038 16,434
9.C. Nov. 1998 sale if storage losses decline by 50% 27,598 23,533 16,729
9.D. Jan. 1999 sale 36,191 27,712 19,210
9.E. Jan. 1999 sale if storagelosses decline by 50% 39,214 29,071 20,033
10. NET INCOME/HA IF HIGH-INPUT CREDIT NOT REPAIDSEPT. 1998 1,546,209
11. NET INCOME/LABOR DAY IF HIGH-INPUT CREDIT NOTREPAID SEPT. 1998 32,898
Median Wage 13 16,667 16,667 16,667
Total labor (days/ha)14 70 168 116

45
Notes for Tables 19-21:
1 Source: crop cut estimates from DNER/DEA/MSU Survey. Yield at harvest. Assumes no grain is lostduring shelling.2 Assumes maize is harvested in mid-late July and sold in September, with storage losses of 2% per month. 3 Prices received by farmers in CLUSA-assisted associations in September 1998. November 1998 andJanuary 1999 based on SIMA reports.4 Adjusted grain yield * price.5 DNER/SG Inputs Program Participants receive inputs for a half-hectare plot. Per-hectare rates are 30 kgSEMOC-1 seed, 100 kg each 12-24-12 and urea. Seed for low-input and non-program participants valuedat grain prices prevailing during the planting month.6DNER/SG Inputs Program interest rate is 22.5% per year(12-month period).7Median adult equivalent days per hectare of family + mutual labor from survey data. Includes harvest butnot processing labor. Family labor is unpaid labor by members of the household. Mutual labor is unpaidlabor from outside the household which is either unpaid -- either in cash or in kind -- or where laborer ispaid only with a meal or drink.8Median values of cash and in-kind payments for labor (excluding meals and drinks) reported by surveyparticipants.9Depreciated value of 2 hoes, 2 large and 2 small machetes, 2 knives, 2 sharpening files. Depreciated valueof tool package was apportioned according to percentage of total cultivated area represented by target maizeplot. Purchase prices based on reports by survey supervisors.10Number of sacks needed was calculated based on the assumption that the farmer would market the entire1997/98 production. Since sacks are used for other farm activities, cost was apportioned according topercentage of total cultivated area represented by target maize plot. Each “90 kg size sack” holds 85 kg ofmaize grain. Purchase price of sacks based on reports by survey supervisors.11(3) - (4 +5 +6.B.+7)12(8)/(6.A).13 From survey data.14 Median adult equivalent days of family + mutual labor plus mean days of wage labor per hectare fromsurvey data.

46
REFERENCES
Abraham, Tadesse, Firdu Azerefagu, Assefa Gabre Amlak, and Adhanom Negassi. 1993. Research Highlights on Maize Insect Pests and Their Management in Ethiopia. InProceedings of the First National Maize Workshop of Ethiopia, eds. Benti Tolessa and JoelK. Ransom. Addis Ababa: IAR/CIMMYT.
DAP. 2000. Avaliação dos Impedimentos Para o Desenvolvimento do Sector dos InsumosAgrícolas e Veterinários. Rascunho. Maputo: Departamento de Análise de Políticas,MADR.
DEA. 1998. Smallholder Agriculture in Mozambique: 1995/96 National Report. Ministério daAgricultura e Pescas, Direcção Nacional de Economia Agrária. Maputo: MAP.
Estação Agrária and Extensão Rural/Nampula. Nampula. Adubação Química do Milho. FichaTécnica No. 1. Nampula: INIA and DNER.
Domínguez Carlos E., and Alberto J. Chidiamassamba. 1997. Levantamento e Análise daProdução Local de Sementes. Ministério da Agricultura e Pescas, Direcção Nacional deAgricultura. Maputo: MAP.
FAOSTAT Statistics Database. 1999. Food and Agriculture Organization of the United Nations,[Online]. Available: http://apps.fao.org/
Geurts, Peter. 1997. Recomendações de Adubação Azotada e Fosfórica para as Culturas AnnuaisAlimentares e Algodão em Moçazmbique. INIA/Departamento de Terra e Agua,Comunicação No. 88, April.
Howard, Julie A., José Jaime Jeje, David Tschirley, Paul Strasberg, Eric W. Crawford, andMichael T. Weber. What Makes Agricultural Intensification Profitable for MozambicanSmallholders? NDAE Working Papers No. 31 and 32 (Volumes 1 and 2). Maputo:MADER.
MAP 1996. Programa de Investimento em Extensão Agrária/Documento de Trabalho no. 2/B. Processo de Formulacão do PROAGRI. Ministério da Agricultura e Pescas. Maputo:MAP.
Penninkhoff, Petra, João Augusto, and Manual Anman. Diferentes fontes e doses de adubação nomilho. Resumo do relatório. Nampula: INIA.
Schulthess, U. and R. Ward. 1999. Using the CERES-Maize Crop Simulation Model to Assess theImpact of SG2000 Technology on Maize Yield Stability in Ethiopia. MSU Food Security IIProject Report. East Lansing: Michigan State University.

47
NDAE Working Papers
1. Informing the Process of Agricultural Market Reform in Mozambique: A ProgressReport, October 1990
2. A Pilot Agricultural Market Information and Analysis System in Mozambique:Concepts and Methods.
3. Inquérito ao Sector Familiar da Província de Nampula: ObservaçõesMetodológicas, 9 de Novembro de 1991
3E. A Socio-Economic Survey of the Smallholder Sector in The Province of Nampula: Research Methods (translated from Portuguese), January 1992
4. Inquérito ao Sector Familiar da Província de Nampula: Comercialização Agrícola,30 de Janeiro de 1992
4E. A Socio-Economic Survey in The Province of Nampula: Agricultural Marketing inthe Smallholder Sector (translated from Portuguese), January 1992
5. Inquérito ao Sector Familiar da Província de Nampula: O Algodão na EconomiaCamponesa, 9 de Novembro de 1991
5E. A Socio-Economic Survey in The Province of Nampula: Cotton in the SmallholderEconomy (translated from Portuguese), January 1992
6. The Determinants of Household Income and Consumption in Rural NampulaProvince: Implications for Food Security and Agricultural Policy Reform, August1992
6P. Determinantes do Rendimento e Consumo Familiar nas Zonas Rurais da Provínciade Nampula: Implicações para a Segurança Alimentar e as Reformas de PolíticaAgrária (Traduzido do Inglés), 24 de Fevereiro de 1993
8. Dengo, Maria Nita, "Household Expenditure Behavior and Consumptio GrowthLinkages in Rural Nampula Province, Mozambique", M.Sc. Thesis, Dept. ofAgricultural Economics, Michigan State University (Reprint), December 18 1992
9. The Maputo Market Study: Research Methods, March 8 1993
9P. O Estudo do Mercado de Maputo: Observações Metodólogicas, 1 de Junho de 1993
10. The Organization, Behavior, and Performance of the Informal Food MarketingSystem, May 28 1993
12. The Pricing and Distribution of Yellow Maize Food Aid n Mozambique: AnAnalysis of Alternatives, October 18 1993

48
14. Liedholm, Carl and Donald Mead, "Small-scale Enterprises: a Profile", in EconomicImpact: A Quarterly Review of World Economics, no. 63 (Reprint)
14P. Liedholm, Carl and Donald Mead, "Pequenas Empresas: Um Perfil", em EconomicImpact: A Quarterly Review of World Economics, no. 63 (Reprint, translated fromEnglish)
15. Mini-SIMA e Análises Específicas: Um Ensaio Aplicado aos Mercados de Maputo,15 de Julho de 1993
16. The Evolution of the Rural Economy in Post-War Mozambique: Insights from aRapid Appraisal in Monapo District of Nampula Province
17. Padrões de Distribuição de Terras no Sector Familiar em Moçambique: ASimilaridade entre duas Pesquisas Distintas e as Implicações para a Definição dePolíticas, May 1994
18. Who Eats Yellow Maize? Some Preliminary Results from a Survey of ConsumerMaize Preferences in Maputo, October 1994
18P. Quem Come Milho Amarelo? Alguns Resultados Preliminares de um Inquéritosobre as Prefencias dos Consumidores de Milho na Cidade de Maputo (Traduzidodo Inglés), 10 de Novembro de 1994
19. Diagnóstico da Estrutura, Comportamento, e Desempenho dos MercadosAlimentares de Moçambique, 4 de Julho de 1995
20. Inquérito ao Sector Moageiro de Pequena Escala em Moçambique: ObservaçõesMetodológicas, 30 de Janeiro de 1995
21. O Sector da Castanha de Caju - Lucros Potenciais Perdidos por Africa? (Reimpressão), Novembro de 1995
22. Smallholder Cash Cropping, Food Cropping and Food Security in NorthernMozambique: Research Methods, March 1996
22P. Culturas de Rendimento, Culturas Alimentares e a Segurança Alimentar do SectorFamiliar no Norte de Moçambique: Métodos do Estudo, Novembro de 1996
23. Plan of Activities for Food Security Research Project, September 1995 throughAugust 1997, 1996
24. Strasberg, Paul, “Smallholder Cash-Cropping, Food-Cropping and Food Security inNorthern Mozambique”, Ph.D.Dissertation, Dept. of Agricultural Economics,Michigan State University (Reprint), May 1997
25. Smallholder Cash-Cropping, Food-Cropping and Food Security in NorthernMozambique: Summary, Conclusions, and Policy Recommendations, June 1997

49
26. Agricultural Market Information for Family Farms in Mozambique, June 1997
26P. Informação de Mercado Agricola para o Sector Familiar em Moçambique, Junho1997
27. Micro and Small Enterprises in Central and Northern Mozambique: Results of a1996 Survey, September, 1997.
27P. Micro e Pequenas Empresas no Centro e Norte de Moçambique: Resultados doInquerito Realizado em 1996, Setembro de 1997.
28. Desafios Para Garantir a Concorrência e Reduzir os Custos no Sistema Alimentarde Moçambique, 12 de Maio de 1998.
29. Planning for Drought in Mozambique: Balancing the Roles of Food Aid and FoodMarkets, May 14, 1998
30. Séries Históricas dos Preços de Grão de Milho Branco e suas Tendências Reais emAlguns Mercados do País, 18 de Maio de 1998.
31. What Makes Agricultural Intensification Profitable for Mozambican Smallholders? An Appraisal of the Inputs Subsector and the 1996/97 DNER/SG2000 Program,Volume I: Summary, October, 1998.
32. What Makes Agricultural Intensification Profitable for Mozambican Smallholders? An Appraisal of the Inputs Subsector and the 1996/97 DNER/SG2000 Program,Volume II: Main Report, October, 1998.
33. Household Food Consumption in Mozambique: A Case Study in Three NorthernDistricts, February, 1999.
34. The Effects of Maize Trade with Malawi on Price Levels in Mozambique:Implications for Trade and Development Policy, November,1999.
35. Séries Históricas dos Preços de Grão de Milho Branco e Suas Tendências Reais emAlguns Mercados do País no Periódo Compreendido Entre Abril 1993 e Setembro1999, November, 1999.