Embed Size (px)
Citation preview

A MINERALS COUNCIL OF AUSTRALIA BACKGROUND PAPER
Mining Taxes and Subsidies: Official evidence
SINCLAIR DAVIDSON
MAY 2012

2 MINERALS COUNCIL OF AUSTRALIA
MINERALS COUNCIL OF AUSTRALIALevel 3, 44 Sydney Ave, Forrest ACT 2603 (PO Box 4497, Kingston ACT Australia 2604)P. + 61 2 6233 0600 | F. + 61 2 6233 0699 W. www.minerals.org.au | E. [email protected]
The Minerals Council of Australia represents Australia’s exploration, mining and minerals processing industry, nationally and internationally, in its contribution to sustainable economic and social development.
The views expressed in this publication are those of the author. This publication is part of the overall program of the MCA, as endorsed by its Board of Directors, but does not necessarily reflect the views of individual members of the Board.
Sinclair Davidson is Professor of Institutional Economics at RMIT University and a Senior Fellow at the Institute of Public Affairs. He has written extensively on taxation policy in Australia. His opinion pieces have been published in The Age, The Australian, Australian Financial Review, Sydney Morning Herald, and Wall Street Journal Asia. Sinclair has also published in academic journals such as the European Journal of Political Economy, Review of Political Economy, Journal of Economic Behavior and Organization, and the Cato Journal.

* School of Economics, Finance and Marketing, RMIT University.
Mining Taxes and Subsidies: Official evidence
SINCLAIR DAVIDSON*
A MINERALS COUNCIL OF AUSTRALIA BACKGROUND PAPER


5MINING TAXES AND SUBSIDIES: OFFICIAL EVIDENCE
There is a view that the Australian mining industry pays a disproportionately low amount of corporate tax. This view can be found in some Federal Government statements and publications by bodies such as The Australia Institute. Yet an analysis of Australian Taxation Office (ATO) data indicates that the mining industry pays a substantial sum of money in corporate taxation and pays at a rate close to 30% of its taxable income.
A second argument, also heard widely, is that the mining industry is in receipt of substantial government subsidies, often in the form of tax expenditures. An analysis of Treasury and Productivity Commission documentation, however, shows this view to be incorrect.
This paper evaluates official statistics on Australian mining taxation and assesses claims that mining tax rates are lower than those of other industries. The argument that mining pays a low percentage of its income
in taxation is simply not true. The argument that mining pays a low proportion of total corporate tax is simply not true.
On the issue of subsidies, the Federal Government has concluded that there are no ‘sector-specific tax expenditures for fossil fuel production’. More specifically, the claim that the fuel tax credit scheme provides a ‘subsidy’ to the mining industry is not supported by the official evidence. It is not even supported in primary research relied on by the green lobby.
It is possible to point to features of the Australian tax system or government policies that appear to provide benefits to the mining industry, but upon close examination most of those benefits are universal. It is very clear that official estimates of subsidy to the mining industry are actually quite small when compared to estimates provided by various lobby groups. ■
Introduction

6 MINERALS COUNCIL OF AUSTRALIA
7MINING TAXES AND SUBSIDIES: OFFICIAL EVIDENCE
How much tax do miners pay?
On 7 March 2012, Treasury Secretary Martin Parkinson (2012) told the Australia–Israel Chamber of Commerce:
Mining companies account for about a fifth of gross operating surplus, yet only around a tenth of company tax receipts, primarily because tax receipts from the industry are affected by the high levels of investment occurring in the sector and the consequent level of depreciation deductions.
Later in the same month, Treasurer Wayne Swan (2012) relied on a somewhat different set of statistics in a speech to the Australian Business Economists.
Mining companies currently account for about 30% of corporate gross operating profits, but only around 15% of corporate tax receipts.
What the Treasury Secretary and the Treasurer agree on is that the mining industry’s contribution to the economy is about double its contribution to corporate tax revenue. Yet there is a substantial difference between the 20% of Gross Operating Surplus (GOS) that Parkinson claims for the mining industry and the 30% that Swan claims for the same industry.
The Australian Bureau of Statistics (ABS) defines Gross Operating Surplus as follows:
It is the excess of gross output over the sum of intermediate consumption, compensation of employees, and taxes
less subsidies on production and imports. It is calculated before deduction of consumption of fixed capital, dividends, interest, royalties and land rent, and direct taxes payable, but after deducting the inventory valuation adjustment. Gross operating surplus is also calculated for general government and it equals general government’s consumption of fixed capital.
It is possible to replicate both estimates of the size of the mining industry using data from the National Accounts. Industry GOS data are found in ABS Cat. 5204.0 (Table 46) and Government GOS data are found in ABS Cat. 5204.0 (Table 47).1 The Parkinson measure for the mining share of GOS is mining GOS to All Industry GOS less Government GOS and Ownership of Dwellings. The Swan measure of GOS is derived from data taken from ABS Cat. 5206.0 (Table 7).2 Mining industry share GOS data are from ABS Cat. 5204.0 (Table 47) and the denominator data are determined by the sum of Private Non-financial GOS and Financial GOS taken from ABS Cat. 5206.0 (Table 7).
The Australian Government has an agency that collects taxation revenue and reports taxation statistics. How much tax is paid by differing industries is public information that can be accessed from the ATO with an approximate 18 month lag. The net tax paid by the mining industry as a percentage of mining taxable income is collected from various issues of ATO taxation statistics and reported in Figure 1, along with the Parkinson and Swan estimates of the mining share of GOS.
Mining Taxes and Subsidies: Official evidence
SINCLAIR DAVIDSON

8 MINERALS COUNCIL OF AUSTRALIA
The main problem with both the Parkinson and Swan figures is the view that corporate GOS is the appropriate measure of the corporate income tax base. They are not alone in making that assumption – Richardson and Denniss (2011: 23) calculate the ‘average rate of corporate tax paid by the mining industry’ to be 13.9% in 2008-09 using GOS as a proxy for taxable income. They explicitly argue that this is well below the ‘theoretical’ 30% corporate tax rate.
There is no reason to expect that the tax paid to GOS ratio should be 30%. Indeed, using Parkinson’s estimate of corporate GOS the corporate tax paid to GOS ratio was 13.42% in 2008-09 while using Swan’s estimate of corporate GOS the corporate tax paid to GOS ratio was 18.25% in 2008-09.3 Both are well below the ‘theoretical’ 30% corporate tax rate.
In a broad ranging discussion concerning the appropriate measurement of various tax burdens, including the corporate tax burden, the OECD (2000) indicates that GOS and measures of taxable income and economic income will differ from each other. The OECD (2000: 10) states (emphasis added):
This renders implicit corporate tax rates [calculated using GOS] of questionable relevance, and suggests that the implicit tax rate approach be limited to analyses of average tax rates on income from capital (which factor returns to debt and
equity capital in the denominator, with both corporate and personal tax on these amounts included in the numerator). The implication is that more conventional average corporate tax rate measures relating corporate income taxes paid to corporate profit are called for.
In other words, it is more appropriate to relate corporate income tax paid to actual taxable income – not some estimate derived from national accounts data. The differences between GOS and taxable income are likely to be large and relate to those aspects of corporate behaviour included in taxable income, but excluded from GOS. Depreciation, for example, is excluded from GOS. Those industries that are capital intensive, or have high levels of depreciation, will appear to have a lower tax burden than other industries. For this reason, the OECD (2000: 35) argues that variations in tax rates calculated using GOS are of limited usefulness as policy tools as variations in the estimated tax rates may be unrelated to tax policy. In the case of mining, Henry Ergas (2012) explains that an expansion in investment will generate a decline in mining tax paid relative to GOS, while not necessarily reflecting a decline in the tax burden. This is exactly the problem the OECD warned about in 2000.
Importantly, earlier Treasury research rejected the view that corporate GOS is an appropriate
Source: ABS Cat. 5204.0 Table 46, 47. ABS Cat. 5206.0 Table 7. ATO Taxation Statistics (various issues). Author’s calculations.
Figure 1. Alternate estimates for the size of the mining industry and mining tax share
35
30
25
20
15
10
5
0
Min
ing
Shar
e of
GO
S
Mining N
et Tax Share of Net Corporate Tax
35
30
25
20
15
10
5
0
Parkinson estimate Swan estimate Mining Tax Share
2001-0
2
2003-
04
2007-0
8
2005-
06
2009-10
2002-
03
2004-0
5
2008-
09
2006-0
7
2010
-11

9MINING TAXES AND SUBSIDIES: OFFICIAL EVIDENCE
measure of the corporate income tax base. Clark, Pridmore and Stoney (2007: 5), for example, state (emphasis added):
… there is no readily available measure of the economic income of the corporate sector that is conceptually consistent with company income tax collections.
It is common practice to estimate the effective corporate tax rate by expressing company tax collections as a percentage of GOS, in large part because GOS is readily and publicly available.
But as they go on to explain, GOS is calculated before depreciation charges (2007: 8). Similarly, Greagg, Parham and Stojanovski (2010: 95) argue (emphasis added):
… GOS is not the most appropriate measure of a corporate income tax base as it excludes income unrelated to production – such as property income, land and natural resource rents, net interest receipts, and capital gains or losses – which rightly forms part of company income and profits. In addition, GOS excludes depreciation whereas the corporate income tax base allows a deduction for depreciation – for tax purposes, depreciation is calculated at historical cost.
There are, then, at least two problems with the kind of analysis undertaken by Parkinson
and Swan; they disagree with each other and they employ measures and techniques that Treasury has already identified as being mis-specified.
This still leaves unanswered the question as to how much tax the mining industry actually pays.
The ATO reports that the mining industry paid $6.8 billion in net tax (excluding royalties) in 2009-10, down from $13.4 billion in 2008-09. The decline in mining tax revenue is explained by the decline in commodity prices after October 2008, leading to a $49.7 billion reduction in total mining income for the 2009-10 tax year. The industry had a taxable income of $23.8 billion and an average effective tax rate of 28.5% in 2009-10. Mining was the second largest contributor to corporate income tax revenue (13.5%) after Financial and Insurance Services (31.6%) that paid $15.9 billion out of taxable income of $72.3 billion with an average effective tax rate of 21.8%. The argument that mining pays a low percentage of its income in taxation is simply not true. The argument that mining pays a low proportion of total corporate tax is simply not true.
Figure 2 shows the proportion of net corporate tax paid by selected industry and the proportion of taxable income earned by industry for the period from 2004-05 to 2009-10.4 As can be seen, the Financial and Insurance Services industry earned a very large proportion of
Source: ATO Taxation Statistics (various issues). Author’s calculations.
■ Mining Income Share■ Mining Tax Share
■ Manufacturing Income Share■ Manufacturing Tax Share
Figure 2. Share of taxable income and net tax paid (selected industries)
2004-05 2005-06 2006-07 2007-08 2008-09 2009-10
50
40
30
20
10
0
%
■ Finance & Insurance Income Share■ Finance & Insurance Tax Share

10 MINERALS COUNCIL OF AUSTRALIA
taxable income and paid the lion’s share of net tax. Note, however, that the Financial and Insurance Services industry paid a lower share of net tax than it earns in taxable income.
The mining industry has seen its share of taxable income and net tax paid increase over the first five years of the period before falling back in 2009-10. Nonetheless the tax share is still higher than it was prior to 2007-08 and only slightly less than that year. Manufacturing and mining pay proportionately more in net tax than their taxable income share of the economy.
In order to gain some appreciation for how the average effective tax rate for mining has varied over time I calculated the average effective tax rates for all industries and the corporate sector as a whole. The data are calculated from various issues of ATO taxation statistics for each industry, and each year from 2000-01.
I then calculated the standard deviation of average effective tax rates across the industries.5 The average effective tax rate for All Industries is graphed and plus and minus one standard deviation from the average is graphed too. Results are shown in Figure 3. Also included is the average effective tax rate for the mining industry. As can be seen, the mining industry has a higher average effective tax rate than the Australian average. Indeed,
it has always been above the average plus one standard deviation of All industries.
It is important to understand that net tax is calculated after all business expenses and after rebates and tax credits have been taken into account. Net tax is the amount of money that flows into Treasury.
What the net tax figure does not take into account is Australia’s dividend imputation system. To the extent that shareholders receive dividend imputation (franking) credits and face a marginal tax rate lower than the corporate tax rate the amount of revenue from the corporate income tax available for government spending is reduced. For those shareholders who face a higher marginal income tax rate, the corporate net tax is a prepayment of personal income tax. On the other hand, the mining industry has a relatively large foreign shareholder base and these shareholders are not subject to Australian personal income tax and cannot access franking credits. To the extent that firms have foreign shareholders, corporate net tax revenue remains in Treasury and does not offset personal income tax liabilities.
Ironically, the Australian government is likely to earn more corporate income tax revenue when firms pay Australian corporate income tax but have a higher than average percentage of shareholders not subject to Australian personal income tax.
Source: ATO Taxation Statistics (various issues). Author’s calculations.
Figure 3. Average effective tax rates for all industries and mining
35
30
25
20
15
10
5
0
Net
Tax
as
perc
enta
ge o
f Tax
able
Inco
me
Mining All industries One standard deviation
2000-0
1
2002-
03
2006-0
7
2004-0
5
2008-
09
2001-0
2
2003-
04
2007-0
8
2005-
06
2009-10

11MINING TAXES AND SUBSIDIES: OFFICIAL EVIDENCE
Figure 4 shows how much money the mining industry paid in corporate net income tax over the period 2000-01 to 2009-10. It also shows the total revenue raised in corporate net income tax and the proportion of mining net tax to total corporate net tax (scale on right-hand side). Over that time, the net tax revenue from mining increased nearly fourfold, while total corporate net tax revenue only doubled. Between 2000-01 and 2008-09, the net tax from mining increased 7.6 times.
It is clear that corporate tax revenues have been adversely impacted by the global financial crisis, nonetheless it is highly unlikely that but for the crisis total corporate net tax revenue would have increased fourfold. Not only has the absolute amount of tax being paid by the mining industry increased, but the relative share has also increased from 6.7% to 13.6% (down from 23.9% in 2008-09).
In addition to paying corporate tax, miners also pay royalties to State and Territory governments for the right to mine natural resources.6 Strictly speaking a royalty is not a tax – nonetheless royalty payments are substantial.
The ABS last reported natural resource royalties for the 2006-07 financial year – some $6.6 billion.7 Figure 5 reports royalty payments and mining net tax data. Royalty figures for 2006-07 to 2008-09 are unpublished ABS figures.8 Prior to 2006-07, royalty payments exceeded net tax paid. The reason for this is due to the differing tax bases – income tax is levied on corporate profit, while royalties tend to levied on production.
The important point is that the mining industry pays substantial funds into public coffers either to the Commonwealth in the form of corporate income tax, or to the States and Territories (and Commonwealth) in the form of royalties. The argument that mining tax rates are lower than that of most (or even many) other industries is simply not true.
It is only possible to come to that conclusion by redefining the tax base to be something other than the Australian corporate income tax base.
Source: ATO Taxation Statistics (various issues), Author’s calculations.
Figure 4. How much money the mining industry pays in corporate income tax
60
50
40
30
20
10
0
$ bi
llion
s
Mining N
et Tax share of Total Corporate Net Tax
30
25
20
15
10
5
0
Mining Net Tax Share Mining Net Tax Total Corporate Net Tax
2000-0
1
2002-
03
2006-0
7
2004-0
5
2008-
09
2001-0
2
2003-
04
2007-0
8
2005-
06
2009-10

12 MINERALS COUNCIL OF AUSTRALIA
Source: ATO Taxation Statistics (various issues) and ABS Cat. 1301, Cat 8410.0 and unpublished figures.
Figure 5. Natural resource royalties and mining net tax
14
12
10
8
6
4
2
0
Mining Net Tax Royalty Payments
$ bi
llion
s
2000-0
1
2002-
03
2006-0
7
2004-0
5
2008-
09
2001-0
2
2003-
04
2007-0
8
2005-
06
2009-10
Miners pay too little tax?In a series of papers Treasury officials have provided estimates of industry taxation and industry tax rates.9 Unfortunately, Treasury has not provided unambiguous estimates of the industry tax rates, but has rather chosen to show deviations from an overall mean. These papers all calculate the ratio of corporate tax to ‘corporate income’ or ‘economic income’. This gives rise to consistency problems between the numerator and the denominator when calculating (average) effective tax rates.
In particular, the numerator is often tax revenue actually paid while the denominator is some measure of ‘economic income’ derived from ABS data. While there might be timing and consistency issues in the numerator, there are likely to be several and severe problems in the denominator. The OECD (2000) identifies accounting earnings as being distorted by accounting conventions and industry specific tax conventions but the use of aggregate data is hardly likely to correct for these distortions.
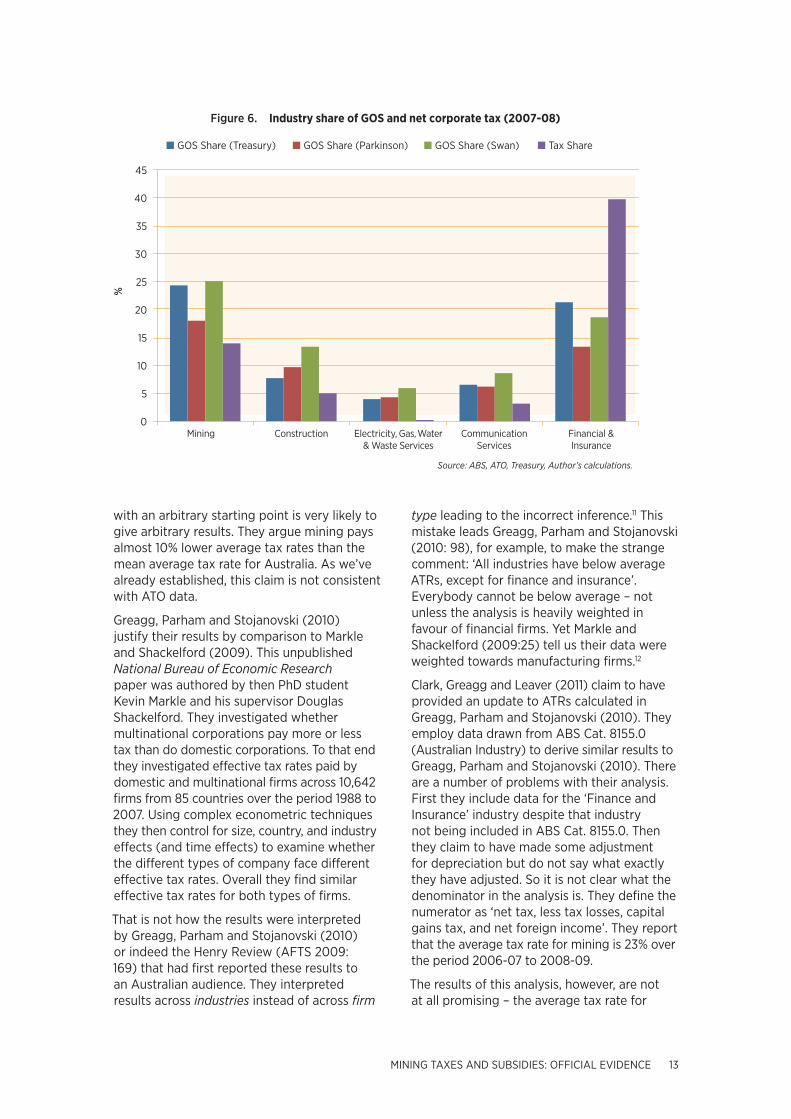
Despite recognising the limitations of GOS, Greagg, Parham and Stojanovski (2010) begin their analysis by comparing industry shares of GOS and corporate tax shares for some industries. Their analysis is replicated below.10 Figure 6 shows the industry share of GOS reported by Greagg, Parham and Stojanovski
(2010: 94) – captured by the digitizer software – and the equivalent Parkinson and Swan figures for industry share of GOS, and then also ATO corporate tax shares.
As can be seen there is a large variation between the three estimates of industry share of GOS. While the Parkinson estimate is always lower than the Swan estimate, the Greagg, Parham and Stojanovski (2010) estimates of industry GOS share are not consistently different from the other two estimates.
This is particularly problematic as Greagg, Parham and Stojanovski (2010: 95) then augment their data to convert the GOS data into a measure of ‘net operating income’ in order to calculate ‘average tax rates’ (ATRs). It is important to note, however, that their starting point is somewhat arbitrary. Further they admit (2010: 96):
There is greater uncertainty about the accuracy in measurement of industry ATRs than of an aggregate ATR. There is a reasonable level of certainty in relation to the totals of these variables. However, the need to distribute these variables across industries introduces the possibility of a misallocation error that does not exist at the aggregate level.
An inaccurate allocation method combined
13MINING TAXES AND SUBSIDIES: OFFICIAL EVIDENCE
with an arbitrary starting point is very likely to give arbitrary results. They argue mining pays almost 10% lower average tax rates than the mean average tax rate for Australia. As we’ve already established, this claim is not consistent with ATO data.
Greagg, Parham and Stojanovski (2010) justify their results by comparison to Markle and Shackelford (2009). This unpublished National Bureau of Economic Research paper was authored by then PhD student Kevin Markle and his supervisor Douglas Shackelford. They investigated whether multinational corporations pay more or less tax than do domestic corporations. To that end they investigated effective tax rates paid by domestic and multinational firms across 10,642 firms from 85 countries over the period 1988 to 2007. Using complex econometric techniques they then control for size, country, and industry effects (and time effects) to examine whether the different types of company face different effective tax rates. Overall they find similar effective tax rates for both types of firms.
That is not how the results were interpreted by Greagg, Parham and Stojanovski (2010) or indeed the Henry Review (AFTS 2009: 169) that had first reported these results to an Australian audience. They interpreted results across industries instead of across firm
type leading to the incorrect inference.11 This mistake leads Greagg, Parham and Stojanovski (2010: 98), for example, to make the strange comment: ‘All industries have below average ATRs, except for finance and insurance’. Everybody cannot be below average – not unless the analysis is heavily weighted in favour of financial firms. Yet Markle and Shackelford (2009:25) tell us their data were weighted towards manufacturing firms.12
Clark, Greagg and Leaver (2011) claim to have provided an update to ATRs calculated in Greagg, Parham and Stojanovski (2010). They employ data drawn from ABS Cat. 8155.0 (Australian Industry) to derive similar results to Greagg, Parham and Stojanovski (2010). There are a number of problems with their analysis. First they include data for the ‘Finance and Insurance’ industry despite that industry not being included in ABS Cat. 8155.0. Then they claim to have made some adjustment for depreciation but do not say what exactly they have adjusted. So it is not clear what the denominator in the analysis is. They define the numerator as ‘net tax, less tax losses, capital gains tax, and net foreign income’. They report that the average tax rate for mining is 23% over the period 2006-07 to 2008-09.
The results of this analysis, however, are not at all promising – the average tax rate for
Source: ABS, ATO, Treasury, Author’s calculations.
Figure 6. Industry share of GOS and net corporate tax (2007-08)
45
40
35
30
25
20
15
10
5
0
%
■ GOS Share (Treasury) ■ GOS Share (Parkinson) ■ GOS Share (Swan) ■ Tax Share
Mining Construction Financial & Insurance
Communication Services
Electricity, Gas, Water & Waste Services

14 MINERALS COUNCIL OF AUSTRALIA
Finance and Insurance (36%) and Transport and Storage (59%) are well above the statutory rate (30%). Using the reported ATR results and the information contained in their Chart 2 (2011: 161) it is possible to estimate their economy-wide ATR at 31% to 32% – above the statutory rate of 30%.
As Clark, Pridmore and Stoney (2007: 5) recognised:
Comparing the statutory rate with an effective tax rate measure provides an indication of how closely the definition of income for tax purposes matches with economic income.
Massive deviations above the statutory rate indicate the measure itself is flawed; it does not provide useful information regarding the tax system.
The results I can derive from publicly available ATO information are inconsistent with the Treasury results. For example, when employing ‘net tax, less tax losses, capital gains tax, and net foreign income’ as the numerator I find a mining deviation of positive 6%, not the negative (almost) 10% that Clark, Greagg and Leaver (2011) report. When I use just ‘net tax’ in the numerator I find a mining deviation of positive 3.4%.
It is here, however, that Clark, Greagg and Leaver (2011: 161-162) make an important concession.
The industries used in this ATO based analysis do not completely match the industry classifications used in the rest of this paper.
Treasury analysis usually consists of combining data from the ABS and ATO. To the extent that industry classifications are not identical and data collection procedures vary across the two agencies (i.e. the ABS provides estimates from samples while the ATO is comprehensive) it is likely that unknown biases would enter into the analysis.
To provide some indication of the differences between ABS and ATO data I plot the ABS estimate of operating profit before tax (ABS cat. 8155.0) and contrast that with the ATO reported figure for taxable income. As can be seen in Figure 7, these numbers are significantly different from each other – it is unsurprising then that when ABS data is used to determine an estimate of taxable income that there are such huge discrepancies between Treasury estimates of effective tax rates and estimates based on ATO data (see Figure 8).
Source: ABS Cat. 8155.0 and ATO Taxation Statistics (various issues)
Figure 7. Comparison of ABS and ATO data (2006-07 to 2008-09)
60
50
40
30
20
10
0
Mining
Manufacturing
Electricity,
Gas, Water &
Waste Services
Transport, Posta
l &
Warehousing
Information, Media &
TelecommunicationsConstru
ction
■ Taxable or net income ■ Operating profit before tax
$ bi
llion
s

15MINING TAXES AND SUBSIDIES: OFFICIAL EVIDENCE
Source: ABS Cat. 8155.0 and ATO Taxation Statistics (various issues), Author’s calculations.
Figure 8. Comparison of ATRs using ABS and ATO data (2006-07 to 2008-09)
30
25
20
15
10
5
0
%
Mining
Manufacturing
Electricity,
Gas, Water &
Waste Services
Transport, Posta
l &
Warehousing
Information, Media &
TelecommunicationsAll In
dustries
Construction
■ ATR (ATO Data) ■ ATR (ATO & ABS Data)
Figure 8 shows ATRs calculated using ATO net tax data, ATO taxable income data and ABS operating profit before tax data for the period (2006-07 to 2008-09). Note that the calculation using ABS data is very different to that using only ATO data. The calculation employing ABS data shows that the mining industry has a lower ATR (18.8%) than the average for all industry (21%). Note also, however, that the ATRs do not exceed the statutory rate of 30%.
In essence, it is very difficult to understand what the Treasury papers demonstrate. They begin with the premise that tax revenue to GDP is not a good measure of the tax burden. From there they attempt to derive some measure of ‘economic income’ and relate tax paid to that measure. Given the vague definitions and citations, however, it is difficult to understand the variables being constructed and often impossible to replicate those variables.
Where replication can be attempted the results do not conform to Treasury claims.
Furthermore, results are not always internally consistent within the papers. For example, Clark, Pridmore and Stoney (2007: 1) make the claim:
The ratio of company tax to corporate profits – the ‘effective company tax rate’ – has fallen over the past 25 years.
Yet the graph (Figure 9) to demonstrate this claim (2007: 6) shows the exact opposite – the effective tax rate has risen since the early 1980s. The statutory tax rate has fallen – but that cannot be what Treasury was referring to. The whole point of calculating effective tax rates is due to statutory rates being uninformative.

16 MINERALS COUNCIL OF AUSTRALIA
Subsidies and Tax ExpendituresIt is widely recognised that the tax burden on industry can be ameliorated through the use of subsidy and/or tax expenditures. But before the extent of subsidies and tax expenditures can be determined for the mining industry it is important to provide some definitions.
SubsidyIn his conceptual discussion of subsidies, Neil Bruce (1990: 6) favourably quotes Alan Prest (1974) who commented: ‘… I was under the delusion that I knew what a subsidy was: now I am no longer so sure.’
Bruce discusses direct subsidies as being a benefit received directly by a firm undertaking an activity while indirect subsidies are received in the ‘form of a higher market price for its output and/or a lower market price of an input’ (1990: 4). As he acknowledges (1990: 8) that definition is pragmatic – other definitions and considerations exist too. For example, we might consider the economic justification for subsidy. Some economists argue that government subsidies can be employed to correct for ‘market failures’ while some subsidies represent protectionism for local industry. Conversely, we could consider government intent when analysing subsidies. Only those subsidies that the government intends to be subsidies would be included in this approach.
Importantly, Bruce makes the point subsidies must be sector- or industry-specific (1990: 4).
A truly general ‘subsidy’ is not a subsidy in its economic effects. In particular, there is no meaningful way that all sectors of an economy can be subsidised. For example, if the government subsidised all sectors at the same rate (and raised the necessary revenues by taxing all sectors at the same rate), there would be no impact on relative prices. … Hence, subsidisation must describe policies which differentially affect an industry or a group of industries relative to others.
Of course, it could be the case that some industries benefit more or less from ‘general subsidies’ but it is not clear that this should be considered as a subsidy. Bruce gives the example of accelerated depreciation as a general provision of the tax law that benefits capital intensive industries over other industries. Accelerated depreciation, however, could constitute tax expenditure (see below).
The challenge when discussing subsidies is whether to define them narrowly or broadly. Robert Ford and Wim Suyker (1990: 39), for example, define subsidies broadly as ‘instruments that have the potential to reallocate resources and have a budgetary cost’.13 This is a definition that has the potential to be very broad. Their definition, however, is narrowed by the ‘instruments’ that they include in their analysis: grants, tax concessions, soft loans, and equity participation.
Source: Clark, Pridmore and Stoney (2007: 6)
Figure 9. Statutory and effective tax rates shown in Clark, Pridmore and Stoney (2007)
1970-71 1975-76 1980-81 1985-86 1990-91 1995-96 2000-01 2005-06
50
40
30
20
10
0
%
50
40
30
20
10
0
%
Statutory tax rate
Effective tax rate

17MINING TAXES AND SUBSIDIES: OFFICIAL EVIDENCE
An extremely broad definition is employed by Christopher Riedy (2007: 4) to evaluate energy and transport subsidies within Australia (emphasis added):
In summary, an energy or transport subsidy exists where government action or inaction lowers the cost of production, raises prices received by producers, lowers prices paid by consumers or prevents full cost recovery for a service.
The italicised portions in that definition ensure that the extent of subsidy is limited only by the imagination of the analyst undertaking the quantification of the subsidy. Riedy (2007: 39), for example, argues that ‘road users experience a subsidy if total government revenue from road access and usage charges is less than the total public cost of establishing and maintaining the road network.’ He then makes the argument that in a ‘free market’ road user charges would cover all costs associated with the construction, maintenance, and operation of roads.14 At a broad level of abstraction that statement is true. The devil, however, is in the detail.
Riedy (2007: 39) defines the costs of the road network as follows: the capital cost of road network infrastructure provision, road network maintenance costs, depreciation of road network infrastructure, health and ecological costs of local air pollution associated with vehicles, costs of climate change associated with greenhouse gas emissions from the road network, loss of aesthetic values, disruption of landscape and wildlife, the cost of accidents (both direct hospital and medical costs and the cost of lost productivity), costs of increased noise, and time costs of congestion. That list is fairly comprehensive – in particular, it includes both private and social costs, and so is upwardly biased.
To deduct an estimate of all those costs from (various) road user charges biases the result in favour of finding a subsidy. If all those private and social costs are included in the analysis then any analysis that excludes all the benefits of transportation (including an estimate of consumer surplus from transportation) is seriously incomplete.
Riedy (2007) defines costs broadly and benefits narrowly (solely as direct revenue to government) and finds a transport subsidy of $7.114 billion for 2005-06. In total, he finds
subsidies of $9.3 billion to $10.1 billion. The bulk of those ‘subsidies’ are massively over-stated. The whole notion of road subsidy is driven by the fact that the government – through inaction – chooses not to operate the road network in the same manner as a private operator would.
In terms of the Bruce (1990) definition, the provision of public roads open to use by anyone with a roadworthy vehicle and a drivers licence, and financed through a series of fees, fines, and general taxation is not a subsidy at all. It could well be argued that some road users pay less for their usage of the road than do others. It is not clear, however, that this constitutes a subsidy either. The cost of introducing a mechanism to differentiate between high and low cost users of public roads may not be justified by the additional revenue.15
From this discussion it is possible to distil a check-list of features that constitute a subsidy. A subsidy can be identified in terms of the following characteristics or features.
• Is the benefit a direct benefit or an indirect benefit to a firm or industry?
• Is the benefit firm-specific or industry-specific?
•Does the subsidy involve a grant, tax concession, soft loan, or equity participation?
It is not enough to show that government provides some benefit to society, or an industry, or firm. To provide benefit is the rationale of government. A subsidy must be targeted to a specific firm or industry to the exclusion of other firms or industries and must involve an active decision making process, i.e. make use of a specific instrument.
Subsidy very often takes the form of a tax concession (expenditure); these are discussed in the next section.
Tax expenditureThe notion of tax expenditure was developed by Stanley Surrey in the late 1960s. Surrey took the view that government could influence economic behaviour either by spending money or by not taxing that behaviour. Surrey and McDaniel (1979: 228) made the argument that the taxation process consists of two components: first, defining the tax system; and second, creating exemptions to that tax

18 MINERALS COUNCIL OF AUSTRALIA
system ‘designed to favor a particular industry, activity, or class of persons’. He noted that tax subsidies ‘partake of many forms, such as permanent exclusions from income, deductions, deferrals of tax liabilities, credits against tax, or special rates’.
In theory that sounds simple – yet (again) the devil is in the detail.
As the OECD (2000: 28) concedes, ‘definitions of exactly what constitutes a “benchmark” tax system – used to identify tax expenditures as deviations from the benchmark – are controversial’. This is consistent with Douglas Kahn’s (1979:3) point:
The tax expenditure concept rests on the belief that there is a ‘correct’ definition of net income. Since the presumed purpose of a net income tax system is to require persons to bear governmental costs in proportion to their ‘ability to pay,’ the criteria used to measure net income should accurately reflect the differences in taxpayers’ abilities to pay.
The OECD (2010) defines tax expenditures as being allowances, exemptions, rate relief, tax deferral, and credits. In other words, tax expenditures are created when the actual tax system deviates from an ideal tax system to the benefit of a narrow group of taxpayers. The difficulty is in establishing the ideal tax system – especially in defining the ideal tax base. In theory, it is possible to define economic income, but in practice the tax system does not define the tax base as being economic income. An additional consideration is that the kind of taxation system that economists can imagine as being ideal is not necessarily achievable in a democracy.16
There are three different approaches to measuring the size of tax expenditure: revenue foregone, revenue gain, and equivalent outlay. The revenue foregone method is the approach most countries adopt; it measures the difference in tax paid with and without the tax expenditure item. The revenue gain approach measures how much tax paid to Treasury would increase if the tax expenditure were abolished. These two approaches are not equivalent as the second approach would have to take account of behavioural changes due to the tax increase.
This is made very clear by Colin Brown (2007: 39) when he writes:
It does not follow that, if a tax concession is abolished, tax revenue would increase by this amount because the approach does not take account of behavioural responses of the recipients of tax expenditures …
The equivalent outlay approach measures how much money the government would need to spend in order to achieve the same outcome as the tax expenditure.
It is very important to recognise, however, that these three approaches are likely to give rise to very different sized estimates of the magnitude of the tax expenditure. Furthermore, if tax expenditures are manifestation of the Surrey principle (i.e. alternate mechanisms to achieve a given aim) then the correct method of evaluating the trade-off between actual expenditure and tax expenditure is the equivalent outlay approach and not the foregone revenue approach.
Treasury seems to take a broad view that almost any revenue foregone constitutes tax expenditure. For example, Treasury includes ‘income tax exemptions’ for Commonwealth, State and Territory owned corporations and authorities. These entities, however, cannot be taxed under the Australian Constitution.
Treasury includes the tax exempt status of welfare payments as tax expenditure. For example, the tax bonus paid in April 2009 as part of the stimulus packages generates tax expenditure, payment of Family Tax Benefit Part A and B generates tax expenditure, and the Baby Bonus generates tax expenditure. Assistance to victims of natural disasters is not taxable and Treasury claims tax expenditure. Many of these items are simply being double counted.
Many types of philanthropy are also included as being tax expenditure as is the tax exempt status of many not-for-profit organisations (hospitals) and international bodies. Others are themselves a deviation from standard tax practice. For example, entertainment expenses (involving food and alcohol) are not (generally) deductible in Australia so tax expenditure is generated when it can be deducted. Yet Treasury does not include the offsetting negative tax expenditure associated with the entertainment expenditure (fringe benefits tax).
In one instance borrowing costs are described as being tax expenditure – yet interest is always

19MINING TAXES AND SUBSIDIES: OFFICIAL EVIDENCE
deductible against income for corporate tax purposes, as is building regional corporate headquarters and many types of depreciation that Treasury claims to be variations from normal tax practice. As these examples make clear, the inclusion or exclusion of items is likely to be somewhat arbitrary.
Mining subsidies and tax expenditures: Official dataAs a major off-road user of diesel fuel, the mining industry is the single largest user of the fuel tax credit scheme. In 2010-11, the industry claimed $2 billion compared to the second largest user Transport, postal and warehousing at $988 million.
Excise on diesel was introduced in 1957 to help fund the development and maintenance of public roads. In line with the policy intent, diesel excise was only applied to on-road uses of diesel and a scheme was set up to provide an exemption of excise for all off-road users of diesel fuel. This was replaced in 1982 by the original Diesel Fuel Rebate scheme in response to what was seen as a certificate system too open to anomalies and abuse.17
Since that time farmers, miners, and other users have paid excess tax upfront – first with the rebate, and later with the fuel tax credit scheme
– as a means of removing anomalies and easing administrative problems for government.
It is important to recognise that fuel tax credits are an economy-wide scheme and as such do not constitute an industry-specific subsidy. Neither Treasury nor the Productivity Commission recognises the fuel tax credit scheme as being government assistance or a tax subsidy.
The Treasury view of Fuel Tax Credits was recently explained in documents released under Freedom of Information laws (Treasury 2012b). Here Treasury was repeating the argument set out in the Fuel Tax Inquiry Report (2002b: 93 – 96).
Fuel tax credits are paid to reduce or remove the incidence of fuel tax on business, ensuring that, generally, fuel tax is effectively only applied to fuel used in private vehicles and for certain other private purposes. However, as business and consumer use of light vehicles cannot effectively be distinguished, fuel used on-road in vehicles equal to or less than 4.5 tonnes for business purposes is also not entitled to a credit. Fuel tax credits
are therefore not a subsidy to businesses but, consistent with Government policy, it is a mechanism to ensure that, where possible, the incidence of fuel tax does not add to business costs but is levied on final consumers.
As Treasury made clear in the FOI documents, ‘This is consistent with Australia’s tax system more broadly, where consumption taxes are intended to apply to final consumption (rather than business inputs).’ These Treasury statements were in the context of the Australian Government submission to the G20 stating that Australia ‘does not provide significant budgetary or other sectoral assistance to the [fossil fuel] industry’. The Australian Government further declared (G20 2010: 7):
Australia does not have any sector-specific tax expenditures for fossil fuel production (although fossil fuel producers are able to access general measures that apply across the economy or across the mining and quarrying sector as a whole).
That statement to the G20 is definitive – while general tax expenditures may exist, Australia does not have ‘sector-specific tax expenditures for fossil fuel production’. Again, that raises the question of whether a general provision of the tax law, or a subsidy that everyone can access is really a subsidy at all.
It should be further noted that in Treasury’s Tax Expenditure Statement for 2011 (Treasury 2012c: 11) the ‘Mining, Manufacturing and Construction’ category generates negative tax expenditure of $1.75 billion. In other words, deviations from the ‘idealised’ tax system generate additional revenue, not a loss of revenue.
That increase in revenue is driven by levying customs duty on imported equipment (Treasury 2012c: 184). Even if tax expenditure in the ‘Fuel and Energy’ category ($1.66 billion) is taken into account the net tax expenditure would still amount to a revenue gain. Figure 10 shows tax expenditure data broken into certain categories, with the two largest single categories of tax expenditure (Housing and Superannuation) compared with Mining, Manufacturing and Construction.

20 MINERALS COUNCIL OF AUSTRALIA
The Productivity Commission undertakes a similar activity in its Trade and Assistance Review. This is a much broader exercise than simply estimating tax expenditure. Industry assistance is defined as (PC 2011: 1):
… any act that, directly or indirectly, assists a person to carry on a business or activity, or confers a pecuniary benefit on, or results in a pecuniary benefit to, a person in respect of carrying on a business or activity.
The Productivity Commission attempts to value the sum of government assistance to industry via ‘tariffs, budgetary outlays, taxation concessions, regulatory restrictions on competition and other measures’ (PC 2011: xiv). It is important to note, however, that the Productivity Commission does not attempt to value inaction. According to the Productivity Commission (2011: 90), the net government
assistance to mining in 2009-10 was $242 million. That includes revenue from the imposition of customs duty on the importation of equipment (i.e. negative net tariff assistance).
Figure 11 shows a comparison of the Productivity Commission estimates of net government assistance to all industries. As can be seen the single largest beneficiary of government assistance is manufacturing, while services appears to be a net ‘loser’ – that is due to negative tariff assistance (i.e. government is earning revenue from the sector). Of the sectors that receive some government benefit, the mining sector is the smallest beneficiary. Or as Treasury (2012a) put it in the FOI documents recently, ‘Notably, the most recent Productivity Commission Trade and Assistance Review found that the effective rate of assistance provided to the mining sector was negligible’.
Source: Tax Expenditure Statement 2011: Table 1.1 and Table 1.4
Figure 10. Tax expenditure (2007-08 to 2014-15)
70,000
60,000
50,000
40,000
30,000
20,000
10,000
0
-10,000
$ m
illio
n
■ Housing ■ Superannuation ■ Other ■ Mining, Manufacturing and Construction
2007-08 2008-09 2009-010 2010-11 2011-12 2012-13 2013-14 2014-15

21MINING TAXES AND SUBSIDIES: OFFICIAL EVIDENCE
Estimates of budgetary assistance by industry are shown in Figure 12. Mining receives around 7% of the total, significantly less than other industry groups. Government budgetary assistance to mining of $549.1 million in turn can be broken up into actual outlays of $132.2 million and tax expenditure of $416.9 million. Hence, the tax expenditure dominates government assistance.
The Productivity Commission further breaks down the data into industry-specific measures,
sector-specific measures, general investment measures, general R&D measures, and other. Many of the specific items identified are government programs that are allocated to mining. For example, the industry-specific category includes the greenhouse gas abatement program, National Low Emissions Coal Initiative and the Renewable Energy Development Initiative. The general R&D category includes government expenditure on Cooperative Research Centres, the CSIRO, and general R&D programs.
Source: Productivity Commission (2011: 90)
Figure 11. Net government assistance by broad industry grouping, 2004-05 to 2009-10
2004-05 2005-06 2006-07 2007-08 2008-09 2009-10
10,000
8000
6000
4000
2000
0
-2000
-4000
$ m
illio
n
■ Primary production ■ Mining ■ Manufacturing ■ Services ■ Unallocated other
■ Primary production
■ Mining
■ Manufacturing
■ Services
■ Unallocated other
Figure 12. Budgetary assistance by broad industry grouping, 2009-10
Source: Productivity Commission (2011: 89)
46%
5% 19%
7%
23%

22 MINERALS COUNCIL OF AUSTRALIA
It could be argued that sector-specific measures directly benefit the mining industry. This component, however, includes a single item - capital expenditure deduction for mining. This tax expenditure is for accelerated depreciation to the industry, but is not a large sum of money. It makes up a small and declining component of government assistance. The inclusion of accelerated depreciation as a tax expenditure item, however, is controversial. As Kahn (1979: 57-58) argues straight-line depreciation is an arbitrary convention and:
… depreciation should reflect the amount the taxpayer expends for the use of the asset during that year. An allocation of the actual cost is at least a proper method of depreciation, and, in my view, is a more accurate measurement of net income than straight line depreciation. Because accelerated depreciation is an accurate and appropriate method of allocating cost, a number of current tax laws and practices, including the recapture of depreciation provisions and the Tax Expenditure
Budget items for depreciation, should be eliminated or revised.
To the extent that the tax system attempts to establish tax liability in accordance with an ability to pay, Kahn argues that accelerated depreciation is not a deviation from an ‘ideal tax system’.
Spending on the CSIRO and R&D tax concessions make up the largest component of government assistance to the mining industry. Various R&D tax concessions make up $424 million of the total $549 million that the Productivity Commission identifies as government assistance to the mining industry in 2009-10.
The bottom line is that official government estimates of subsidy or government assistance to the mining industry are small. Treasury estimates a positive contribution to revenue once all tax expenditure is taken into account; the Productivity Commission estimates are small too once we take into account general government programs that would occur anyway.
Source: Productivity Commission (2011: 102-103), Author’s calculations.
■ Industry-specific measures■ Sector-specific measures
■ General export measures■ General investment measures
Figure 13. Specific shares of government assistance to mining
2004-05 2005-06 2006-07 2007-08 2008-09 2009-10
100
90
80
70
60
50
40
30
20
10
0
%
■ General R&D measures■ Other measures

23MINING TAXES AND SUBSIDIES: OFFICIAL EVIDENCE
Mining subsidies and tax expenditures: Lobby group claimsOfficial statistics are very different from claims made by lobby groups as to the size of ‘fossil fuel subsidies’. We have already seen that the definitions of these subsidies are extremely broad. Riedy (2007) identifies up $10.3 billion of energy and transport subsidies in 2005-06. Of that, $2 billion are identified as coal subsidies, $7 billion as oil subsidies, and almost $380 million as gas subsidies (2007: 56).
The coal subsidies that Riedy (2007) identifies relate to electricity generation. He makes the argument that ‘electricity generation costs for Australian utilities were significantly less than international costs’ (2007: 13). This is due to Australian coal-fired generators paying less than international market prices for their coal. As evidence of this argument Riedy (2007: 13-14) points to an unpublished Master’s thesis completed at the University of New South Wales in 2004 (Birch 2004). The author of that thesis – Andrew Birch – determined on the basis of ‘private disclosures’ and ‘private conversations’ that ‘government intervention has ensured the provision of coal to [electricity] generators at discounted prices’ (Riedy 2007: 14). If true, this does constitute a subsidy to electricity generators – it does not, however, constitute a subsidy to the mining industry. Quite the contrary, to the extent that Australian coal miners are required through some undisclosed government intervention to provide coal to Australian electricity generators at below world prices this is a form of taxation levied on Australian coal miners.
Other subsidies that Riedy (2007) identifies include items such as non-recovery of government agency costs and R&D subsidies. The Productivity Commission also identifies R&D as industry assistance though these tend to be subsidies promoting R&D more generally, not simply mining R&D. Other subsidies that Riedy identifies overlap with later Australian Conservation Foundation analysis and are discussed below. Overall the Riedy (2007) estimates – as argued above – are over-inflated.
The Australian Conservation Foundation has estimated fossil fuel subsidies to be $12.2 billion in 2010-11.18 Of that, $8.2 billion is made up of two items –fuel tax credits and the lack of indexation of fuel excise. Those two items apply generally across the economy.
The Australian Conservation Foundation identifies one mining specific deduction – the exploration and prospecting deduction comprising some $150 million. Then there are other mining related items - depreciation concessions for fossil fuel-intensive assets and the condensate exemption.19 Those two items add up to $1.5 billion. The condensate exemption, however, ends in 2012-13. The depreciation concession relates to statutory effective life caps for a range of assets. Treasury (2012c: 108) provides a combined figure for assets used in the oil and gas industries but also includes aircraft, trucks, buses, light commercial vehicles, tractors and harvesters. This figure contains a whole range of activity that may not be related to mining.
Matt Grudnoff (2012: 2) writing for The Australia Institute claims that the mining industry receives a subsidy of more than $4 billion per year from the federal government alone. That figure is made up by combining Treasury tax expenditure data, Productivity Commission government assistance data and fuel tax credits. Tax expenditure data for capital works expenditure and effective life caps expenditure was pro-rata allocated to mining.20 Going forward, that figure of $4 billion is over-stated as the crude oil excise – condensate tax expenditure ends in July 2012. Grudnoff also includes the gross Productivity Commission figure of $549 million for government assistance to the mining industry and not the net figure of $242 million. He also neglects to explain that a very large portion of the subsidy to mining consists of CSIRO and R&D expenditure.
As the above discussion highlights, the deeming by groups such as The Australia Institute and the Australian Conservation Foundation of fuel tax credits as a ‘subsidy’ to the mining industry is not supported in any official research on industry assistance by either Treasury or the Productivity Commission. Even more notable, perhaps, is that it is not supported either by Riedy (2003, 2007) whose work has sought to quantify fossil fuel subsidies on behalf of green lobby groups.
In a 2003 Working Paper, Riedy (2003: 16) recognises the rationale of the (then) Diesel Fuel Rebate Scheme (DFRS) as ensuring that ‘off-road use of diesel fuel should be exempt from duty as the revenue collected through duty is used to fund roads, which

24 MINERALS COUNCIL OF AUSTRALIA
are not used by off-road users’. He in turn cites the conclusion of a 1996 study by the National Institute of Economic and Industry Research that the DFRS ‘should not be seen as a financial subsidy’ and Riedy (2003) accordingly does not classify the rebate as a subsidy or incentive for fossil fuel use.
Importantly Riedy (2007: 34), in a Greenpeace-commissioned update of Riedy (2003), affirms his earlier conclusion
– whatever the administrative form, the long-standing tax arrangements for off-road use of diesel ‘should not be seen as a financial subsidy’. Hence the campaign to scrap access by miners to the fuel tax credit scheme is not even well grounded in primary research by those keen to identify ‘fossil fuel subsidies’.
In summary, it is not hard to point to government action that directly and indirectly benefits the mining industry. It is also easy to point to various tax concessions that the mining industry enjoys. Yet on closer analysis it turns out that most of those tax concessions apply generally across the economy.
Tax concessions that specifically apply to mining are quite small. To withdraw general tax concessions from the mining industry would constitute an increase in taxation for the industry. To use the language of tax expenditure – it would not constitute a reduction in tax expenditure but rather increased negative tax expenditure.
ConclusionThe mining industry pays a lot of tax and pays close to the statutory rate of 30% of its taxable income in corporate income tax. The mining industry is not the beneficiary of special measures that substantially reduce its tax burden. The view that the mining industry is under-taxed is not supported by data published by the ATO – the government agency that administers the tax system and actually collects the tax revenue.
Estimates of subsidies to the mining industry range from about $4 billion each year to as high as $10 billion. Most of these claims are limited solely by the imagination of the analyst undertaking the analysis. Official estimates by Treasury and the Productivity Commission are much lower and reflect features of the tax system that mostly apply across the whole economy. Hence the mining industry is not the beneficiary of large amounts of government subsidy or special privilege. ■

25MINING TAXES AND SUBSIDIES: OFFICIAL EVIDENCE
Australia’s future tax system (The Henry Review). 2009. Part Two Detailed analysis volume 1 of 2, Commonwealth of Australia.
Birch, A. 2004. ‘The Market Economic Cost of Electricity Generation and the Economic Viability of Photovoltaics’, Master of Engineering Science thesis, University of New South Wales.
Brown, C. 2007. Treasury costings of taxation policy. Economic Roundup, Winter, pp 29 – 48.
Bruce, N. 1990. ‘Measuring industrial subsidies: Some conceptual issues’, OECD Department of Economics and Statistics, OECD, Paris.
Buchanan, J. 1974. ‘Democratic values in Taxation’, Reproduced in The Collected Works of James M. Buchanan, Volume 14 (Indianapolis: Liberty Fund, 1999).
Clark, J., P. Greagg and A. Leaver. 2011. ‘Average rates of company tax across industries revisited’, Economic Roundup, September, pp 157 – 167.
Clark, J., B. Pridmore and N. Stoney. 2007. ‘Trends in aggregate measures of Australia’s corporate tax level’, Economic Roundup, Winter, pp 1 – 28.
Demsetz, H. 1969. ‘Information and efficiency: Another viewpoint’, Journal of Law and Economics. Reproduced in Harold Demsetz, 1989, Efficiency, Competition and Policy, Oxford, Basil Blackwell.
Ergas, H. 2012. ‘They are at it again’, The Australian, 10 March, available as http://blogs.theaustralian.news.com.au/henryergas/index.php/theaustralian/comments/they_are_at_it_again/
Ford, R. and W. Suyker. 1990. ‘Industrial subsidies in the OECD economies’, OECD Economic Studies, 15: 37 – 81.
Fuel Tax Inquiry. 2002a. ‘History of Fuel Taxation in Australia’, Commonwealth of Australia. Available at http://fueltaxinquiry.treasury.gov.au/content/backgnd/download/002.pdf
Fuel Tax Inquiry. 2002b. ‘Fuel Tax Inquiry Report’, Commonwealth of Australia. Available at http://fueltaxinquiry.treasury.gov.au/content/report/default.asp
G20. 2010. ‘Annex: G20 Initiative on Rationalizing and Phasing Out Inefficient Fossil Fuel Subsidies, Implementation Strategies & Timelines’. Available at http://priceofoil.org/wp-content/uploads/2011/01/USSubmissionG20.pdf.
Greagg, P., D. Parham and P. Stojanovski. 2010. ‘Disparities in average rates of tax across industries’, Economic Roundup, Winter, pp 91 – 103.
Grudnoff, M. 2012. ‘Pouring Fuel on the Fire: The nature and extent of Federal Government subsidies to the mining industry’, The Australia Institute, Policy Brief No. 38, April 2012.
Kahn, D. 1979. ‘Accelerated Depreciation: Tax Expenditure or Proper Allowance for Measuring Net Income?’, Michigan Law Review, 78(1):1 – 58.
Mann, S. and P. Coorey. 2010. Researcher says 17% tax rate was ‘out of context’, The Age, May 25, available at http://www.theage.com.au/business/researcher-says-17-tax-rate-was-out-of-context-20100524-w83b.html.
Markle, K and D. Shackelford. 2009. ‘Do multinationals or domestic firms face higher effective tax rates?’, NBER Working Paper Series, no. 15091.
OECD. 2000. Tax burdens: Alternative measures, OECD Tax Policy Studies, No. 2.
OECD. 2010. Tax expenditures in OECD Countries, OECD, Paris.
Parkinson, M. 2012. ‘Introductory Remarks’, Australia-Israel Chamber of Commerce, 7 March 2012. Available at
http://www.treasury.gov.au/documents/2340/HTML/docshell.asp?URL=AICC_charts.htm.
Productivity Commission. 2011. Trade and Assistance Review 2009-10, Annual Report Series, Canberra.
Richardson, D. and R. Denniss. 2011. Mining the truth: The rhetoric and reality of the commodities boom. The Australia Institute. Institute Paper no. 7.
Riedy, C. 2003. ‘Subsidies that Encourage Fossil Fuel Use in Australia’, Working Paper CR2003/01, Institute for Sustainable Futures, University of Technology, Sydney.
Riedy, C. 2007. ‘Energy and Transport Subsidies in Australia: 2007 Update. Final Report for Greenpeace Australia Pacific’, Institute for Sustainable Futures, University of Technology, Sydney.
Surrey, S. and P. McDaniel. 1979. ‘The Tax Expenditure Concept: Current Developments and Emerging Issues’, Boston College Law Review, 20(2) 225 – 369.
Swan, W. 2012. ‘The revenue base and the 2012 Budget’, Address to the Australian Business Economists’ breakfast, 29 March 2012. Available at
http://ministers.treasury.gov.au/wmsDisplayDocs.aspx?doc=speeches/2012/006.htm&PageID=003&min=wms&Year=&DocType=1
Treasury. 2012a. ‘8 - Draft Response - Ministerial’, G20 Commitments on fossil fuel subsidies, FOI Disclosure Log, Treasury.gov.au.
Treasury. 2012b. ‘15 - Pre Budget Submission’, G20 Commitments on fossil fuel subsidies, FOI Disclosure Log, Treasury.gov.au.
Treasury. 2012c. Tax Expenditures Statement 2011, January.
Bibliography

26 MINERALS COUNCIL OF AUSTRALIA
Endnotes
1 Government GOS is defined as consumption of fixed capital in ABS Cat. 5204.0 (Table 47) and as Government GOS in ABS Cat. 5206.0 (Table 7).
2 There is a slight complication – when talking about mining the Treasurer refers initially to gross operating profit, not gross operating surplus. While the ABS does provide gross operating profit data (ABS Cat. 5676.0), in the rest of the speech the Treasurer talks about surplus not profit. The key diagram he presents refers to surplus not profit and the ABS reference provided refers to surplus not profit.
3 See Chart 5 of the Treasurer’s speech for a time-series of the company tax to GOS ratio.
4 Earlier data are available but for ease of comparison only the last six years are shown.
5 Unfortunately the number of industries has not remained constant over time introducing a slight bias in the early years – the standard deviation for those years is likely to be slightly larger.
6 Royalties are paid to the Commonwealth for offshore gas and petroleum extraction.
7 The Australian Bureau of Agricultural and Resource Economics and Sciences (ABARES) report the same number. Subsequent unpublished ABS data indicate a slightly lower figure at $6.5 billion.
8 Provided by Access Economics via the Minerals Council of Australia.
9 Clark, Pridmore and Stoney (2007), Greagg, Parham and Stojanovski (2010), and Clark, Greagg and Leaver (2011).
10 The result for their ‘Other’ category is not shown – it is not clear what that category represents. I also assume that their category ‘Communication services’ is the ATO category ‘Information, Media and Telecommunications’.
11 The results are shown in Markle and Shackelford (2009: 44) Table 4. The correct interpretation is to read up and down the columns, not across the rows. Each column represents a different regression.
12 Kevin Markle subsequently told The Age newspaper, ‘I think the bottom line is that it sounds like … people are over-reaching on what the paper purports to do’ (Mann and Coorey 2010).
13 I point to this definition as the paper, like Bruce (1990), is an OECD document and cites Bruce (1990).
14 There is always some difficulty in establishing what would happen in a ‘free market’ where none exists. What would a ‘free market’ in roads actually look like? Economists engaging in this type of analysis often fall into the nirvana fallacy (see Demsetz 1969). Comparing a real world situation to an unspecified, idealised free market is fraught.
15 A potentially similar situation exists in the GST exemption for imported goods under the value of $1000. According to the 2011 Tax Expenditures Statement this exemption incurs foregone revenue of $630 million in 2011–12.
16 See James M. Buchanan (1974) for a discussion of this point. Kahn (1979: 4) also stresses this point.
17 For a history of fuel taxation see Fuel Tax Inquiry Report (2002a).
18 http://www.acfonline.org.au/news-media/releases/australia-spends-11-billion-more-encouraging-pollution-cleaning-it
19 The ACF reports $915 million as the depreciation concession in 2010-11 – that figure is taken from the Treasury Expenditure Statement for 2010. In 2011 it had been revised upwards to $925 million.
20 An Australian Institute report published in 2011 (Richardson and Denniss 2011: 36) had indicated, ‘It is not clear, however, what proportion of this concession accrues to oil and gas assets’.

27MINING TAXES AND SUBSIDIES: OFFICIAL EVIDENCE

MINERALS COUNCIL OF AUSTRALIALevel 3, 44 Sydney Ave, Forrest ACT 2603PO Box 4497, Kingston ACT Australia 2604P. + 61 2 6233 0600 | F. + 61 2 6233 0699w. www.minerals.org.au | E. [email protected]


![Fat Taxes and Thin Subsidies: Prices, Diet, and Health ...scash/thinsubsidy_1005.pdf · California, USA]. Fat taxes and thin subsidies: Prices, diet, and health outcomes. Food Economics](https://img.dokumen.tips/doc/110x75/5ed1a9eb933664342957170d/fat-taxes-and-thin-subsidies-prices-diet-and-health-scashthinsubsidy1005pdf.jpg)