Embed Size (px)
Citation preview

1
Mining, Indexing, and Similarity Search in Graphs and Complex Structures
Jiawei Han Xifeng YanDepartment of Computer Science
University of Illinois at Urbana-Champaign
Philip S. YuIBM T. J. Watson Research Center
� � � � � � � � � � � � � � � � � � � � � � � � � � � � � � � � � � � � � � � �
Outline� Scalable pattern mining in graph data sets
� Frequent subgraph pattern mining � Constraint-based graph pattern mining� Graph clustering, classification, and compression
� Searching graph databases� Graph indexing methods� Similarity search in graph databases
� Application and exploration with graph mining � Biological and social network analysis� Mining software systems: bug isolation & performance tuning
� Conclusions and future work

2
� � � � � � � � � � � � � � � � � � � � � � � � � � � � � � � � � � � � � � � �
Why Graph Mining and Searching?� Graphs are ubiquitous
� Chemical compounds (Cheminformatics)� Protein structures, biological pathways/networks (Bioinformactics)� Program control flow, traffic flow, and workflow analysis � XML databases, Web, and social network analysis
� Graph is a general model� Trees, lattices, sequences, and items are degenerated graphs
� Diversity of graphs� Directed vs. undirected, labeled vs. unlabeled (edges & vertices),
weighted, with angles & geometry (topological vs. 2-D/3-D)
� Complexity of algorithms: many problems are of high complexity
� � � � � � � � � � � � � � � � � � � � � � � � � � � � � � � � � � � � � � � �
Graph, Graph, Everywhere
��� � � � � ! " # $ %'& ( ) % " * +,* + % " ( # - % * ) +.+ " % /0) ( 12 3456 78 94:;9< => ? =< @39ABB CABD EFFBG
H I JK� J I L ) M # N % O ) ( + " % /0) ( 1

3
� � � � � � � � � � � � � � � � � � � � � � � � � � � � � � � � � � � � � � � �
Graph Pattern Mining
� Frequent subgraphs� A (sub)graph is frequent if its support (occurrence frequency) in
a given dataset is no less than a minimum support threshold
� Applications of graph pattern mining� Mining biochemical structures� Program control flow analysis� Mining XML structures or Web communities� Building blocks for graph classification, clustering, compression,
comparison, and correlation analysis
� � � � � � � � � � � � � � � � � � � � � � � � � � � � � � � � � � � � � � � �
Example: Frequent Subgraphs
(a) caffeine (b) diurobromine (c) viagra
CHEMICAL COMPOUNDS
FREQUENT SUBGRAPH
…

4
� � � � � � � � � � � � � � � � � � � � � � � � � � � � � � � � � � � � � � � �
Example (II)
1
3
4
5
2 1: makepat 2: esc 3: addstr 4: getccl 5: dodash 6: in_set_2 7: stclose
(1)
1
3
4
5
2
1
3
4
5
2
6
7
(2) (3)
1
3
4
5
2
(1)
3
4
5
2
(2)
GRAPH DATASET
FREQUENT PATTERNS(MIN SUPPORT IS 2)
� � � � � � � � � � � � � � � � � � � � � � � � � � � � � � � � � � � � � � � �
Graph Mining Algorithms
� Incomplete beam search – Greedy (Subdue)� Inductive logic programming (WARMR)� Graph theory based approaches
� Apriori-based approach� Pattern-growth approach

5
� � � � � � � � � � � � � � � � � � � � � � � � � � � � � � � � � � � � � � � �
SUBDUE (Holder et al. KDD’94)
� Start with single vertices� Expand best substructures with a new edge� Limit the number of best substructures
� Substructures are evaluated based on their ability to compress
input graphs� Using minimum description length (DL)� Best substructure S in graph G minimizes: DL(S) + DL(G\S)
� Terminate until no new substructure is discovered
� � � � � � � � � � � � � � � � � � � � � � � � � � � � � � � � � � � � � � � � �
WARMR (Dehaspe et al. KDD’98)
� Graphs are represented by Datalog facts� atomel(C, A1, c), bond (C, A1, A2, BT), atomel(C, A2, c) : a
carbon atom bound to a carbon atom with bond type BT
� WARMR: the first general purpose ILP system� Level-wise search� Simulate Apriori for frequent pattern discovery

6
� � � � � � � � � � � � � � � � � � � � � � � � � � � � � � � � � � � � � � � � �
Frequent Subgraph Mining Approaches� Apriori-based approach
� AGM/AcGM: Inokuchi, et al. (PKDD’00)� FSG: Kuramochi and Karypis (ICDM’01)� PATH#: Vanetik and Gudes (ICDM’02, ICDM’04)� FFSM: Huan, et al. (ICDM’03)
� Pattern growth approach� MoFa, Borgelt and Berthold (ICDM’02)� gSpan: Yan and Han (ICDM’02)� Gaston: Nijssen and Kok (KDD’04)
� � � � � � � � � � � � � � � � � � � � � � � � � � � � � � � � � � � � � � � � �
Properties of Graph Mining Algorithms
� Search order� breadth vs. depth
� Generation of candidate subgraphs� apriori vs. pattern growth
� Elimination of duplicate subgraphs� passive vs. active
� Support calculation� embedding store or not
� Discover order of patterns� path
�tree
�graph

7
� � � � � � � � � � � � � � � � � � � � � � � � � � � � � � � � � � � � � � � � �
Apriori-Based Approach
�
�������
���
"! #"$&%&#(' &)+*-,.! #"$&%&#
��/
��/ /0-132"4
� � � � � � � � � � � � � � � � � � � � � � � � � � � � � � � � � � � � � � � � 5
Apriori-Based, Breadth-First Search
6 AGM (Inokuchi, et al. PKDD’00) 7 generates new graphs with one more node
+
6 Methodology: breadth-search, joining two graphs
6 FSG (Kuramochi and Karypis ICDM’01)7 generates new graphs with one more edge
+

8
� � � � � � � � � � � � � � � � � � � � � � � � � � � � � � � � � � � � � � � � �
PATH (Vanetik and Gudes ICDM’02, ’04)
� Apriori-based approach� Building blocks: edge-disjoint path
����� � � "!$# % '&'( ) � ( * )+# , - .�# / %� � % ,
021 35476 8 9 :+1 8"; 9 <+=>:+<54+8"?+@+8 A76021 35476 8 9 :+1 8"; 9 <+=>:+<54+8CB>9 @D?DA76FEHG 8 AI <7JDBD<7K J>G 6 L 35G 4+8'?+@78 A76
021 35476 8 9 :+1 8"B>9 @5?DA76FEHG 8 ANM+OFP<+JDBD<DK J>G 6 L 35G 4+8'?7@+8 AD6F; 9 3>QB>9 @5?DA76FEHG 8 ANMH<+J7B5<7K JRG 6 L 3>G 4+8?+@+8 A76
0S9 <D?7<+@+8
� � � � � � � � � � � � � � � � � � � � � � � � � � � � � � � � � � � � � � � � T
FFSM (Huan, et al. ICDM’03)
� Represent graphs using canonical adjacency matrix (CAM)
� Join two CAMs or extend a CAM to generate a new graph
� Store the embeddings of CAMsU All of the embeddings of a pattern in the databaseU Can derive the embeddings of newly generated CAMs

9
� � � � � � � � � � � � � � � � � � � � � � � � � � � � � � � � � � � � � � � � �
Pattern Growth Method
������� � �!�"�$#&% ' ( �*)+� � ,
�-)+.0/$( �1�$#0% ' ( �*)�� ��,
� � � � � � � � � � � � � � � � � � � � � � � � � � � � � � � � � � � � � � � � 2
MoFa (Borgelt and Berthold ICDM’02)
3 Extend graphs by adding a new edge3 Store embeddings of discovered frequent graphs
4 Fast support calculation4 Also used in other later developed algorithms such as
FFSM and GASTON4 Expensive Memory usage
3 Local structural pruning

10
� � � � � � � � � � � � � � � � � � � � � � � � � � � � � � � � � � � � � � � � �
Duplicate Graphs
� ��� ����� �
! � ����� �
� � � � � � � � � � � � � � � � � � � � � � � � � � � � � � � � � � � � � � � " #
Free Extension
$%$'&)(+*-,/. 02123)4
5 �6�6��� �
7
89� �6�:� �

11
� � � � � � � � � � � � � � � � � � � � � � � � � � � � � � � � � � � � � � � � �
Right-Most Extension
depth-first search
������� �"! #%$%&�'
(*),+.-/) 0
right-most path1 2 354 2 6/7,8
� � � � � � � � � � � � � � � � � � � � � � � � � � � � � � � � � � � � � � � � �
GSPAN (Yan and Han ICDM’02)
9;: �"&=<,>5?A@%'B<DCFE=< �%��'�: @G�
H"&��=@G! �%I�J=K;L*MON"P Q%R,Q;S�Q%TFT
H"&��UC=�GVGIW�G! #�<.: @G�W@=XZY[! #%$%&�'V�'�: ����9;: �"&=<,>.IW@�'/<DCFE=<,�%��'�: @G�\: '
]G^ ?`_"a�CFH;C

12
� � � � � � � � � � � � � � � � � � � � � � � � � � � � � � � � � � � � � � � � �
Graph Sequentialization����������� !��"�" ��#%$�" � �'&)( *+(-, $�.0/2143!56 7�'8+� �'&
&+9 ��:�;<$'8�&�$=(7$'>+?�$��' 7$@4�'��" (�/BA�C+���D*6:�9 $%E � F=�%E2�= 7��������� !��"�" ��#%$�"�� (G 7���'����� 7��"
HIC�E ��" " �%JK9 � &+;%,4.=�'(7,B$DF�, $���(!� �+�
� � � � � � � � � � � � � � � � � � � � � � � � � � � � � � � � � � � � � � � � L
DFS Coding & Labelling
M-N%O P�QRM P�O S�QRM S�O NDQRM S�O T+QRM TIO NDQUM S�O V'Q
DFS coding: flatten a graph into a sequence based on depth-first search
8�$�:D, ;WE � 9 (-,4(7$'��9 D;
XYZ[]\
XYZ[ \

13
� � � � � � � � � � � � � � � � � � � � � � � � � � � � � � � � � � � � � � � � �
DFS Lexicographic Order
� Let Z be the set of DFS codes of all graphs. Two DFS codes a and b have the relation a<=b (DFS Lexicographic Order in Z) if and only if one of the following conditions is true. Let
a = (x0, x1, …, xn) and b = (y0, y1, …, yn),
xk=yk for all k, s.t. 0<= k<= m and m <= n.(ii)
if there exists t, 0<= t <= min(m,n), xk=yk for all k, s.t. k<t, and xt < yt
(i)
� � � � � � � � � � � � � � � � � � � � � � � � � � � � � � � � � � � � � � � � �
DFS Code Extension
� Let a be the minimum DFS code of a graph G and b be a non-minimum DFS code of G. For any DFS code dgenerated from b by one right-most extension,
min_dfs(d) is either less than a or can be extended from a.(iii)
min_dfs(d) cannot be extended from b, and(ii)
d is not a minimum DFS code,(i)
����� �"!#�%$&('*),+�-/.10 2*34)52*687:9%; 74< '")*= > )4?@34)*316 ; 2%AB7CD2 ?4E A"F ?4F A:GDAH+�- .10 2*34),F I:C%J8&LKNM C%M K�O�K

14
� � � � � � � � � � � � � � � � � � � � � � � � � � � � � � � � � � � � � � � � �
GASTON (Nijssen and Kok KDD’04)
� Extend graphs directly� Store embeddings� Separate the discovery of different types of graphs
� path �
tree �
graph� Simple structures are easier to mine and duplication detection is
much simpler
� � � � � � � � � � � � � � � � � � � � � � � � � � � � � � � � � � � � � � � � �
Graph Pattern Explosion Problem
� If a graph is frequent, all of its subgraphs are frequent �
the Apriori property
� An n-edge frequent graph may have 2n subgraphs
� Among 423 chemical compounds which are confirmed to
be active in an AIDS antiviral screen dataset, there are
around 1,000,000 frequent graph patterns if the
minimum support is 5%

15
� � � � � � � � � � � � � � � � � � � � � � � � � � � � � � � � � � � � � � � � �
Closed Frequent Graphs
� Motivation: Handling graph pattern explosion problem
� Closed frequent graph� A frequent graph G is closed if there exists no supergraph of G
that carries the same support as G
� If some of G’s subgraphs have the same support, it is
unnecessary to output these subgraphs (nonclosed
graphs)
� Lossless compression: still ensures that the mining result
is complete
� � � � � � � � � � � � � � � � � � � � � � � � � � � � � � � � � � � � � � � � �
CLOSEGRAPH (Yan & Han, KDD’03)
�
A Pattern-Growth Approach
�
���
�!
�#"
$&% '&(*)+'
, $*-/.&0 % ' (1)1'2/354�6878359*:<;8=<> 3 > :<;8?@917A;#4CBD 3 :<E D B@7AF 9+6<> ;8G�3 6@BA> F/9H6A> I =<F B<;
> J BAJ ? B87@F I K!3 B@F L�> ;8783 > :<;AM
N O<PRQ+S*T#P<U&QHV WXO V W*Y@Z*W+S*[ \@P^] _`Q_ Z+a*b@V Q+cHdfe+OAP<U gCN O > ;!7A;8K#EH7<F 3:@h/3 68B#G<F 7AE@6i> ;!3 68B#=@7@3 7 D B@34#6@BAF B�j^:A9*9+kAF D ?@j`l+7AI D ::@9*9+kAF D \8[ d*W+SXm`W!S*W*W1T#S1e1[Ab8V e1mP<\@_ ] S*n WCS1eHS*WXe1O<P<U _`n&dH] o T8V W+SXmp] o oa*WXn&o e+_ W1TCW1q&n WHc*[<[ d1e+_ WXe1O/P<U g

16
� � � � � � � � � � � � � � � � � � � � � � � � � � � � � � � � � � � � � � � � �
Handling Tricky Exception Cases
(graph 1)
a
c
b
d
(pattern 2)
(pattern 1)
(graph 2)
a
c
b
d
a b
a
cd
� � � � � � � � � � � � � � � � � � � � � � � � � � � � � � � � � � � � � � � � �
Experimental Result� The AIDS antiviral screen compound dataset
from NCI/NIH� The dataset contains 43,905 chemical
compounds� Among these 43,905 compounds, 423 of them
belong to CA, 1081 are of CM, and the
remainings are in class CI

17
� � � � � � � � � � � � � � � � � � � � � � � � � � � � � � � � � � � � � � � � �
Discovered Patterns
N
N
S
OH
S
HOO
O
N
N
O
O
OHO
N
N+
NH
N
O
N
HOOH
ON
O
N
20% 10%
5%
� � � � � � � � � � � � � � � � � � � � � � � � � � � � � � � � � � � � � � � � �
Performance (1): Run Time
��� ��� �����! "��#$#&%�' (*)+� �-,/.
0 1234 5676 879336 82
: 5;6<=

18
� � � � � � � � � � � � � � � � � � � � � � � � � � � � � � � � � � � � � � � � �
Performance (2): Memory Usage
��� ��� �����! "��#$#&%�' (*)+� ��,.-
/ 01234567809 :;<
� � � � � � � � � � � � � � � � � � � � � � � � � � � � � � � � � � � � � � � � =
Number of Patterns: Frequent vs. Closed
CA
>@? A$B@C�A&D
>@? A$B@C�A"E
>@? A$B@C�A@F
>@? A$B@C�A&G
>@? A$B@C�A"H
A&? AIGJA&? A&HKA&? A&LMAI? A@NOAI? >
P Q RTS"UVR@W+X$Y&Q Z\[\]T^_+` a ^bRVcdP Q RVS"UVR@WeX$Y"Q Z\[\]V^
��� ��� �����! &��#$#&%�' (
f 51g 032h i7jj 03k6

19
� � � � � � � � � � � � � � � � � � � � � � � � � � � � � � � � � � � � � � � � �
Runtime: Frequent vs. Closed
CA
�
���
�����
�������
���������
��� �! "��� ��#$�!� �!%"�!� ��&'��� �
(�)�**,+�-/.�01�2 3 +�4/*65 .�-87
9;: <=: >@?A>CB,?ED=DGFAHJI
K LMNOPQR SQTU
� � � � � � � � � � � � � � � � � � � � � � � � � � � � � � � � � � � � � � � � V
OutlineW Scalable pattern mining in graph data setsX Frequent subgraph pattern mining X Constraint-based graph pattern miningX Graph clustering, classification, and compression
W Searching graph databasesX Graph indexing methodsX Similarity search in graph databases
W Application and exploration with graph mining X Biological and social network analysisX Mining computer systems: bug isolation & performance tuning
W Conclusions and future work

20
� � � � � � � � � � � � � � � � � � � � � � � � � � � � � � � � � � � � � � � � �
Constrained Patterns� Density� Diameter� Connectivity� Degree� Min, Max, Avg
� � � � � � � � � � � � � � � � � � � � � � � � � � � � � � � � � � � � � � � � �
Constraint-Based Graph Pattern Mining� Highly connected subgraphs in a large graph
usually are not artifacts (group, functionality)
� Recurrent patterns discovered in multiple graphs are more robust than the patterns mined from a single graph
21
� � � � � � � � � � � � � � � � � � � � � � � � � � � � � � � � � � � � � � � � �
No Downward Closure Property
Given two graphs G and G’, if G is a
subgraph of G’, it does not imply that the
connectivity of G is less than that of G’, and
vice versa.
G G’
� � � � � � � � � � � � � � � � � � � � � � � � � � � � � � � � � � � � � � � � �
Minimum Degree Constraint
Let G be a frequent graph and X be the setof edges which can be added to G such thatG U e (e � X) is connected and frequent. Graph G U X is the maximal graph that can be Extended (one step) from the vertices belong to G
G G U X
22
� � � � � � � � � � � � � � � � � � � � � � � � � � � � � � � � � � � � � � � � �
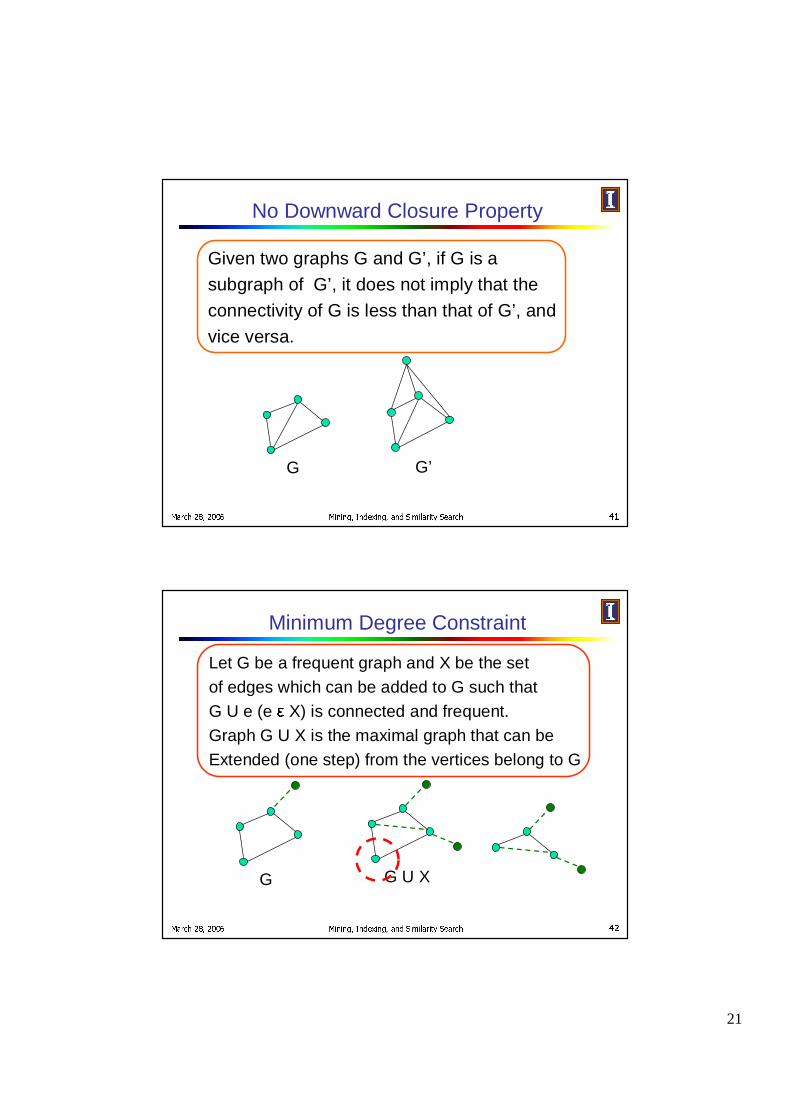
Pattern-Growth Approach� Find a small frequent candidate graph
� Remove vertices (shadow graph) whose degree is less than the connectivity
� Decompose it to extract the subgraphs satisfying the connectivity constraint
� Stop decomposing when the subgraph has been checked before
� Extend this candidate graph by adding new vertices and edges
� Repeat
� � � � � � � � � � � � � � � � � � � � � � � � � � � � � � � � � � � � � � � � �
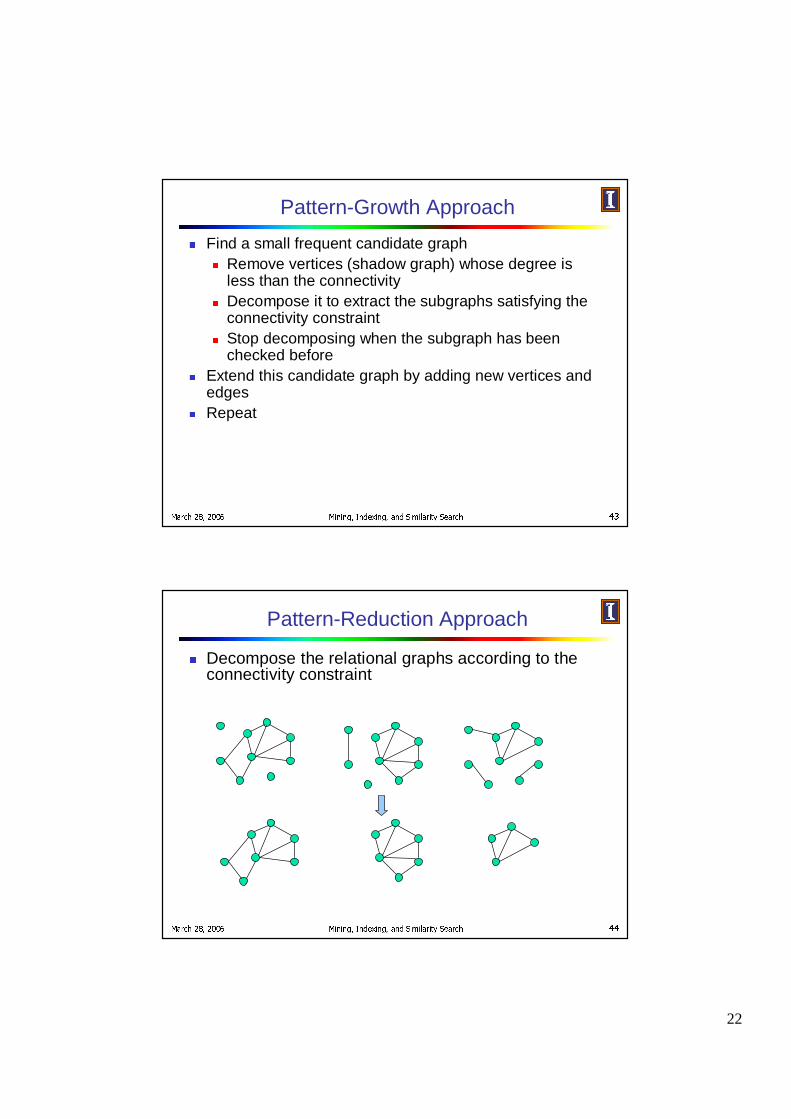
Pattern-Reduction Approach
� Decompose the relational graphs according to the connectivity constraint

23
� � � � � � � � � � � � � � � � � � � � � � � � � � � � � � � � � � � � � � � � �
Pattern-Reduction Approach (cont.)
� Intersect them and decompose the resulting subgraphs
intersect
intersect
� � ������� "!$#�� %
� � � � � � � � � � � � � � � � � � � � � � � � � � � � � � � � � � � � � � � � &
Outline' Scalable pattern mining in graph data sets
( Frequent subgraph pattern mining ( Constraint-based graph pattern mining( Graph clustering, classification, and compression
' Searching graph databases( Graph indexing methods( Similarity search in graph databases
' Application and exploration with graph mining ( Biological and social network analysis( Mining computer systems: bug isolation & performance tuning
' Conclusions and future work

24
� � � � � � � � � � � � � � � � � � � � � � � � � � � � � � � � � � � � � � � � �
Graph Clustering� Graph similarity measure
� Feature-based similarity measure� Each graph is represented as a feature vector � The similarity is defined by the distance of their corresponding
vectors� Frequent subgraphs can be used as features
� Structure-based similarity measure� Maximal common subgraph� Graph edit distance: insertion, deletion, and relabel� Graph alignment distance
� � � � � � � � � � � � � � � � � � � � � � � � � � � � � � � � � � � � � � � � �
Graph Classification� Local structure based approach
� Local structures in a graph, e.g., neighbors surrounding a vertex, paths with fixed length
� Graph pattern based approach� Subgraph patterns from domain knowledge� Subgraph patterns from data mining
� Kernel-based approach� Random walk (Gärtner ’02, Kashima et al. ’02, ICML’03, Mahé
et al. ICML’04)� Optimal local assignment (Fröhlich et al. ICML’05)
� Boosting (Kudo et al. NIPS’04)

25
� � � � � � � � � � � � � � � � � � � � � � � � � � � � � � � � � � � � � � � � �
Graph Pattern Based Classification
� Subgraph patterns from domain knowledge� Molecular descriptors
� Subgraph patterns from data mining � General idea
� Each graph is represented as a feature vector x = {x1, x2, …, xn}, where xi is the frequency of the i-th pattern in that graph
� Each vector is associated with a class label� Classify these vectors in a vector space
� � � � � � � � � � � � � � � � � � � � � � � � � � � � � � � � � � � � � � � � �
Subgraph Patterns from Data Mining
� Sequence patterns (De Raedt and Kramer IJCAI�01)
� Frequent subgraphs (Deshpande et al, ICDM’03)� Coherent frequent subgraphs (Huan et al. RECOMB’04)
� A graph G is coherent if the mutual information between G and each of its own subgraphs is above some threshold
� Closed frequent subgraphs (Liu et al. SDM�05)

26
� � � � � � � � � � � � � � � � � � � � � � � � � � � � � � � � � � � � � � � � �
Kernel-based Classification
� Random walk� Marginalized Kernels (Gärtner ’02, Kashima et al. ’02,
ICML’03, Mahé et al. ICML’04)
� and are paths in graphs and � and are probability distributions on paths � is a kernel between paths, e.g.,
� � � � � � � � � � � � � � � � � � � � � � � � � � � � � � � � � � � � � � � � �
Kernel-based Classification
� Optimal local assignment (Fröhlich et al. ICML’05)
���! #"%$&$%'%( $� %)!$%)*( +#, %-%. /0)!$# %$!, 132!"0+�4 20+0+%)5, %6 +�4 78�%( , +3 $39 1:9 ;
< 2%$!4 $=- +�/!. )5"%$&�! ?>A@�BDC E $�4 %$�.D( +578$%�!F /!4 $&( 2%$F , 7G, . �!4 , ( HG+06I 0$!, 132!"%+34 2%+!+0)�FJ+06:K%$!4 ( , - $0FL�! %)M;
, FJ�&)!��7GN!, %1?N%��4 ��78$%( $!4 9

27
� � � � � � � � � � � � � � � � � � � � � � � � � � � � � � � � � � � � � � � � �
Boosting in Graph Classification� Decision stumps
� Simple classifiers in which the final decision is made by single features. A rule is a tuple . If a molecule contains substructure , it is classified as .
� Gain
� Applying boosting
� � � � � � � � � � � � � � � � � � � � � � � � � � � � � � � � � � � � � � � � �
Graph Compression
� Extract common subgraphs and simplify graphs by condensing these subgraphs into nodes

28
� � � � � � � � � � � � � � � � � � � � � � � � � � � � � � � � � � � � � � � � �
Outline� Scalable pattern mining in graph data sets
� Frequent subgraph pattern mining � Constraint-based graph pattern mining� Graph clustering, classification, and compression
� Searching graph databases� Graph indexing methods� Similarity search in graph databases
� Application and exploration with graph mining � Biological and social network analysis� Mining computer systems: bug isolation & performance tuning
� Conclusions and future work
� � � � � � � � � � � � � � � � � � � � � � � � � � � � � � � � � � � � � � � � �
Graph Search
� Querying graph databases: � Given a graph database and a query graph, find all
graphs containing this query graph
NN
OH
ON
O
N
OHO
N
N+
NH
N
O
N
HO
N
N
S
OH
S
HOO
O
N
N
O
O
query graph graph database

29
� � � � � � � � � � � � � � � � � � � � � � � � � � � � � � � � � � � � � � � � �
Scalability Issue
� Sequential scan� Disk I/Os� Subgraph isomorphism testing
� An indexing mechanism is needed� DayLight: Daylight.com (commercial)� GraphGrep: Dennis Shasha, et al. PODS'02� Grace: Srinath Srinivasa, et al. ICDE'03
� � � � � � � � � � � � � � � � � � � � � � � � � � � � � � � � � � � � � � � � �
Indexing Strategy
Graph (G)
Substructure
Query graph (Q)
If graph G contains query graph Q, G should contain any substructure of Q
Remarks� Index substructures of a query graph to prune
graphs that do not contain these substructures

30
� � � � � � � � � � � � � � � � � � � � � � � � � � � � � � � � � � � � � � � � �
Indexing Framework
� Two steps in processing graph queriesStep 1. Index Construction
� Enumerate structures in the graph database, build an inverted index between structures and graphs
Step 2. Query Processing� Enumerate structures in the query graph � Calculate the candidate graphs containing these
structures� Prune the false positive answers by performing
subgraph isomorphism test
� � � � � � � � � � � � � � � � � � � � � � � � � � � � � � � � � � � � � � � � �
Cost Analysis
QUERY RESPONSE TIME
( )testingmisomorphisioqindex TTCT _+×+
REMARK: make |Cq| as small as possible
� ���! #"%$ &(')��* &,+,-%./�)021/�3 54)&('6$ ')4�� �/7

31
� � � � � � � � � � � � � � � � � � � � � � � � � � � � � � � � � � � � � � � � �
Path-based Approach
OHO
N
N+
NH
N
O
N
HO
ON
O
N N
N
S
OH
S
HOO
O
N
N
O
O
���������! "�$#%��&'�)("*
PATHS
0-length: C, O, N, S1-length: C-C, C-O, C-N, C-S, N-N, S-O2-length: C-C-C, C-O-C, C-N-C, ...3-length: ...
(a) (b) (c)
Built an inverted index between paths and graphs
� � � � � � � � � � � � � � � � � � � � � � � � � � � � � � � � � � � � � � � � +
Path-based Approach (cont.)
NN
QUERY GRAPH
0-edge: SC={a, b, c}, SN={a, b, c}1-edge: SC-C={a, b, c}, SC-N={a, b, c}2-edge: SC-N-C = {a, b}, ……
Intersect these sets, we obtain the candidate answers - graph (a) and graph (b) - which may contain this query graph.
32
� � � � � � � � � � � � � � � � � � � � � � � � � � � � � � � � � � � � � � � � �
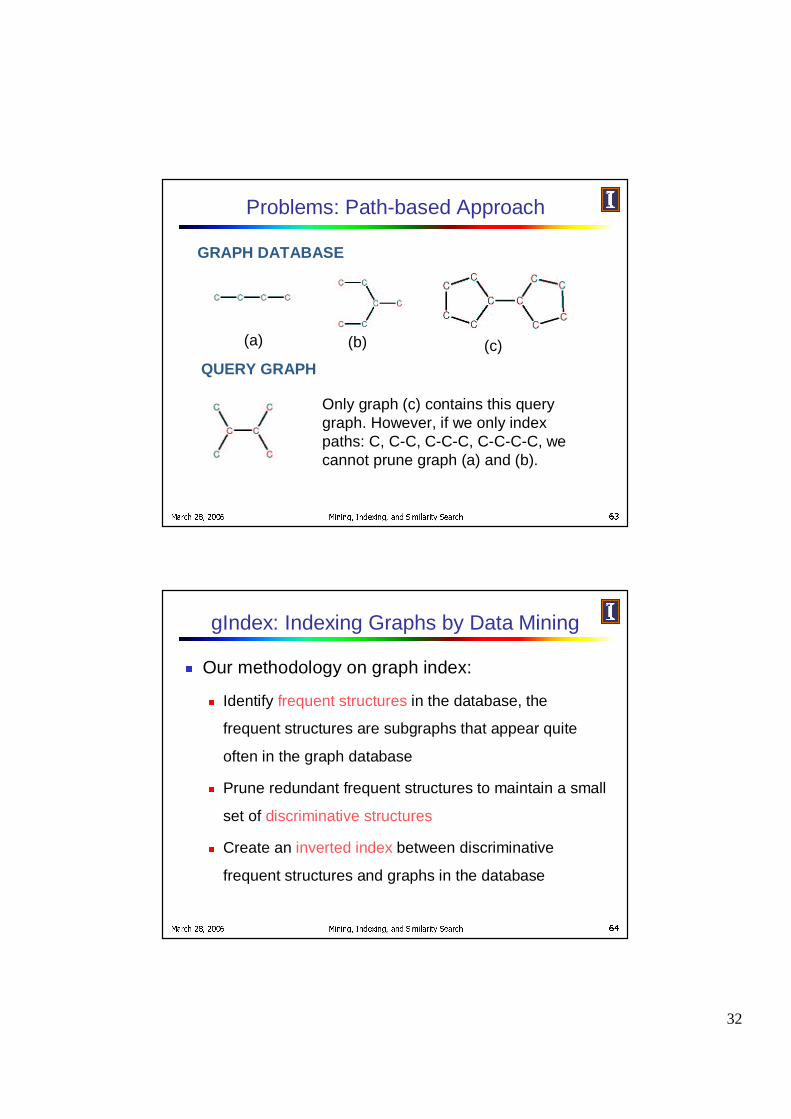
Problems: Path-based Approach
GRAPH DATABASE
(a) (b) (c)
QUERY GRAPH
Only graph (c) contains this query graph. However, if we only index paths: C, C-C, C-C-C, C-C-C-C, we cannot prune graph (a) and (b).
� � � � � � � � � � � � � � � � � � � � � � � � � � � � � � � � � � � � � � � � �
gIndex: Indexing Graphs by Data Mining
� Our methodology on graph index:
� Identify frequent structures in the database, the
frequent structures are subgraphs that appear quite
often in the graph database
� Prune redundant frequent structures to maintain a small
set of discriminative structures
� Create an inverted index between discriminative
frequent structures and graphs in the database

33
� � � � � � � � � � � � � � � � � � � � � � � � � � � � � � � � � � � � � � � � �
IDEAS: Indexing with Two Constraints
��������� �!�"�$#&% ')(+*!, -
. �$#0/1��#320�54 687 9$: ;
<1= �>�?� = @A= 2�B0� = C #&4 687 9ED ;
� � � � � � � � � � � � � � � � � � � � � � � � � � � � � � � � � � � � � � � � �
Why Discriminative Subgraphs?
F All graphs contain structures: C, C-C, C-C-CF Why bother indexing these redundant frequent
structures?G Only index structures that provide more information
than existing structures
OHO
N
N+
NH
N
O
N
HO
ON
O
N N
N
S
OH
S
HOO
O
N
N
O
O
Sample database
(a) (b) (c)
34
� � � � � � � � � � � � � � � � � � � � � � � � � � � � � � � � � � � � � � � � �
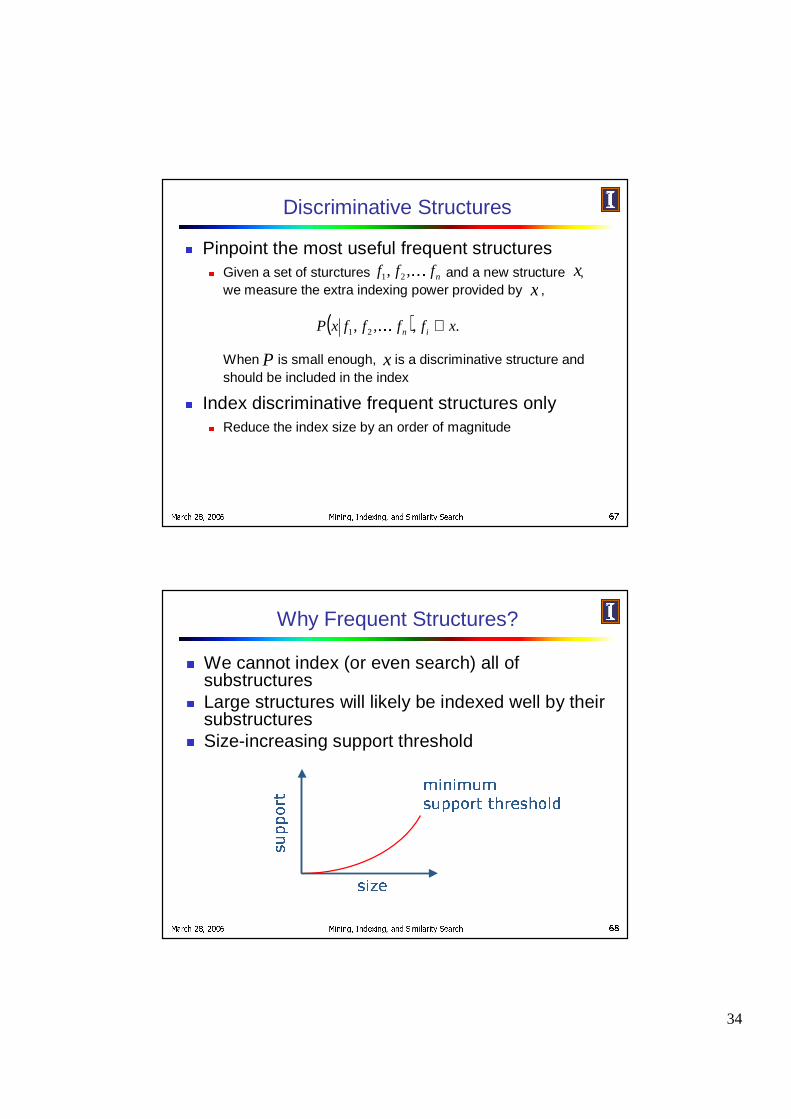
Discriminative Structures
� Pinpoint the most useful frequent structures� Given a set of sturctures and a new structure ,
we measure the extra indexing power provided by ,
When is small enough, is a discriminative structure and should be included in the index
� Index discriminative frequent structures only� Reduce the index size by an order of magnitude
( ) .,,, 21 xffffxP in ⊂�
xnfff �,, 21
x
xP
� � � � � � � � � � � � � � � � � � � � � � � � � � � � � � � � � � � � � � � � �
Why Frequent Structures?
� We cannot index (or even search) all of substructures� Large structures will likely be indexed well by their substructures� Size-increasing support threshold
��� "!# $%%&'( ) � *+� )-,.)� ,0/./21+3 454
63 !7�
618 9

35
� � � � � � � � � � � � � � � � � � � � � � � � � � � � � � � � � � � � � � � � �
Experimental Setting
� The AIDS antiviral screen compound dataset from
NCI/NIH, containing 43,905 chemical compounds� Query graphs are randomly extracted from the
dataset.� GraphGrep: maximum length (edges) of paths is
set at 10� gIndex: maximum size (edges) of structures is set
at 10
� � � � � � � � � � � � � � � � � � � � � � � � � � � � � � � � � � � � � � � � �
Experiments: Index Size
0.0E+00
2.0E+04
4.0E+04
6.0E+04
8.0E+04
1.0E+05
1.2E+05
1.4E+05
1k 2k 4k 8k 16k
PathFrequent StructureDiscriminative Frequent Structure
DATABASE SIZE
# O
F F
EA
TU
RE
S

36
� � � � � � � � � � � � � � � � � � � � � � � � � � � � � � � � � � � � � � � � �
Experiments: Answer Set Size
020
40
6080
100
120
140
4 8 12 16 20 24
GraphGrep
gIndex
Actual Match
QUERY SIZE
# O
F C
AN
DID
AT
ES
� � � � � � � � � � � � � � � � � � � � � � � � � � � � � � � � � � � � � � � � �
Experiments: Incremental Maintenance
20
30
40
50
60
70
80
2K 4K 6k 8k 10kFrom scratch Incremental
Frequent structures are stable to database updatingIndex can be built based on a small portion of a graph database, but being used for the whole database
37
� � � � � � � � � � � � � � � � � � � � � � � � � � � � � � � � � � � � � � � � �
Outline
� Scalable pattern mining in graph data sets� Frequent subgraph pattern mining � Constraint-based graph pattern mining� Graph clustering, classification, and compression
� Searching graph databases� Graph indexing methods� Similarity search in graph databases
� Application and exploration with graph mining � Biological and social network analysis� Mining software systems: bug isolation & performance tuning
� Conclusions and future work
� � � � � � � � � � � � � � � � � � � � � � � � � � � � � � � � � � � � � � � � �
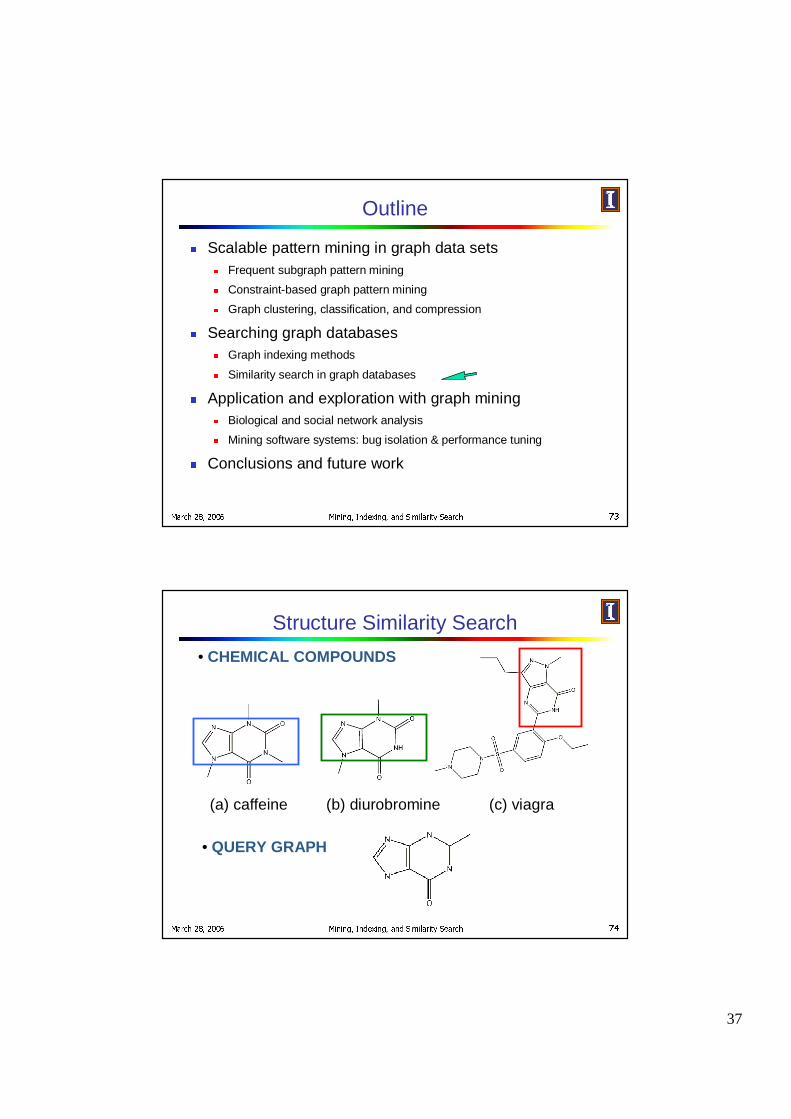
Structure Similarity Search
(a) caffeine (b) diurobromine (c) viagra
• CHEMICAL COMPOUNDS
• QUERY GRAPH

38
� � � � � � � � � � � � � � � � � � � � � � � � � � � � � � � � � � � � � � � � �
Some “Straightforward” Methods
� Method1: Directly compute the similarity between the
graphs in the DB and the query graph� Sequential scan
� Subgraph similarity computation
� Method 2: Form a set of subgraph queries from the
original query graph and use the exact subgraph
search � Costly: If we allow 3 edges to be missed in a 20-edge query
graph, it may generate 1,140 subgraphs
� � � � � � � � � � � � � � � � � � � � � � � � � � � � � � � � � � � � � � � � �
Index: Precise vs. Approximate Search� Precise Search
� Use frequent patterns as indexing features� Select features in the database space based on their selectivity� Build the index
� Approximate Search� Hard to build indices covering similar subgraphs� explosive
number of subgraphs in databases� Idea: (1) keep the index structure
(2) select features in the query space

39
� � � � � � � � � � � � � � � � � � � � � � � � � � � � � � � � � � � � � � � � �
Substructure Similarity Measure� Query relaxation measure� The number of edges that can be relabeled or missed;
but the position of these edges are not fixed
�������! #"$�&%�')(
*
� � � � � � � � � � � � � � � � � � � � � � � � � � � � � � � � � � � � � � � � +
Substructure Similarity Measure� Feature-based similarity measure, Each graph is represented as a feature vector X = {x1,
x2, …, xn}, The similarity is defined by the distance of their
corresponding vectors, Advantages- Easy to index- Fast- Rough measure

40
� � � � � � � � � � � � � � � � � � � � � � � � � � � � � � � � � � � � � � � � �
Intuition: Feature-Based Similarity Search
Graph (G1)
Substructure
Query (Q)
�If graph G contains
the major part of a query graph Q, G should share a number of common features with Q
�Given a relaxation ratio,
calculate the maximal number of features that can be missed !
At least one of them should be contained
Graph (G2)
� � � � � � � � � � � � � � � � � � � � � � � � � � � � � � � � � � � � � � � � �
Feature-Graph Matrix
10001f401100f5
1
0
0
G3
1
0
1
G4
1
1
1
G5
01f3
10f2
10f1
G2G1
Assume a query graph has 5 features and at most 2 features to miss due to the relaxation threshold
��� � � !#"%$ &(' �*)+� ,-�-"/.
0 123 4516

41
� � � � � � � � � � � � � � � � � � � � � � � � � � � � � � � � � � � � � � � � �
Edge Relaxation – Feature Misses
� If we allow k edges to be relaxed, J is the maximum number of features to be hit by k edges� it becomes the maximum coverage problem
� NP-complete � A greedy algorithm exists
� We design a heuristic to refine the bound of feature misses
Jk
Jk
⋅��
�
����
�
���
�
−−≥ 111greedy
� � � � � � � � � � � � � � � � � � � � � � � � � � � � � � � � � � � � � � � � !
Query Processing Framework
� Three steps in processing approximate graph queries
Step 1. Index Construction� Select small structures as features in a graph
database, and build the feature-graph matrixbetween the features and the graphs in the database.

42
� � � � � � � � � � � � � � � � � � � � � � � � � � � � � � � � � � � � � � � � �
Framework (cont.)
Step 2. Feature Miss Estimation� Determine the indexed features belonging to
the query graph� Calculate the upper bound of the number of
features that can be missed for an approximate matching, denoted by J� On the query graph, not the graph database
� � � � � � � � � � � � � � � � � � � � � � � � � � � � � � � � � � � � � � � � �
Framework (cont.)
Step 3. Query Processing� Use the feature-graph matrix to calculate
the difference in the number of features between graph G and query Q, FG – FQ
� If FG – FQ > J, discard G. The remaining graphs constitute a candidate answer set
43
� � � � � � � � � � � � � � � � � � � � � � � � � � � � � � � � � � � � � � � � �
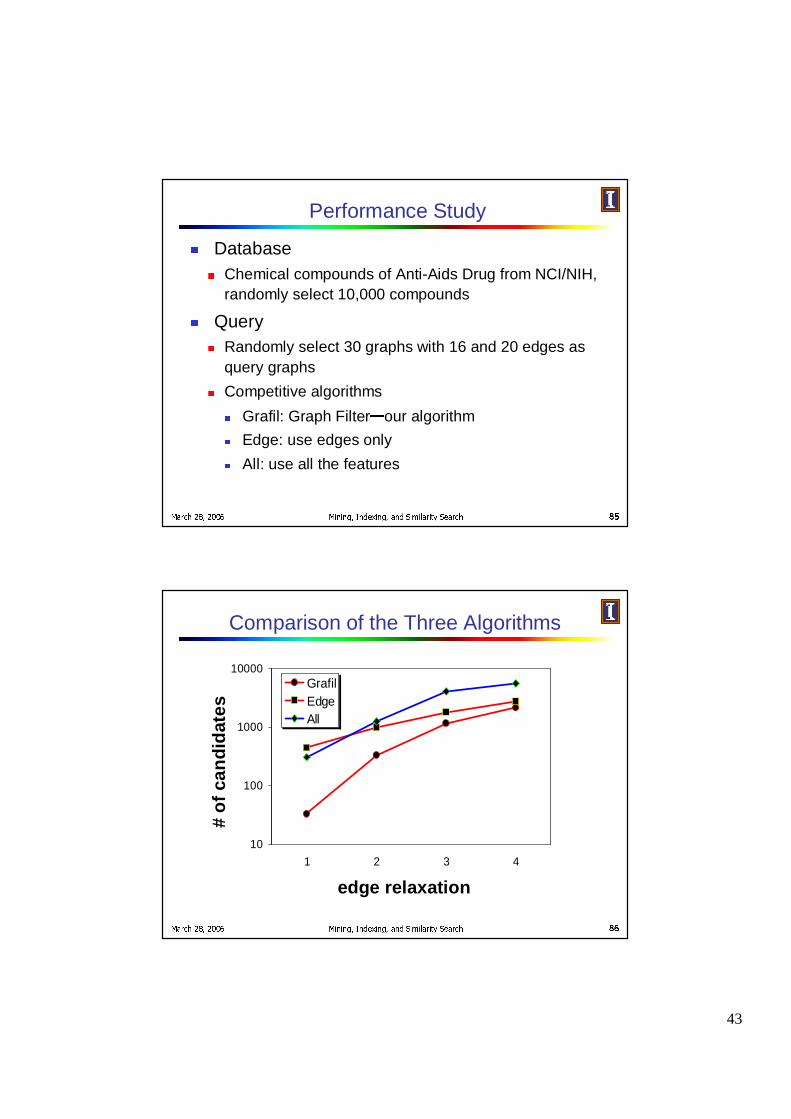
Performance Study� Database
� Chemical compounds of Anti-Aids Drug from NCI/NIH, randomly select 10,000 compounds
� Query� Randomly select 30 graphs with 16 and 20 edges as
query graphs� Competitive algorithms
� Grafil: Graph Filter � our algorithm� Edge: use edges only� All: use all the features
� � � � � � � � � � � � � � � � � � � � � � � � � � � � � � � � � � � � � � � � �
Comparison of the Three Algorithms
edge relaxation
10
100
1000
10000
1 2 3 4
GrafilEdgeAll
# o
f ca
nd
idat
es

44
� � � � � � � � � � � � � � � � � � � � � � � � � � � � � � � � � � � � � � � � �
Outline
� Scalable pattern mining in graph data sets� Frequent subgraph pattern mining � Constraint-based graph pattern mining� Graph clustering, classification, and compression
� Searching graph databases� Graph indexing methods� Similarity search in graph databases
� Application and exploration with graph mining � Biological and social network analysis� Mining computer systems: bug isolation & performance tuning
� Conclusions and future work
� � � � � � � � � � � � � � � � � � � � � � � � � � � � � � � � � � � � � � � � �
Biological Networks
� Protein-protein interaction network � Metabolic network� Transcriptional regulatory network� Co-expression network� Genetic Interaction network� …

45
� � � � � � � � � � � � � � � � � � � � � � � � � � � � � � � � � � � � � � � � �
Identify frequent co-expression clusters across multiple microarray data sets
c1 c2… cm
g1 .1 .2… .2g2 .4 .3… .4…
c1 c2… cm
g1 .8 .6… .2g2 .2 .3… .4…
c1 c2… cm
g1 .9 .4… .1g2 .7 .3… .5…
c1 c2… cm
g1 .2 .5… .8g2 .7 .1… .3…
...a
b
c
d
e
f
g
h
i
j
k
a
b
c
d
e
f
g
h
i
j
k
a
b
c
d
ef
g
h
i
j
k
a
bd
e
f
g
h
i
j
k
c
...a
b
c
d
e
f
g
h
i
j
k
a
b
c
d
e
f
g
h
i
j
k
a
b
c
d
e
f
g
h
i
j
k
a
bd
e
f
g
h
i
j
k
c
...
� � � � � � � � � � � � � � � � � � � � � � � � � � � � � � � � � � � � � � � � �
Our Solution
We develop a novel algorithm, called CODENSE, to mine
frequent coherent dense subgraphs.
The target subgraphs have three characteristics:
(1) All edges occur in >= k graphs (frequency)
(2) All edges should exhibit correlated occurrences in the given
graph set (coherency)
(3) The subgraph is dense, where density d is higher than a
threshold γ and d=2m/(n(n-1)) (density)
m: #edges, n: #nodes

46
� � � � � � � � � � � � � � � � � � � � � � � � � � � � � � � � � � � � � � � � �
…………………
111000e-f
011100c-i
111000c-h
111010c-f
111100c-e
G6G5G4G3G2G1E
edge occurrence profiles
c
e
fh
e
g
h
i Step 4Step 5
Sub(G)
a
bd
e
g
h
i
cf
a
bc
d
e
f
g
h
i
a
b
c
d
e
f
g
h
i
a
b
c
d
e
f
g
h
i
a
b
d
e
f
g
h
i
c a
b
c
d
e
f
g
h
i
a
b
c
d
e
f
g
h
i
G1 G3G2
G6G5G4
c-f
c-h
c-e
e-h
e-f
f-h
c-i
e-i
e-g g-i
h-i
second-order graph S
g-hf-i
Step 1
Step 3
summary graph �
e
g
h
i
cf
Sub( � �
Step 2
c-f
c-h
c-e
e-h
e-f
f-h
e-i
e-g g-i
h-i
Sub(S)
g-h
Step 6
� � � � � ! ! " # $ %
� � � � �& ' ( % ) * '+-, . !� � � � �
CODENSE: Mine coherent dense subgraphs
� � � � � � � � � � � � � � � � � � � � � � � � � � � � � � � � � � � � � � � � /
ATP17
ATP12
MRPL38
MRPL37
MRPL39
FMC1MRPS18
MRPL32
ACN9
MRPL51
MRP49YDR115W
PHB1
PET100

47
� � � � � � � � � � � � � � � � � � � � � � � � � � � � � � � � � � � � � � � � �
ATP17
ATP12
MRPL38
MRPL39
FMC1MRPS18
MRPL32
ACN9
MRPL51
MRP49
YDR115W
PHB1
PET100
Yellow: YDR115W, FMC1, ATP12,MRPL37,MRPS18
GO:0019538(protein metabolism; pvalue = 0.001122)
PET100
� � � � � � � � � � � � � � � � � � � � � � � � � � � � � � � � � � � � � � � � �
Red:PHB1,ATP17,MRPL51,MRPL39, MRPL49, MRPL51,PET100
GO:0006091(generation of precursor metabolites and energy; pvalue=0. 001339)
ATP17
ATP12
MRPL38
MRPL37
MRPL39
FMC1MRPS18
MRPL32
ACN9
MRPL51
MRP49YDR115W
PHB1
PET100

48
� � � � � � � � � � � � � � � � � � � � � � � � � � � � � � � � � � � � � � � � �
Outline
� Scalable pattern mining in graph data sets� Frequent subgraph pattern mining � Constraint-based graph pattern mining� Graph clustering, classification, and compression
� Searching graph databases� Graph indexing methods� Similarity search in graph databases
� Application and exploration with graph mining � Biological and social network analysis� Mining computer systems: bug isolation & performance tuning
� Conclusions and future work
� � � � � � � � � � � � � � � � � � � � � � � � � � � � � � � � � � � � � � � � �
Bug Isolation by Program Flow Analysis
1
3
4
5
2 1: makepat 2: esc 3: addstr 4: getccl 5: dodash 6: in_set_2 7: stclose
(1)
1
3
4
5
2
1
3
4
5
2
6
7
(2) (3)
PROGRAM CALLER/CALLEE GRAPH

49
� � � � � � � � � � � � � � � � � � � � � � � � � � � � � � � � � � � � � � � � �
Frequent Pattern-Based Classification� Each program execution generates a (dynamic)
caller/callee graph� Extract frequent calling substructures from the
correct and incorrect executions� Use these substructures as features to classify
� � � � � � � � � � � � � � � � � � � � � � � � � � � � � � � � � � � � � � � � �
Watching the Boost of Classification Accuracy� Bug detection based on the boost of classification
accuracy� Check the change of classification error at the
entrance and at the exit of functions
� Compare their difference
� �����! #" $��&%�'�����! !" $��(%
)�*,+.- /�*10#)2/,030546- /,0!7
)986: +;/,030546- /10!7

50
� � � � � � � � � � � � � � � � � � � � � � � � � � � � � � � � � � � � � � � � �
Example: Bug Isolation by Data Mining
� � � � � � � � � � � � � � � � � � � � � � � � � � � � � � � � � � � � � � � � � �
Outline
� Scalable pattern mining in graph data sets� Frequent subgraph pattern mining � Constraint-based graph pattern mining� Graph clustering, classification, and compression
� Searching graph databases� Graph indexing methods� Similarity search in graph databases
� Application and exploration with graph mining � Biological and social network analysis� Mining software systems: bug isolation & performance tuning
� Conclusions and future work
51
� � � � � � � � � � � � � � � � � � � � � � � � � � � � � � � � � � � � � � � � � �
Conclusions
� Graph mining has wide applications� Frequent and closed subgraph mining methods
� gSpan and CloseGraph: pattern-growth depth-first search approach� Graph indexing techniques
� Frequent and discirminative subgraphs are high-quality indexing features� Similarity search in graph databases
� Indexing and feature-based matching � Biological network analysis
� Mining coherent, dense, multiple biological networks� Program flow analysis
� � � � � � � � � � � � � � � � � � � � � � � � � � � � � � � � � � � � � � � � � �
References (1)
� T. Asai, et al. “Efficient substructure discovery from large semi-structured data”, SDM'02� C. Borgelt and M. R. Berthold, “Mining molecular fragments: Finding relevant substructures of
molecules”, ICDM'02� D. Cai, Z. Shao, X. He, X. Yan, and J. Han, “Community Mining from Multi-Relational Networks”,
PKDD'05. � M. Deshpande, M. Kuramochi, and G. Karypis, “Frequent Sub-structure Based Approaches for
Classifying Chemical Compounds”, ICDM 2003� M. Deshpande, M. Kuramochi, and G. Karypis. “Automated approaches for classifying structures”,
BIOKDD'02� L. Dehaspe, H. Toivonen, and R. King. “Finding frequent substructures in chemical compounds”,
KDD'98� C. Faloutsos, K. McCurley, and A. Tomkins, “Fast Discovery of 'Connection Subgraphs”, KDD'04� H. Fröhlich, J. Wegner, F. Sieker, and A. Zell, “Optimal Assignment Kernels For Attributed Molecular
Graphs”, ICML’05� T. Gärtner, P. Flach, and S. Wrobel, “On Graph Kernels: Hardness Results and Efficient Alternatives”,
COLT/Kernel’03 � L. Holder, D. Cook, and S. Djoko. “Substructure discovery in the subdue system”, KDD'94� J. Huan, W. Wang, D. Bandyopadhyay, J. Snoeyink, J. Prins, and A. Tropsha. “Mining spatial motifs
from protein structure graphs”, RECOMB’04

52
� � � � � � � � � � � � � � � � � � � � � � � � � � � � � � � � � � � � � � � � � �
References (2)
� J. Huan, W. Wang, and J. Prins. “Efficient mining of frequent subgraph in the presence of
isomorphism”, ICDM'03� H. Hu, X. Yan, Yu, J. Han and X. J. Zhou, � Mining Coherent Dense Subgraphs across Massive
Biological Networks for Functional Discovery� , ISMB'05� A. Inokuchi, T. Washio, and H. Motoda. “An apriori-based algorithm for mining frequent substructures
from graph data”, PKDD'00� C. James, D. Weininger, and J. Delany. “Daylight Theory Manual Daylight Version 4.82”. Daylight
Chemical Information Systems, Inc., 2003.� G. Jeh, and J. Widom, “Mining the Space of Graph Properties”, KDD'04� H. Kashima, K. Tsuda, and A. Inokuchi, “Marginalized Kernels Between Labeled Graphs”, ICML’03
� M. Koyuturk, A. Grama, and W. Szpankowski. “An efficient algorithm for detecting frequent
subgraphs in biological networks”, Bioinformatics, 20:I200--I207, 2004.� T. Kudo, E. Maeda, and Y. Matsumoto, “An Application of Boosting to Graph Classification”, NIPS’04
� M. Kuramochi and G. Karypis. “Frequent subgraph discovery”, ICDM'01� M. Kuramochi and G. Karypis, “GREW: A Scalable Frequent Subgraph Discovery Algorithm”,
ICDM’04� C. Liu, X. Yan, H. Yu, J. Han, and P. S. Yu, “Mining Behavior Graphs for ‘Backtrace'' of Noncrashing
Bugs’'', SDM'05
� � � � � � � � � � � � � � � � � � � � � � � � � � � � � � � � � � � � � � � � � �
References (3)
� P. Mahé, N. Ueda, T. Akutsu, J. Perret, and J. Vert, “Extensions of Marginalized Graph Kernels”,
ICML’04� B. McKay. Practical graph isomorphism. Congressus Numerantium, 30:45--87, 1981.� S. Nijssen and J. Kok. A quickstart in frequent structure mining can make a difference. KDD'04� J. Prins, J. Yang, J. Huan, and W. Wang. “Spin: Mining maximal frequent subgraphs from graph
databases”. KDD'04 � D. Shasha, J. T.-L. Wang, and R. Giugno. “Algorithmics and applications of tree and graph
searching”, PODS'02� J. R. Ullmann. “An algorithm for subgraph isomorphism”, J. ACM, 23:31--42, 1976.� N. Vanetik, E. Gudes, and S. E. Shimony. “Computing frequent graph patterns from semistructured
data”, ICDM'02� C. Wang, W. Wang, J. Pei, Y. Zhu, and B. Shi. “Scalable mining of large disk-base graph
databases”, KDD'04� T. Washio and H. Motoda, “State of the art of graph-based data mining”, SIGKDD Explorations,
5:59-68, 2003� X. Yan and J. Han, � gSpan: Graph-Based Substructure Pattern Mining � , ICDM'02� X. Yan and J. Han, � CloseGraph: Mining Closed Frequent Graph Patterns � , KDD'03

53
� � � � � � � � � � � � � � � � � � � � � � � � � � � � � � � � � � � � � � � � � �
References (4)
� X. Yan, P. S. Yu, and J. Han, � Graph Indexing: A Frequent Structure-based Approach � , SIGMOD'04� X. Yan, X. J. Zhou, and J. Han, “Mining Closed Relational Graphs with Connectivity Constraints”,
KDD'05� X. Yan, P. S. Yu, and J. Han, “Substructure Similarity Search in Graph Databases”, SIGMOD'05� X. Yan, F. Zhu, J. Han, and P. S. Yu, “Searching Substructures with Superimposed Distance”,
ICDE'06� M. J. Zaki. “Efficiently mining frequent trees in a forest”, KDD'02
� � � � � � � � � � � � � � � � � � � � � � � � � � � � � � � � � � � � � � � � � �