Embed Size (px)
Citation preview

Mining Frequent Patterns, Associations and Correlations
Week 3
1

Team Homework Assignment #2Team Homework Assignment #2
R d 285 300 f h b k• Read pp. 285 – 300 of the text book.• Do Example 6.1. Prepare for the results of the homework
assignment.assignment.• Due date
– beginning of the lecture on Friday February 18th.

Team Homework Assignment #3Team Homework Assignment #3
P f h d i i f j• Prepare for the one‐page description of your group project topic
• Prepare for presentation using slidesPrepare for presentation using slides• Due date
– beginning of the lecture on Friday February 11th.

http://www.lucyluvs.com/images/fittedXLpooh.JPGedXLpooh.JPG
http://www.mondobirra.org/sfondi/BudLight.sized.jpg
4

cell_cycle ‐> [+]Exp1,[+]Exp2,[+]Exp3,[+]Exp4, support=52.94% (9 genes)
apoptosis ‐> [+]Exp6,[+]Exp7,[+]Exp8, p p [ ] p ,[ ] p ,[ ] p ,support=76.47% (13 genes)
http://www.cnb.uam.es/~pcarmona/assocrules/imag4.JPG 5

Table 8.3 The substitution matrix of amino acids.
Figure 8.8 Scoring two potential pairwise alignments, (a) and (b), of amino acids.
6
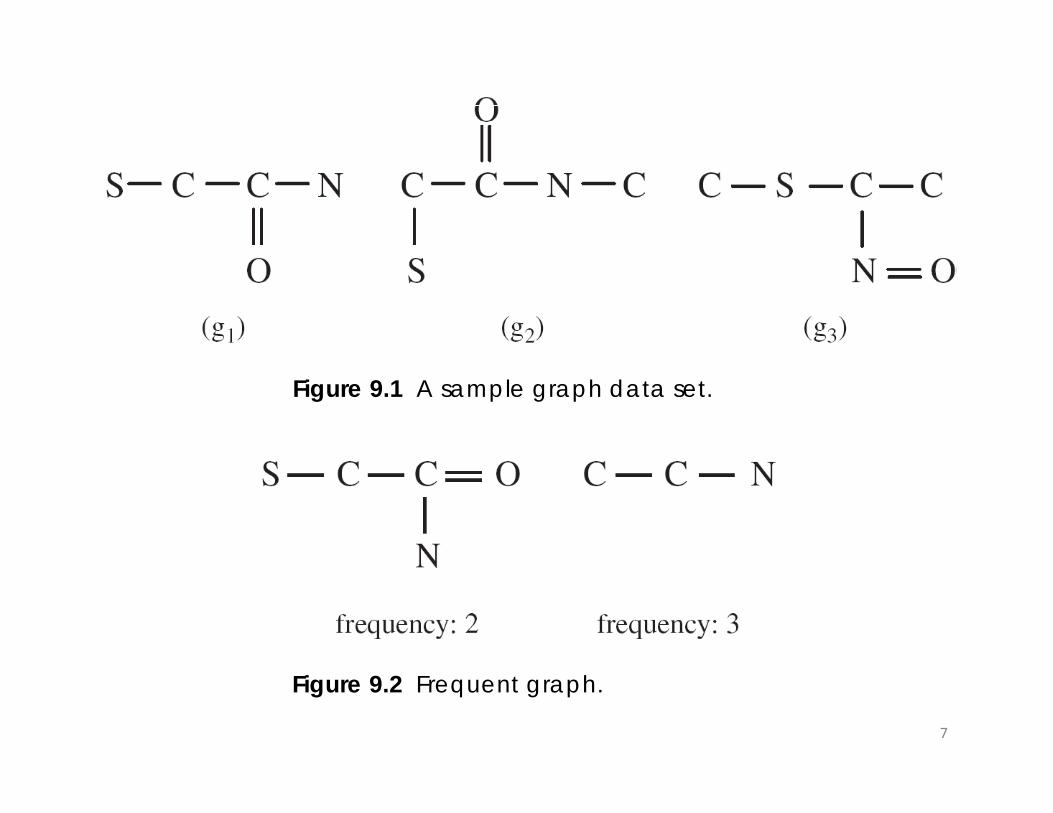
Figure 9.1 A sample graph data set.
Figure 9.2 Frequent graph.
7

Figure 99.14 A chhem
ical ddatabasee.
8

What Is Frequent Pattern Analysis?What Is Frequent Pattern Analysis?
• Frequent pattern: a pattern for itemsets, subsequences, substructures, etc. that occurs frequently in a data set
• First proposed by Agrawal, Imielinski, and Swami in 1993, in the context of frequent itemsets and association rule mining
9

Why Is Frequent Pattern Mining I ?Important?
• Discloses an intrinsic and important property of data sets• Discloses an intrinsic and important property of data sets• Forms the foundation for many essential data mining
tasks and applicationstasks and applications– What products were often purchased together?— Beer and diapers?– What are the subsequent purchases after buying a PC?– What kinds of DNA are sensitive to this new drug?– Can we automatically classify web documents?
10

Topics of Frequent Pattern Mining (1)Topics of Frequent Pattern Mining (1)
• Based on the kinds of patterns to be mined– Frequent itemset mining– Sequential pattern mining– Structured pattern mining
11

Topics of Frequent Pattern Mining (2)Topics of Frequent Pattern Mining (2)
• Based on the levels of abstraction involved in the rule set– Single‐level association rulesSingle level association rules– Multi‐level association rules
12

Topics of Frequent Pattern Mining (3)Topics of Frequent Pattern Mining (3)
• Based on the number of data dimensions involved in the rule– Single‐dimensional association rulesSingle dimensional association rules– Multi‐dimensional association rules
13

Association Rule Mining ProcessAssociation Rule Mining Process
Fi d ll f i• Find all frequent itemsets– Join steps– Prune steps– Prune steps
• Generate “strong” association rules from the frequent itemsets
14

Basic Concepts of Frequent ItemsetsBasic Concepts of Frequent Itemsets
• Let I = {I1, I2, …., Im} be a set of itemsL t D th t k l t d t b t f d t b• Let D, the task‐relevant data, be a set of database transactions where each transaction T is a set of items such that T⊆ Ithat T ⊆ I
• Each transaction is associated with an identifier, called TID.• Let A be a set of items• Let A be a set of items• A transaction T is said to contain A if and only if A ⊆ T
15

How to Generate Frequent Itemset?How to Generate Frequent Itemset?
• Suppose the items in Lk‐1 are listed in an order• The join step: To find Lk, a set of candidate k‐itemsets, Ck, is
generated by joining Lk‐1with itself. Let l1 and l2 be itemsets in Lk‐1.The resulting itemset formed by joining l1 and l2 is l1[1], l1[2] l1[k‐2] l1[k‐1] l2[k‐1]l1[2], …, l1[k 2], l1[k 1], l2[k 1]
• The prune step: Scan data set D and compare candidate support count of Ckwith minimum support count. Remove pp k ppcandidate itemsets that whose support count is less than minimum support count, resulting in Lk.
16
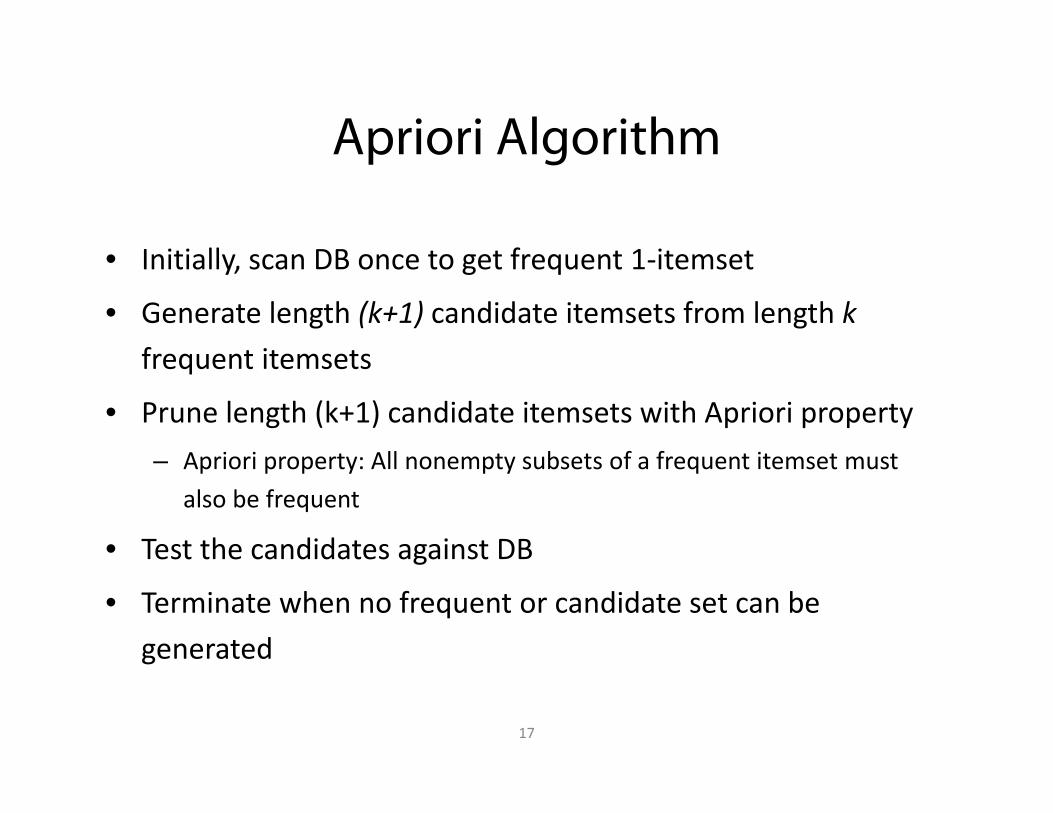
Apriori AlgorithmApriori Algorithm
I iti ll DB t t f t 1 it t• Initially, scan DB once to get frequent 1‐itemset
• Generate length (k+1) candidate itemsets from length kfrequent itemsetsfrequent itemsets
• Prune length (k+1) candidate itemsets with Apriori propertyApriori property: All nonempty subsets of a frequent itemset must– Apriori property: All nonempty subsets of a frequent itemset must also be frequent
• Test the candidates against DBg
• Terminate when no frequent or candidate set can be generatedg
17

Figure item
se 5.4 The Atsfor m
in Apriorialg
ing Boole gorithm fo
ean assoc or discove
ciation rul ering freqles.
quent
18

Transactional DatabaseTransactional DatabaseTID List of item IDsTID List of item_IDsT100 I1, I2, I5
T200 I2, I4
T300 I2, I3
T400 I1, I2, I4
T500 I1, I3,T600 I2, I3
T700 I1, I3
T800 I1 I2 I3 I5T800 I1, I2, I3, I5
T900 I1, I2, I3
Table 5 1 Transactional data for an AllElectronics branchTable 5.1 Transactional data for an AllElectronics branch.
19

Minimum support count = 2
Figure 5.2 Generation of candidate itemsets and frequent itemsets, where the minimum support count is 2.
20

Generating Strong Association RulesGenerating Strong Association Rules
• From the frequent itemsetsq• For each frequent itemset l, generate all nonempty
subset of l• For every nonempty subset s of l, • Output the rule “s (l – s)”
If t t(l) / t t( ) ≥ i f• If support_count(l) / support_count(s) ≥ min_conf, where min_conf is the minimum confidence threshold
• Rules that satisfy both a minimum support thresholdRules that satisfy both a minimum support threshold and a minimum confidence threshold are called strong
1

SupportSupport
• The rule A B holds in the transaction set DThe rule A B holds in the transaction set Dwith support s
t b bilit th t t ti t i– support, s, probability that a transaction contains A and Bsupport (A B) P (A B)– support (A B) = P (A B)
2

ConfidenceConfidence
• The rule A B has confidence c in theThe rule A B has confidence c in the transaction set D
fid diti l b bilit th t– confidence, c, conditional probability that a transaction having A also contains Bconfidence (A B) P (B | A)– confidence (A B) = P (B | A)
)() (
)() ( )|()(
Auntsupport coBAuntsupport_co
AsupportBAsupportABPBAConfidence ∪
=∪
==⇒)()( pp _pp
3

Generating Association Rules from Frequent Itemsets
• Example 5.4: Suppose the data contain the frequent itemset l p pp q= {I1, I2, I5}. What are the association rules that can be generated from l? If the minimum confidence threshold is 70% then which rules are strong?70%, then which rules are strong?– I1 ^I2 ‐> I5, confidence = 2/4 = 50%– I1 ^I5 ‐> I2, confidence = 2/2 = 100%– I2 ^I5 ‐> I1, confidence = 2/2 = 100%– I1 ‐> I2 ^ I5, confidence = 2/6 = 33%– I2 ‐> I1 ^ I5, confidence = 2/7 = 29%, /– I5 ‐> I1 ^ I2, confidence = 2/2 = 100%
1

ExerciseExercise5.3 A database has five transactions. Let min_sup = 60% and
min_conf = 80%.
TID Items_bought
T100 {M, O, N, K, E, Y}
T200 {D O N K E Y}T200 {D, O, N, K, E, Y}
T300 {M, A, K, E}
T400 {M, U, C, K, Y}
(a) Find all frequent itemsets. (b) List all of the strong association rules (with support s and
T500 {C, O, O, K, I, E}
confidence c) matching following meta‐rule, where X is a variable representing customers, and itemi denotes variables representing items (e.g., “A”, “B”, etc.):representing items (e.g., A , B , etc.):
c] [s, ),(),(),(, 321 itemXbuysitemXbuysitemXbuysntransactiox ⇒∧∈∀ 4

Challenges of Frequent Pattern MiningChallenges of Frequent Pattern Mining
• ChallengesChallenges– Multiple scans of transaction database– Huge number of candidatesuge u be o ca d dates– Tedious workload of support counting for
candidates• Improving Apriori
– Reduce passes of transaction database scans– Shrink number of candidates– Facilitate support counting of candidates
5

Advanced Methods for Mining Frequent Itemsets
• Mining frequent itemsets without candidateMining frequent itemsets without candidate generation– Frequent pattern growth (FP growth—Han Pei &– Frequent‐pattern growth (FP‐growth—Han, Pei &
Yin @SIGMOD’00)
• Mining frequent itemsets using vertical data• Mining frequent itemsets using vertical data format
Vertical data format approach (ECLAT Zaki– Vertical data format approach (ECLAT—Zaki@IEEE‐TKDE’00)
6

Mining Various Kinds of Association Rules
• Mining multilevel association rules• Mining multilevel association rules
• Mining multidimensional association rulesg
7

Mining Multilevel Association Rules (1)Mining Multilevel Association Rules (1)
• Data mining systems should provideData mining systems should provide capabilities for mining association rules at multiple levels of abstractionmultiple levels of abstraction
• Exploration of shared multi‐level mining ( l & S ik @ ’9 &(Agrawal & Srikant@VLB’95, Han & Fu@VLDB’95)
8

Mining Multilevel Association Rules (2)Mining Multilevel Association Rules (2)
• For each level any algorithm for discoveringFor each level, any algorithm for discovering frequent itemsets may be used, such as Apriori or its variationsApriori or its variations– Using uniform minimum support for all levels
(referred to as uniform support)(referred to as uniform support)– Using reduced minimum support at lower levels
(referred to as reduced support)( e e ed o as educed suppo )– Using item or group‐based minimum support
(referred to as group_based support)( g p_ pp )
9

Table 5.6 Task‐relevant data D.
10

Figure 5.10 A concept hierarchy for AllElectronics computer items.
11

Figure 5.11 Multilevel mining with uniform support.
12

Figure 5.12 Multilevel mining with reduced support.
13

Multilevel mining with group-based support.
14

Mining Multilevel Association Rules (3)Mining Multilevel Association Rules (3)
• Side effectSide effect– The generation of many redundant rules across
multiple levels of abstractions due to the ancestor relationships among items
– buys(X, “laptop computer”) buys(X, “HP printer”)printer”)
[support = 8%, confidence = 70%]– buys(X “IBM laptop computer”) buys(X “HPbuys(X, IBM laptop computer ) buys(X, HP printer”)
[support = 2%, confidence = 72%]
15
Mining Multidimensional Association lRules
Si l di i l l• Single‐dimensional rules:buys(X, “milk”) ⇒ buys(X, “bread”)
M l i di i l l ≥ 2 di i• Multi‐dimensional rules: ≥ 2 dimensions or predicates– Inter‐dimension assoc. rules (no repeated predicates)age(X,”19-25”) ∧ occupation(X,“student”) ⇒
buys(X, “coke”)
hybrid dimension assoc rules (repeated predicates)– hybrid‐dimension assoc. rules (repeated predicates)age(X,”19-25”) ∧ buys(X, “popcorn”) ⇒ buys(X,
“coke”)16
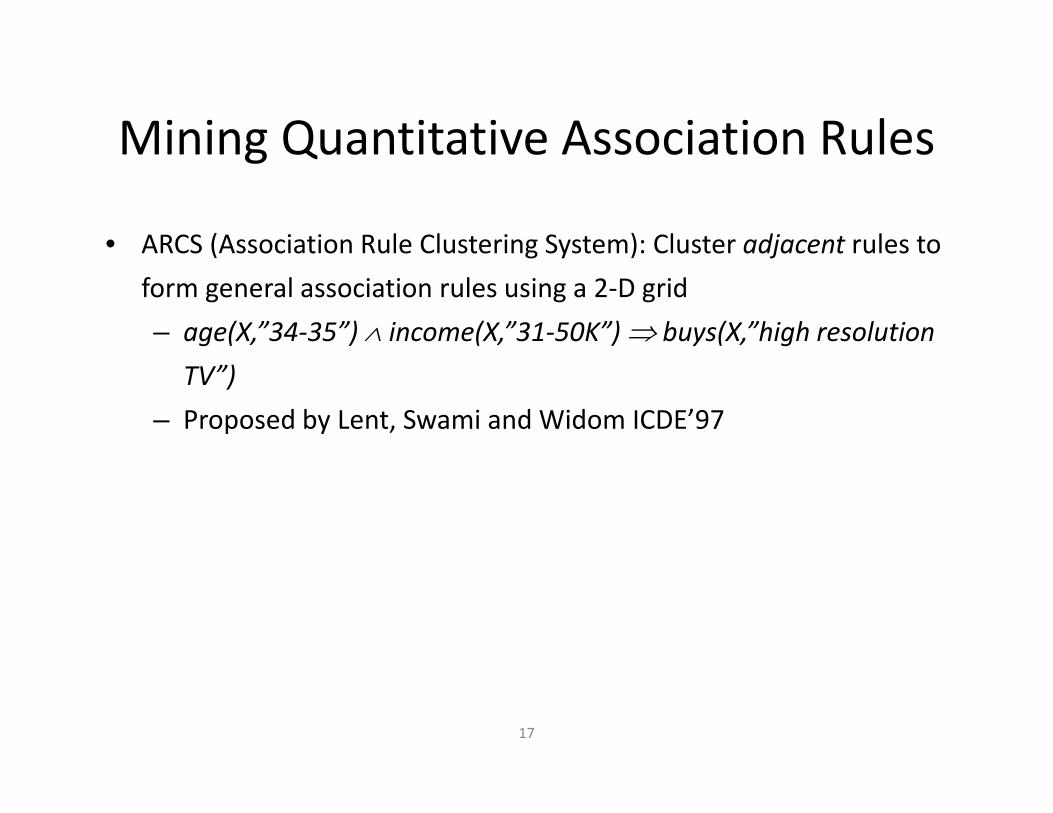
Mining Quantitative Association RulesMining Quantitative Association Rules
• ARCS (Association Rule Clustering System): Cluster adjacent rules toARCS (Association Rule Clustering System): Cluster adjacent rules to form general association rules using a 2‐D grid– age(X,”34‐35”) ∧ income(X,”31‐50K”) ⇒ buys(X,”high resolution
TV”)– Proposed by Lent, Swami and Widom ICDE’97
17

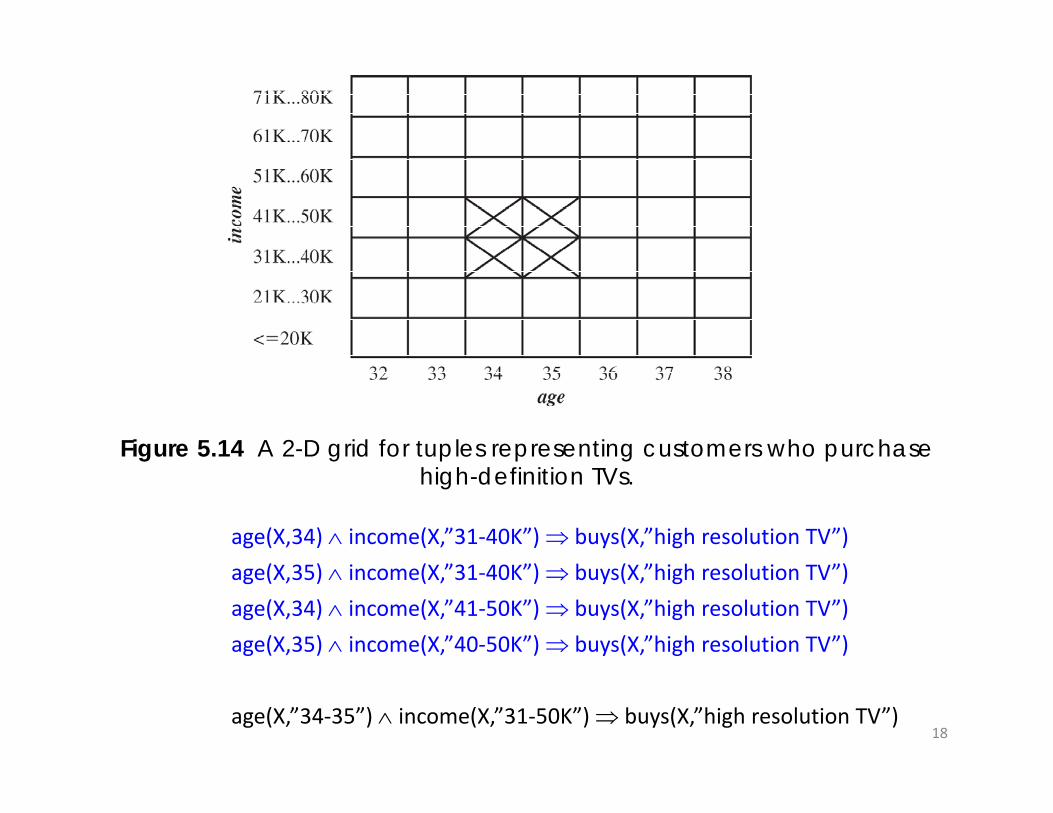
Figure 5.14 A 2-D grid for tuples representing customers who purchase g g p p g phigh-definition TVs.
age(X,34) ∧ income(X,”31‐40K”) ⇒ buys(X,”high resolution TV”)age(X,35) ∧ income(X,”31‐40K”) ⇒ buys(X,”high resolution TV”)age(X,34) ∧ income(X,”41‐50K”) ⇒ buys(X,”high resolution TV”)age(X,35) ∧ income(X,”40‐50K”) ⇒ buys(X,”high resolution TV”)
age(X,”34‐35”) ∧ income(X,”31‐50K”) ⇒ buys(X,”high resolution TV”)18

Strong Rules Are Not Necessarily ( )Interesting (1)
• Suppose we are interested in analyzing transaction in pp y gAllElectronics with respect to the purchase of computer games and videos. Let game refer to the transactions containing computer games, and video refer to those containing videos. Of the 10,000 transactions analyzed, the data show that 6 000 of the customer transactions includeddata show that 6,000 of the customer transactions included computer games, while 7,500 included videos, and 4,000 included both computer games and videos.
19

Strong Rules Are Not Necessarily ( )Interesting (2)
• Suppose that a data mining program for discoveringSuppose that a data mining program for discovering association rules is run on the data, using a minimum support of, say, 30% and a minimum confidence of support of, say, 30% and a minimum confidence of60%. Is the following association rule is strong?
• buys(X ”computer games”)⇒ buys(X ”videos”)buys(X, computer games )⇒ buys(X, videos )
20

Strong Rules Are Not Necessarily ( )Interesting (3)
• The rule above is misleading because theThe rule above is misleading because the probability of purchasing videos is 75%.
• It does not measure the real string of the correlation and implication computer games and videos.
• How can we tell which strong association rulesHow can we tell which strong association rules are really interesting?
21
Correlation AnalysisCorrelation Analysis
• Correlation measureCorrelation measureA ⇒ B {support, confidence, correlation}
C l i i• Correlation metrics– lift– chi‐square– all_confidence– cosine measure
22

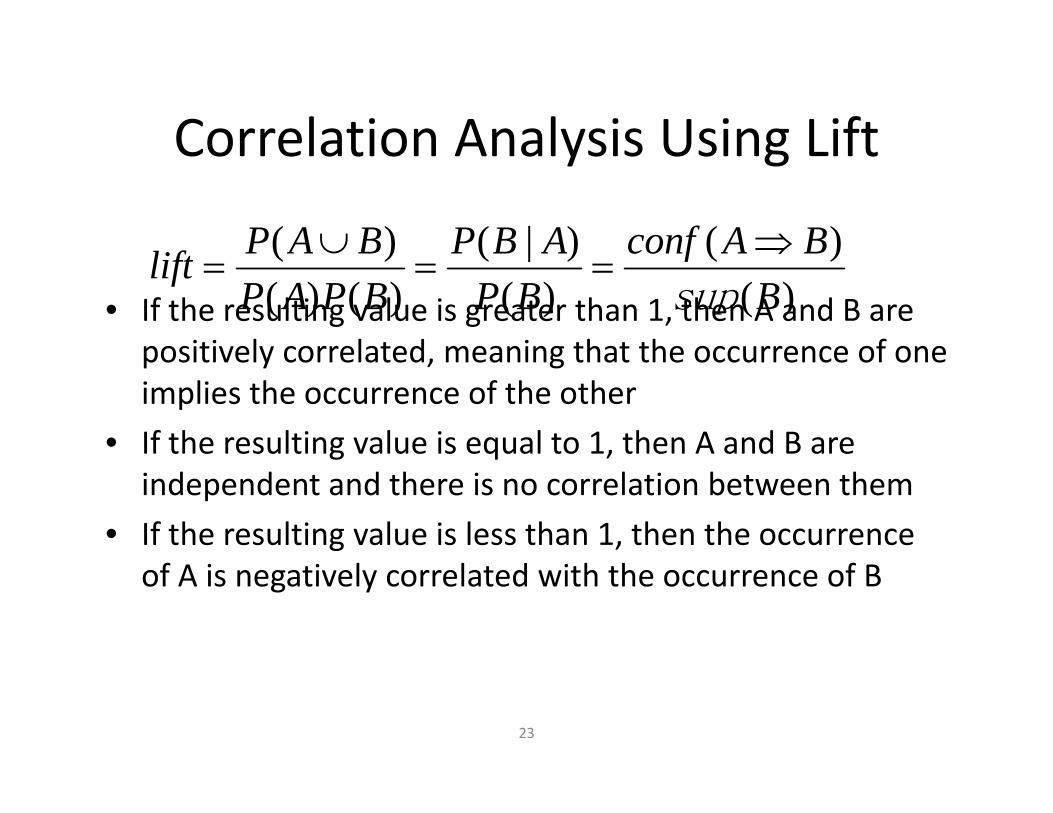
Correlation Analysis Using LiftCorrelation Analysis Using Lift
)()|()( BAconfABPBAPl f ⇒∪
• If the resulting value is greater than 1, then A and B are positively correlated meaning that the occurrence of one
)()(
)()|(
)()() (
BBAconf
BPABP
BPAPBAPlift
sup
⇒==
∪=
positively correlated, meaning that the occurrence of one implies the occurrence of the other
• If the resulting value is equal to 1, then A and B are g q ,independent and there is no correlation between them
• If the resulting value is less than 1, then the occurrence of A is negatively correlated with the occurrence of B
23

Correlation Analysis Using LiftCorrelation Analysis Using Lift
Table 5.7 A 2 X 2 contingency table summarizing the transactions with respect to d id hgame and video purchases.
)()|() ( BAconfABPBAPlift ⇒==
∪=
)()()()( BBPBPAPlift
sup
P({game}) =P({video}) =P({video}) =P({game,video}) =
24

Correlation Analysis Using Chi‐squareCorrelation Analysis Using Chi square
∑ −=
ExpectedExpectedObserved 2
2 )(χ
∑∑= =
−=
c
i
r
j ij
ijij
eeo
1 1
2)(2χj
bBcountaAcounte jiij
)()( =×==
• The larger the Χ2 value, the more likely the variables are related.• If the observed value of the cell is less than the expected value two variables associated
Neij =
• If the observed value of the cell is less than the expected value, two variables associated with the cell is negatively correlated.
25

Correlation Analysis Using Chi‐squareCorrelation Analysis Using Chi square
Table 5.8 The above contingency table, now shown with the expected value.
∑ =−
=Expected
ExpectedObserved 22 )(χ
26


![Mining Frequent patterns, Associations & Correlations [Part-2]Mining Frequent patterns, Associations & Correlations [Part-2] Shubham kumar Dept. of CS&IT MGCU Bihar •](https://img.dokumen.tips/doc/110x75/61393ad1a4cdb41a985b9189/mining-frequent-patterns-associations-correlations-part-2-mining-frequent.jpg)


