Embed Size (px)
Citation preview

10/29/2008 SIP iV-2008 1
Mining Coronal Loops from the SOHO/EIT
Image CollectionNurcan Durak, Olfa Nasraoui Knowledge Discovery & Web Mining Lab
Dept. Of Computer Engineering and Computer ScienceUniversity of Louisville
Joan SchmelzSolar Physics Lab
University of Memphis
This work is supported by NASA Grant No. AISR-03-0077-0139 issued through the Office of Space Sciences and by NSF Grant IIS-0431128

SIP iV-2008 210/29/2008
•CORONAL LOOP: • Arching structure on the surface of the sun• Indication of:
• Steep temperature increase in the sun • Sun storms
• The Search for images with CORONAL LOOP is done manually• � Very TIME-CONSUMING and TEDIOUS.
IMAGES with CORONAL LOOPS: used in temperature analysis

SIP iV-2008 310/29/2008
-The SOHO EIT (Extreme ultraviolet Imaging Telescope ) has been picturing the sun (solar transition+inner corona) since 1996.
A lot of data!!!
-171 Ao is the best for coronal loop visibility
- Average number of picture per day is 3
- 12X365X3 = 13,140

SIP iV-2008 410/29/2008
Our Goal:Retrieve images with coronal loops from the data set automatically.
SOLAR IMAGEDATA SET
SOLAR IMAGES with
CORONAL LOOPS
Automatic Detection
� No existing system for detecting coronal loop regions automatically (when we started our project in 2004).
� Coronal Loop Tracing Methods�The existence of a loop is already known
� in a given region� And in a given image
�However, in our case, we do not even know the existence of a loop structure in the images.
SIP iV-2008 510/29/2008
Differences Compared to Other Studies

SIP iV-2008 610/29/2008
TRAINING PHASE(Learn loop characteristics)
TESTING PHASE(Use the training models
to decide whether an image has loops or not. )
Training Models
SOLAR IMAGEDATA SET
SOLAR IMAGES with
CORONAL LOOPS
Solar Loop Mining System
SIP iV-2008 710/29/2008
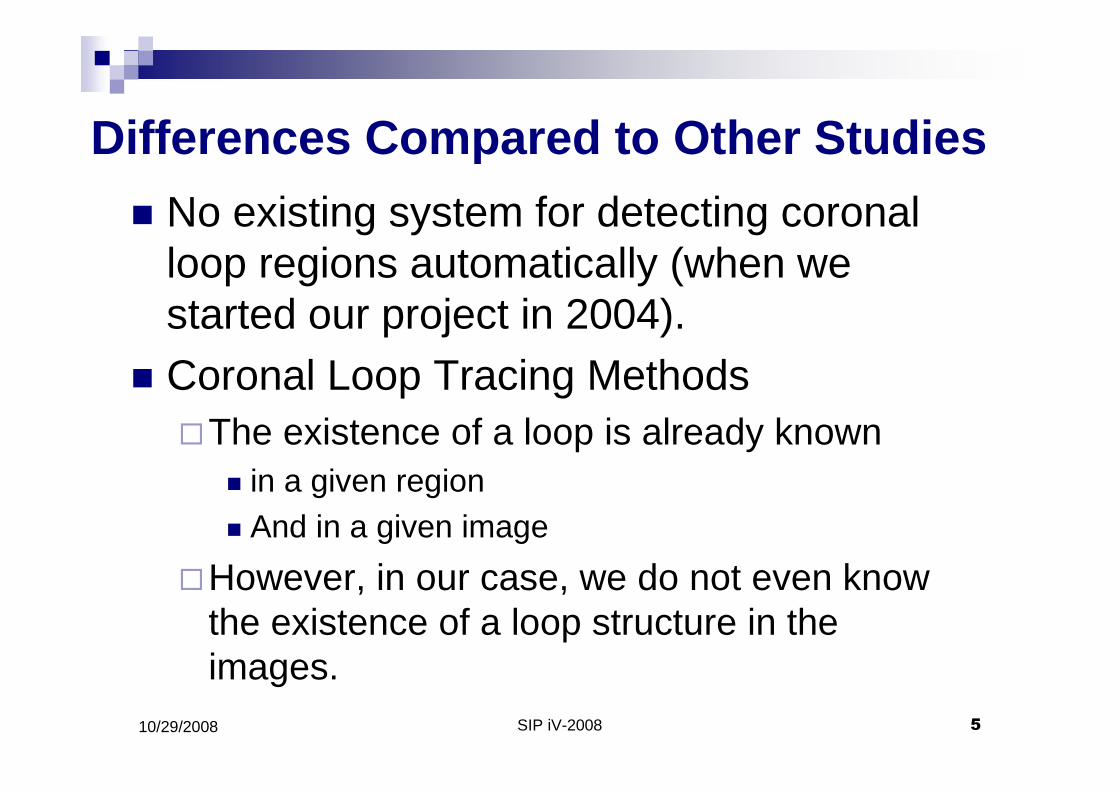
Training Phase
SIP iV-2008 810/29/2008
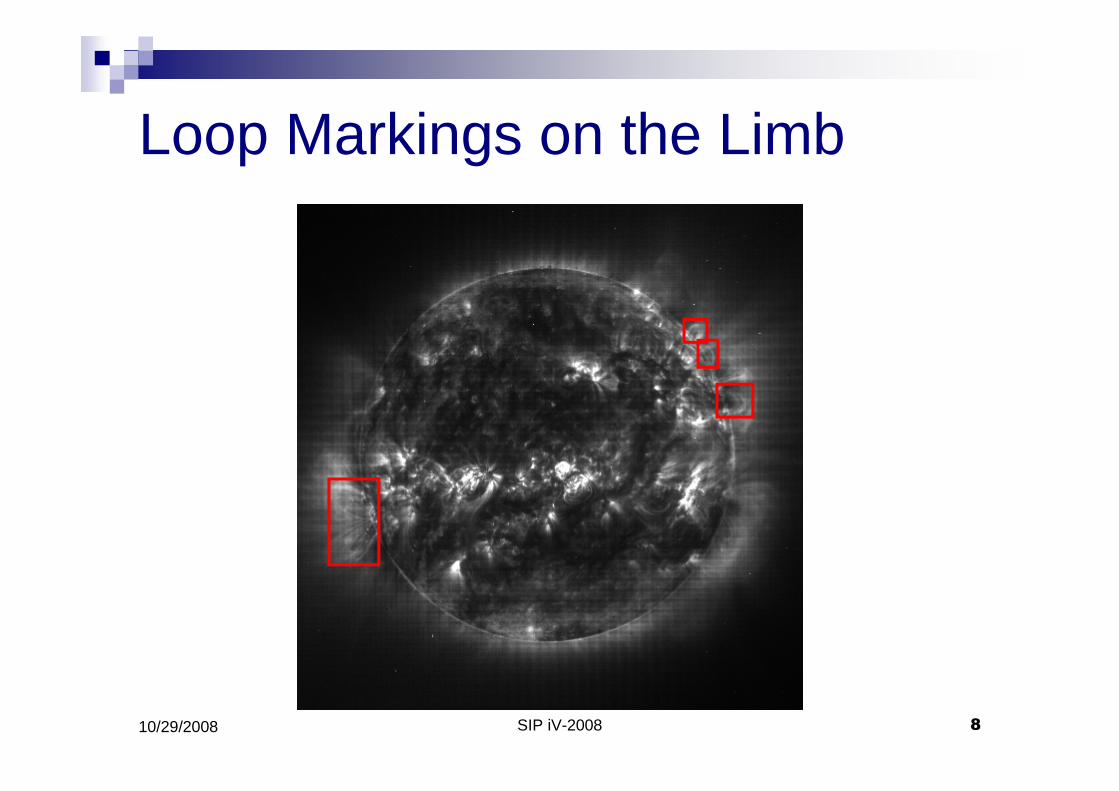
Loop Markings on the Limb

SIP iV-2008 910/29/2008
IMAGE PRE-PROCESSING
� Smoothing
� Despeckling� To remove noise
� Background Subtraction� To remove bright regions

SIP iV-2008 1010/29/2008
Block Extraction: Divide the circumference of the sun into fixed size blocks.
Automatic Labeling: - If a block intersects with a
loop marking, then its label is assignedas “LOOP”.
- Otherwise, as “NO-LOOP”
-Two classes:-LOOP-NO-LOOP
Average 55 blocks from image- Avg. # of LOOP blocks = 3 to
6-Avg. # of NO-LOOP blocks =
50
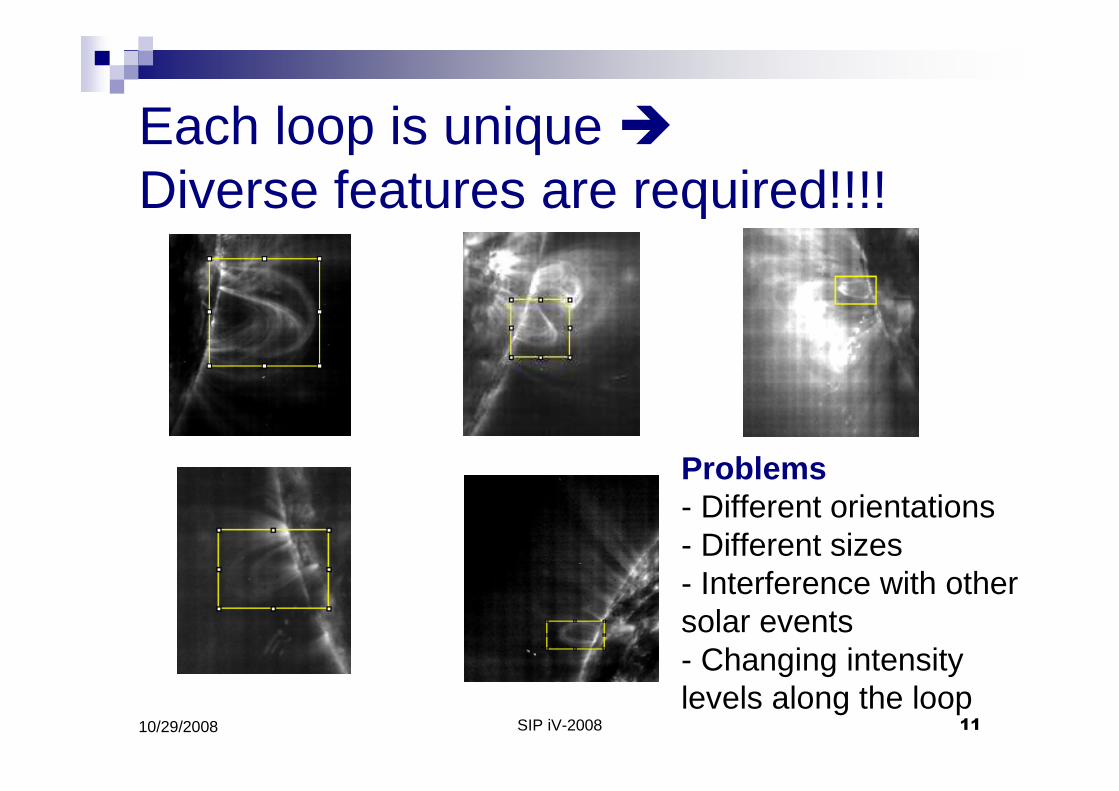
Each loop is unique �
Diverse features are required!!!!
SIP iV-2008 1110/29/2008
Problems- Different orientations- Different sizes- Interference with other solar events- Changing intensity levels along the loop

NO-LOOP regions may have similar characteristics to LOOP regions.
SIP iV-2008 1210/29/2008
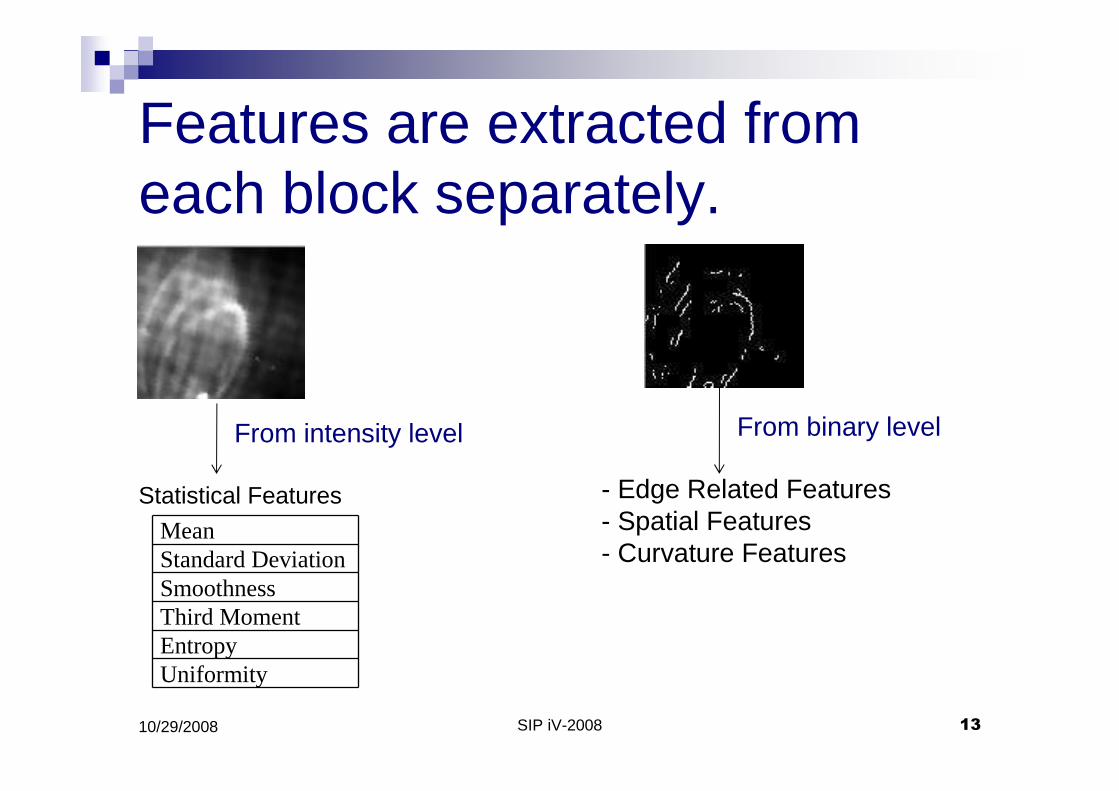
Features are extracted from each block separately.
SIP iV-2008 1310/29/2008
Statistical Features
From intensity level From binary level
MeanStandard DeviationSmoothnessThird MomentEntropyUniformity
- Edge Related Features- Spatial Features- Curvature Features

Edge Related Features: extracted from the Hough Transform of a binary block
SIP iV-2008 1410/29/2008
Feature Name DescriptionNumber of Edge Points Number of points in the original
imageNumber of Lines Number of peaks in Hough SpaceLength of the longest line Number of points in the most
crowded peakNumber of Vertical Edges # of peaks whose angle between
80o and 100o
Number of Horizontal Edges #of peaks whose angle between 0o and 10o or 170o and 180o
Number of 45o Edges #of peaks whose angle between 35o and 55o
Number of 135o Edges # of peaks whose angle between 125o and 145o
Number of Non-Directional Edges
#of peaks whose angle does not match the above criteria
Hough Space

Spatial features : consider typically distinct edge distribution in 4 horizontal bands of a block
Feature Name Description
First Band Number of edge pixels in the first bandSecond Band Number of edge pixels in the second band
Third Band Number of edge pixels in the third bandFourth Band Number of edge pixels in the fourth band
SIP iV-2008 1510/29/2008
LOOP blockNO-LOOP block
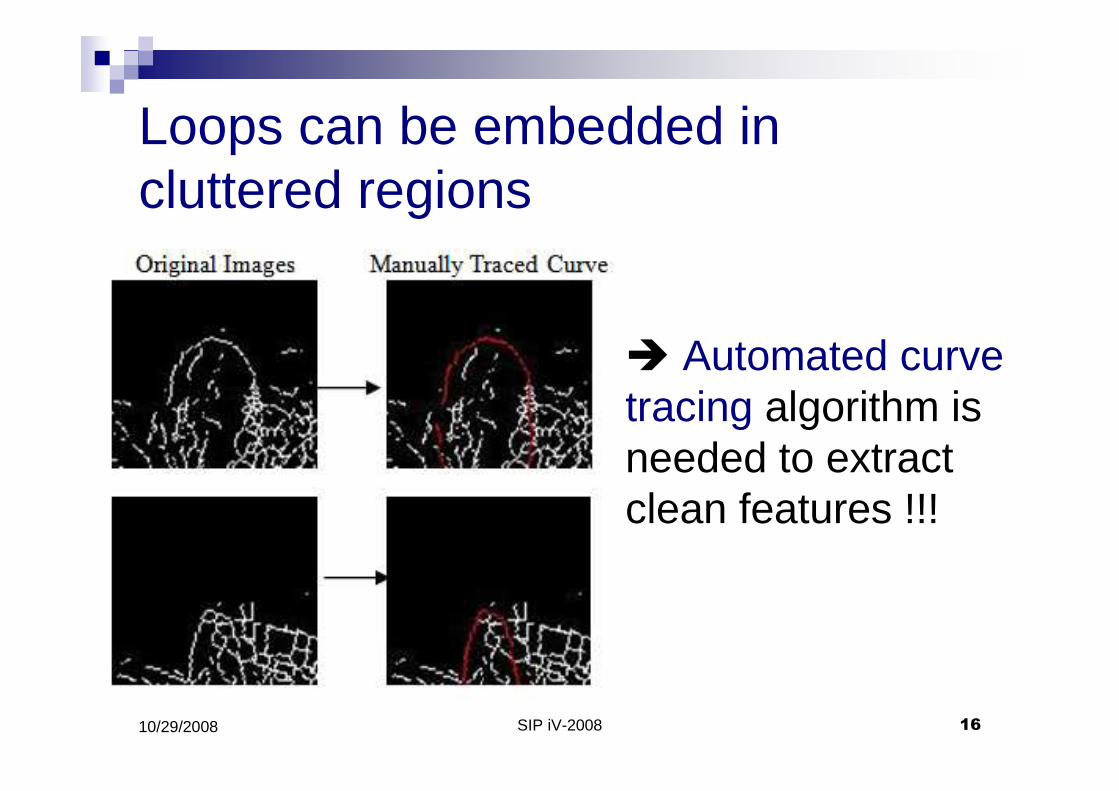
Loops can be embedded in cluttered regions
SIP iV-2008 1610/29/2008
� Automated curve tracing algorithm is needed to extract clean features !!!

Which way to go???
SIP iV-2008 1710/29/2008
2
-3-2
0
-1
13
4
Specialized Chain Code for orientation changes
What about same weighted points?
-Start from a point-Find neighbors of the point
(Not only 8 neighborhoods since gaps)-Add the best continuation point
Calculate weight for each point usingorientation changes + Euclidian Distance
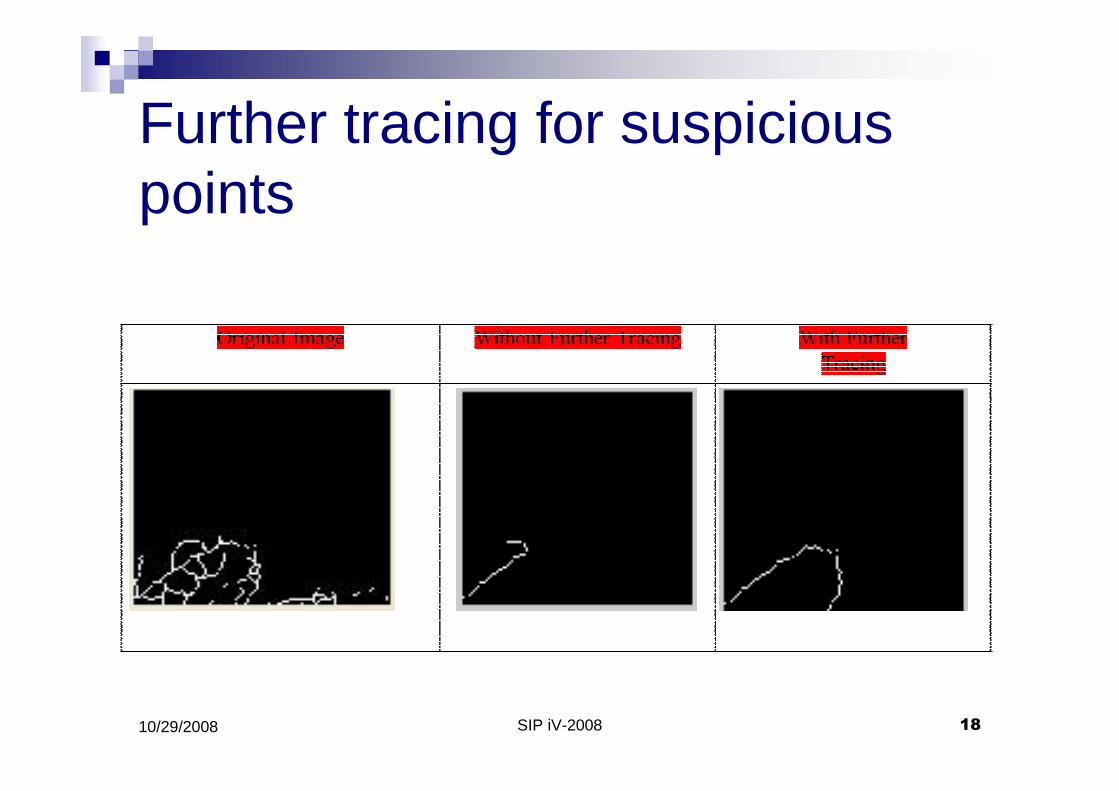
Further tracing for suspicious points
SIP iV-2008 1810/29/2008
SIP iV-2008 1910/29/2008
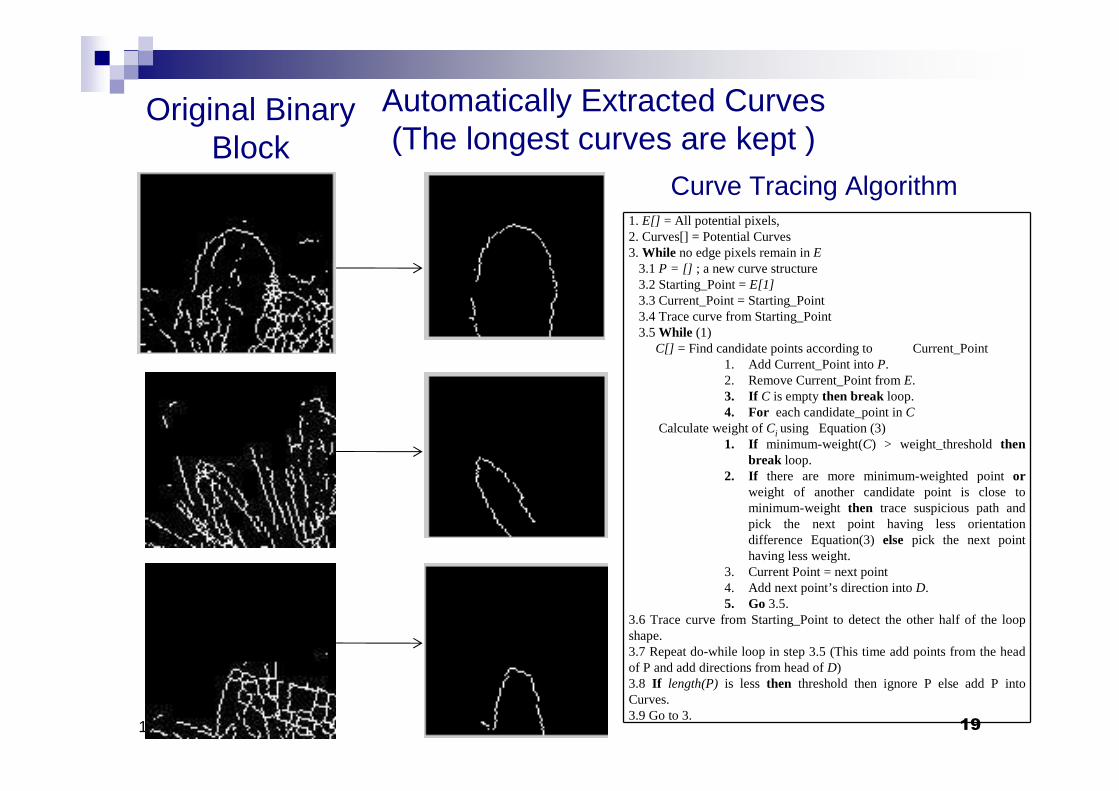
Original Binary Block
Automatically Extracted Curves(The longest curves are kept )
1. E[] = All potential pixels, 2. Curves[] = Potential Curves 3. While no edge pixels remain in E
3.1 P = [] ; a new curve structure3.2 Starting_Point = E[1]3.3 Current_Point = Starting_Point3.4 Trace curve from Starting_Point3.5 While (1)
C[] = Find candidate points according to Current_Point1. Add Current_Point into P.2. Remove Current_Point from E.3. If C is empty then break loop.4. For each candidate_point in C
Calculate weight of Ci using Equation (3)1. If minimum-weight(C) > weight_threshold then
break loop.2. If there are more minimum-weighted point or
weight of another candidate point is close to minimum-weight then trace suspicious path and pick the next point having less orientation difference Equation(3) else pick the next point having less weight.
3. Current Point = next point4. Add next point’s direction into D. 5. Go 3.5.
3.6 Trace curve from Starting_Point to detect the other half of the loop shape. 3.7 Repeat do-while loop in step 3.5 (This time add points from the head of P and add directions from head of D) 3.8 If length(P) is less then threshold then ignore P else add P into Curves.3.9 Go to 3.
Curve Tracing Algorithm
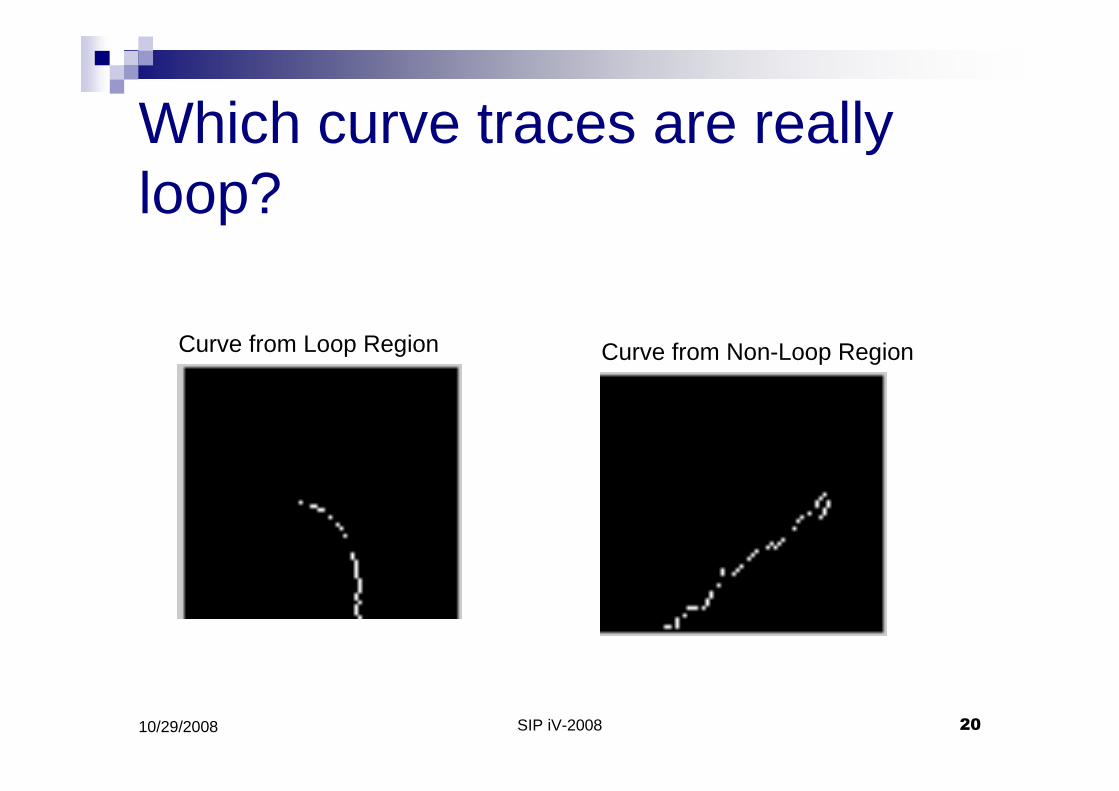
Which curve traces are really loop?
SIP iV-2008 2010/29/2008
Curve from Loop Region Curve from Non-Loop Region

Curvature Strength
SIP iV-2008 2110/29/2008
1
45*)1()()(
))1(),(min(
2
−
−−−
=∑
=
n
iiDlen
ilenilenn
i
θθδ
• Divide the curve into segments• Calculate the angle differences among adjacent segments• Calculate curvature strength by using:
• radius of the curve,• average angle differences• length of the segments•Sign changes•Number of segments
Curvature-Strength (D) = w1*Radius + w2* δ +w3* β +w4*l + w5*n
β = (l - | θ+ – θ- |) / l
D = [(-2, -2, -1, -2), (0, -1, -1, -1, -1), (1, 1, 2, 1, 2)]

Curvature features: extracted from the automatically traced curves
SIP iV-2008 2210/29/2008
Feature Name Expression
Curvature Strength A degree between 0 to 100 to show how curvy traced curve is
Peak Angle Angle at the intersection of two lines from the peak point to two endpoints of the curve
Curve Length Total number of points in the curve
Curve Distance Euclidean distance between endpoints of the curve
Sign Distribution Sign distribution along the curve
α
Curve Distance
Peak Angle
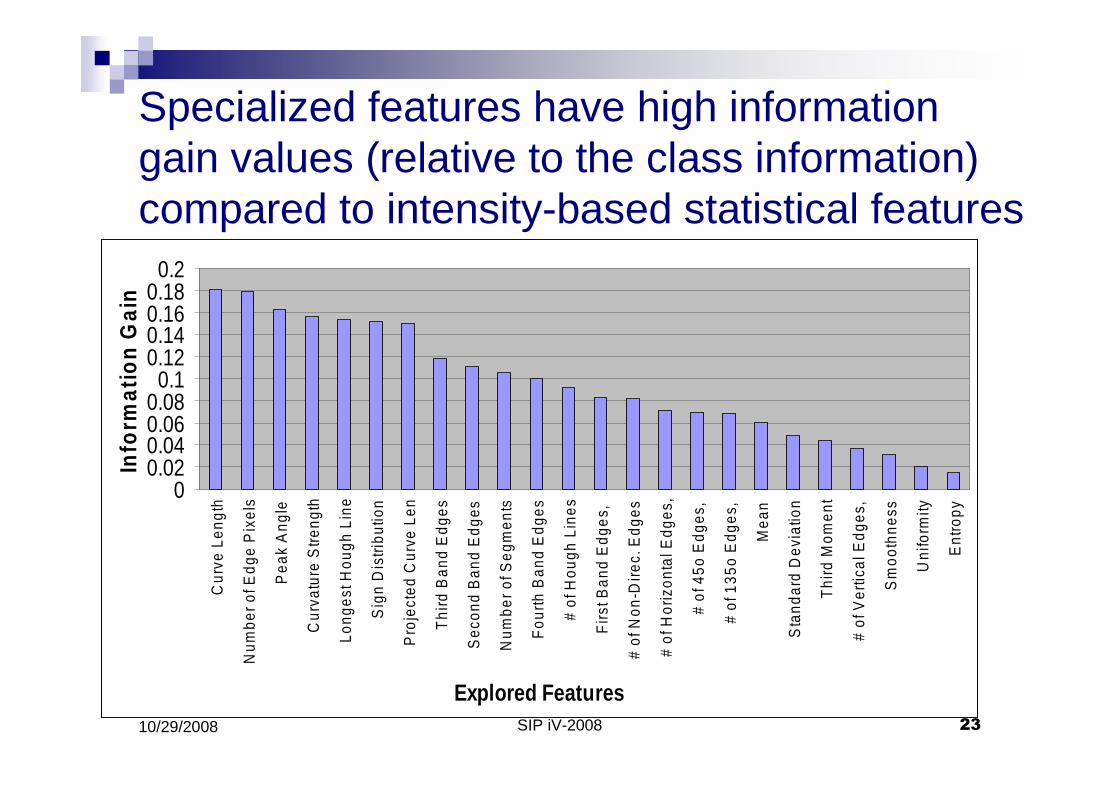
Specialized features have high information gain values (relative to the class information) compared to intensity-based statistical features
SIP iV-2008 2310/29/2008
00.020.040.060.08
0.10.120.140.160.18
0.2
Cur
ve L
engt
h
Num
ber o
f Edg
e P
ixel
s
Pea
k A
ngle
Cur
vatu
re S
treng
th
Long
est H
ough
Lin
e
Sig
n D
istri
butio
n
Pro
ject
ed C
urve
Len
Thi
rd B
and
Edg
es
Sec
ond
Ban
d E
dges
Num
ber o
f Seg
men
ts
Fou
rth B
and
Edg
es
# of
Hou
gh L
ines
Firs
t Ban
d E
dges
,
# of
Non
-Dire
c. E
dges
# of
Hor
izon
tal E
dges
,
# of
45o
Edg
es,
# of
135
o E
dges
,
Mea
n
Sta
ndar
d D
evia
tion
Thi
rd M
omen
t
# of
Ver
tical
Edg
es,
Sm
ooth
ness
Uni
form
ity
Ent
ropy
Explored Features
Info
rmat
ion
Gai
n
SIP iV-2008 2410/29/2008
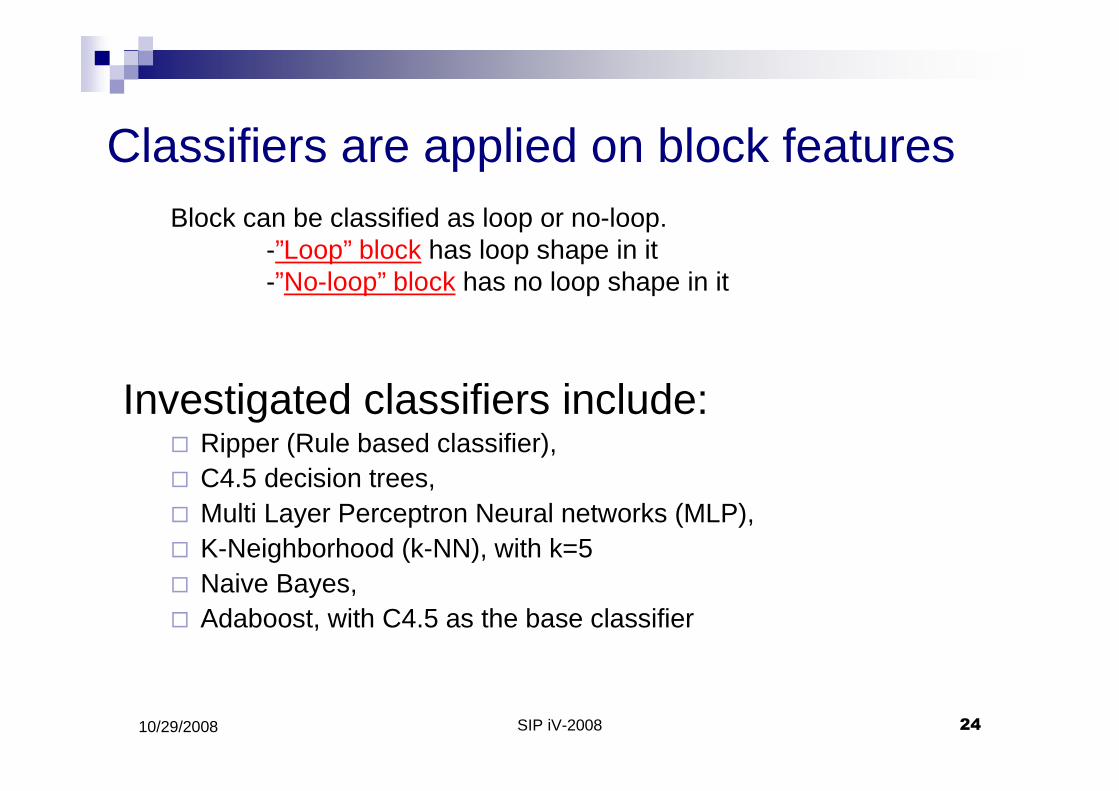
Classifiers are applied on block features
Investigated classifiers include:� Ripper (Rule based classifier), � C4.5 decision trees,� Multi Layer Perceptron Neural networks (MLP),� K-Neighborhood (k-NN), with k=5� Naive Bayes, � Adaboost, with C4.5 as the base classifier
Block can be classified as loop or no-loop.-”Loop” block has loop shape in it-”No-loop” block has no loop shape in it

SIP iV-2008 2510/29/2008
Classifier Results� 180 solar images
� 30 images from each of the following years: � 1996, 1997, 2000,2001, 2004, 2005
� After block extraction: � 403 Loop blocks and 7950 No-loop blocks
� 10-fold cross validationStatistical Features
Edge Related Features
Spatial Features
Curvature Features
All Features
Classifier Pre. Rec. Pre. Rec. Pre. Rec. Pre Rec. Pre. Rec.
AdaBoost(C4.5)
0.379 0.243 0.458 0.453 0.499 0.484 0.501 0.48 0.644 0.669
NB 0.179 0.083 0.519 0.606 0.527 0.565 0.374 0.876 0.365 0.768
MLP 0.536 0.218 0.501 0.577 0.515 0.423 0.572 0.561 0.621 0.694
C4.5 0.451 0.209 0.516 0.516 0.516 0.547 0.5 0.552 0.598 0.626
RIPPER 0.48 0.185 0.565 0.489 0.515 0.495 0.526 0.574 0.623 0.696
K-NN (k=5)
0.42 0.2 0.497 0.437 0.542 0.439 0.563 0.484 0.644 0.615
Pre = Precision = (# of correctly predicted loop blocks) / (# of predicted loop blocks)Rec = Recall = (# of correctly predicted loop blocks) / (#of actual loop blocks)
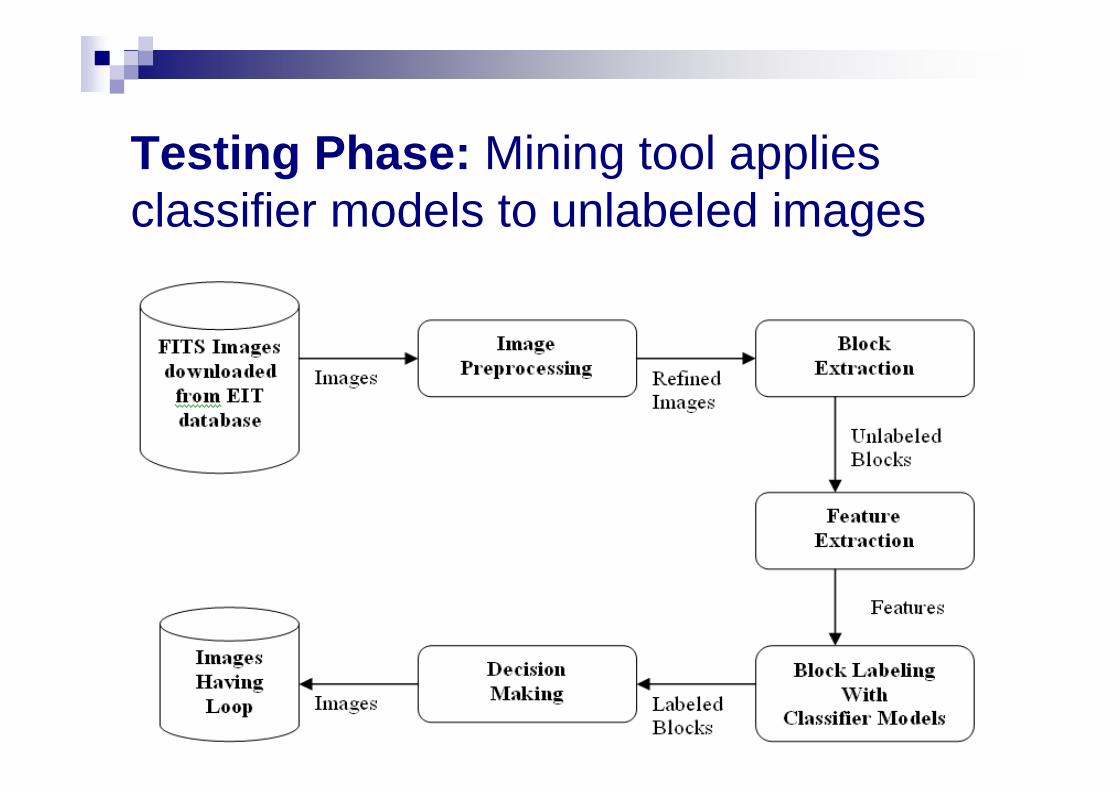
Testing Phase: Mining tool applies classifier models to unlabeled images
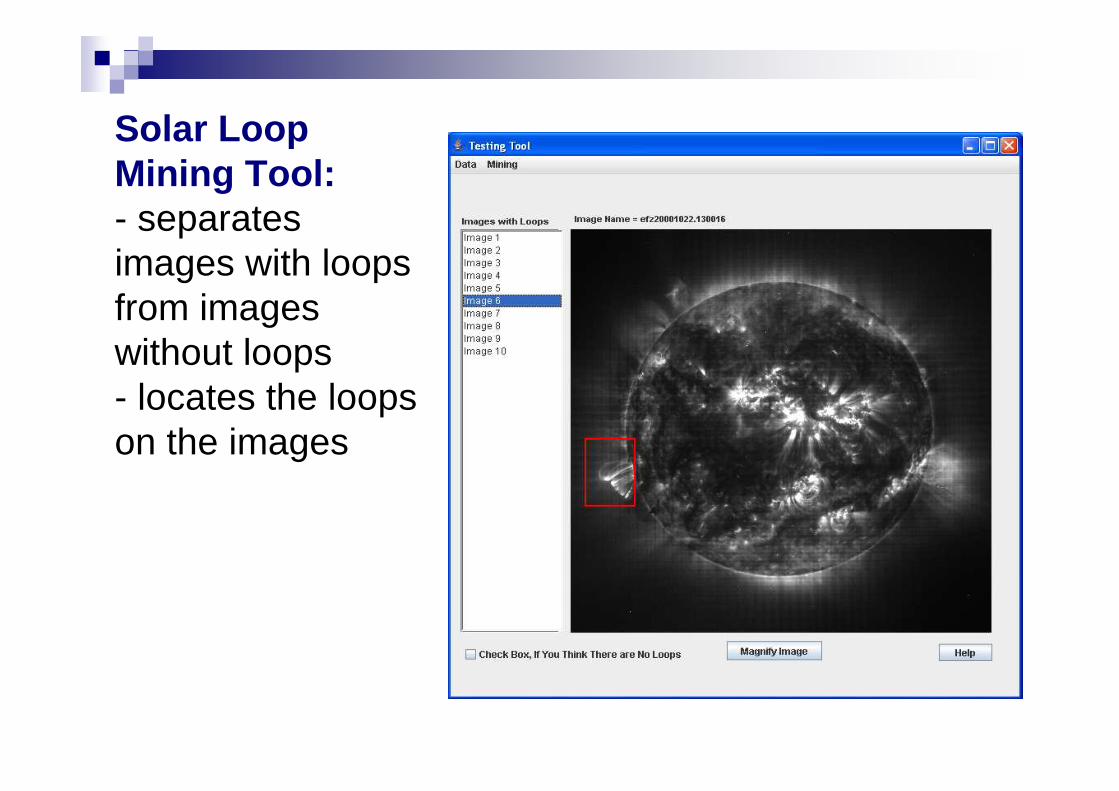
Solar Loop Mining Tool:- separates images with loops from images without loops- locates the loops on the images
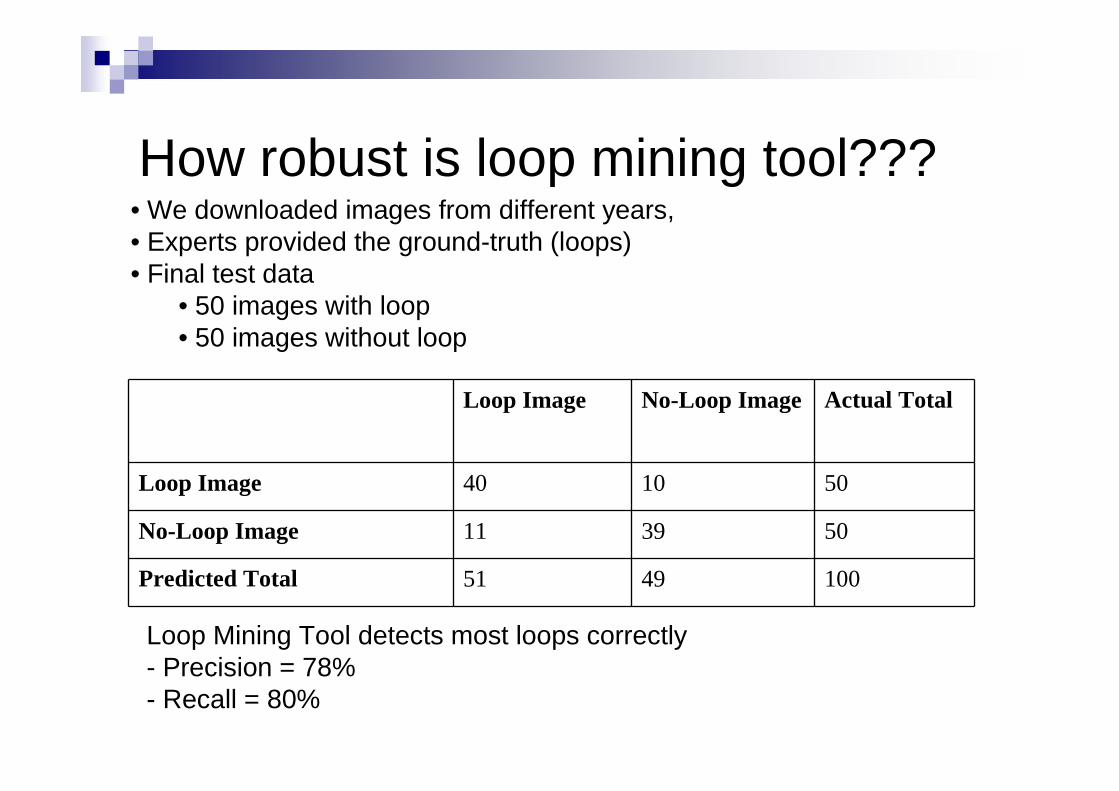
How robust is loop mining tool???
Loop Image No-Loop Image Actual Total
Loop Image 40 10 50
No-Loop Image 11 39 50
Predicted Total 51 49 100
• We downloaded images from different years,• Experts provided the ground-truth (loops)• Final test data
• 50 images with loop• 50 images without loop
Loop Mining Tool detects most loops correctly- Precision = 78%- Recall = 80%

Do solar cycles affect training?
Image from minimum cycle Image from maximum cycle

Minimum Cycle Maximum Cycle All Cycles
Pre. Rec. Pre. Rec. Pre. Rec.
Loop Images 0.5 0.9 0.8 1 0.88 0.83
Training with only images from Minimum cycle
(60 images)
Testing with only images from Minimum cycle
(20 images, half have loops)ClassifierModels
Training with only images from Maximum cycle
(60 images)
Testing with only images from Maximum cycle
(20 images, half have loops)ClassifierModels
In maximum cycle: the more loop shapes, the higher the recall but the lower non-loop region separation.
In minimum cycle: the fewer loop shapes, the lower the precision but higher non-loop region separation..
All cycles: the most robust learning results.Conclusion: - All kinds of loop shapes are necessary for better learning,- Possibly because we do not have enough labeled dat a ���� we can’t be picky (yet..!)
Conclusions
� Solar Loop Mining Tool with 80% recall
� Specialized features overcome standard features� All-features combination gives better results in the
final solar loop mining tool� Building training data and testing data (for
evaluation) requires human effort � This has limited our experimental capacity
� � currently working on a feedback tool to help with this limitation
� also have some promising results on TRACE images
SIP iV-2008 3210/29/2008
THANK YOU for YOUR ATTENTION!!
Above TRACE loop is known to some Astrophysicists as Cinderella