Embed Size (px)
Citation preview

Mining Activity ClustersFrom Low-level Event Logs
Christian W. Gunther and Wil M.P. van der Aalst
Department of Technology Management, Eindhoven University of TechnologyP.O. Box 513, NL-5600 MB, Eindhoven, The Netherlands{c.w.gunther, w.m.p.v.d.aalst }@tm.tue.nl
Abstract. Process mining techniques have proven to be a valuable tool for ana-lyzing the execution of business processes. They rely on logs that identify eventsat an activity level, i.e., most process mining techniques assume that the infor-mation system explicitly supports the notion of activities/tasks. This is often notthe case and only low-level events are being supported and logged. For example,users may provide different pieces of data which together constitute a single ac-tivity. The technique introduced in this paper uses clustering algorithms to deriveactivity logs from lower-level data modification logs, as produced by virtuallyevery information system. This approach was implemented in the context of theProM framework and its goal is to widen the scope of processes that can be ana-lyzed using existing process mining techniques.
1 Introduction
Business Process Management(BPM) technology [2, 16, 17, 19] has become an integralpart of the IT infrastructure of modern businesses, most notably in knowledge-intensivefields (e.g. public administration or the financial sector). The potential to create digitalcopies of a document, allowing multiple persons to work with these simultaneously,can greatly improve the performance of process execution.Process-Aware InformationSystems(PAISs) make it possible to control this distribution of work, based on a processdefinition. This process definition containsactivities, i.e. self-contained partitions ofthe work to be done, between which causal relationships are defined. Once a process isstarted, the PAIS creates a process instance, assigns activated tasks to appropriate users,and controls the activation of subsequent tasks based on the process definition.
In contrast to an industrial process, where one can literally follow the productthrough all stages of its manufacturing process, monitoring and evaluating the executionof an informational process is a complex endeavor. In recent years, several techniquesto this end have been proposed, subsumed under the termBusiness Process Intelligence(BPI).
A subset of these methods belongs to the field ofprocess mining[4, 8, 5], whichdeals with the analysis of process execution logs. From these logs, process miningtechniques aim to derive knowledge in severaldimensions, including the process modelapplied, the organizational structure, and the social network. This information about theactual situation can then be compared to the intended process definition and the orga-nizational guidelines. Discovered discrepancies between the process definition and the
2
real situation can be used to better align process and organization, to remedy perfor-mance bottlenecks and to enforce security guidelines.
One of the drawbacks current Process Mining techniques [6, 13, 3, 4] face is thattheir requirements towards execution logs to be mined are satisfied only by PAIS. Theseare designed around the idea of having a defined process model, comprising of atomicactivities. However, a large number of BPM systems exists which do not enforce astrictly prescribed process model, but rather provide users with a generic environmentto collectivelymanipulate and exchange information. An example of such unstructuredBPM systems are most Enterprise Resource Planning (ERP) systems (e.g. SAP R/3).
Although some ERP systems include a workflow management component whichenables the implementation of a PAIS, its use is not enforced. Thus, ERP logs typicallydo not contain events referring to the execution of activities, rather they refer tolow-level modifications of atomic data objectsin the system. However, this does not implythat the concept of an activity does not exist in an ERP system. Although they arenot explicitly defined and logged, users tend to modify semantically related data withinone logical step. Theformmetaphor, which is implemented in almost every informationsystem, allowing users to fill in a number of data fields combined on one screen, stronglysupports this paradigm.
It is highly desirable, and often necessary, to make these tacit activity patterns ex-plicit, in order to analyse aspects of process execution on a more abstract level. Thetechnique presented in this article uses clustering techniques to discover these “im-plicit” activities in low-level logs. It is based on the notion ofproximitybetween low-level events, deriving from that measure a semantical relationship between modifieddata objects.
The fundamental idea of this approach is that an activity is a recurring pattern oflow-level events, modifying the same set of data types in a system. Clusters of datamodification events from an initial scan are subsequently aggregated to higher-levelclusters, which are finally filtered to yield the patterns most likely to represent activities.By abstracting from the very low level of data modification logs to the activity level,this technique has the potential to substantially extend the field of systems that can beanalyzed with Process Mining techniques.
This paper is organized as follows. The following section investigates the semanticand structural relationships between high- and low-level logs, followed by the introduc-tion of a lifecycle model for data objects in Section 3. Section 4 introduces the basicnotion of an event log and describes the pieces of information typically contained ina log. The subsequent three sections describe the three stages of the actual algorithm:the initial scan, theaggregation passand thefinal selectionof the most fit candidates.Section 8 describes implementation-specific aspects, followed by an overview on appli-cations in Section 9. The article closes by linking to related work in Section 10, and aconcluding discussion in Section 11.
2 Relationships Between High- and Low-level Logs
A business process describes the handling of a given case, where the case is the primaryobject to be manufactured, e.g. a car insurance claim. From atop-downperspective this
3
can be interpreted as breaking down the high-level goal (“Assess whether we pay forthe damage caused”) into a set of lower-level sub-goals (e.g., “Review client history”,“Investigate the accident“), and establishing suitable ordering relations between them.Executing thetasks, i.e. accomplishing these sub-goals, in the specified order will thenyield the accomplishment of the high-level goal, i.e. finishing the case.
Process modeling can, however, also be interpreted as abottom-updesign processwhen approached from a different perspective. Especially in knowledge-intensive do-mains, e.g. administration, a business process is essentially a structured way of creating,modifying and processing large amounts of data. In the above example, a large set ofatomic data objects (e.g., name and address of the client, and a detailed description ofthe accident) need to be collected. By successively processing and combining these ob-jects into higher-level data (e.g., whether the accident has been caused by the client),the desired end product (e.g. “$2,500 will be paid”) is eventually created.
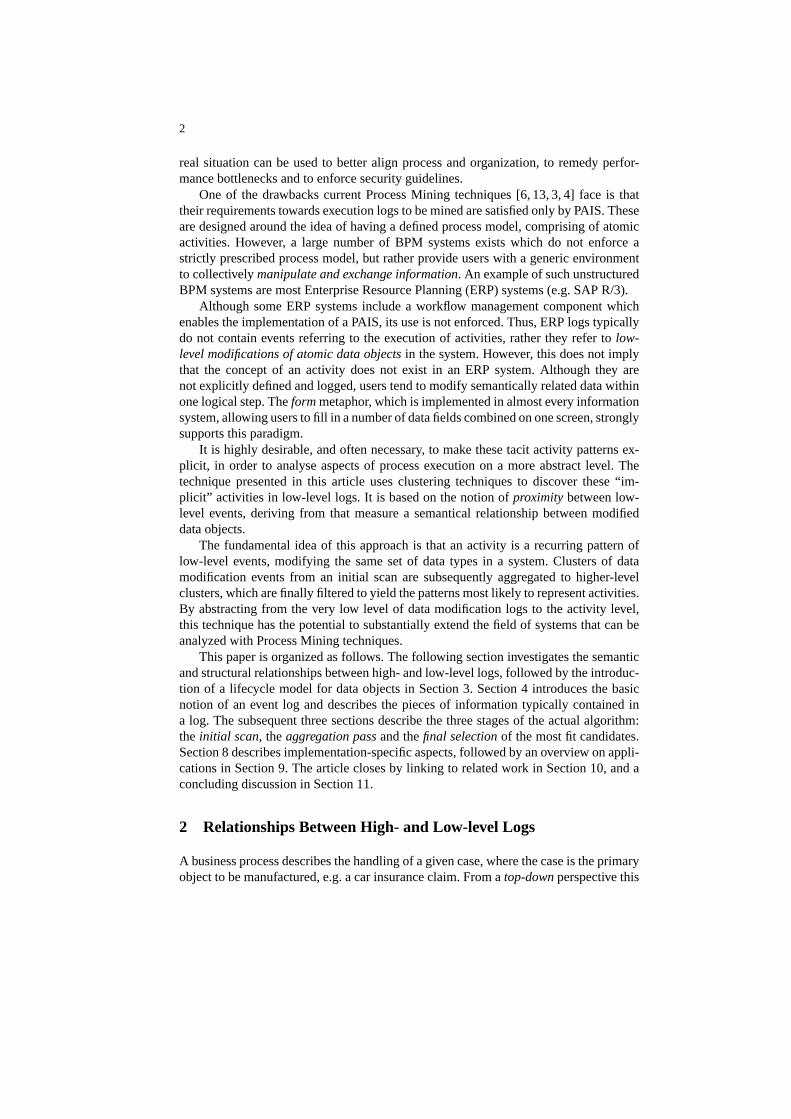
The relation between the manufactured low-level data types and the higher-leveltasks (i.e., sub-goals) of the business process can be described as follows:A task groupsa set of data-modifying operations that are closely semantically related, and whichtypically occur together. For example, the task “record client data” will typically alwaysconsist of the modifications of data types “Name”, “Street”, “Customer number”, andso forth.
open form
set ‘A’ set ‘B’ set ‘N’redo
close form
redo redo
Fig. 1. Activity data modification model
Most user-centered PAISs use the concept of forms, which are interface masks con-taining an input field for each data type required. When a user executes a task he willbe presented with the respective form, on which he can fill out the information for thistask. While the ordering of tasks is controlled and enforced by the PAIS, the order inwhich to provide the low-level data is usually up to the user (i.e., he can freely navigatewithin the form). This concept is shown in Figure 1 in terms of a Petri net. Notice that,in addition to the concurrency of data modification operations, there is also the possi-bility that data objects are (potentially repeatedly) deleted and set to a different valuewithin a task (e.g., when correcting a misspelled name).
This relationship of the higher-level task incorporating lower-level data modifica-tion operations on a semantic level is likewise exhibited on a temporal level, as shownin Figure 2. Data modification events occur within the realm of their high-level tasks,

4
AB
C
D
A B C D
a1 a2 a3 b5 b4 b6 c7 c8 c9 c8 d10 d11 d12
process definition
task log
data mod. log
t
t
Fig. 2. Relations between multiple levels of abstraction
i.e. between their start and end events. In a system like FLOWer (Pallas Athena, [11]),a case handling system [1, 7] which can create logs on both the task and the data objectlevel, this obvious property can be easily observed. Each execution of a task leaves adistinctive trace in the data modification log, i.e. a typical set of events referring to mod-ifications of the set of data types accessible in this task. This typical set of data typesmodified by an activity shall be referred to as the activity’sfootprint.
Table 1.Example excerpt of a low-level event log
# Timestamp PID Event Originator423 12.07.05;14:24:03 37 custfirstnamep37 Brian424 12.07.05;14:26:22 37 custlastnamep37 Brian425 12.07.05;14:26:33 34 complaintcustomeridp34 Stewie426 12.07.05;14:26:55 37 custstreetp37 Brian427 12.07.05;14:27:20 34 complaintorderidp34 Stewie428 12.07.05;14:27:52 37 custcity p37 Brian429 12.07.05;14:28:23 37 custzip p37 Brian430 12.07.05;14:28:44 34 complaintvaluep34 Stewie431 12.07.05;14:29:34 34 complaintstatusp34 Stewie432 12.07.05;14:29:34 34 complainthandleridp34 Stewie433 12.07.05;15:44:06 38 custlastnamep38 Brian434 12.07.05;15:44:33 38 custfirstnamep38 Brian435 12.07.05;15:45:52 38 custstreetp38 Brian436 12.07.05;15:47:04 34 servicedatep38 Peter437 12.07.05;15:47:15 38 custzip p38 Brian438 12.07.05;15:48:34 38 custcity p38 Brian439 12.07.05;15:55:36 34 servicetechnidp38 Peter440 12.07.05;16:01:01 34 servicesysidp38 Peter441 12.07.05;16:03:22 34 serviceresult p38 Peter

5
An example excerpt of a low-level log is given in Table 1. Each line represents oneevent, with its sequence number, time of occurrence, process instance id, name, andoriginator1 information. Judging from a first glimpse, the log appears to be confusingand scattered. A great number of cryptic events occur during a relatively short time, andtheir relation is not clear.
After taking a closer look at Table 1 there are several hints about the relationshipsbetween the single events. It appears to be a commonplace pattern that events withinthe same process instance, triggered by the same originator, occur within a relativelysmall time frame. For example, it seems that Stewie has triggered all events whosenames start with “complaint”, and these have all occurred within roughly three minutes.Earlier in the log, there are some events triggered by Brian, each starting with “cust”and also exhibiting similar characteristics (limited time span, same process id), partlyinterleaved with Stewie’s events. Notice that the same set of event names occurs againlater on, also triggered by Brian but in a different order.
From all we have seen, this looks very much like a low-level log which has resultedfrom the execution of higher-level processes. Brian’s and Stewie’s events at the begin-ning of the log seem to have resulted from their concurrent execution of two higher-level activities. In order to analyze what has been going on in a more abstract fashion,and to rediscover the underlying, higher-level process model, it is crucial to reconstructtask-level events from these low-level patterns.
The subsequent two sections discuss the specific properties of data objects in abusiness process, and their associated low-level logs. Based on these properties andtheir typical relations to higher-level logs and processes, an algorithm for the discoveryof activity patterns is introduced in Sections 5, 6, and 7. After introducing the algo-rithm we describe the implementation in the ProM framework [14] and discuss possibleapplications.
3 Data Object Lifecycle
The incentive for using a PAIS is usually that in an organization a standard set of busi-ness processes exist, which are repeatedly executed in a large volume. Therefore,pro-cess definitionsare created which describe all the potential paths that the execution ofone typeof process can follow. When such a process is being executed, aprocess in-stanceis created, which binds the abstract process definition to an actual set of resourcesand data for the specific case.
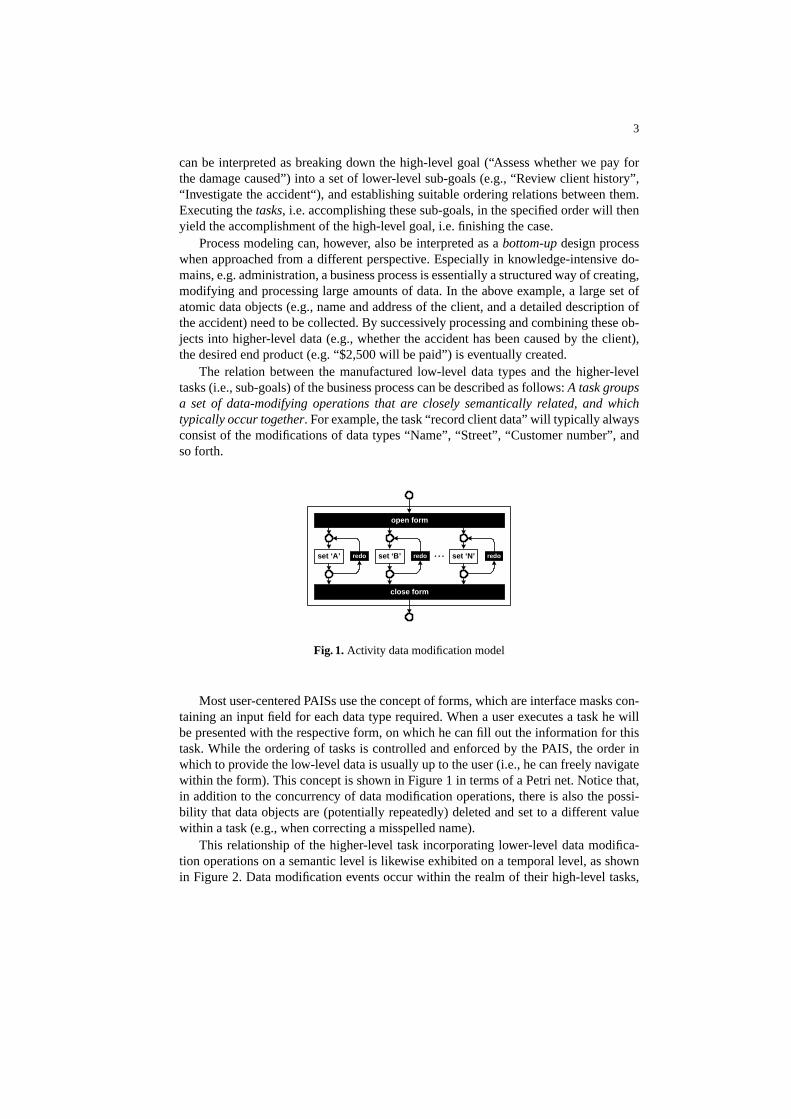
This relationship is depicted in Figure 3. The<<instanceof>> relation, whichdescribes the connection between the type and instance level, is also apparent for theelements of a process definition: Abstract tasks defined in the process definition, onceinstantiated and bound to an executing resource, spawn activities. Data types, like thefields of a customer address defined in a process definition, are also instantiated toobjects for each process instance.
Thedata typesdefined in a process definition are not actual data objects, but rathertemplates that describe the potential values of their instantiations (e.g., in programming
1 The originator refers to the person, or resource, having caused the respective event (e.g. anemployee filling out a form).
6
Process Definition
Activity
Task Data Type
Data Object
ProcessInstance
<<instanceof>>
<<instanceof>> <<instanceof>>
ActivityEvent DataEvent
ActivityAuditTrail DataAuditTrail
<yields>
<yields> <yields>
HighLevelLog LowLevelLog
<modifies>
<modifies>
1
1
1..n
1 1
1
1
1
1
1 1
1 1
1..n 0..n1..n 0..n
0..n
1..n0..n0..n
0..n 0..n
0..n 0..n1..n 1..n
1..n 0..n
0..10..1
Fig. 3. Type-instance relationships on process, task and data level (UML 2.0 class diagram)
languages, defining a variable as “Integer” does not describe its value, but rather itsnature and range). When a process is started, for each of these data types correspond-ing data objectsare instantiated, which are subsequently set to actual values duringexecution.
The UML diagram shown in Figure 3 further describes the relationship between thetask and data dimensions of a process, and their respective log events. Activities, beingsingular executions of tasks, always refer to exactly one task-level event in the log.Data instances, on the other hand, can be modified repeatedly, with transitions in theirlifecycle resulting in data-level log events. Both on the task and data level, audit trailsgroup all events having occurred within one process instance. Logs can be interpreted ascontainers for audit trails: they can contain multiple audit trails for the same process oreven audit trails for multiple processes, as they are often capturing all events occurringin one information system.
The lifecycle of data objects during the execution of a process instance is describedin the state-transition system shown in Figure 4.
Each transition in this model, i.e.define(DEF), delete(DEL), update(UPD), roll-back(RBK), andconfirm(CNF), is associated with a respectiveeventoccurring withinthe system. These events, referring to either a change in value or validity of the dataobject, are the elements of a low-level log.
The subsequent section introduces these low-level logs, and the pieces of informa-tion contained in each event, in more detail.
4 Low-level Logs
Log files were originally introduced as a means for administrators to monitor systemoperation and to trace back errors. These logs are essentially sequences of significant

7
undefined confirmed
unconfirmedinvalid
define
rollbackconfirm / define
updatedelete{initial}
Fig. 4. Generic state-transition system for data objects
events which have occurred in the system so far, listed in chronological order. Thenotion of an event log can be formalized as follows.
Definition 1 (Sequence, non-repeating sequence).LetA be a set. A finite sequence onA is a mappingσ ∈ {1, . . . , n} → A wheren is the length of the sequence.len(σ) = ndenotes the length andσ(i) the ith element (for1 ≤ i ≤ len(σ)). ε denotes the emptysequence, i.e.,len(ε) = 0 anddom(ε) = ∅.
A sequenceσ ∈ {1, . . . , n} → A can be denoted by〈σ1, σ2, . . . , σn 〉 whereσi =σ(i) for 1 ≤ i ≤ n. set(σ) = {σ(i) | i ∈ dom(σ)} is the set of all elements. As a shortcut we can writea ∈ σ to denotea ∈ set(σ) for somea ∈ A.
A sequenceσ ∈ {1, . . . , n} → A is a non-repeating sequence if and only if∀1≤i<j≤nσ(i) 6= σ(j).
For any non-repeating sequenceσ ∈ {1, . . . , n} → A anda ∈ A, pos(σ, a) pro-vides the sequence number ofa in σ, i.e.,σ(pos(σ, a)) = a.
In a non-repeating sequence the elements are totally ordered, i.e., for anya1, a2 ∈σ: a1 <σ a2 if and only ifpos(σ, a1) < pos(σ, a2).
Definition 2 (Event, log).LetE be aset of log events. l is a log overE if and only iflis a non-repeating sequence onE.
As has been stated in the above definition, the fundamental property of a log isthe requirement of being a strictly ordered sequence of events. All events containedin a log are unique, which is expressed by the sequence being non-repeating. Whatdifferentiates several kinds of logs is mainly the typical set of event attributes, i.e. datawhich is provided for every event in the particular log. In this article we focus on low-level logs, in particular fine-grained logs which describe the ordered modification of aset of data objects in a distributed environment (i.e. executed by multiple resources orpersons). In these logs, the following attributes can typically be found for each event.
Definition 3 (Attributes of an event). Let e ∈ E be an event. An event may have thefollowing attributes:
– tp ∈ E 6→ {DEF,DEL,UPD, RBK,CNF} provides the event type,2
2 Note thatf ∈ A 6→ B is a partial function, i.e.,dom(f) ⊆ A. If a ∈ A \ dom(f), thenf(a) = ⊥ denotes thata is not in the domain. For any functionf : f(⊥) = ⊥.

8
– o ∈ E 6→ O provides the originator of each event, whereO is the set of originators(i.e., the set of possible resources),
– ts ∈ E 6→ IR+0 provides the timestamp of each event,
– p ∈ E 6→ P provides the process instance of each event, whereP is the set ofprocess instances,
– dt ∈ E 6→ Dt provides the data type of each event, whereDt is the set of datatypes, and
– di ∈ E 6→ Di provides the data object of each event, whereDi is the set of dataobjects.
A low-level data modification log describes the lifecycle of data objects in the mod-ified set, with events corresponding to transitions in the lifecycle model presented inSection 3. The type of state transition (e.g. DEF) an event refers to is stored in theattributeevent type. A PAIS, which is supposed to be the source of logs in question,typically allows for multiple resources (e.g. workers) to be involved in handling oneprocess instance. Each modification of a data object was initiated by a particular re-source, whose identification is stored in theoriginator attribute. Thetimestampattributestores the exact time at which an event occurred. Every event occurs within the realmof one specific case, referenced by theprocess instanceattribute.
In the example log given in Table 1, each row corresponds to one evente. The valuein the first column denotes the event sequence number, i.e.pos(σ, e). The timestampgiven in the second column would correspond tots(e), the process ID in column threecorresponds top(e), and the originator in the fifth column denotes the value foro(e).From looking at the values in the fourth column, it can be seen that they correspond todata objects (i.e. instances), as the given strings have the process ID appended. Thus,the values in this column correspond todi(e).
Note that the functionstp, o, dt, di, p andts are partial. This indicates that not allattributes need to be present, e.g.,ts(e) = ⊥ if no timestamp is given.
Definition 4 (Mapping between data type and instance attribute).Let Dt be a setof data types andDi be the set of data objects.c ∈ Di → Dt maps each instanceon its corresponding type. Note that for every evente ∈ E the following should hold:dt(e) 6= ⊥ ∧ di(e) 6= ⊥ =⇒ dt(e) = c(di(e)).
The data objects whose modifications are recorded in logs are inherentlyinstances.Each event holds the identification of the modified data object in the attributedataobject. However, in order to compare and relate events of different process instances,it is also necessary to know thetype of the modified data object, which is stored inattributedata type. The distinction between data object and type is mainly importanton a conceptual level, which is why most systems do not explicitly record both. In asystem recording only the data type identifier, several instances can be distinguishedby the respective process instance of the event in question. Other systems will onlyrecord data object identifiers, such as “cnamep12” and “cnamep65”. In most of thesecases one can relate instances to their given types without too much effort (in the givenexample, it can be assumed that both identifiers refer to instances of the same data type“cname”).

9
5 Modification Cluster Scanning
As discussed in Section 2, the hypothesis is that for every low-level log there exists anassociated high-level process, with its enactment having resulted in this log. It is, gener-ally speaking, rather irrelevant if this higher-level process actually exists in an explicitform. Procedural execution of activities does not necessarily result from an explicitprocess prescription. It can just as well result from practical restrictions or guidelinesenforcing a certain process, from standard behavior, or just daily routine.
The basic assumption of modification cluster scanning is that, based on the fun-damental relations between the distinct levels, it is possible to re-discover higher-levelactivity executions in a low-level log. In order to determine which low-level events con-stitute one execution of the same activity, this technique makes use of the followinghypotheses:
– Each activity and its resulting low-level events occur within thesame process in-stance.
– All low-level events having resulted from the same, higher-level activity have thesame originator.
– Each execution of an activity typically involves modification of thesame set of datatypes, i.e. the resulting footprints are (largely) identical.
– The execution of an activity takes place in a comparablyshort time span. Thus, allresulting low-level events occur in each other’sproximity.
– In hierarchical transactional systems, all low-level events of a higher-level activityhave thesame event type. That is, if the higher-level activity was a roll-back taskthen all resulting lower-level events should also be of type “roll-back”. Note thatthis is an optional requirement which should only be imposed in systems with ahierarchical transactional semantics.
These assumptions appear to be natural and valid in almost any given setting. Theydirectly follow the common perception of an activity: being performed in a process in-stance context, being performed by one person, involving a fixed set of artifacts, havingoccurred during a limited amount of time. Notice further that in a PAIS, the time a casespends waiting to be executed usually exceeds the time spent on actually executing ac-tivities. Thus, it can be safely assumed that in a typical log there are large voids betweencomparably short bursts of activity.
In order to use proximity as a means to decide whether low-level events belong to acertain activity, it is necessary to define a suitable metric for it.
Definition 5 (Proximity Function). Let l be alog overE. A functionp is a proximityfunction ifp ∈ E × E → IR+
0
Depending on the information contained in a specific log, the metric for proximitycan rely on different pieces of information; i.e., it is possible to use different proximityfunctions, either based on real time (i.e. using timestamp information), or using a logicalclock based on the discrete distance between events:
– p(e1, e2) = |ts(e1)− ts(e2)| (assuminge1, e2 ∈ dom(ts)),

10
– p(e1, e2) = |pos(σ, e1)− pos(σ, e2)|.
Based on the definition of a proximity function, the decision whether two givenevents are in each other’s proximity can be made based on an appropriately chosenparameterprange , denoting the maximal proximity of two related events.
Definition 6 (Proximity). Let l be alog overE, p some proximity function (p ∈ E ×E → IR+
0 ), andprange ∈ IR+0 the maximum proximity. Two eventse1, e2 ∈ l are in each
other’s proximity ifp(e1, e2) ≤ prange .
The first pass of the algorithm scans the log for an initial set of clusters, each com-posed of low-level events which are likely to have resulted from an activity execution. Itis assumed that the majority of activities have been executed withinprange , e.g. withina certain time span, so that all low-level events of each activity are in each others’ prox-imity. The basic idea of the algorithm is to create an event cluster for each evente inthe log, where thereference evente is the first event in the cluster. All clustershavingoccurred aftere, and which arestill in e’s proximity, are also potentially contained inthe cluster.
Thus, the definition of proximity is an example of aclustering function, groupingevents from a log into potentially related subsets. In fact, the requirement of proximityis the most integral part of a clustering function used for activity mining, as it limits theset of potentially related events to a smaller neighborhood.
A scan window of lengthprange is aligned to the first evente1 in the log, i.e. thescan window contains evente1 plus all subsequent events in the proximity ofe1. Fromthe set of events visible in the scan window, a relevant subset can be selected by fur-ther requirements of the employed clustering function. The result of this operation is acluster of potentially related low-level events.
Repeating this procedure for every event in the log, the result is a set of initial eventclusters, exactly one for each event in the log. Each cluster has a different referenceevente, which is the first3 element of the cluster, and which is used to define the re-quirements of this cluster.
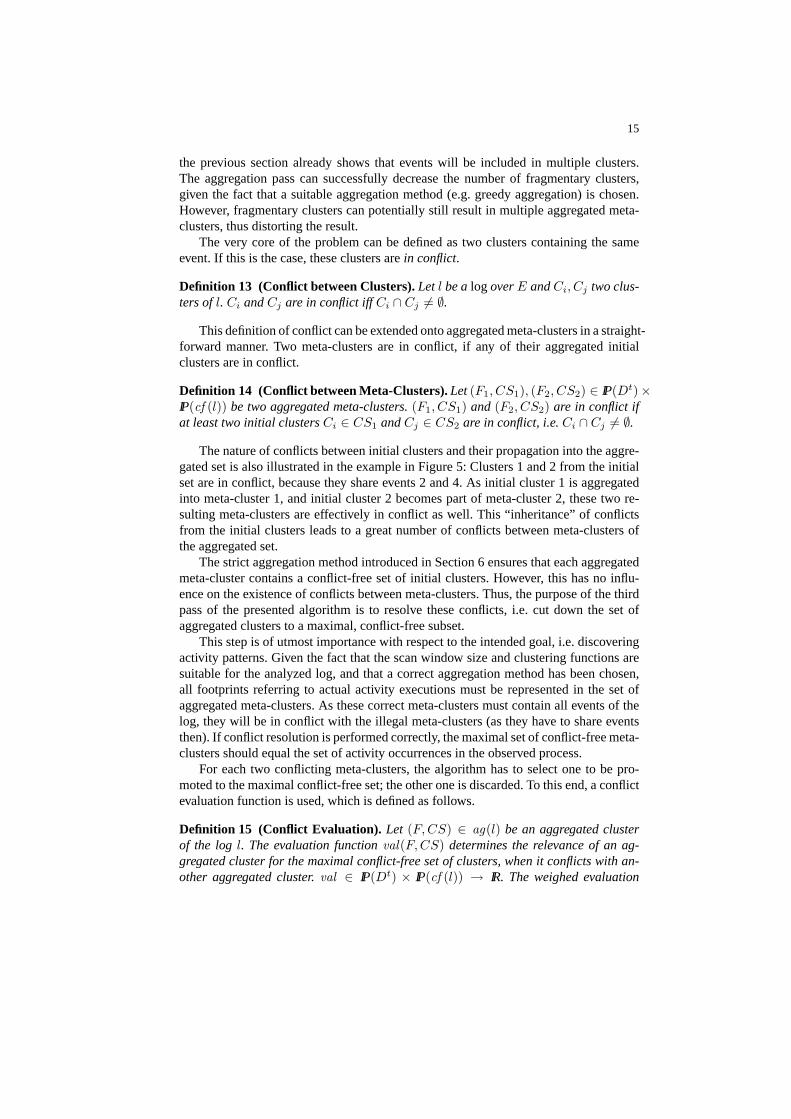
Figure 5 shows a step-by-step procedure of applying the algorithm to an examplelog. The original low-level log is shown in the leftmost table. Assuming a scan windowsizeprange of 10 minutes, the cluster for event1 would comprise events 1, 2, 3, and4, based on their proximity to event1. For event number 2, the cluster contains events2, 3, 4, 5, 6 and 7, and so on. Note that Figure 5 lists clusters which are smaller thanthe examples given here, which is due to the fact that the initial clustering function cancontain further requirements extending mere proximity.
Relying solely on proximity in scanning clusters does not fully take advantage of thehypothesized properties of low-level events stated above. In order to filter out irrelevantevents from this set, the cluster can be restricted further, e.g. to enforce equality oforiginator or process id within a cluster. The combination of all requirements to beenforced is specified with a suitableclustering function.
3 Referring to the order of appearance in the log.

11
Conflict resolution, using a=0.5, yields the minimal conflict-free set. When
ordered by their value, the desired clusters appear at the top of the list.
Aggregation of the initial clusters, using the
tolerant aggregation method.
Initial clustering pass with a scan window size of 10
minutes, enforcing equality of originator and
process instance.
A1A2A3
D1D2D3
B1B2B3
C1C2C3
Task_A
Task_B
Task_C
Task_D
# Time-stamp
PID Data Inst.
Origin-ator
Data Type
1 14:00:00 1 A1_1 BarneyA1
2 14:06:22 1 A2_1 BarneyA2
3 14:06:28 2 A1_2 HomerA1
4 14:08:55 1 A3_1 BarneyA3
5 14:10:12 2 A3_2 HomerA3
6 3 A1_3 LennyA1
7 2 A2_2 HomerA2
8 3 A3_3 LennyA3
9 3 A2_3 LennyA2
10 3 C1_3 HomerC1
11 3 C2_3 HomerC2
12 1 C2_1 LennyC2
13 3 C3_3 HomerC3
14 3 B1_3 HomerB1
15 1 C1_1 LennyC1
16 3 B2_3 HomerB2
17 1 C3_1 LennyC3
18 2 B1_2 BarneyB1
19 3 B3_3 HomerB3
20 2 C1_2 HomerC1
21 2 B2_2 BarneyB2
22 2 B3_2 BarneyB3
23 2 B2_2 BarneyB2
24 2 C2_2 HomerC2
25 2 C3_2 HomerC3
26 1 C3_1 LennyC3
27 2 C2_2 HomerC2
28 1 B1_1 HomerB1
29 3 D1_3 LennyD1
30 1 B2_1 HomerB2
31 3 D3_3 LennyD3
32 1 B3_1 HomerB3
33 1 D1_1 HomerD1
34 3 D2_3 LennyD2
35 2 D1_2 BarneyD1
36 1 D2_1 HomerD2
37 1 D3_1 HomerD3
38 2 D3_2 BarneyD3
39 1 D3_1 HomerD3
40 2 D2_2 BarneyD2
1, 2, 4
2, 4
#
1
2
3
4
5
6
7
8
9
10
11
12
13
14
15
16
17
18
19
20
21
22
23
24
25
26
27
28
29
30
31
32
33
34
35
36
37
38
39
40
A1, A2, A3
A2, A3
Events in cluster
Footprint
3, 5, 7
4
A1, A2, A3
A3
5, 7 A3, A2
A1, A3, A2
A2, C1
A3, A2
A2, C2
C1, C2, C3
C2, C3
C2, C1, C3
C3, B1, B2
B1, B2, B3, C1
C1, C3
B2, B3, C1
C3
B1, B2, B3
B3, C1
C1, C2, C3
B2, B3
B3, B2
B2
C2, C3
C3, C2
C3
C2, B1
B1, B2, B3
D1, D3
B2, B3, D1
D3
B3, D1
D1, D2, D3
D2
D1, D3, D2
D2, D3
D3
D3, D2
D3
D2
Low-level log:
6, 8, 9
7, 10
8, 9
9, 12
10, 11, 13
11, 13
12, 15, 17
13, 14, 16
14, 16, 19, 20
15, 17
16, 19, 20
17
18, 21, 22, 23
19, 20, 24, 25
20, 24, 25, 27
21, 22, 23
22, 23
23
24, 25, 27
25, 27
26
27, 28
28, 30, 32
29, 31
30, 32, 33
31
32, 33
33, 36, 37
34
35, 38, 40
36, 37, 39
37, 39
38, 40
39
40
14:14:23
14:15:47
14:18:14
14:23:57
14:24:04
14:27:22
14:32:40
14:32:43
14:39:45
14:40:10
14:42:04
14:42:10
14:43:02
14:44:43
14:48:50
14:49:00
14:50:23
14:52:55
14:53:45
14:54:02
14:57:14
14:58:00
15:04:43
15:10:22
15:12:19
15:13:10
15:14:42
15:22:05
15:28:02
15:28:04
15:28:05
15:31:45
15:35:15
15:36:00
15:37:22
Initial clusters:
A1, A2, ,A3
A2, A3
#
1
2
3
1, 3, 6
2, 5, 8
ClustersFootprint
A3 4
Aggregated clusters:
A2, C1
A2, C2
4
5
6
7
7
9
C1, C2, C3
C2, C3
10, 12, 20
11, 24, 25
B1, B2, C3
B1, B2, B3, C1
8
9
10
11
13
14
C1, C3
B2, B3, C1
15
16
C3
B1, B2, B3
12
13
14
15
17, 26
18, 28
B3, C1
B2, B3
19
21, 22
B2
B1, C2
16
17
18
19
23
27
D1, D3
B2, B3, D1
29
30
D3
B3, D1
20
21
22
23
31, 37, 39
32
D1, D2, D3
D2
33, 35
34, 40
2, 3, 4, 5
1, 3, 4, 5
Conflicting
1, 2
1, 2, 6
1, 2, 6
4,5,7,9,10,11,12,14,17
6, 8, 14, 17
6, 7, 9, 11
6, 8, 11, 14
6, 12
6, 8, 9, 14
6, 10
15, 16, 17, 19, 21
6, 7, 9, 11
13, 16
13, 15
6, 7, 13
20
11, 21, 22
18, 22, 24
13, 19, 22
19, 20, 21, 23, 24
22, 24
2, 4
1, 4
Conflicting
5, 7
1, 2
3, 7
8, 9
3, 5, 10
6, 9
6, 8, 12
7, 11, 12
10, 13
9, 15, 17
10, 11, 14, 16
13, 16, 19, 20
12, 17
13, 14, 19, 20
12, 15
21, 22, 23
14,16,20,24,25
14,16,19,24,25,27
18, 22, 23
18, 21, 23
18, 21, 22
19, 20, 25, 27
20, 24, 27
--
20, 24, 25, 28
27, 30, 32
31
28, 32, 33
29
28, 30, 33
30, 32, 36, 37
--
38, 40
33, 37, 39
33, 36, 39
35, 40
36, 37
35, 38
3.0
2.5
val (a=0.5)
1.0
1.5
1.5
3.0
2.5
2.0
2.5
1.5
2.0
1.5
2.5
1.5
2.0
1.0
1.5
1.5
2.0
2.0
1.5
2.5
1.5
24 D2, D3 36, 38 20, 22, 23 2.0
A1, A2, ,A3
#
1 1, 3, 6
ClustersFootprint
Minimal conflict-free set:
6 C1, C2, C3 10, 12, 20
B1, B2, C38 13
3.0
val (a=0.5)
3.0
2.0
B1, B2, B313 18, 28 2.5
18 D1, D3 29 1.5
22 D1, D2, D3 33, 35 2.5
= victim of conflict resolution.
Executed three times, by three resources.
}
des
ired
res
ult
Data types:
Data types:
Data types:
Data types:
Fig. 5. All phases of the algorithm, applied to an example log

12
Definition 7 (Cluster). Let l be a log overE. A clusterC is a set of events inl, i.e.,C ⊆ set(l). A clustering function is a functioncf mappingl onto a set of clusters, i.e.,cf (l) ⊆ IP(set(l)).4
The clustering function to be used in scanning the initial set of clusters can be tai-lored to the specific application and type of log. Examples of such clustering functionsinclude:
– cf (l) = {prox (e) | e ∈ l}, whereprox (e1) = {e2 ∈ E | |ts(e1) − ts(e2)| ≤prange ∧ pos(l, e1) < pos(l, e2)}(all events having occurred within a maximal time span ofprange after the referenceevente1; introducing the requirement of proximity),
– cf (l) = {prox (e) | e ∈ l}, whereprox (e1) = {e2 ∈ E | |pos(l, e1)−pos(l, e2)| ≤prange ∧ tp(e1) = tp(e2) ∧ pos(l, e1) < pos(l, e2)}(logical clock based proximity limit; limits the events contained to those of thesame type ase1; for logs from hierarchical transactional systems),
– cf (l) = {prox (e) | e ∈ l}, whereprox (e1) = {e2 ∈ E | |ts(e1) − ts(e2)| ≤prange ∧ o(e1) = o(e2) ∧ pos(l, e1) < pos(l, e2)}(timestamp-based proximity; replaces the requirement for event type equality withrequiring the same originator),
– cf (l) = {prox (e) | e ∈ l}, whereprox (e1) = {e2 ∈ E | |ts(e1) − ts(e2)| ≤prange ∧ pos(l, e1) < pos(l, e2) ∧ o(e1) = o(e2) ∧ p(e1) = p(e2)}(timestamp-based proximity limit, enforcing the same originator and process in-stance for all events in one cluster),
– cf (l) = {{e} | e ∈ l}(every cluster is a singleton),
– etc.
In the example shown in Figure 5 the third proximity function listed above hasbeen chosen (time-based proximity limit of 10 minutes, equality of originator enforcedwithin clusters). It cuts the set of events contained in each scan window down further,including only those with an originator and process ID identical to the reference event.Thus, the cluster aligned to event 1 contains events 1, 2 and 4; the 2nd cluster containsevents 2 and 4. These clusters, created for each event in the log, constitute the initial setof clusters, which is shown in its entirety in the middle table in Figure 5.
The optimal scan window sizeprange is the maximal proximity between the firstand last event of all activities recorded in the log. Ifprange is set too small, activitieswith a longer duration (or a larger number of low-level events) cannot be capturedcompletely. On the other hand, a too large scan window will lead to events from distinctactivities being comprised in one cluster (when the scan window size exceeds the meanidle time a process spends between activities). The clustering function has to be chosenwith respect to the system having produced the log under consideration (e.g., enforcinguniform event types within clusters will only work in transactional systems, otherwiseit will distort the results).
4 IP(A) is the powerset ofA, i.e., IP(A) = {B | B ⊆ A}.
13
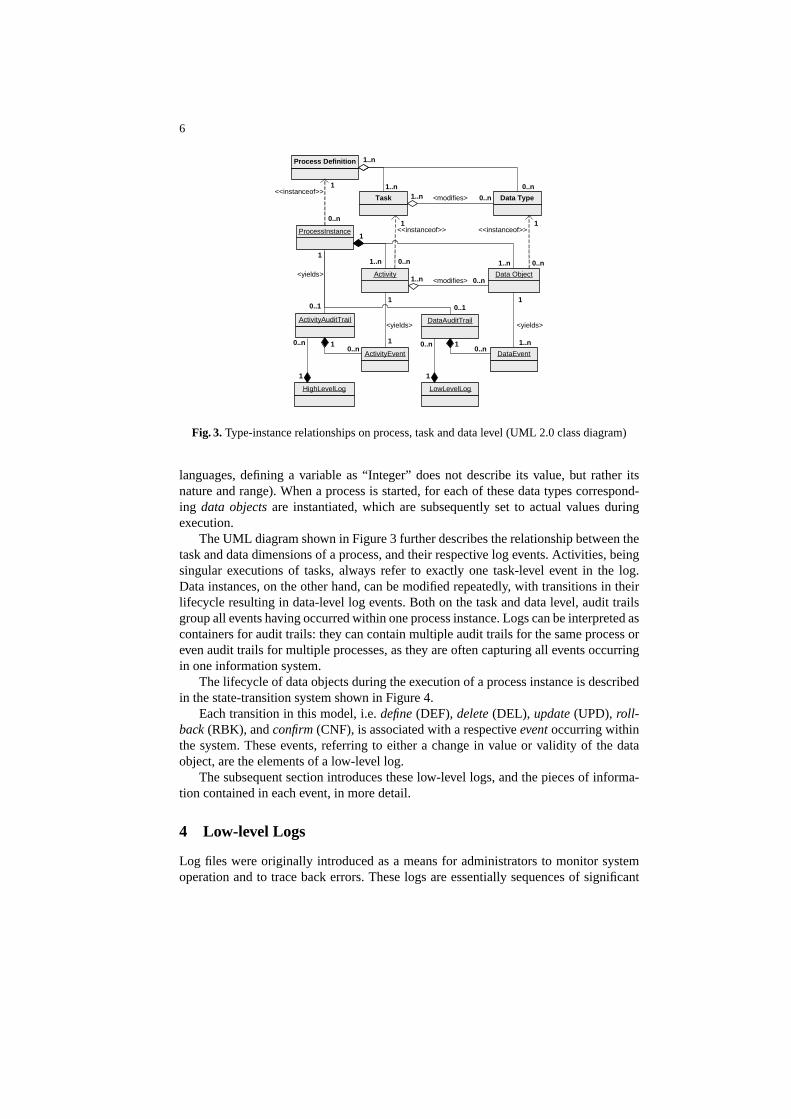
6 Cluster Aggregation
The initial set of clusters contains a great share of clusters which do not correspondto actual activity executions. Moving the scan window over an actual cluster that hasresulted from one activity, which e.g. comprises six lower-level events, will yield atleast six scanned clusters (as the scan window is being moved event-wise). One ofthese clusters is correct, i.e. where the scan window covered all events derived from theactivity. The remaining clusters have captured only a subset of the involved events. Thelatter kind of clusters, having resulted from an incorrect scan window position, shall bedenoted asfragmentary clusters.
Another problem is the sheer amount of clusters yielded by the initial scan pass, aseach event in the log will result in exactly one cluster. It is highly desirable to groupsimilar clusters intometa-clusters, which constitutes the second pass of the presentedalgorithm. With each occurrence of a similar cluster found in the initial set, the proba-bility that this cluster corresponds to the execution of an activity increases.
In order to group, oraggregate, the initial clusters, it is necessary to have a meansfor determining their similarity. The essence of what defines a cluster is thefootprint,i.e. the set of data objects modified by its contained events.
Definition 8 (Footprint). Let l be a log overE, C a cluster ofl, and for anye ∈ l:dt(e) 6= ⊥ (i.e., a data type is defined for each event in the log).fp(C) = {dt(e) | e ∈C}.
Using the footprint for evaluating the similarity of two clusters is consistent withthe activity model presented in Section 2. Multiple events having resulted from settingand clearing one data object repeatedly do not affect the footprint, and thus equalitybetween two different executions of the same activity is being preserved.
The aggregation pass combines sets of initial clusters with a compatible footprintto meta-clusters, which are identified by this very footprint. It can be characterized asgrouping syntactically related patterns, assuming that these are related on a semanticlevel as well. From a set of initial clusters, the aggregation pass results in a set of aggre-gated meta-clusters. The decision whether two footprints are compatible, i.e. whetherthe associated clusters are to be aggregated, is performed by anaggregation method.
Definition 9 (Aggregation Method). Let l be a log overE andcf (l) be a clusteringfunction over this log. Anaggregation methodag(l) groups the clusters ofcf (l) to setsof similar elements, based on their footprints.ag(l) ∈ IP(IP(Dt) × IP(cf (l)))
Note that if (F,CS) ∈ ag(l), thenCS is a set of initial clusters that somehowbelong together based on a set of data typesF (e.g. , all clusters inCS have an identicalfootprint). Which specific aggregation method to choose depends, once again, largelyon the specific log under consideration. Based on many experiments, the followingaggregation methods have been found most suitable.
Definition 10 (Tolerant Aggregation).ag(l) = {(F, CS) ∈ IP(Dt) × IP(cf (l)) | ∃ Ci ∈ CS : fp(Ci) = F ∧ CS = {Cj ∈cf (l) | fp(Cj) = F}}

14
The tolerant aggregation method groups sets of clusters which have exactly thesame footprint, i.e. the set of modified data types is identical for each element of ameta-cluster. This common footprint is also used to describe the resulting aggregatedmeta-cluster.
Definition 11 (Strict Aggregation).ag(l) = {(F, CS) ∈ IP(Dt) × IP(cf (l)) | ∃ Ci ∈ CS : fp(Ci) = F ∧ CS = {Cj ∈cf (l) | fp(Cj) = F} ∧ ∀ Ck, Cl ∈ CS : (Ck ∩ Cl = ∅ ∨ Ck = Cl)}
The strict aggregation method also enforces the identity of footprints among allclusters within an aggregated meta-cluster. On top of this, it further includes a conflict-resolution requirement. The issue of conflicts will be explained in detail in the nextsection
Definition 12 (Greedy Aggregation).ag(l) = {(F,CS) ∈ IP(Dt) × IP(cf (l)) | CS 6= ∅ ∧ ∀ Ci, Cj ∈ CS : fp(Ci) ⊆fp(Cj) ⊆ F ∨ fp(Cj) ⊆ fp(Ci) ⊆ F}
Although the first two aggregation methods make no effort to filter out fragmentaryclusters, the resulting meta-clusters are very precise. Greedy aggregation, on the otherhand, only requires the footprint of all contained clusters to share a certain subset. Itis up to the specific implementation of this aggregation method to define a minimaloverlap for the contained clusters’ footprints, as well as the method to determine thefootprint of meta-clusters. Greedy aggregation is quite sensitive to these peculiarities,however, it can improve results in very diverse, or scattered, event logs (i.e., logs whichdo not exhibit a lot of exactly recurring patterns).
The result of the aggregation pass in the example is shown in the upper right tableof Figure 5. As thetolerant aggregationfunction has been used in this example, the setof aggregated meta-clusters still contains a considerable number of elements which donot correspond to actual data modification patterns of activities, e.g. aggregated clusternumber 8, containing a mixture of low-level events resulted from the execution of tasksB andC.
Nevertheless it is clear to see that the footprint is indeed a valid criteria for com-paring initial clusters. For example, initial clusters 10, 12 and 20 have been aggregatedto meta-cluster 6 according to their common footprint (C1, C2, C3), although initialcluster 20 contains one superfluous event. Still, the aggregated set also contains a largenumber of meta-clusters which represent fragmentary clusters.
The tables for initial and aggregated clusters in Figure 5 each include a columndenoted “Conflicting”, which lists the (meta-) clusters the current cluster is in conflictwith. The next section introduces the concept of conflicts and the last pass of the algo-rithm, which is able to pick from the aggregated set the subset most likely to representactual activity execution patterns.
7 Maximal Conflict-free Set of Clusters
It is easy to see that each event in a low-level log must have resulted from exactlyone higher-level activity. However, the problem of fragmentary clusters introduced in
15
the previous section already shows that events will be included in multiple clusters.The aggregation pass can successfully decrease the number of fragmentary clusters,given the fact that a suitable aggregation method (e.g. greedy aggregation) is chosen.However, fragmentary clusters can potentially still result in multiple aggregated meta-clusters, thus distorting the result.
The very core of the problem can be defined as two clusters containing the sameevent. If this is the case, these clusters arein conflict.
Definition 13 (Conflict between Clusters).Let l be alog overE andCi, Cj two clus-ters ofl. Ci andCj are in conflict iffCi ∩ Cj 6= ∅.
This definition of conflict can be extended onto aggregated meta-clusters in a straight-forward manner. Two meta-clusters are in conflict, if any of their aggregated initialclusters are in conflict.
Definition 14 (Conflict between Meta-Clusters).Let(F1, CS1), (F2, CS2) ∈ IP(Dt)×IP(cf (l)) be two aggregated meta-clusters.(F1, CS1) and (F2, CS2) are in conflict ifat least two initial clustersCi ∈ CS1 andCj ∈ CS2 are in conflict, i.e.Ci ∩ Cj 6= ∅.
The nature of conflicts between initial clusters and their propagation into the aggre-gated set is also illustrated in the example in Figure 5: Clusters 1 and 2 from the initialset are in conflict, because they share events 2 and 4. As initial cluster 1 is aggregatedinto meta-cluster 1, and initial cluster 2 becomes part of meta-cluster 2, these two re-sulting meta-clusters are effectively in conflict as well. This “inheritance” of conflictsfrom the initial clusters leads to a great number of conflicts between meta-clusters ofthe aggregated set.
The strict aggregation method introduced in Section 6 ensures that each aggregatedmeta-cluster contains a conflict-free set of initial clusters. However, this has no influ-ence on the existence of conflicts between meta-clusters. Thus, the purpose of the thirdpass of the presented algorithm is to resolve these conflicts, i.e. cut down the set ofaggregated clusters to a maximal, conflict-free subset.
This step is of utmost importance with respect to the intended goal, i.e. discoveringactivity patterns. Given the fact that the scan window size and clustering functions aresuitable for the analyzed log, and that a correct aggregation method has been chosen,all footprints referring to actual activity executions must be represented in the set ofaggregated meta-clusters. As these correct meta-clusters must contain all events of thelog, they will be in conflict with the illegal meta-clusters (as they have to share eventsthen). If conflict resolution is performed correctly, the maximal set of conflict-free meta-clusters should equal the set of activity occurrences in the observed process.
For each two conflicting meta-clusters, the algorithm has to select one to be pro-moted to the maximal conflict-free set; the other one is discarded. To this end, a conflictevaluation function is used, which is defined as follows.
Definition 15 (Conflict Evaluation). Let (F, CS) ∈ ag(l) be an aggregated clusterof the logl. The evaluation functionval(F,CS) determines the relevance of an ag-gregated cluster for the maximal conflict-free set of clusters, when it conflicts with an-other aggregated cluster.val ∈ IP(Dt) × IP(cf (l)) → IR. The weighed evaluation
16
val(F, CS) = α · |F |+ (1− α) · |CS| uses the factorα ∈ [0, 1] to derive the value ofan aggregated cluster from its footprint size and the number of aggregated clusters.
The conflict evaluation function used takes into account both the size of the aggre-gated cluster’s footprint, as well as the number of contained initial clusters, weighedby a parameterα. Settingα to 1 will make the algorithm choose the aggregated clusterwith the largest footprint. Conversely, a value of0 for α will give preference to the meta-cluster having aggregated the most initial clusters. As a rule of thumb, the best resultshave generally been achieved by choosing a value of0.6 – 0.8 for α, as an expressedpreference for larger footprints effectively eliminates a large share of fragmentary clus-ters.
The derivation of the maximal conflict-free set of aggregated clusters can be definedas follows.
Definition 16 (Maximal Conflict-Free Set). Let l be a log over E and ag(l) be anaggregation method over this log. The functionmcf (l) selects the maximal subset ofconflict-free aggregated clusters fromag(l). mcf (l) = {(Fi, CSi) ∈ ag(l) | ∀ (Fk, CSk) ∈ag(l) : ∀ Cm ∈ CSi, Cn ∈ CSk : Cm ∩ Cn 6= ∅ ⇒ val(Fi, CSi) > val(Fk, CSk)}
Each meta-cluster contained in the maximal conflict-free set should ideally corre-spond to one activity in the (envisioned) higher-level process. Aggregated clusters arecharacterized by their footprint, describing the set of data objects modified by the re-spective activity. From this point on, one can use the set of initial clusters aggregated ineach element of the maximal conflict-free set in order to determine the occurrences ofthe described activity in the log. The boundaries of each activity occurrence are spec-ified by the timestamps (or, respectively, the log indices) of the first and last low-levelevent contained in the respective initial cluster.
In the example shown in Figure 5, conflict evaluation has been performed with aweight ofα = 0.5, i.e. giving equal preference to the number of contained clusters andfootprint size. This evaluation is where fragmentary clusters show, because they bothhave a lower chance of being repeatedly represented in the log, and their footprint isusually smaller than footprints of “correct” clusters. The conflict evaluation values areshown in the rightmost column of the table representing the set of aggregated clusters.A black dot marks those meta-clusters which have been victim to conflict evaluation,i.e. they are in conflict with another meta-cluster that scores a higher value in the eval-uation.
The resulting minimal conflict-free set of meta-clusters is shown in the bottom righttable of Figure 5. It looks a little disappointing at first sight, as 33% of the set’s elementsare clearly not corresponding to actual activity executions: Meta-cluster 18 is obviouslya fragmentary cluster, while meta-cluster 8 seems to cover low-level events from theoverlap of two activity executions.
However, the algorithm actually performed better than one might have thought. Onthe one hand, the “correct” meta-clusters have scored better in the evaluation, whichsupports the accuracy of the evaluation function. When the maximal conflict-free setis thus sorted by the conflict evaluation value of contained meta-clusters, the accurateresults will reside on the top of the scale. Note that the algorithm has discovered thecorrect results even without taking into account the process ID information. Further, it
17
has to be noted that the low-level log used in this example does not satisfy our initialassumptions at all: The time spent on executing the activities is not much shorter thanthe time spent idle between activities within a process instance (sometimes even consid-erably longer!). Hence, the scan window size could not be chosen in an optimal fashion.The algorithm has thus performed remarkably well, considering this problematic log asa starting point.
Constructing a high-level log from the minimal conflict-free set is fairly straightfor-ward. Regarding the example, one would start with the meta-cluster having scored thehighest evaluation value, i.e. meta-cluster 1. The envisioned task which this cluster rep-resents could be called “A1A2A3”, based on the footprint. As it has been mentioned,one can now use the aggregated initial clusters to reproduce the occurrences of thistask, i.e. activities, as events in the higher-level log. Meta-cluster 1 contains the initialclusters 1, 3, and 6, so the initial cluster 1 would be the first occurrence of activity“A1A2A3” in the higher-level log to be created. From the first and last event containedin initial cluster 1, the start and end of this event can be derived: The activity has startedat 14:00:00 (cf. event 1) and ended at 14:08:55 (cf. event 4), so this constitutes our firstevent in the higher-level log. This process is then repeated for each initial cluster in thismeta-cluster, and then accordingly for all meta-clusters which are considered “valid”activities.
When the minimal conflict-free set stil contains “invalid” meta-clusters, it would beappropriate to set a limit for the evaluation value a meta-cluster has to score, in orderto be included in the high-level log. In the given example, one would want to set thislimit to val(F, CS) ≥ 2.5. This is, however, a matter of fine-tuning, and one cannotgive a general rule of thumb on how to set this limit. Given this limit, the resultinghigh-level log from the example would have correctly reconstructed two out of threeprocess instances.
8 Implementation
As a proof of concept, and to allow experimentation with the concepts presented, themodification cluster scanning algorithm presented in the previous sections has beenimplemented as a plugin for ProM [14].
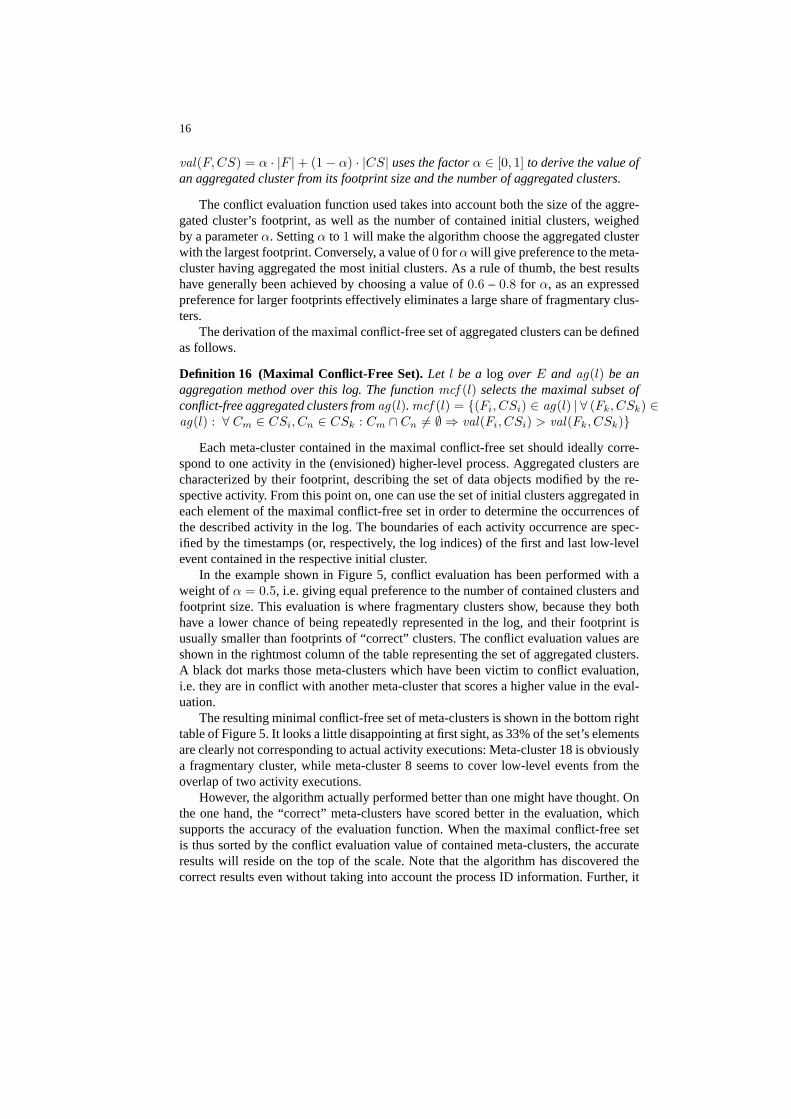
Figure 6 shows the configuration pane of the plugin. Rather than choosing a pre-defined clustering function, the user can configure each aspect of the initial clusteringpass separately: The proximity threshold for initial clusters can be provided both in realtime and as a logical number of events—the algorithm will then dynamically choosethe more restrictive setting. Enforcing the equality of originator and event type fieldswithin a cluster can be toggled independently.
A great share of systems do not log the name of the data type per event, but ratherrecord only the data object, i.e. instance, identifier. As it is necessary to compare low-level events on a type level, the user can choose an equivalence relation for the specificlog type under consideration. Equivalence relations are simple modules which can takeany two data objects and decide, whether they are derived from the same data type ornot. In the aggregation pass, the algorithm will rely on the chosen equivalence relationto compare footprints on a type level, rather than on an instance level.
18
Fig. 6. Configuration pane of the Activity Miner plugin for ProM
Further options include the choice of an aggregation method to be used, and settingthe weighing factorα for conflict evaluation.
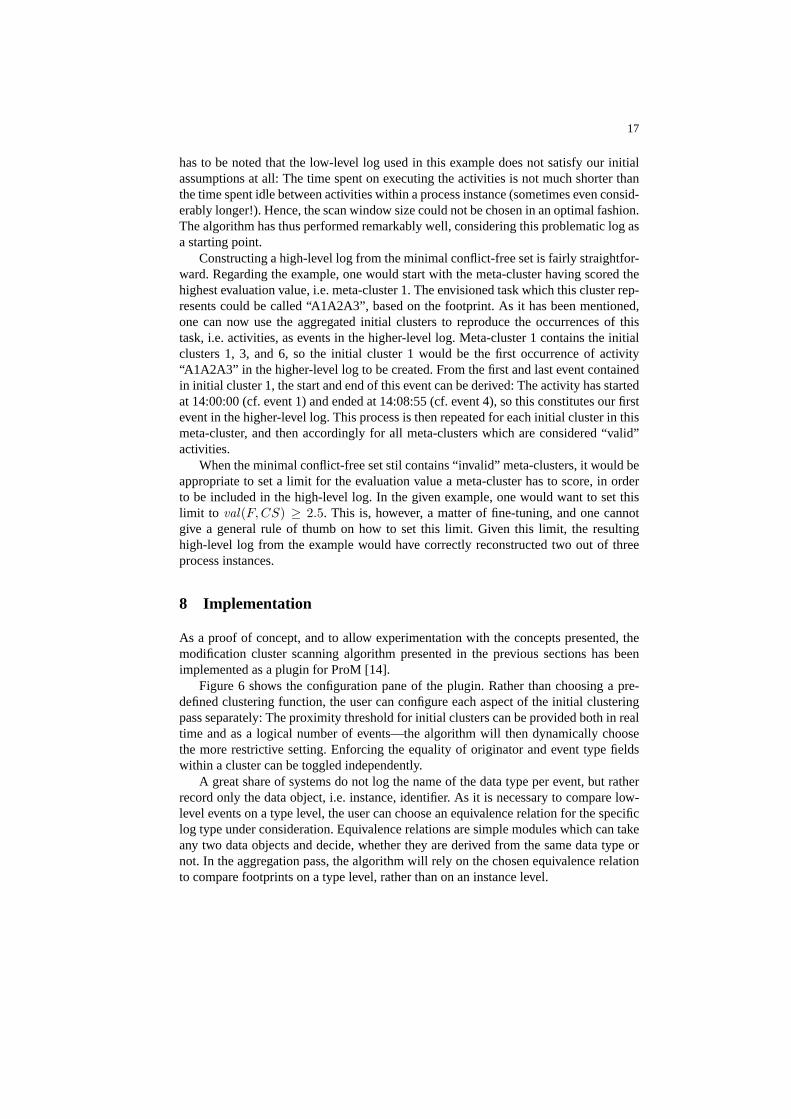
Fig. 7. Result visualization of the Activity Miner plugin for ProM
After all three passes of the algorithm have been performed successfully, the pluginwill display its results, as shown in Figure 7. The lower part of the result dialog isthe “Cluster Browser”: Aggregated meta-clusters are displayed in the leftmost column.The user can choose whether to display elements of the aggregated set (ADMC) or only
19
the subset contained in the maximal conflict-free set (MDMC). When one or multiplemeta-clusters are selected, the middle column displays the contained initial clusters.The rightmost column shows the current footprint, either of an aggregated or initialcluster (depending on the current selection). In Figure 7, the meta-cluster “ADMC.1”from the maximal conflict-free set has been selected, which contains five initial clustersand has a footprint of three data objects.
The upper left part of the result dialog shows the log as a linear ribbon, advanc-ing to the right. On this pane the clusters currently selected in the browser are displayedwith their temporal position in the log. When one or multiplemeta-clusters are selected,this view will display all contained initial clusters, for they can be interpreted as occur-rences. In Figure 7, the five initial clusters aggregated in “ADMC.1” are displayed onthe log pane. Although their temporal positions are overlapping, the “handles” on topshow their distinct, median positions.
9 Applications
The presented clustering algorithm has shown to be able to successfully rediscover a setof high-level activity patterns from a low-level log in the previous sections. This sectioninvestigates potential fields of application for the algorithm and shows that it can alsobe employed successfully within scopes which transcend the original intent.
In order to accurately rediscover low-level event patterns referring to activities on ahigher-level process, the system having generated the low-level logs must satisfy certainrequirements. As the algorithm is based on the notion of proximity, there has to be asignificant gap between the duration of activity executions and the waiting time betweendistinct activities within the execution of a process instance. In general, all systemsnatively employing the activity metaphor (e.g. using forms) do satisfy this requirement.
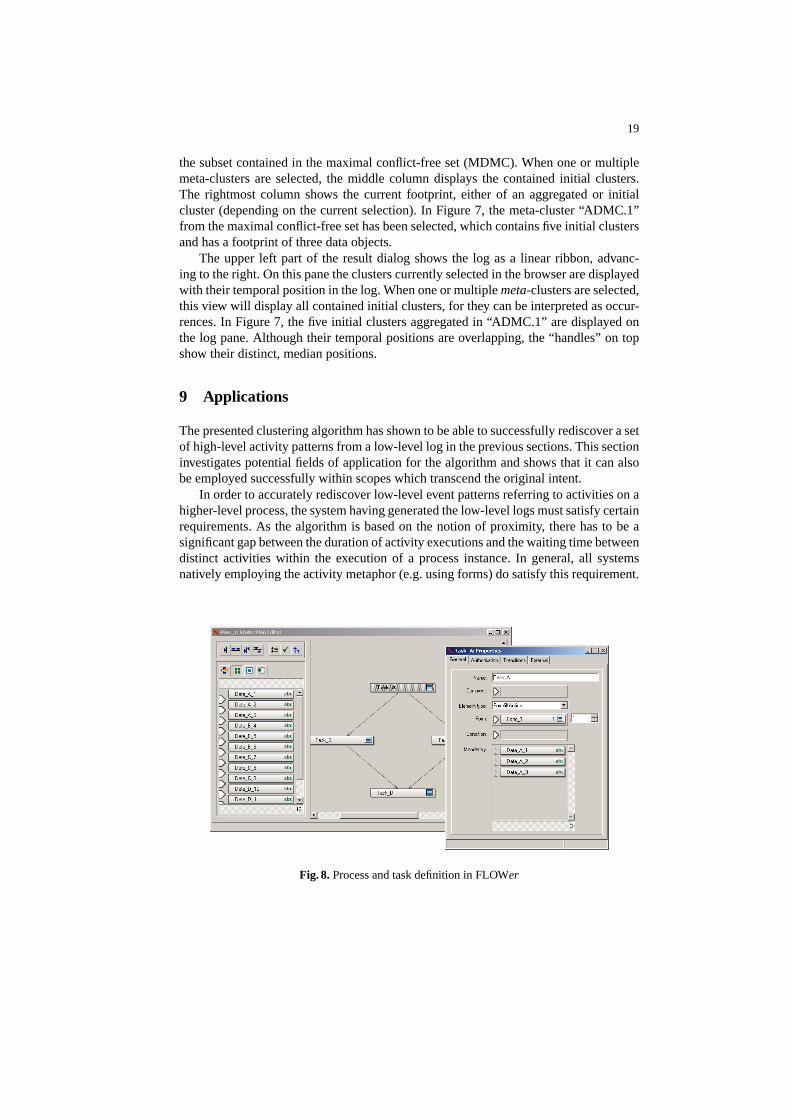
Fig. 8. Process and task definition in FLOWer

20
One interesting object for activity mining is the case handling system FLOWer.Case handling systems are data-driven, i.e. the availability of information determinesthe progress within the executed process. Thus, they provide logs both on a high level,identifying activity executions, as well as on a lower data modification level. Figure 8shows the process designer of FLOWer. The displayed process model was actually usedto generate the low-level log whose activity mining analysis is shown in Figure 7. Inthe window on the lower right of Figure 8 the properties for the first task “TaskA”are displayed, for whose completion three data objects (listed in the lower half) arerequired. These data objects indeed correspond to the footprint of the aggregated meta-cluster “ADMC.1” in Figure 7.
Case handling provides the end user of a process with a significant amount of free-dom during execution, including custom deviations from the standard path. Even moreimportant, the boundary between activities is significantly lowered, as there is no strictcoupling between forms and activities. Activities can be executed only partly, and befinished later on, potentially by another person. On the other hand, it is also possiblefor users to execute multiple activities at once, i.e. by filling out only one form. In suchan environment, activity mining can yield interesting results, by revealing the actualchunks of work which are frequently executed, in contrast to the ones proposed by theprocess definition. This analysis can both be used to gain interesting insights into theway people perform their work, and it can also serve as a perfect guideline for a redesignof the process definition.
Another important field of application for activity mining areEnterprise ResourceManagement(ERP) systems. In contrast to workflow management, emphasizing thecontrol flow perspective, these systems are centered around large databases which canbe modified in an application-specific manner. As a consequence of the emphasis ondata, ERP systems usually create event logs on a low-level. Process definitions andnotions of activities are often only existent on an application layer, which is not reflectedin the log. Activity mining can effectively bridge this gap, by providing the necessaryhigh-level abstraction. However, it has to be noted that there are further problems tobe resolved with respect to logs from ERP systems, e.g. missing references to processinstances, which the presented algorithm does not address.
While ERP systems only feature process orientation on the application layer, thereare also systems which do not support the notion of a defined process at all. Never-theless, a great share of these systems, e.g. document management systems or expertsystems, are effectively used to support processes. While some organizations prescribea process definitionoff-line, e.g. in printed form, others rely on their users’tacit knowl-edgeto perform the right steps in the correct order.
It is obvious that in such less structured settings, there is even greater demand forabstraction and analysis. These systems have no notion of a high-level process, hencethey can only produce low-level logs. Transforming these to higher-level logs, using ac-tivity mining, allows to use sophisticated analysis methods, e.g. process mining, whichare a premise for discovering and monitoring these implicit, tacit processes.
This field of application can be extended ontoEnterprise Application Integration(EAI) architectures, which are about to become commonplace in modern companies. Inorder to connect all kinds of incompatible systems from different vendors (often includ-

21
ing legacy installations), most EAI implementations rely on a centralmessage broker,or message bus, solution. These central hubs relay and transparently translate messagesbetween otherwise incompatible components, thus enabling company-wide integrationand workflow. Often, this architecture is supported by meta-processes, e.g. implementedin BPEL, which are orchestrating smaller processes within component systems. Logsfrom such message brokers usually feature singular interactions between componentsystems in the form of message events. Clustering these logs can unveil common pat-terns of interaction, potentially unforeseen by system designers. Based on these discov-ered patterns, the architecture can be better understood and optimized for performanceand quality.
Apart from business processes, it is important to note that the presented algorithmis generic enough to provide useful insights from basically any sort of low-level log.Its application to change logs from source code management systems, like CVS orSubversion, can yield popular subsets of the repository which are frequently modifiedtogether. This information can subsequently be used to e.g. reorganize the repositorylayout for easier navigation. Further, the clustering algorithm has also been successfullyapplied to access logs from web servers. In this context, rather small values for thescan window size can yield clusters containing pages and their associated resources(e.g. images). On the other hand, increasing the scan window size, such that it spans anentire visit’s duration, can be used to group visitors according to which subset of thesite they have frequented.
Another interesting application for activity mining is the healthcare domain. In agreat number of hospitals the supporting information systems transmit events relatedto patient treatment activities to a central data-warehousing system. Due to the orga-nization of a hospital, it is usual to concentrate a number of examinations (e.g. bloodtests) or treatments in a short time span, in order to minimize transportation between thewards involved. This practice leads to event logs containing bursts of events referring tolower-level activities. Clustering the fine-grained event data from a patient’s treatmentprocess can provide useful abstraction from single activities, and reveal logical taskswhich describe the logged procedure more adequately.
When the clustering algorithm fails to successfully rediscover activity patterns presentin the process definition, this does not necessarily mean that there is a problem with thelog or the algorithm’s configuration. It can rather be a valuable hint that the processdefinition is in fact not in line with the current practices within the organization. Ifthe algorithm groups low-level events of two distinct activities into one cluster, this isa strong indication that these activities are frequently executed directly one after an-other. Such information can provide valuable information for a redesign effort, i.e. inthe above case one would want to combine the affected activities into one.
Finally, it is also possible to apply the presented algorithm to regular high-levellogs. By setting the scan window size to the typical throughput time of a case, theresulting meta-clusters represent typical sets of activities performed in a process5. Theinitial clusters contained in these meta-clusters can correspondingly be interpreted ascases, or process instances. Thus, if the high-level log does not contain the process ID
5 Note that different execution orders for parallel parts of the process do not confuse the algo-rithm, as the footprint is considered an unordered set.
22
attribute for events, an activity mining analysis can be of great help in rediscoveringthis information.
10 Related Work
The presented work is closely related to the area of process mining, describing a familyof a-posteriori process analysis techniques based on event logs. For example, the alphaalgorithm [6] can construct a Petri net model describing the behavior observed in thelog. The Multi-Phase Mining approach [13] can be used to construct an Event ProcessChain (EPC) based on similar information. In the meantime there are mature tools suchas the ProM framework [14] to construct different types of models based on real processexecutions.
Process mining research so far has mainly focussed on issues related to control flowmining. Different algorithms and advanced mining techniques have been developed andimplemented in this context (e.g., making use of inductive learning techniques or ge-netic algorithms). Tackled problems include concurrency and loop backs in processexecutions, but also issues related to the handling of noise (e.g., exceptions). Further-more, first work regarding the mining of other model perspectives (e.g., organizationalaspects) and data-driven process support systems (e.g., case handling systems) has beenconducted [3].
Activity mining is different from traditional process mining in various respects. Itdoes not attempt to derive information about the process definition, organization, or ex-ecution in general, but rather concentrates on a logical, activity-based abstractionwithinthe realm of event logs. In order to analyze event logs in a meaningful manner, processmining algorithms require the process instance ID for each event. This requirement doesnot hold for activity mining, as it is primarily based on the notion of proximity. Whileprocess mining algorithms are based on analyzing high-level logs, activity mining doesprovide this very information as an abstraction from lower-level logs. Thus, activitymining is a valuable means for preprocessing low-level event logs to higher-level logs,in order to perform meaningful process mining.
The results obtained from applying process mining techniques on these reconstructedhigher-level logs can provide the most interesting insights, when the system having pro-duced the initial low-level logs in the first place is not designed to strictly enforce a rigidprocess definition. One system which provides outstanding support for flexible changesof the process model, both on a casual and evolutionary basis, is ADEPT[20]. Alsothe case handling approach[7], implemented in the commercial system FLOWer[10],is especially interesting, as it rather limits the possible execution paths, in contrast toprescribing a fixed set of paths.
There exists a large amount of similar work also from outside the process miningfield. Most notably there have been numerous approaches from the data mining domain,which are also focused on clustering sequential event data. Our approach is distinct inthat it takes full advantage of the peculiarities of the sequence and events under consid-eration, i.e. it is far more closely tailored towards the application domain of businessprocess event logs.

23
Clustering techniques are commonplace in the area of data mining. However, mostapproaches address the problem ofconceptual clustering[15], i.e. they strive not toderive higher-level entities from the input data but to derive a classification which canbe applied to the initial entities (i.e. events).
Another related field in the data mining domain deals with the discovery of patternsfrom sequential data. Agrawal et al. [9] also look at events (transactions) from the sameprocess instance (customer), however, their observation is global, i.e. items to be com-pared are not constrained by their temporal distance. While Bettini et al. [12] also usethe idea of focusing on small parts (granules) of the sequence, these do not overlap, andthe “interesting” patterns to be discovered are supposed to be defined a-priori.
These approaches are interested in the (partial) order between elements of a pattern,as their focus lies on deriving implication rules from sequences of events. This contra-dicts the basic assumption of our clustering algorithm, namely that the order of eventswithin an activity cluster is not significant.
Perhaps the approach most related to ours is from Mannila et al. [18], also usinga “time window” to restrict the subset of events under consideration. Although thiswork also mainly focuses on the partial ordering of elements, they also consider thetrivial case of an empty partial order, corresponding to our approach. Nevertheless, theabsence of using any event attributes other than name (i.e. modified data type) andtimestamp, and the focus on implication rules, e.g. for the prediction of future events,poses a significant difference to our approach.
11 Discussion
Activity mining, as it has been motivated and presented in this paper, describes theprocess of extracting recurring patterns from event logs, which point to the existence ofcommon tasks on a higher level of abstraction. The need for activity mining is drivenby multiple use cases.
Process mining techniques have evolved on to a stage where their industrial applica-tion does not only seem feasible but truly beneficial. However, they interpret log eventsas corresponding to the execution of abstract tasks, which conflicts with most real-lifesystems’ logging on a far more fine-grained, and thus lower, level. Consequently thismismatch accounts for overly complex and detailed models which make it hard to derivemeaningful information from.
Conducting process mining in a meaningful manner becomes even more difficultwhen the system from which the logs are derived is not process-aware. In most ofthese cases it is nevertheless safe to assume the existence of an implicit, higher-levelprocess, following the hypothesis stated in Section 2. People tend to follow certainpatterns (i.e. implicit processes) when accomplishing recurring tasks, and they usuallyalso divide them into similarly sized chunks of work (which is our definition of anactivity). This property even extends onto automatically executed processes, as theseare designed by humans unconsciously applying these paradigms.
In such situations activity mining can provide the abstraction necessary to applyprocess mining techniques. Once a high-level log has been derived it can be analyzedwith the set of process mining algorithms already available, in order to e.g. discover the

24
tacit high-level process which has generated the log. If, however, the process appears tomake no sense from a semantic point of view, then this is a strong hint that unsuitableparameters have been used for activity mining. Thus, performing the subsequent processmining analysis can also be used to verify the correctness of the activity mining pass.
In comparison to these process mining algorithms, activity mining does not relysolely on the log itself to derive these abstractions. Configuring the algorithm withappropriate parameters requires domain knowledge, such as the maximal time used tohandle activities, in order to accurately discover the activity clusters. We are currentlyworking on heuristics to automatically find suitable parameters based on the log, as ameans to aid the user in finding the correct configuration.
The current state of affairs is that a large share of process-aware information systemsdo not provide activity-level logs, and are thus not suitable for the application of processmining. Activity mining has the potential to bridge this gap, bringing both new fields ofapplication to process mining and, conversely, an ample toolkit of scientifically well-founded analysis methods to owners of such systems.
We have also shown that this technique can be used in settings different from itsoriginal content. The modular design of the algorithm allows for tailoring it to differentapplications, e.g. by using a custom clustering function or aggregation method. We arethus convinced that there are plenty of applications for this technique even outside ofthe intended scope.
12 Acknowledgements
This research is supported by the Technology Foundation STW, applied science divisionof NWO and the technology programme of the Dutch Ministry of Economic Affairs.
References
1. W.M.P. van der Aalst and P.J.S. Berens. Beyond Workflow Management: Product-DrivenCase Handling. In S. Ellis, T. Rodden, and I. Zigurs, editors,International ACM SIGGROUPConference on Supporting Group Work (GROUP 2001), pages 42–51. ACM Press, NewYork, 2001.
2. W.M.P. van der Aalst and K.M. van Hee.Workflow Management: Models, Methods, andSystems. MIT press, Cambridge, MA, 2002.
3. W.M.P. van der Aalst and M. Song. Mining Social Networks: Uncovering Interaction Pat-terns in Business Processes. In J. Desel, B. Pernici, and M. Weske, editors,InternationalConference on Business Process Management (BPM 2004), volume 3080 ofLecture Notesin Computer Science, pages 244–260. Springer-Verlag, Berlin, 2004.
4. W.M.P. van der Aalst, B.F. van Dongen, J. Herbst, L. Maruster, G. Schimm, and A.J.M.M.Weijters. Workflow Mining: A Survey of Issues and Approaches.Data and KnowledgeEngineering, 47(2):237–267, 2003.
5. W.M.P. van der Aalst and A.J.M.M. Weijters, editors.Process Mining, Special Issue of Com-puters in Industry, Volume 53, Number 3. Elsevier Science Publishers, Amsterdam, 2004.
6. W.M.P. van der Aalst, A.J.M.M. Weijters, and L. Maruster. Workflow Mining: DiscoveringProcess Models from Event Logs.IEEE Transactions on Knowledge and Data Engineering,16(9):1128–1142, 2004.
25
7. W.M.P. van der Aalst, M. Weske, and D. Grunbauer. Case Handling: A New Paradigm forBusiness Process Support.Data and Knowledge Engineering, 53(2):129–162, 2005.
8. R. Agrawal, D. Gunopulos, and F. Leymann. Mining Process Models from Workflow Logs.In Sixth International Conference on Extending Database Technology, pages 469–483, 1998.
9. R. Agrawal, T. Imielinski, and A. N. Swami. Mining association rules between sets of itemsin large databases. In P. Buneman and S. Jajodia, editors,Proceedings of the 1993 ACMSIGMOD International Conference on Management of Data, pages 207–216, Washington,D.C., 26–28 1993.
10. Pallas Athena.Case Handling with FLOWer: Beyond workflow. Pallas Athena BV, Apel-doorn, The Netherlands, 2002.
11. Pallas Athena.Flower User Manual. Pallas Athena BV, Apeldoorn, The Netherlands, 2002.12. C. Bettini, X. S. Wang, and S. Jajodia. Mining temporal relationships with multiple granu-
larities in time sequences.Data Engineering Bulletin, 21(1):32–38, 1998.13. B.F. van Dongen and W.M.P. van der Aalst. Multi-Phase Process Mining: Building Instance
Graphs. In P. Atzeni, W. Chu, H. Lu, S. Zhou, and T.W. Ling, editors,International Con-ference on Conceptual Modeling (ER 2004), volume 3288 ofLecture Notes in ComputerScience, pages 362–376. Springer-Verlag, Berlin, 2004.
14. B.F. van Dongen, A.K. de Medeiros, H.M.W. Verbeek, A.J.M.M. Weijters, and W.M.P. vander Aalst. The prom framework: A new era in process mining tool support. In G. Ciardo andP. Darondeau, editors,Proceedings of the 26th International Conference on Applications andTheory of Petri Nets (ICATPN 2005), volume 3536 ofLecture Notes in Computer Science,pages 444–454. Springer-Verlag, Berlin, 2005.
15. D. H. Fisher. Knowledge acquisition via incremental conceptual clustering.Mach. Learn.,2(2):139–172, 1987.
16. S. Jablonski and C. Bussler.Workflow Management: Modeling Concepts, Architecture, andImplementation. International Thomson Computer Press, London, UK, 1996.
17. F. Leymann and D. Roller.Production Workflow: Concepts and Techniques. Prentice-HallPTR, Upper Saddle River, New Jersey, USA, 1999.
18. H. Mannila, H. Toivonen, and A. I. Verkamo. Discovery of frequent episodes in event se-quences.Data Mining and Knowledge Discovery, 1(3):259–289, 1997.
19. D.C. Marinescu. Internet-Based Workflow Management: Towards a Semantic Web, vol-ume 40 ofWiley Series on Parallel and Distributed Computing. Wiley-Interscience, NewYork, 2002.
20. M. Reichert and P. Dadam. ADEPTflex: Supporting Dynamic Changes of Workflow withoutLoosing Control.Journal of Intelligent Information Systems, 10(2):93–129, 1998.


![[1].pdf - ResearchGate](https://img.dokumen.tips/doc/110x75/62129a6cbbf9242e6965a6a7/1pdf-researchgate.jpg)