Embed Size (px)
Citation preview

Finance and Economics Discussion SeriesDivisions of Research & Statistics and Monetary Affairs
Federal Reserve Board, Washington, D.C.
Minimum Wages and Consumer Credit: Impacts on Access toCredit and Traditional and High-Cost Borrowing
Lisa J. Dettling and Joanne W. Hsu
2017-010
Please cite this paper as:Dettling, Lisa J., and Joanne W. Hsu (2017). “Minimum Wages and Consumer Credit:Impacts on Access to Credit and Traditional and High-Cost Borrowing,” Finance and Eco-nomics Discussion Series 2017-010. Washington: Board of Governors of the Federal ReserveSystem, https://doi.org/10.17016/FEDS.2017.010.
NOTE: Staff working papers in the Finance and Economics Discussion Series (FEDS) are preliminarymaterials circulated to stimulate discussion and critical comment. The analysis and conclusions set forthare those of the authors and do not indicate concurrence by other members of the research staff or theBoard of Governors. References in publications to the Finance and Economics Discussion Series (other thanacknowledgement) should be cleared with the author(s) to protect the tentative character of these papers.
0
Minimum Wages and Consumer Credit:
Impacts on Access to Credit and Traditional and High-Cost Borrowing
Lisa J. Dettling
Federal Reserve Board
Joanne W. Hsu
Federal Reserve Board
This version: January 15, 2017*
Click here for current version
Abstract
Proponents of minimum wage legislation point to its potential to raise earnings and lift families out of poverty, while opponents argue that disemployment effects lead to net welfare losses. But these arguments typically ignore the possibility that minimum wage policy has spillover effects on other aspects of households’ financial circumstances. This paper examines how state-level minimum wage changes affect the decisions of lenders and low-income borrowers. Using data derived from direct mailings of credit offers, debt recorded in credit reports, and survey-reported usage of alternative credit products, we broadly find that when minimum wages rise, access to credit expands for lower-income households, who in turn, use more traditional credit and less high-cost alternatives. Specifically, for each $1 increase in the minimum wage, lower-income households receive 7 percent more credit card offers, with higher limits and improved terms. Further, there is a drop in usage of high-cost borrowing: payday borrowing falls 40 percent. Finally, we find that borrowers are also better able to manage their debt: delinquency rates fall by 5 percent. Overall, our results suggest that minimum wage policy has positive spillover effects by relaxing borrowing constraints among lower income households.
Keywords: consumer debt, minimum wages, credit limit, delinquency, payday loans, credit constraints
* Contact e-mails: [email protected], [email protected]. We thank Neil Bhutta, Melissa Kearney, Kevin Moore, John Sabelhaus, Jeff Thompson, and seminar participants at the Federal Reserve Board and George Mason University for comments. Elizabeth Llanes and Peter Hansen provided excellent research assistance. The analysis and conclusions set forth are those of the authors and do not indicate concurrence with other members of the research staff or the Board of Governors.

1
1. Introduction
Minimum wages policies are enacted to raise incomes for low skill workers, with the
intended goal of lifting households out of poverty, reducing inequality, and stimulating the
economy by increasing aggregate consumption. But labor market outcomes are only one piece of
a household’s finances, and any changes in income stemming from changes in the minimum
wage may also affect a household’s ability to borrow and their interactions with credit markets.
Whether and how the minimum wage passes through to credit markets may weaken or amplify
the effects of the policy. If low-income households face binding borrowing constraints, expanded
access to credit could enable households to leverage small increases in income to finance lumpy
durable or human capital investments, which could help further lift them out of poverty. But if
potential borrowers are sufficiently present-biased, financially illiterate or face self-control
problems, over-borrowing and large debt-service burdens could worsen household’s financial
circumstances, mitigating any income gains. If low-income households do not face binding
borrowing constraints, or if lenders do not expand access to credit after a minimum wage change,
than neither of these would occur.
Our paper examines the impacts of state-level minimum wage changes on lender and
borrower behavior in traditional credit markets, like credit cards and auto loans, as well as high-
cost alternative credit products, like payday loans. We use data on direct mailings of credit
offers, panel data derived from credit reports, and survey data on high-cost credit usage,
combined with changes in state minimum wage policy, to document several novel empirical
facts. First, that lenders send more offers, with better terms, to low-income borrowers when the
minimum wage rises in their state. Second, we confirm the findings from previous research
2
(e.g., Aaronson, Agarwal and French 2012): borrowing increases among low skill workers after
the minimum wage rises, and that borrowers do not default on these new loans in the medium
term. We also find evidence of pay-down of existing debts. As a result, borrowers’ credit scores
rise. And third, we document a substantial drop in usage of payday loans and other high-cost
alternative to formal credit. We find no corresponding changes among higher income or higher
skill workers.
We interpret our empirical results as supportive of the existence of borrowing constraints
among low-income households. In particular, the fact that lenders increase access to traditional
credit to low-income borrowers, and borrowers take up such low-cost credit and substitute away
from payday borrowing after a minimum wage hike, suggests that credit constraints faced by
low-income borrowers are at least partially relaxed when minimum wages increase. This view is
consistent with recent work by Aaronson, Agarwal and French (2012) who found that their
estimated consumption response to minimum wage hikes are consistent with a buffer stock
model with widespread borrowing constraints. We expand upon their analyses by empirically
documenting an expansion in credit supply and a reduction in payday borrowing.
We find that defaults fall by 5 percent following a minimum wage hike. For new
borrowers, the reduction in defaults suggests these households are not over-borrowing, and for
existing borrowers, it suggests households save some of their new income via debt pay-down. As
a result, we find that credit scores rise by 8 points following a minimum wage change. Because
payment behavior and credit scores are used in future credit applications, this suggests the
minimum wage could have persistent effects on household’s ability to access affordable
liquidity. These changes may better enable those households’ to weather future expenditure

3
shocks and finance lumpy investments, further improving their economic well-being. To our
knowledge, this potentially important --and persistent-- spillover effect of minimum wage
policies on households’ financial lives has not previously been explored.
We find evidence of a 40 percent drop in payday and other high-cost borrowing
following minimum wage hikes. This is particularly notable in light of the fact that targeted
payday loan bans have had limited success in reducing borrowing costs for low-income families
(Bhutta, Goldin, and Homonoff, forthcoming). A common explanation for payday loan usage
among low-income borrowers is cognitive biases (Bertrand and Morse, 2011). Our paper
suggests borrowing constraints in traditional credit markets are an important explanation, and
that policies that target income support and/or credit constraints may be more effective in
reducing usage of these products than targeted bans.
Broadly, our paper indicates social insurance programs can have spillover effects on
lender and borrower behavior in consumer credit markets, and these spillovers can amplify the
effects of policy. This is consistent with Hsu, Matsa and Meltzer (2014) who find that more
generous unemployment insurance acts as housing market stabilizer by averting mortgage
default and foreclosures. Minimum wages target a lower income segment of the population, but
we similarly see amplification effects via expanded access to lower cost credit. This speaks the
potential interaction between social policy and financial stability.
The rest of the paper is organized as follows. Section II describes our conceptual
framework for understanding how minimum wages affects how low-income households interact
with credit markets, along with the relevant literature. Section III presents our empirical analysis,
including a description of minimum wages in the US, our data and empirical strategy, and

4
results. We begin with an analysis of credit offers, then proceed to borrowing, payment
behavior, and credit scores using credit bureau data; and then usage of alternative financial
service credit products like payday loans in survey data. In Section IV, we take stock of all of our
results and discuss their implications.
2. Conceptual Framework and Related Literature
There is a vast empirical literature in economics devoted to understanding the effects of
minimum wage policy on labor market outcomes of affected workers.2 A key fact emerging
from this literature is evidence of positive earnings effects for a substantial majority of adult
minimum wage workers following a minimum wage increase (for a review of the literature, see,
for example, Belman and Wolfson, 2014). We expect minimum wages to affect households’
interactions with credit markets via their effects on household income.
The first empirical paper to establish a link between minimum wage policy and
borrowing behavior was Aaronson, Agarwal and French (2012). They document a rise in
consumption that is nearly three times the associated rise in income following minimum wage
hikes. Using panel data on borrowing, they find that the excess consumption is financed by
increases in credit card, auto and home equity debt. Our analyses find a similar increase in
borrowing following minimum wage hikes.
One plausible explanation for the increase in borrowing following minimum wage hikes
is that minimum wage policy leads to an expansion in the supply of credit to low-income
2 The important contributions to this literature are too numerous to adequately review here. Excellent literature reviews include Card and Krueger (1995), Neumark and Wascher (2008), and Belman and Wolfson (2014).
5
borrowers. All things equal, lenders are generally willing to extend more credit, and at cheaper
terms, to households with higher ability to pay. And lenders may respond to the policy itself,
rather than any real changes in income for specific potential borrowers, if lenders expect positive
impacts of minimum wage policy on certain borrower-types. If minimum wage workers were
otherwise borrowing constrained, this increase in credit supply can lead to more borrowing,
particularly for those with few liquid assets who may have deferred expenditures. Indeed, limited
liquid assets and credit constraints are salient features of this population: data from the 2001-
2013 Survey of Consumer Finances (SCF) indicate nearly 40 percent of households with
minimum wage workers are credit constrained, and the median minimum wage worker holds
fewer than two thousand dollars in liquid assets – a tenth of the amount held by the median U.S.
household.3
Households who are unable to borrow in traditional credit markets can often still access
credit through higher-cost alternative financial service (AFS) credit products, such as payday
loans, “buy here pay here” auto loans, pawn shop loans, and “rent-to-own” furniture
agreements.4 Payday loans and other AFS credit products are offered with minimal underwriting
(typically only proof of income or employment is required) and are characterized by very high
effective interest rates. If minimum wage borrowers use these products because they face
3 Authors’ calculations. We identify minimum wage workers as those with wage income between 60 and 120 percent of the annualized equivalent of state minimum wage for a full time worker. Credit constraints are captured via a positive to response to either (1) being turned down for credit or (2) not applying for credit for fear of being turned down. Liquid assets include checking accounts, saving accounts and other financial assets, and do not include homes or vehicles. 4 Some states ban payday lending in the period we study. However, Bhutta et al (2016) find these policies lead borrowers to use alternative AFS credit products, rather than discontinuing borrowing or using traditional credit.

6
borrowing constraints in traditional credit markets, an increase in the supply of traditional credit
could lead to substitution away from high-cost alternatives to formal credit.5
In addition to possibly facing barriers to borrowing in traditional markets, behavioral
biases might be another possible reason low-income borrowers might utilize AFS borrowing. If
borrowers use AFS products because of financial illiteracy (Bertrand and Morse, 2011; Lusardi
and de Bassa Scheresberg, 2013), we would not expect substitution away from AFS products
when borrowing constraints are relaxed. Or, if borrowers are sufficiently present-biased, or have
forecasting problems (e.g., Laibson, 1997), the relaxation of credit constraints in traditional
credit markets could be a complement to AFS borrowing. This could lead to a rise in defaults in
the near or long term, as borrowers are unable to service their new debt obligations.
For low-income workers who do not need additional credit, increases in the minimum wage
might reduce borrowing and defaults among borrowers with existing traditional or AFS debt, if
borrowers are in need of less debt-financed liquidity and/or choose to save new income via debt
pay-down. Hsu, Matsa and Meltzer (2014) find that unemployed borrowers use unemployment
insurance income to avert mortgage default. Similarly, Agarwal, Liu, and Souleles (2007) and
Sahm, Shapiro, and Slemrod (2010) find evidence that borrowers use tax rebates to pay down
debts. However, these are all temporary changes in income, while minimum wage hikes are
permanent.
Finally, we acknowledge that throughout this discussion we have assumed that income rises
following a minimum wage increase. While useful for simplifying the exposition, our analysis
5 If this substitution were dollar-for-dollar, this would not generate a change in consumption, which would be inconsistent with the clear increase in consumption found by Aaronson, Agarwal, and French (2012).
7
does not require this to be the case; some studies have indeed estimated negative employment
responses to increases in the minimum wage.6 If there are disemployment effects, than income
may fall for some workers, and our predictions for the impacts on credit markets would generally
work in the reverse for those workers. Ultimately, the overall impact of minimum wages on
credit markets is an empirical question that we seek to answer. In our analyses that follow, we
relax the assumption that income effects are positive and estimate reduced form effects of
minimum wages on credit market outcomes.
3. Empirical Analyses
3.1 Minimum Wages
Minimum wage legislation in the United States has a long history, dating back to the
early 1900s. While originally adopted by states, the first federal minimum wage was enacted in
1938 with the Fair Labor Standards Act (FLSA). Since then, the federal minimum wage has
grown periodically (though not always at pace with inflation), and various states have adopted
minimum wages above the federal level. In this paper, we use monthly state-level minimum
wage data from Neumark, Salas and Wascher (2014), which we update through 2015 using
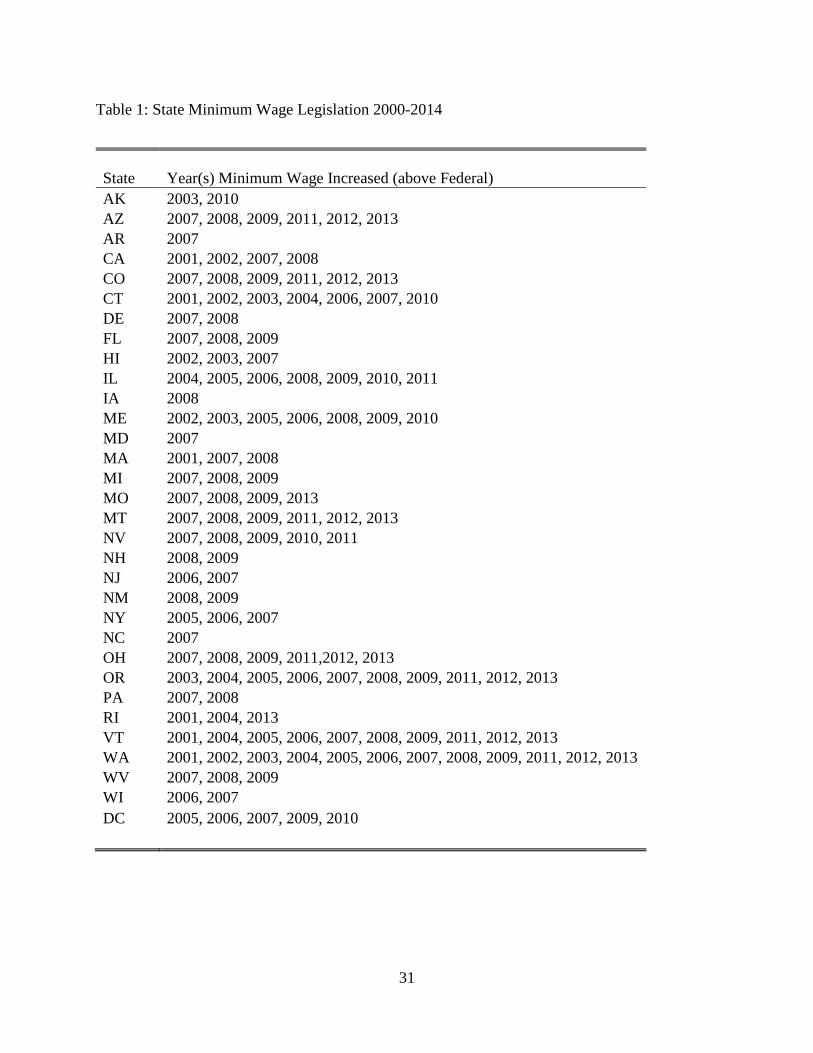
Economic Policy Institute’s Minimum Wage Tracker.7 Table 1 highlights the various state-level
changes in the minimum wage during the time period we study in this paper, 1999-2015. There is
considerable cross-sectional variation in the minimum wage across states and over time during
6 See, for example, Neumark and Wascher (2008) for a review. 7 The Minimum Wage Tracker can be accessed online at http://www.epi.org/minimum-wage-tracker/.
8
this period, ranging from $5.15 to $10.50. The most recent change in the federal minimum wage
became effective July 2009, increasing from $6.55 to $7.25.
3.2 Credit Offers
3.2.1 Data and Empirical Specification
For our first set of analyses, we use information on traditional credit offers from direct
mail advertising data from 1999 to 2015 compiled by Mintel Comperemedia. Mintel collects data
from a sample of about 1,000 households each month, surveying household demographic and
income characteristics in addition to compiling information from all mail-based credit and sales
advertising, including credit card, mortgage, auto, student loan, and unsecured loan offers
received by the household during the month. The data also include the terms of credit for credit
card and mortgage offers, including interest rates, credit limits and whether a credit card offers
rewards and has an annual fee. Our main analyses will focus on offers for products which are
typically underwritten using income, that is, credit cards, auto loans, unsecured loans, and
mortgages. We will also examine the credit limits and interest rates on credit card offers, the
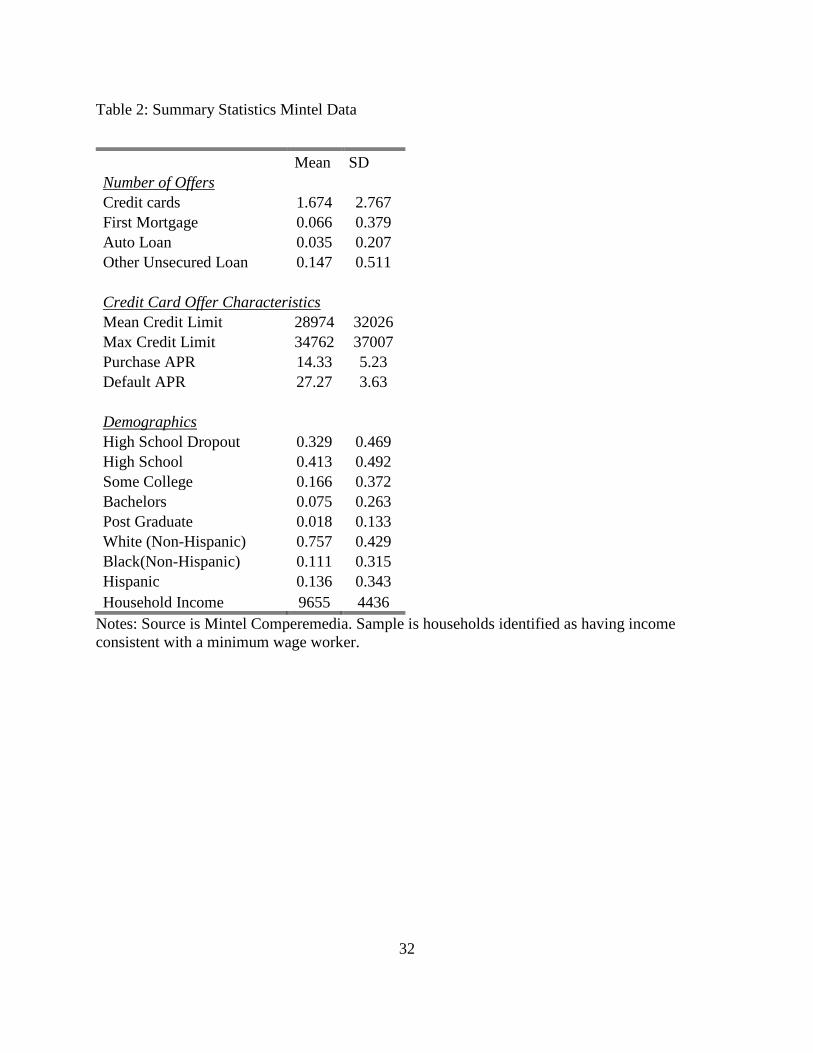
most popular type of mailing in the data. Table 2 summarizes minimum wage households in the
Mintel data.
Importantly, the Mintel data include a measure of household income, household size, and
the state of residence, which allows us to identify minimum wage households. To be precise, we
identify minimum wage households as those whose household income is between 60 and 120
percent of the state minimum wage (for a single-person household) or 120 and 240 percent of the
state minimum wage (for a multiple-person household), similar to Aaronson et al (2012).
We estimate ordinary least squares regressions of the following form:
9
𝑦𝑦𝑖𝑖𝑖𝑖𝑖𝑖 = 𝛽𝛽1 ln�𝑚𝑚𝑚𝑚𝑚𝑚𝑚𝑚𝑚𝑚𝑚𝑚𝑚𝑚𝑖𝑖,𝑖𝑖−3� ∗ 𝑚𝑚𝑚𝑚𝑚𝑚𝑚𝑚𝑚𝑚𝑚𝑚𝑚𝑚ℎ𝑜𝑜𝑜𝑜𝑜𝑜𝑚𝑚ℎ𝑜𝑜𝑜𝑜𝑜𝑜𝑖𝑖𝑖𝑖
+ 𝛽𝛽2 ln�𝑚𝑚𝑚𝑚𝑚𝑚𝑚𝑚𝑚𝑚𝑚𝑚𝑚𝑚𝑖𝑖,𝑖𝑖−3� + 𝛽𝛽3𝑚𝑚𝑚𝑚𝑚𝑚𝑚𝑚𝑚𝑚𝑚𝑚𝑚𝑚ℎ𝑜𝑜𝑜𝑜𝑜𝑜𝑚𝑚ℎ𝑜𝑜𝑜𝑜𝑜𝑜𝑖𝑖𝑖𝑖 + 𝑋𝑋𝑖𝑖𝑖𝑖 + 𝑜𝑜𝑚𝑚𝑚𝑚𝑚𝑚𝑢𝑢 𝑟𝑟𝑚𝑚𝑟𝑟𝑚𝑚𝑖𝑖𝑖𝑖 + 𝛾𝛾𝑖𝑖
+ 𝛾𝛾𝑚𝑚 + 𝜀𝜀𝑖𝑖𝑖𝑖
Where 𝑦𝑦𝑖𝑖𝑖𝑖𝑖𝑖 is the credit offer outcome of interest for household i in state s in month t.
ln�𝑚𝑚𝑚𝑚𝑚𝑚𝑚𝑚𝑚𝑚𝑚𝑚𝑚𝑚𝑖𝑖,𝑖𝑖−3� is the minimum wage in state s in month t-3 (one quarter prior).8
𝑚𝑚𝑚𝑚𝑚𝑚𝑚𝑚𝑚𝑚𝑚𝑚𝑚𝑚ℎ𝑜𝑜𝑜𝑜𝑜𝑜𝑚𝑚ℎ𝑜𝑜𝑜𝑜𝑜𝑜𝑖𝑖𝑖𝑖 is the indicator for whether or not the household is identified to have a
minimum wage worker. 𝑋𝑋𝑖𝑖𝑖𝑖 is vector of demographic characteristics of the household
(education, race/ethnicity, and age group), 𝛾𝛾𝑖𝑖 is a vector of state fixed effects, 𝛾𝛾𝑚𝑚 is are a vector
of month fixed effects.9 Standard errors are adjusted for clustering at the state level.
In these regressions, the coefficient of interest is 𝛽𝛽1 which captures the conditional effect
of changes in the state-level minimum wage on credit offers to minimum wage workers. This
coefficient describes how a change in the minimum wage affects the credit offers received by
households who are most likely to be affected by changes in policy because of their incomes. 𝛽𝛽2
captures the conditional main effect of changes in state-level minimum wages on credit offers net
of minimum wage household status, all else held constant. We interpret this as the effect of
changes in minimum wages on households who are less likely to be affected by policy changes.
This coefficient will capture any changes in credit availability associated with minimum wage
policy that are not related to changes in specific households’ (perceived) credit-worthiness or
8 We chose one quarter prior to be consistent with the timing in the quarterly credit report data. Appendix table 11 shows different lags (one month and one year) and results are similar. The appendix can be found at: www.umich.edu/~jwhsu/dettling_hsu_minwage_credit_appendix.pdf. 9 In additional results in the appendix, we examine the robustness of our results to additional controls, including interactions between the state fixed effects and minimum wage household status, and state-month time trends and census division-year fixed effects, as suggested by Allegretto et al (2011) (appendix table 1). The results are virtually unchanged.

10
demand for liquidity, such as changes in the general economic environment. The level term
𝑚𝑚𝑚𝑚𝑚𝑚𝑚𝑚𝑚𝑚𝑚𝑚𝑚𝑚ℎ𝑜𝑜𝑜𝑜𝑜𝑜𝑚𝑚ℎ𝑜𝑜𝑜𝑜𝑜𝑜𝑖𝑖𝑖𝑖 captures the level correlation between minimum wage household status
and credit offers. We include the main effect of minimum wage status to facilitate a causal
interpretation of 𝛽𝛽1, but do not assign a causal interpretation to the coefficient on the main effect
since the level correlation between credit offers and borrower type could be determined by a host
of different factors, such as average credit scores or whether the type of borrower is more likely
to be a homeowner.
We are interested in identifying the causal relationship between state-level minimum
wages and credit offers to minimum wage workers. As such, it is important that we control for
time-varying state-level economic conditions that might affect credit offers. Thus, our analysis
also include the state-month unemployment rate (𝑜𝑜𝑚𝑚𝑚𝑚𝑚𝑚𝑢𝑢 𝑟𝑟𝑚𝑚𝑟𝑟𝑚𝑚𝑖𝑖𝑖𝑖), drawn from the Bureau of
Labor Statistics (BLS) local area unemployment statistics. Our analyses also importantly include
state and month fixed effects (𝛾𝛾𝑖𝑖 and 𝛾𝛾𝑚𝑚), so that the estimate relationship between minimum
wages and credit offers is not confounded by time-invariant differences in credit offers to states
with higher or lower minimum wages or national trends in minimum wage levels and credit
availability.
3.2.2 Results for Credit Offers
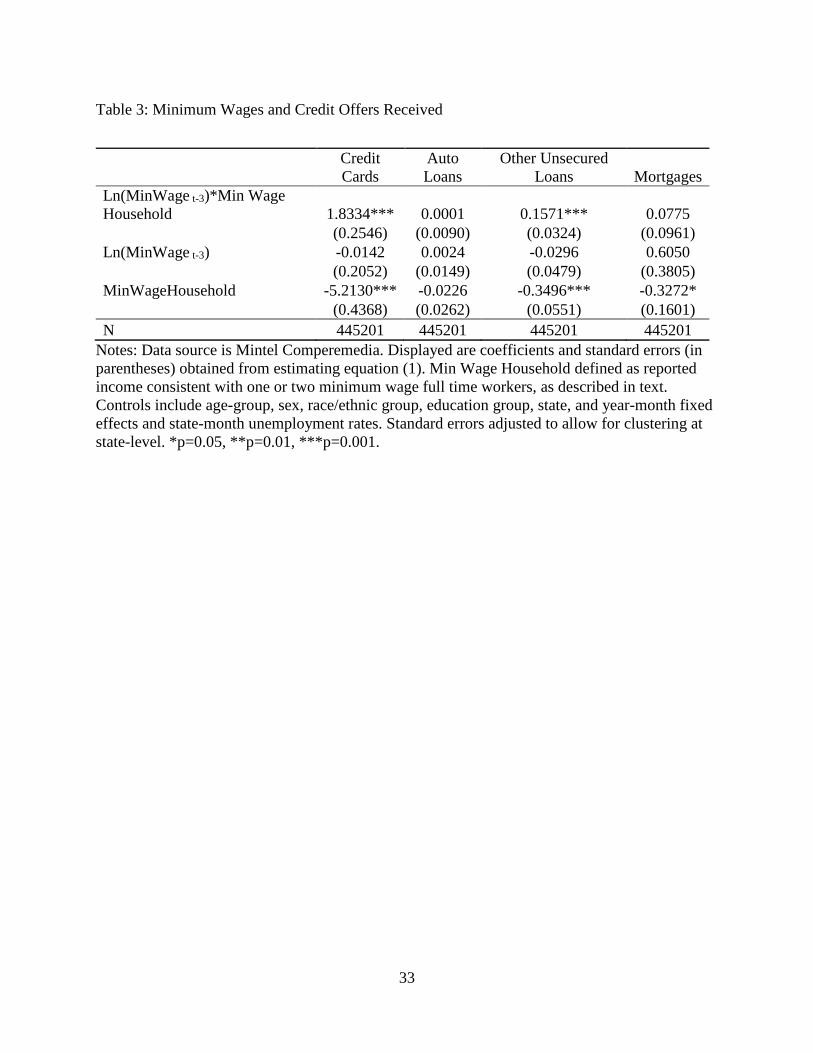
Table 3 presents the results of estimating equation (1) where the outcome is the number
of offers received in each of the main loan types.10 This specification yields a point estimate on
the interaction term between minimum wage worker status and the natural log of minimum wage
10 The appendix includes specifications where the outcome is alternatively a binary indicator of any offer received or the conditional number of offers (appendix table 2), both of which provide similar results.
11
(𝛽𝛽1) of 1.8334 for credit cards, 0.0001 for auto loans, 0.1571 for other unsecured loans, and
0.0775 for mortgages. Of these, the results are statistically significant at the one percent level for
credit cards and unsecured loans.11 This indicates that minimum wage workers receive more
credit offers of these types when minimum wages rise. At the mean, these estimates imply that a
$1 increase in the minimum wage leads to a 6.9 percent increase in credit card offers and an 11.2
percent increase in unsecured loan offers.
On the other hand, we see that the conditional main effect of the minimum wage is small
and imprecisely estimated for all types of loans, indicating that offers received by higher-income
households are unaffected by changes in the minimum wage. The coefficients on
𝑚𝑚𝑚𝑚𝑚𝑚𝑚𝑚𝑚𝑚𝑚𝑚𝑚𝑚ℎ𝑜𝑜𝑜𝑜𝑜𝑜𝑚𝑚ℎ𝑜𝑜𝑜𝑜𝑜𝑜𝑖𝑖𝑖𝑖 indicate that, on average, low-income households receive fewer offers
than higher-income households for all types of loans except auto loans (where the results are
indistinguishable from zero), consistent with minimum wage households having relatively less
credit available to them. Note that the results in table 3 indicate that typical changes in the
minimum wage narrow, but do not erase this gap. For example, the average minimum wage
household receives 5.2 fewer credit card offers per month than higher income households, and
after the minimum wage rises by $1, minimum wage households would receive 4.95 fewer offers
per month. Extrapolating, our results imply that the minimum wage would need to almost
quadruple for minimum wage households to receive as many credit card offers as higher income
households. Overall, the evidence in table 3 is consistent with higher minimum wages increasing
11 One possible explanation for the lack of a result on either interaction of level term for auto loans is that these mailings are quite rare. Mortgage offers are less rare overall, but rare among minimum wage households who are less likely to be homeowners.

12
the offers received precisely for the group affected by the minimum wage, with no effects on
other groups.
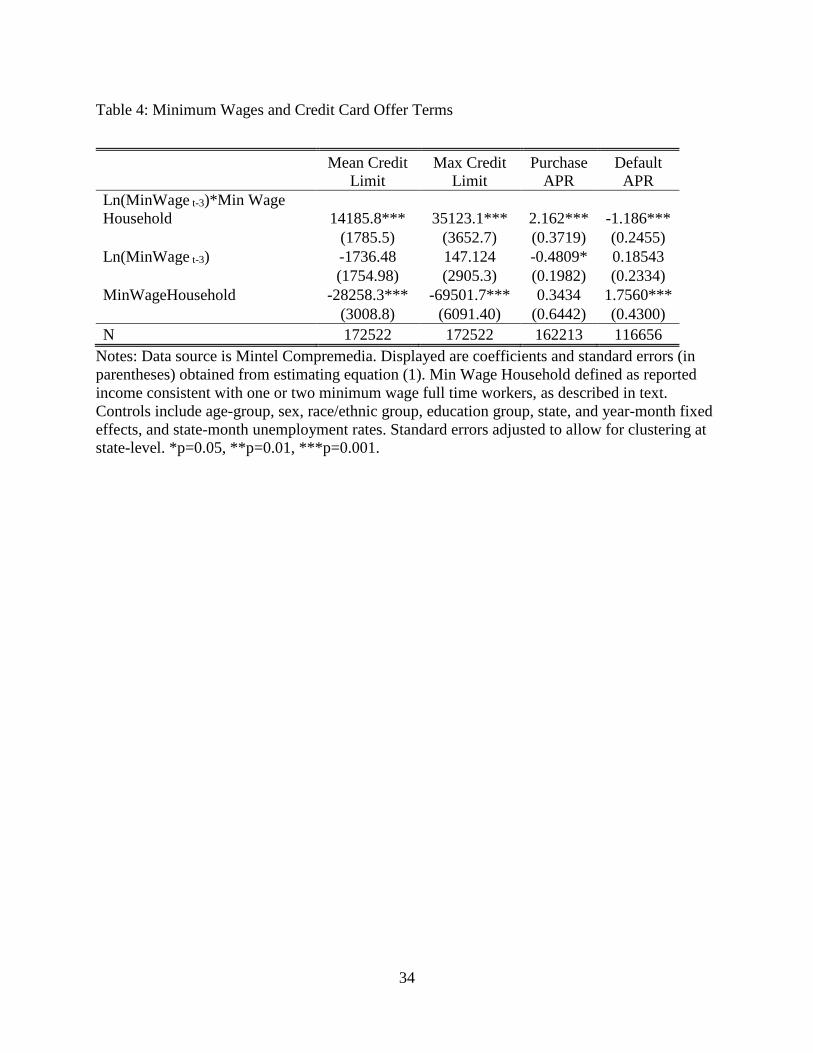
Table 4 narrows in on the terms included in credit card offers received, including the
credit limit and interest rates. Columns 1 and 2 displays the results where the outcome is the
mean and maximum credit limit, respectively. The coefficient on the interaction term indicates
that minimum wage households receive higher credit limit credit card offers when minimum
wages rise: a one hundred percent rise in the minimum wages raises the mean credit limit by
$14,185, and the maximum credit limit by $35,123 for minimum wage households. At the mean,
this implies that a $1 rise in the minimum wage increases credit limits offered to minimum wage
households by 5.2 percent (mean limit) and 10.1 percent (maximum limit). The conditional main
effect of the minimum wage indicates there is no corresponding effect for higher income
workers, and the level terms indicate that minimum wage households, on average, are offered
lower credit limits on credit card offers. Again, we find that a typical minimum wage increase
narrows but does not erase gaps in credit limits offered to minimum wage and higher income
households. Extrapolating, our results imply the minimum wage would need to triple in order for
minimum wage households to receive as high of credit limits as higher income households.
Columns 3-4 of table 5 display results for interest rates. For comparability, we focus on
cards that offer neither rewards nor annual fees, since interest rates often differ on these
dimensions, and any changes in the mix of offers would complicate such an analysis.12 Column 3
displays the results for the purchase APR and column 4 displays the results for the default APR.
12 The appendix includes results on the mix of offers received (appendix table 3) as well as interest rates on other types of cards (appendix table 4). Those results indicate that minimum wage workers do receive more of these types of offers when minimum wages rise.
13
Purchase APR is the standard APR offered on purchases. Default APR is the interest rate that is
later applied in the event that the borrower misses any payments. Interestingly, we see that on
average, lower income households are offered lower purchase APRs and higher default APRs.
This is consistent with Ru and Schoar (2016), who find that credit card-issuers target less-
sophisticated (less educated) customers with more steeply back-loaded fees (lower introductory
and purchase interest rates, and higher default interest rates, late fees and over-limit fees).
However, we see that when minimum wages rise, minimum wage households are offered slightly
higher purchase APRs and lower default APRs, making their offers more similar to those
received by higher income households. As in previous specifications, there is no effect of a
change in minimum wages on higher income households.
Our preferred interpretation of these analyses is that they represent unsolicited credit
offers, and as such, provide a unique opportunity for studying the availability of credit over time
for the populations of interest. The evidence we find suggests minimum wage borrowers have
more credit available to them once the minimum wage rises. An important question is the extent
to which this is a one-to-one response to the change in income from a minimum wage hike –that
is, a shift along the credit supply curve—or if it is larger than we might expect from the change
in income –that is, a shift outwards in the credit supply curve. Figure 1 traces out the credit card
offer curve by income bracket in 2005, where the blue line represents the mean number of credit
card offers received by households in each income bracket who reside in states where the
minimum wage is above the federal minimum wage, and the red line represents the mean number
of offers to borrowers in states observing the federal minimum wage. This provides suggestive
evidence that the effects we observe are consistent with a shift outwards in the supply curve in
14
response to policy: at each income level consistent with minimum wage work, households in
states with higher minimum wages receive more offers.
An important caveat to these analyses is that not all forms of credit are advertised through
the mail, and the data provide only a glimpse of the full range of credit products that may
available to a person. For example, auto loan financing offers are rare in the data: the median
(and even the 90th percentile) respondent receives no auto loan offers.13 This suggests an analysis
of credit offers by mail may understate the overall credit supply effects of minimum wage
policy. At the same time, mail offers often include ranges, maximum borrowing limits, or
minimum interest rates, which are dependent on further underwriting. This suggests our analyses
might overstate the amount of credit households could actual receive. For these reasons, we will
turn next to an investigation into household borrowing patterns, in order to gauge whether and
how these offers translate into credit usage, and to more fully capture the full range credit
products that may be available to a household.
3.3 Borrowing, Payment Behavior and Credit Scores
3.3.1 Data and Empirical Specification
Data on borrowing and payment behavior come from the Federal Reserve Bank of New
York Consumer Credit Panel/Equifax (CCP/Equifax).14 The CCP/Equifax is an individual-level
panel dataset of consumer credit reports, obtained from one of the three main credit bureaus in
the United States. The data have been collected four times per year (March, June, September and
13 Auto sales advertising is slightly more common in the data than auto loan advertising. It is worth noting that auto sales advertising frequently mentions financing options for “qualified borrowers,” but since this tells us nothing about the availability of credit to the particular recipient, we limit our analyses specifically to auto loan offers. 14 Additional information about the dataset, including sampling and methodology, can be found in Lee and van der Klaauw (2010) at www.newyorkfed.org/microecnomics/ccp.html.
15
December) since 1999 and consist of a five percent random sample of all U.S. consumers with
credit histories. The data include detailed information drawn from credit reports, such as loan
balances, credit limits, payment status, the Equifax risk score (a type of credit score).15
Our main outcomes of interest are measures of borrower usage of consumer credit and
payment behavior on auto loans, credit cards, and mortgages. We focus on two measures of
usage: the number of loans/trades in each category and credit limits on consumer credit cards.
For a picture of overall creditworthiness, we examine the borrower’s credit risk, as captured by
the Equifax risk score, a type of credit score. This measure is a composite measure of
creditworthiness used by lenders in underwriting, and is determined by payment behavior, credit
utilization and length of credit history. We also examine overall payment behavior on any of the
three types of loans using an indicator for delinquency, defined as being 60 days or more past
due. We do not highlight analysis of debt balances themselves because balances in the
CCP/Equifax vary by type of debt in their meaning and interpretation. Credit cards, for example,
are recorded at an arbitrary point in the billing cycle and thus conflate credit card spending and
debt; borrowers who use cards for convenience only, paying off their bill in full every month,
and borrowers with large revolving balances are indistinguishable.
For this dataset, we estimate individual fixed effects models of the following form:
𝑦𝑦𝑖𝑖𝑖𝑖𝑖𝑖 = 𝛽𝛽 ln�𝑚𝑚𝑚𝑚𝑚𝑚𝑚𝑚𝑚𝑚𝑚𝑚𝑚𝑚𝑖𝑖,𝑖𝑖−𝑘𝑘� + 𝑚𝑚𝑚𝑚𝑚𝑚𝑖𝑖𝑖𝑖 + 𝑜𝑜𝑚𝑚𝑚𝑚𝑚𝑚𝑢𝑢 𝑟𝑟𝑚𝑚𝑟𝑟𝑚𝑚𝑖𝑖𝑖𝑖 + 𝑋𝑋𝑐𝑐𝑖𝑖 + 𝛾𝛾𝑖𝑖 + 𝛾𝛾𝑚𝑚 + 𝛾𝛾𝑖𝑖 + 𝜀𝜀𝑖𝑖𝑖𝑖
Where 𝑦𝑦𝑖𝑖𝑖𝑖𝑖𝑖 is the credit outcome of interest for individual i in state s in month t.
ln�𝑚𝑚𝑚𝑚𝑚𝑚𝑚𝑚𝑚𝑚𝑚𝑚𝑚𝑚𝑖𝑖,𝑖𝑖−𝑘𝑘� is the minimum wage in state s in month t-k, where k=3 (one quarter prior) or
15 By design, this dataset only includes individuals who have credit reports, so teenagers are underrepresented in our data and excluded from our analyses, despite their historical prominence in the minimum wage literature.

16
k=12 (one year prior). 𝑚𝑚𝑚𝑚𝑚𝑚𝑖𝑖𝑖𝑖 is vector of dummies for the age group of person i, 𝑋𝑋𝑐𝑐𝑖𝑖 is a vector of
Census-block/block-group characteristics (education, race/ethnicity, sex and median income), 𝛾𝛾𝑖𝑖
is a vector of state fixed effects, 𝛾𝛾𝑚𝑚 is a vector of month fixed effects, and 𝛾𝛾𝑖𝑖 is a vector of person
fixed effects. We include person fixed effects so that we can interpret 𝛽𝛽 as the effect of within-
person changes in the minimum wage on within-person changes in our outcomes, net of any
fixed characteristics of the borrower (such as their level of education or race/ethnicity, which are
not observed in the data). Standard errors are adjusted for clustering at the person-level to allow
for the panel structure of the data.
The CCP/Equifax has very rich debt information, but limited demographic
characteristics; only the individual's age and location of residence are available.16 To overcome
this limitation, we proxy for the demographic characteristics of the sample member by merging
to the data the demographic and economic characteristics of the individual's census block of
residence (𝑋𝑋𝑐𝑐𝑖𝑖), tabulated from the 2000 Census. We use variables on the race, ethnicity, sex,
median income (by age group) and educational attainment of the census block/block-group's
inhabitants as control variables in our analyses.
Because the CCP/Equifax does not have borrower income, we cannot directly observe
whether an individual’s income is consistent with working in a minimum wage job as we can in
the Mintel and SCF data. Instead, we focus our analyses on borrowers who live in a census-block
group with a relatively high fraction of low-skill workers, defined as more than 50 percent of the
16 Federal law prohibits lenders from discriminating applications on the basis of race, ethnicity, marital status, national origin, religion, or receipt of public assistance, and these demographic characteristics are not included in the data.

17
census-block having below a high school education.17 We interpret this as indicative that the
borrower himself is, with high probability, a low-skill worker, and more generally, that he lives
in a neighborhood where the cost-of-living is feasible for a low-skill (and typically lower
income) borrower. Because this prediction will necessarily be imperfect, these analyses are akin
to an “intent to treat” analysis, and the results are likely a lower bound on the causal effect for
minimum-wage workers. That said, there is empirical evidence that changes in minimum wages
also affect workers who make above-minimum wage incomes due to spillover effects.18 As such,
even if our data allowed us to focus exclusively on minimum wage workers, such an analysis
could miss out on important effects for borrowers with slightly higher incomes, who likely also
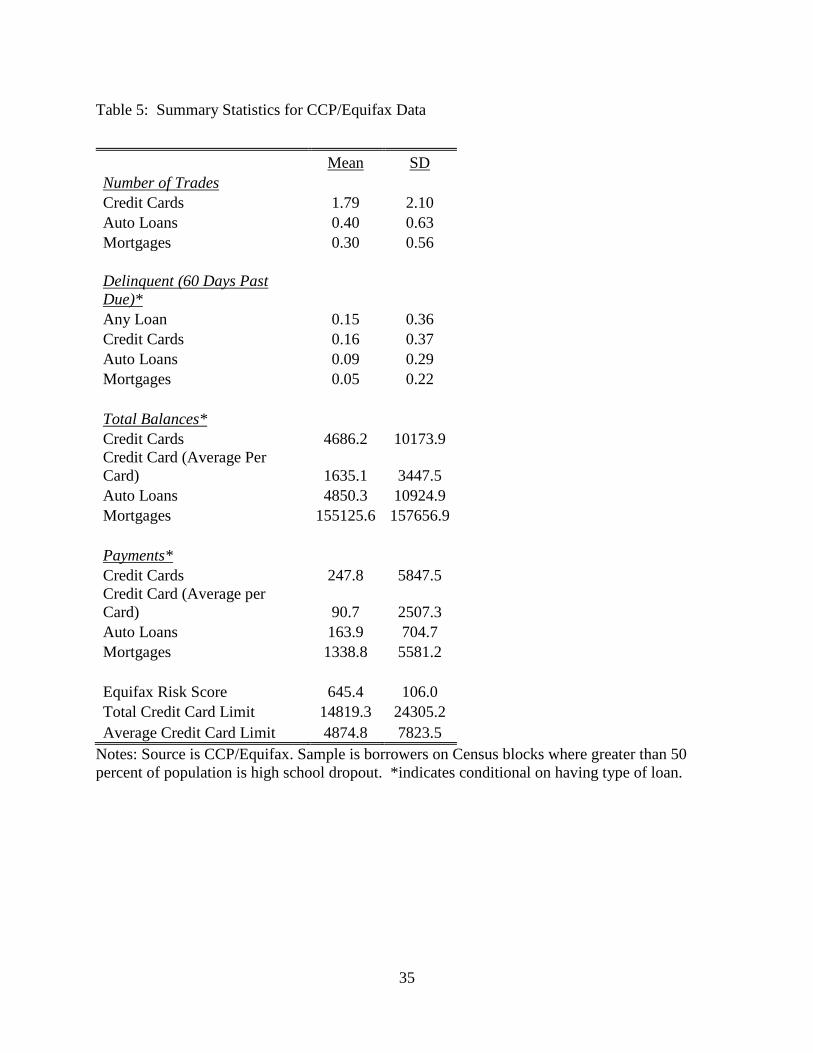
live in the types of neighborhoods minimum wage borrowers live. Table 5 describes the
CCP/Equifax data for these borrowers.
3.3.2 Results for Borrowing, Payment Behavior and Credit Scores
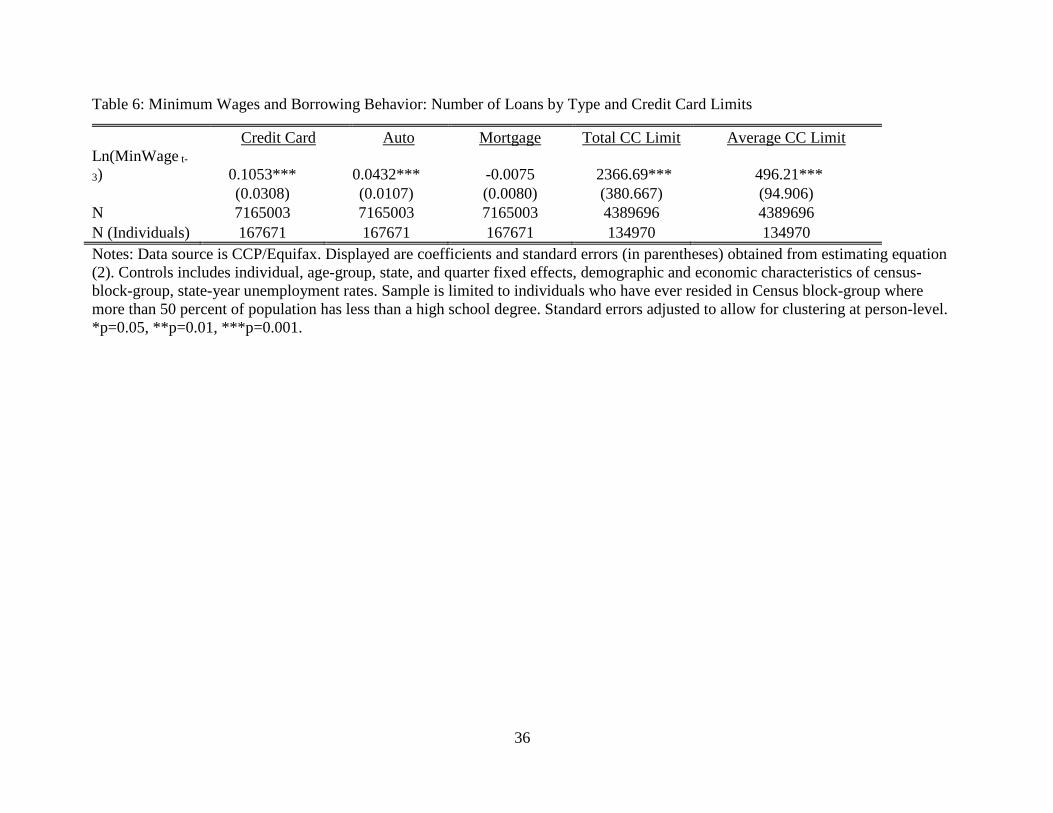
Table 6 presents results estimating equation (2), where in columns 1-3 the outcome is the
number of trades/loans the borrower has in each of the following categories: credit cards, auto
loans, and mortgages. The results presented in table 6 columns 1-3 indicate that a one hundred
percent change in the minimum wage leads to: 0.103 more credit cards and 0.043 more auto
loans, both of which are statistically significant at the one percent level.19 At the mean, these
17 Appendix figure 1 plots the regional representation of these types of Census Blocks, indicating they are diverse and represent all parts of the country. Appendix tables 5-7 also presents results using alternative cut-offs and different measures, including block-group median incomes, high school graduates and younger borrowers. 18 See Belman and Wolfson (2014) for a review of literature on who is afftected by minimum wages. 19 Aaronson et al (2015) also find that increase in the minimum wage lead to more auto debt.

18
effects imply that a $1 increase in the minimum wage leads to a 0.8 percent more credit cards
and 1.5 percent more auto loans.20
Column 4-5 of table 6 displays credit limits on credit cards, defined as both the total limit
across all credit cards and the average limit per card. Both indicate an increase in credit card
limits, with a $2,366 increase in total credit available and a $496 increase in credit available per
card. Evaluated at the mean, these coefficients imply that a $1 increase in the minimum wage
increases credit limits on consumer credit cards by 1.4 percent per card, and 2.2 percent overall,
which is about a quarter the size of the effects found for offers above.
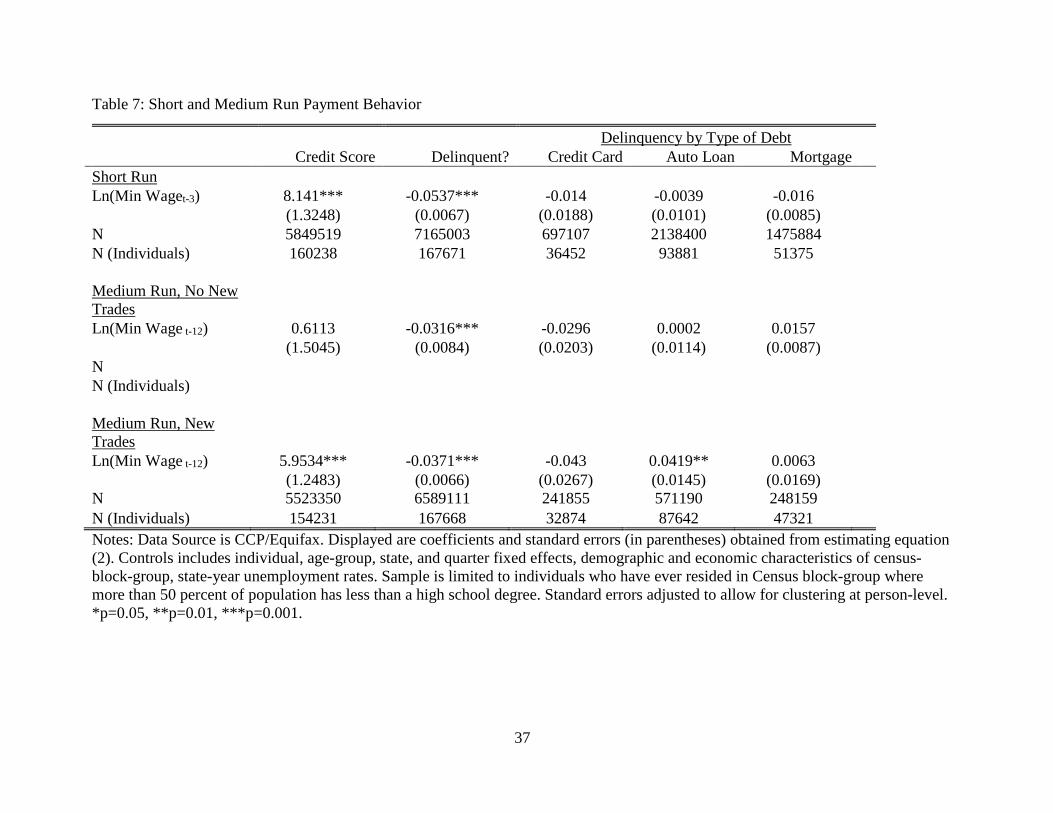
The top panel of table 7 presents the results of estimating equation (2) where the
dependent variables measure a borrower’s payment behavior, including overall credit risk and
delinquency.21 Column 1 displays the results for credit scores, indicating a one hundred percent
increase in the minimum wage leads to an 8 point increase in credit scores; at the mean, this
implies a $1 increase in the minimum wage increase credit scores by 0.17 percent. Credit scores
are heavily influenced by payment behavior, and indeed, column 2, which displays results for
delinquency on any account, indicates a one hundred percent increase in minimum wages
reduces the probability of being delinquent by 5.37 percentage points. At the mean, this indicates
that a $1 increase in the minimum wage reduces delinquency rates by 5 percent. Taken together,
these results imply increases in minimum wages lead to increased debt service payments, and
improved credit scores, among households in lower-skill Census blocks.
20 Note that appendix table 5 indicates the auto loan result is sensitive to the particular subset of census blocks included in the analysis. Thus, we exercise caution in our interpretation of that result. The credit card result is quite robust on the other hand. 21 Results in appendix table 9 also present results for the fraction of total balances by type which are current or past due. Results are very similar.
19
Columns 3-5 of the top panel of table 7 displays results for delinquency by type of debt.
This indicates that the decline in delinquency can be attributed to changes in delinquency on
credit cards, where a one hundred percent increase in minimum wages reduces the probability of
being delinquent by 8.31 percentage points. At the mean, this implies that a $1 increase in
minimum wages reduces credit card delinquency by 7.2 percent. The fact that the reduction in
overall delinquency is driven by credit cards is not surprising; becoming current on a credit card
only requires that the borrower make the minimum payment, typically around 2-4 percent of the
total balance during this time period. Aaronson et al (2012) found that a $1 minimum wage hike
increases household income by about $250 per quarter, which would cover the $90 minimum
monthly credit card payment required for borrowers found in our sample (on average).
Since we are interested both in immediate reactions to a change in the minimum wage, as
well as whether borrowers who take out new loans are able to manage this new debt, we will
next focus our attention on what we call “medium run” outcomes, that is, payment behavior one
year after a change in the minimum wage. We will look separately at borrowers who took out
any new debt in the past year in each category (as well as overall) and those who did not, in
order to directly examine whether borrowers with new debt after the minimum wage change
were able to manage it over the next year.
The bottom two panels of table 7 presents results from estimating equation (2), where the
independent variable of interest is one-year lagged minimum wages. The middle panel of table 7
displays results for borrowers without any new trades/loans (either overall or of a particular
type). In this case, there is no demonstrable effect on credit scores, but overall delinquency
declines by 3.1 percentage points. As in the short run, this is driven by a reduction in credit card
20
delinquency, of about 7.7 percentage points. There is no statistically significant change in
delinquency on any other type of debt. This suggests the change in credit scores observed in the
overall specification is driven by borrowers opening new accounts (credit usage is another key
component in credit scoring).
The bottom panel of table 7 displays results for borrower who had new trades/loans. As
in the short run, there is a statistically significant increase in credit scores, as well as a decline in
overall delinquency. Looking by loan type, we see that borrowers with new credit cards were 5.3
percentage points less likely to be delinquent on a credit card. This coefficient implies that a $1
increase in the minimum wage reduces delinquency by 9 percent among borrowers with new
credit card accounts. One possible explanation for the relatively larger effect on delinquency for
borrowers with new credit cards than those with no new cards is the possibility that these
borrowers are using a balance transfer option.
For the other types of loans, we see that among borrowers who opened new auto loans
delinquency rates increase, on the order of 4.2 percentage points. At the mean, this indicates that
a $1 increase in minimum wages increases delinquency among new auto borrowers by 8.4
percent, implying that some borrowers opening new auto loans had problems making timely
payments. Given the modest increase in the average number of auto loans in response to
minimum wage hikes, these elevated delinquency rates apply to a relatively small group of
borrowers. Recall that table 6 indicated a 1.5 percent increase in auto borrowing, thus, this
estimate implies that a $1 rise in the minimum wages increases overall auto loan delinquency by
21
0.13 percent. Moreover, appendix table 7 indicates that, unlike the credit card and credit score
results, this result is not robust to changes in the definition of a minimum wage household. 22
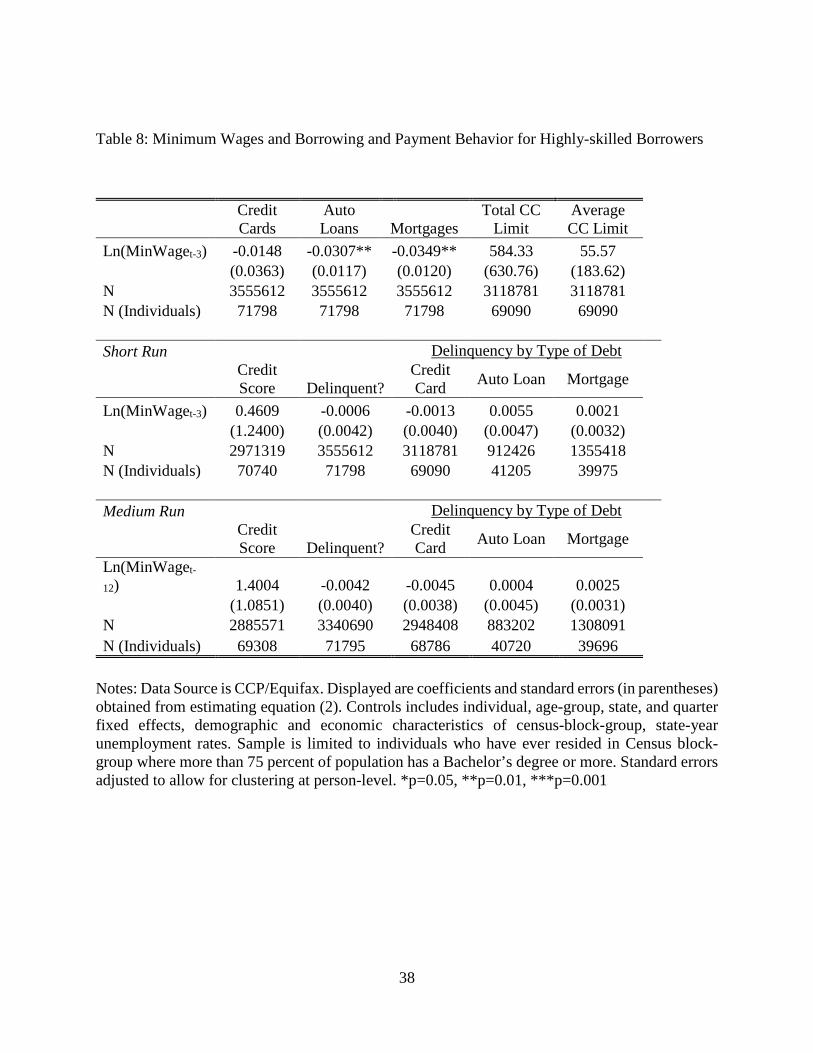
Next, we repeat our borrowing and payment behavior analyses using census blocks with
higher concentrations of residents with college educations. We consider this a quasi-placebo test,
since these blocks contain fewer residents who would be affected by a changing minimum wage.
These results are displayed in table 8. Unlike the analysis on borrowers on blocks with a high
concentration of low-skill workers, the top panel of table 8 indicates that for borrowers on more
highly educated census blocks, increases in minimum wages are not associated with any
measurable increase in the number of credit cards, auto loans, or mortgages, or credit limits on
credit cards held by a borrower. If anything, there is a slight decline in credit card and auto
borrowing, though the effects are modest. Likewise, the middle and bottom panel of table 8
indicate that minimum wage increases are associated with no significant changes in credit scores
or payment behavior, either in the short run or the medium run.
Overall, the evidence presented above indicates that increases in minimum wages are
followed by increased borrowing in traditional credit markets (mainly via credit cards) and
overall improvements in payment behavior and credit scores. We now examine whether such
shifts in how affected households interact with traditional credit markets is coupled with changes
in how they use AFS credit products, such as payday loans and rent-to-own stores.
22 Aaronson, et al. (2012) do not find an increase in delinquency on new auto loans in their data.
22
3.4 Alternative Financial Service (AFS) Credit Products
3.4.1 Data and Empirical Specification
Data on borrowing via AFS credit products come from the Current Population Survey
Unbanked and Underbanked Households Supplement, which has been conducted biennially
since 2009 by the Federal Deposit Insurance Corporation in partnership with the U.S. Census
Bureau.23 The data include demographic and economic characteristics of households and
information on usage of AFS credit products, including payday loans, rent-to-own stores, and
pawn shops. Each of these products are high-interest loans which do not require a credit check.24
Usually, only a proof employment and a checking account are required. Payday loans are
unsecured small-dollar short-term consumer loans, which usually carry an APR of about 400
percent. Pawn shop loans are also small-dollar short-term loans, but they are secured by personal
property (e.g., electronics, jewelry, etc.). The effective APR on pawn shop loans is usually about
250 percent and if a borrower does not pay back the loan, the pawn shop keeps the collateral.
Rent-to-own loans are loans for durable goods (e.g. furniture, electronics, etc.) which are secured
by the good in question, which can be repossessed. The cost of purchasing the goods is typically
much higher than if purchased directly, and the implied APRs vary from about 57 percent to 250
percent.
We create indicators for household usage of each product in the past year, and merge in
state-level minimum wage information for 12 months prior to the survey date.25 We define a
23 Information on the supplements can be found at https://www.fdic.gov/householdsurvey/ 24 Bhutta et al, forthcoming provide detailed descriptions of each of the AFS products in the CPS data. The statistics in this paragraph were compiled from their summaries. 25 The question wording changed between 2009 and 2011. We follow Bhutta et al (forthcoming) to harmonize the data across survey waves.
23
household as a minimum wage household by summing up total hours worked in a year for a
family and dividing family income by total hours worked, where again, we use 60 to 120 percent
of the state minimum wage as the cutoff.26 In this data, 3.3 percent of minimum wage
households used a payday loan, 4.1 percent used a pawn shop loan, and 2.7 percent rented items
from a rent-to-own store. We estimate ordinary least squares regressions of the following form,
similar to those used in the credit offer analysis:
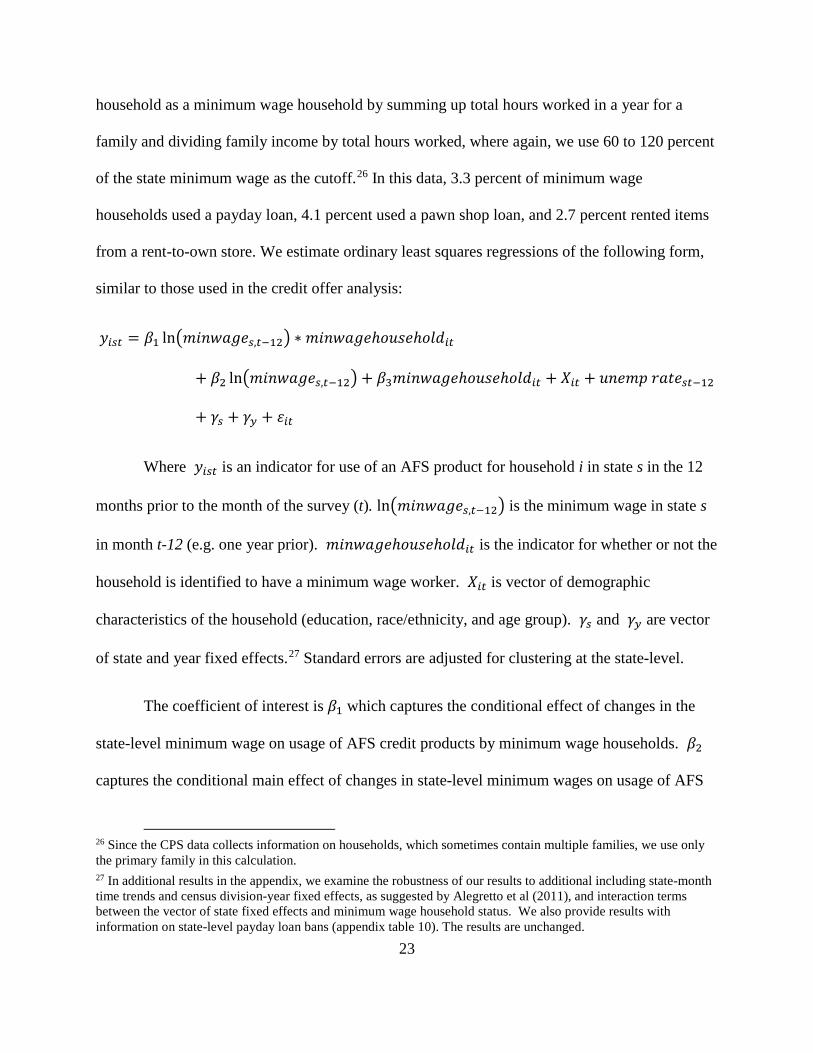
𝑦𝑦𝑖𝑖𝑖𝑖𝑖𝑖 = 𝛽𝛽1 ln�𝑚𝑚𝑚𝑚𝑚𝑚𝑚𝑚𝑚𝑚𝑚𝑚𝑚𝑚𝑖𝑖,𝑖𝑖−12� ∗ 𝑚𝑚𝑚𝑚𝑚𝑚𝑚𝑚𝑚𝑚𝑚𝑚𝑚𝑚ℎ𝑜𝑜𝑜𝑜𝑜𝑜𝑚𝑚ℎ𝑜𝑜𝑜𝑜𝑜𝑜𝑖𝑖𝑖𝑖
+ 𝛽𝛽2 ln�𝑚𝑚𝑚𝑚𝑚𝑚𝑚𝑚𝑚𝑚𝑚𝑚𝑚𝑚𝑖𝑖,𝑖𝑖−12� + 𝛽𝛽3𝑚𝑚𝑚𝑚𝑚𝑚𝑚𝑚𝑚𝑚𝑚𝑚𝑚𝑚ℎ𝑜𝑜𝑜𝑜𝑜𝑜𝑚𝑚ℎ𝑜𝑜𝑜𝑜𝑜𝑜𝑖𝑖𝑖𝑖 + 𝑋𝑋𝑖𝑖𝑖𝑖 + 𝑜𝑜𝑚𝑚𝑚𝑚𝑚𝑚𝑢𝑢 𝑟𝑟𝑚𝑚𝑟𝑟𝑚𝑚𝑖𝑖𝑖𝑖−12
+ 𝛾𝛾𝑖𝑖 + 𝛾𝛾𝑦𝑦 + 𝜀𝜀𝑖𝑖𝑖𝑖
Where 𝑦𝑦𝑖𝑖𝑖𝑖𝑖𝑖 is an indicator for use of an AFS product for household i in state s in the 12
months prior to the month of the survey (t). ln�𝑚𝑚𝑚𝑚𝑚𝑚𝑚𝑚𝑚𝑚𝑚𝑚𝑚𝑚𝑖𝑖,𝑖𝑖−12� is the minimum wage in state s
in month t-12 (e.g. one year prior). 𝑚𝑚𝑚𝑚𝑚𝑚𝑚𝑚𝑚𝑚𝑚𝑚𝑚𝑚ℎ𝑜𝑜𝑜𝑜𝑜𝑜𝑚𝑚ℎ𝑜𝑜𝑜𝑜𝑜𝑜𝑖𝑖𝑖𝑖 is the indicator for whether or not the
household is identified to have a minimum wage worker. 𝑋𝑋𝑖𝑖𝑖𝑖 is vector of demographic
characteristics of the household (education, race/ethnicity, and age group). 𝛾𝛾𝑖𝑖 and 𝛾𝛾𝑦𝑦 are vector
of state and year fixed effects.27 Standard errors are adjusted for clustering at the state-level.
The coefficient of interest is 𝛽𝛽1 which captures the conditional effect of changes in the
state-level minimum wage on usage of AFS credit products by minimum wage households. 𝛽𝛽2
captures the conditional main effect of changes in state-level minimum wages on usage of AFS
26 Since the CPS data collects information on households, which sometimes contain multiple families, we use only the primary family in this calculation. 27 In additional results in the appendix, we examine the robustness of our results to additional including state-month time trends and census division-year fixed effects, as suggested by Alegretto et al (2011), and interaction terms between the vector of state fixed effects and minimum wage household status. We also provide results with information on state-level payday loan bans (appendix table 10). The results are unchanged.

24
credit products net of minimum wage household status, all else held constant. We interpret this
as the effect of changes in minimum wages on workers who are less likely to be affected by
changes in policy. The level term 𝑚𝑚𝑚𝑚𝑚𝑚𝑚𝑚𝑚𝑚𝑚𝑚𝑚𝑚ℎ𝑜𝑜𝑜𝑜𝑜𝑜𝑚𝑚ℎ𝑜𝑜𝑜𝑜𝑜𝑜𝑖𝑖𝑖𝑖 captures the level correlation between
minimum wage household status and use of AFS credit products. As before, we include the
main effect of minimum wage household to facilitate a causal interpretation of 𝛽𝛽1, but do not
assign a causal interpretation to the coefficient on the main effect since the level correlation
between use of AFS credit products and borrower type could be determined by a host of different
factors.
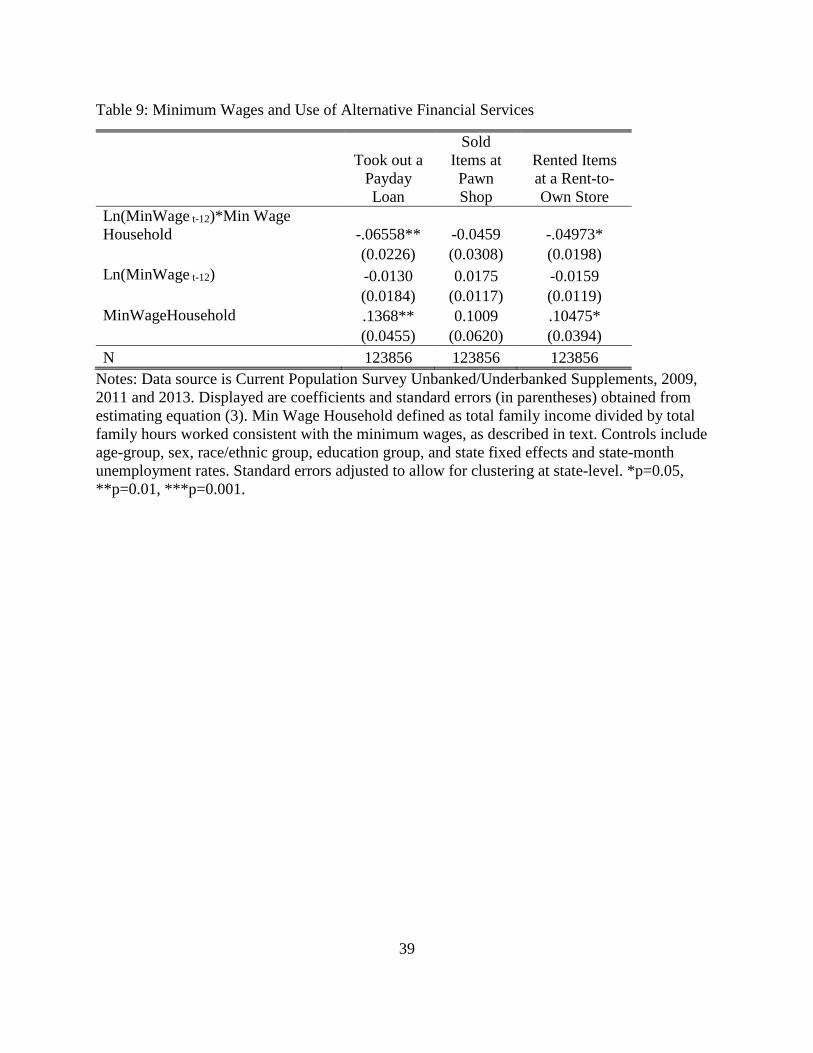
3.4.2 Results for Alternative Financial Service Credit Products
Table 9 displays the results of estimating equation (3) on the CPS data on usage of
payday loans, pawn shops, and leasing from a rent-to-own store. For each outcome, the
coefficient on the interaction term (𝛽𝛽1) indicates that increases in the minimum wage reduces use
of AFS products for minimum wage households. For payday loans and rent-to-own stores, these
effects are precisely estimated and indicate a statistically significant decrease in usage of those
AFS credit products. In contrast, there is a small and statistically insignificant effect of the level
term, Ln(MinimumWage), indicating that there is no effect of minimum wage changes on usage
of AFS credit products for other types of households. At the mean of the dependent variable,
these results indicate that $1 increase in the minimum wage reduces usage of AFS credit
products by minimum wage households by 40-45 percent.
The level term, MinimumWageHousehold is always positive, indicating that, on average,
minimum wage households are more likely than other types of households to use AFS products.
While the interaction term shows that minimum wage hikes are followed by reduced AFS usage

25
for low-income workers, these hikes are generally not large enough to cover the level difference
between the income groups. For example, minimum wage households are 14 percentage points
more likely to use a payday loan than higher income households, and a $1 increase in the
minimum wage narrows that gap by about 1 percentage point. Extrapolating from our results, the
minimum wage would need to triple in order to reduce payday loan usage of minimum wage
households to the level of higher income households.
The results in table 9 indicate that minimum wage households are less likely to use AFS
credit products when minimum wages rise. It is unclear whether this represents substitution away
from these products towards traditional credit products versus a discontinuation of use of these
products without borrowing elsewhere. While our results cannot directly speak to this question,
we offer a few pieces of suggestive evidence. First, as highlighted in the credit report and credit
offer data, minimum wage household receive more offers and use more traditional credit when
minimum wages are higher. Second, research shows that households who use AFS credit
products typically have credit reports: using a linked dataset Bhutta (2013) finds that essentially
all payday loan borrowers have credit records, and well over 90 percent have a credit score. This
suggests that payday loan borrowers should be covered in both our credit report and credit offer
data, and that we are not simply capturing different populations in the two datasets. Finally, we
note that the average minimum wage increase observed in our data is relatively small, amounting
to about 30 cents per hour. On a monthly basis, for a full time worker, this amounts to around
$50 in extra income, which is much smaller than the typical payday loan amount of $100-$500.
This suggests the extra income afforded by a typical minimum wage increase is not large enough
to cover many expenditure spikes facing a payday borrower.
26
4. Discussion
Borrowing is critical for smoothing shocks, particularly for low-income households who
often have little flexibility in their budgets to cover spikes in expenditures. Using data from
credit offer mailings, credit reports, and survey-reported usage of AFS credit products, we find
that traditional lenders broadly increase credit supply to low-income households when the
minimum wage increases, and in turn, minimum wage households take out new auto loans and
credit cards, with higher limits. Minimum wage borrowers also experience increases in their
credit scores and decreases in payment delinquency on both new and existing debt. Finally, we
find evidence that increased minimum wages reduce low-income households’ usage of AFS
credit products like payday loans, suggesting that the policies enable households to substitute
away from high-cost credit to lower cost, traditional credit. Overall, we find limited evidence in
favor of any adverse effects of this increase in credit supply and use on households’ financial
circumstances.
Establishing a good credit record and improving one’s credit scores increases families’
ability to borrow in present, and in the future. Given the importance of debt in smoothing shocks,
particularly for low-income families, our results suggest that minimum wages have the potential
to create persistent long run positive effects on households’ financial circumstances through an
increase in liquidity. Moreover, by financing lumpy investments in homes, autos and human
capital, debt can provide access to higher paying jobs and facilitate wealth accumulation. Though
we leave a formal investigation of long run effects to future work, our results hint that minimum
wage policy could have persistent positive ripple effects on household welfare and financial
health through the actions of borrowers and lenders in credit markets.

27
These findings have important policy implications. Proponents of minimum wage
legislation tout minimum wages as a way to lift households out of poverty by increasing
earnings, but critics argue disemployment effects outweigh earnings gains. Our results show that,
regardless of the net effect on income or employment, changes in minimum wages expand access
to formal credit to low-income borrowers, and on net, improve affected families credit records
and reduce usage of high-cost alternatives to traditional credit products. To our knowledge, this
potential benefit of minimum wage policy has not been explored. More broadly, similar to Hsu,
Matsa and Meltzer (2014)—who document spillover effects of unemployment insurance on
housing and credit markets—our findings suggest that cost-benefit analyses of social policies
should consider interactions with credit markets, and the impact that has on financial well-being
more generally.
There is growing concern that high-cost alternatives to formal credit products, like
payday loans and rent-to-own stores, are predatory and trap borrowers in a cycle of debt.28 As a
result, legislation has begun targeting what are seen as abusive practices, and many states have
banned payday lending. However, research on these bans suggests they are not effective at
reducing borrowers lending costs. For example, Bhutta et al (2015) find that payday lending bans
simply lead borrowers to switch to other high-cost loans (e.g., pawn shops) and not cheaper
credit card lending. Our results indicate minimum wage policy, in spite of targeting household
income rather than borrowing and lending, is effective at reducing usage of payday and other
high-cost AFS credit products among low-income families.
28 See, for example, http://www.consumerfinance.gov/about-us/blog/weve-proposed-rule-protect-consumers-payday-debt-traps/

28
5. References
Aaronson, Daniel, and Sumit Agarwal and Eric French. 2012. “The Spending and Debt Response to Minimum Wage Hikes.” American Economic Review 102(7): 3111-3139. https://www.aeaweb.org/articles?id=10.1257/aer.102.7.3111
Agarwal, Sumit and Chunlin Liu, and Nicholas S. Souleles. 2007. “The Reaction of Consumer Spending and Debt to Tax Rebates-Evidence from Consumer Credit Data.” Journal of Political Economy 115(6):986-1019. http://dx.doi.org/10.1086/528721
Agarwal, Sumit and Wenlan Qian. 2014. “Consumption and Debt Response to Unanticipated Income Shocks: Evidence from a Natural Experiment in Singapore.” American Economic Review 104(12): 4205-4230.
Allegretto, Sylvia and Arindrajit Dube, and Michael Reich. 2011. “Do Minimum Wages Really Reduce Teen Employment? Accounting for Heterogeneity and Selectivity in State Panel Data.” Industrial Relations 50(2):205-240.
Baum, Charles L. 2009. “The Effects of Vehicle Ownership on Employment.” Journal of Urban Economics 66: 151-163.
Belman, Dale and Paul J. Wolfson. 2014. What Does the Minimum Wage Do? Kalamazoo, MI: W.E. Upjohn Institute for Employment Research.
Bertrand, Marianne and Adair Morse. 2011. “Information Disclosure, Cognitive Biases, and Payday Borrowing.” The Journal of Finance 66: 1865–1893.
Bhutta, Neil. 2014. “Payday Loans and Consumer Financial Health.” Journal of Banking and Finance 47: 230-242.
Bhutta, Neil, Jacob Goldin, and Tatiana Homonoff. Forthcoming. “Consumer Borrowing after Payday Loan Bans.” Journal of Law and Economics.
Bhutta, Neil, Paige Marta Skiba, and Jeremy Tobacman. 2015. “Payday Loan Choices and Consequences.” Journal of Money, Credit and Banking 47(2-3): 223-260.
Bricker, Jesse, Lisa J. Dettling, Alice Henriques, Joanne W. Hsu, Kevin B. Moore, John Sabelhaus, Jeffrey Thompson, Richard Windle. 2014. “Changes in U.S. Family Finances from 2010 to 2013: Evidence from the Survey of Consumer Finances.” Federal Reserve Bulletin 100(4).
Card, David and Alan B. Krueger. 1995. Myth and Measurement: The New Economics of the Minimum Wage. Princeton, New Jersey: Princeton University Press
Carrell, Scott, and Jonathan Zinman. 2014. “In Harm's Way? Payday Loan Access and Military Personnel Performance.” Review of Financial Studies 27(9): 2805-2840.
Dobridge, Christine L. 2016. “For Better and for Worse? Effects of Access to High-Cost Consumer Credit.” Finance and Economics Discussion Series 2016-056.

29
Doucouliagos, Hristos and T.D. Stanley. 2009. “Publication Selection Bias in Minimum-Wage Research? A Meta-Regression Analysis.” British Journal of Industrial Relations 47(2): 406-428.
Dube, Arindrajit and T. William Lester and Michael Reich. 2010. “Minimum Wage Effects Across State Borders: Estimates Using Contiguous Counties.” The Review of Economics and Statistics 92(4): 945-964.
Herbert, Christopher E. and Daniel T. McCue and Rocio Sanchez-Moyano. 2013. “Is Homeownership still an effective means of building wealth for low-income and minority households? (Was it ever?)” Joint Center for Housing Studies of Harvard University Working Paper HBTL-06.
Hsu, Joanne W., David Matsa, and Brian Melzer. 2014. “Positive Externalities of Social Insurance: Unemployment Insurance and Consumer Credit.” NBER Working Paper No. 20353.
Lusardi, Annamaria and Carlo de Bassa Scheresberg. 2013. “Financial Literacy and High-Cost Borrowing in the United States.” NBER Working Paper no. 18969. http://www.nber.org/papers/w18969
Lusardi, Annamaria & Tufano, Peter. 2015. “Debt literacy, financial experiences, and overindebtedness.” Journal of Pension Economics and Finance 14(04):332-368.
Melzer, Brian T. 2011. “The Real Costs of Credit Access: Evidence from the Payday Lending Industry.” The Quarterly Journal of Economics 126: 517-555.
Neumark, David, J.M. Ian Salas, and William Wascher. 2014. “Revisiting the Minimum Wage-Employment Debate: Throwing Out the Baby with the Bathwater?” Industrial and Labor Relations Review 67(2.5):608-648.
Neumark, David and William Wascher. 2008. Minimum Wages. Cambridge: MIT Press.
Ru, Hong and Antoinette Schoar. 2016. “Do Credit Card Companies Screen for Behavioral Biases?” NBER Working Paper 22360.
Sahm, Claudia and Matthew D.Shapiro, and Joel Slemrod. 2010. “Household Response to the 2008 Tax Rebate: Survey Evidence and Aggregate Implications.” In Tax Policy and the Economy, Volume 24. Ed. Jeffrey R Brown. University of Chicago Press.

30
6. Tables and Figures
Figure 1: Credit Card Offers by Income Bracket in 2005, by State Type
Notes: Data source is Mintel Compremedia. Displayed are mean number of credit card offers in
each household income bracket for states with minimum wages above the federal minimum
wage or at or below the federal minimum wage.
31
Table 1: State Minimum Wage Legislation 2000-2014
State Year(s) Minimum Wage Increased (above Federal) AK 2003, 2010 AZ 2007, 2008, 2009, 2011, 2012, 2013 AR 2007 CA 2001, 2002, 2007, 2008 CO 2007, 2008, 2009, 2011, 2012, 2013 CT 2001, 2002, 2003, 2004, 2006, 2007, 2010 DE 2007, 2008 FL 2007, 2008, 2009 HI 2002, 2003, 2007 IL 2004, 2005, 2006, 2008, 2009, 2010, 2011 IA 2008 ME 2002, 2003, 2005, 2006, 2008, 2009, 2010 MD 2007 MA 2001, 2007, 2008 MI 2007, 2008, 2009 MO 2007, 2008, 2009, 2013 MT 2007, 2008, 2009, 2011, 2012, 2013 NV 2007, 2008, 2009, 2010, 2011 NH 2008, 2009 NJ 2006, 2007 NM 2008, 2009 NY 2005, 2006, 2007 NC 2007 OH 2007, 2008, 2009, 2011,2012, 2013 OR 2003, 2004, 2005, 2006, 2007, 2008, 2009, 2011, 2012, 2013 PA 2007, 2008 RI 2001, 2004, 2013 VT 2001, 2004, 2005, 2006, 2007, 2008, 2009, 2011, 2012, 2013 WA 2001, 2002, 2003, 2004, 2005, 2006, 2007, 2008, 2009, 2011, 2012, 2013 WV 2007, 2008, 2009 WI 2006, 2007 DC 2005, 2006, 2007, 2009, 2010
32
Table 2: Summary Statistics Mintel Data
Mean SD Number of Offers Credit cards 1.674 2.767 First Mortgage 0.066 0.379 Auto Loan 0.035 0.207 Other Unsecured Loan 0.147 0.511 Credit Card Offer Characteristics Mean Credit Limit 28974 32026 Max Credit Limit 34762 37007 Purchase APR 14.33 5.23 Default APR 27.27 3.63 Demographics High School Dropout 0.329 0.469 High School 0.413 0.492 Some College 0.166 0.372 Bachelors 0.075 0.263 Post Graduate 0.018 0.133 White (Non-Hispanic) 0.757 0.429 Black(Non-Hispanic) 0.111 0.315 Hispanic 0.136 0.343 Household Income 9655 4436
Notes: Source is Mintel Comperemedia. Sample is households identified as having income consistent with a minimum wage worker.
33
Table 3: Minimum Wages and Credit Offers Received
Credit Cards
Auto Loans
Other Unsecured Loans Mortgages
Ln(MinWage t-3)*Min Wage Household 1.8334*** 0.0001 0.1571*** 0.0775
(0.2546) (0.0090) (0.0324) (0.0961) Ln(MinWage t-3) -0.0142 0.0024 -0.0296 0.6050
(0.2052) (0.0149) (0.0479) (0.3805) MinWageHousehold -5.2130*** -0.0226 -0.3496*** -0.3272* (0.4368) (0.0262) (0.0551) (0.1601) N 445201 445201 445201 445201
Notes: Data source is Mintel Comperemedia. Displayed are coefficients and standard errors (in parentheses) obtained from estimating equation (1). Min Wage Household defined as reported income consistent with one or two minimum wage full time workers, as described in text. Controls include age-group, sex, race/ethnic group, education group, state, and year-month fixed effects and state-month unemployment rates. Standard errors adjusted to allow for clustering at state-level. *p=0.05, **p=0.01, ***p=0.001.
34
Table 4: Minimum Wages and Credit Card Offer Terms
Mean Credit
Limit Max Credit
Limit Purchase
APR Default
APR Ln(MinWage t-3)*Min Wage Household 14185.8*** 35123.1*** 2.162*** -1.186***
(1785.5) (3652.7) (0.3719) (0.2455) Ln(MinWage t-3) -1736.48 147.124 -0.4809* 0.18543
(1754.98) (2905.3) (0.1982) (0.2334) MinWageHousehold -28258.3*** -69501.7*** 0.3434 1.7560*** (3008.8) (6091.40) (0.6442) (0.4300) N 172522 172522 162213 116656
Notes: Data source is Mintel Compremedia. Displayed are coefficients and standard errors (in parentheses) obtained from estimating equation (1). Min Wage Household defined as reported income consistent with one or two minimum wage full time workers, as described in text. Controls include age-group, sex, race/ethnic group, education group, state, and year-month fixed effects, and state-month unemployment rates. Standard errors adjusted to allow for clustering at state-level. *p=0.05, **p=0.01, ***p=0.001.
35
Table 5: Summary Statistics for CCP/Equifax Data
Mean SD Number of Trades Credit Cards 1.79 2.10 Auto Loans 0.40 0.63 Mortgages 0.30 0.56 Delinquent (60 Days Past Due)* Any Loan 0.15 0.36 Credit Cards 0.16 0.37 Auto Loans 0.09 0.29 Mortgages 0.05 0.22 Total Balances* Credit Cards 4686.2 10173.9 Credit Card (Average Per Card) 1635.1 3447.5 Auto Loans 4850.3 10924.9 Mortgages 155125.6 157656.9 Payments* Credit Cards 247.8 5847.5 Credit Card (Average per Card) 90.7 2507.3 Auto Loans 163.9 704.7 Mortgages 1338.8 5581.2
Equifax Risk Score 645.4 106.0 Total Credit Card Limit 14819.3 24305.2 Average Credit Card Limit 4874.8 7823.5
Notes: Source is CCP/Equifax. Sample is borrowers on Census blocks where greater than 50 percent of population is high school dropout. *indicates conditional on having type of loan.
36
Table 6: Minimum Wages and Borrowing Behavior: Number of Loans by Type and Credit Card Limits
Credit Card Auto Mortgage Total CC Limit Average CC Limit Ln(MinWage t-
3) 0.1053*** 0.0432*** -0.0075 2366.69*** 496.21*** (0.0308) (0.0107) (0.0080) (380.667) (94.906) N 7165003 7165003 7165003 4389696 4389696 N (Individuals) 167671 167671 167671 134970 134970 Notes: Data source is CCP/Equifax. Displayed are coefficients and standard errors (in parentheses) obtained from estimating equation (2). Controls includes individual, age-group, state, and quarter fixed effects, demographic and economic characteristics of census-block-group, state-year unemployment rates. Sample is limited to individuals who have ever resided in Census block-group where more than 50 percent of population has less than a high school degree. Standard errors adjusted to allow for clustering at person-level. *p=0.05, **p=0.01, ***p=0.001.
37
Table 7: Short and Medium Run Payment Behavior
Delinquency by Type of Debt Credit Score Delinquent? Credit Card Auto Loan Mortgage
Short Run Ln(Min Waget-3) 8.141*** -0.0537*** -0.014 -0.0039 -0.016 (1.3248) (0.0067) (0.0188) (0.0101) (0.0085) N 5849519 7165003 697107 2138400 1475884 N (Individuals) 160238 167671 36452 93881 51375 Medium Run, No New Trades Ln(Min Wage t-12) 0.6113 -0.0316*** -0.0296 0.0002 0.0157 (1.5045) (0.0084) (0.0203) (0.0114) (0.0087) N N (Individuals)
Medium Run, New Trades Ln(Min Wage t-12) 5.9534*** -0.0371*** -0.043 0.0419** 0.0063 (1.2483) (0.0066) (0.0267) (0.0145) (0.0169) N 5523350 6589111 241855 571190 248159 N (Individuals) 154231 167668 32874 87642 47321 Notes: Data Source is CCP/Equifax. Displayed are coefficients and standard errors (in parentheses) obtained from estimating equation (2). Controls includes individual, age-group, state, and quarter fixed effects, demographic and economic characteristics of census-block-group, state-year unemployment rates. Sample is limited to individuals who have ever resided in Census block-group where more than 50 percent of population has less than a high school degree. Standard errors adjusted to allow for clustering at person-level. *p=0.05, **p=0.01, ***p=0.001.
38
Table 8: Minimum Wages and Borrowing and Payment Behavior for Highly-skilled Borrowers
Credit Cards
Auto Loans Mortgages
Total CC Limit
Average CC Limit
Ln(MinWaget-3) -0.0148 -0.0307** -0.0349** 584.33 55.57 (0.0363) (0.0117) (0.0120) (630.76) (183.62)
N 3555612 3555612 3555612 3118781 3118781 N (Individuals) 71798 71798 71798 69090 69090
Short Run Delinquency by Type of Debt
Credit Score Delinquent?
Credit Card Auto Loan Mortgage
Ln(MinWaget-3) 0.4609 -0.0006 -0.0013 0.0055 0.0021 (1.2400) (0.0042) (0.0040) (0.0047) (0.0032)
N 2971319 3555612 3118781 912426 1355418 N (Individuals) 70740 71798 69090 41205 39975 Medium Run Delinquency by Type of Debt
Credit Score Delinquent?
Credit Card Auto Loan Mortgage
Ln(MinWaget-
12) 1.4004 -0.0042 -0.0045 0.0004 0.0025 (1.0851) (0.0040) (0.0038) (0.0045) (0.0031)
N 2885571 3340690 2948408 883202 1308091 N (Individuals) 69308 71795 68786 40720 39696
Notes: Data Source is CCP/Equifax. Displayed are coefficients and standard errors (in parentheses) obtained from estimating equation (2). Controls includes individual, age-group, state, and quarter fixed effects, demographic and economic characteristics of census-block-group, state-year unemployment rates. Sample is limited to individuals who have ever resided in Census block-group where more than 75 percent of population has a Bachelor’s degree or more. Standard errors adjusted to allow for clustering at person-level. *p=0.05, **p=0.01, ***p=0.001
39
Table 9: Minimum Wages and Use of Alternative Financial Services
Took out a Payday Loan
Sold Items at Pawn Shop
Rented Items at a Rent-to-Own Store
Ln(MinWage t-12)*Min Wage Household -.06558** -0.0459 -.04973*
(0.0226) (0.0308) (0.0198) Ln(MinWage t-12) -0.0130 0.0175 -0.0159
(0.0184) (0.0117) (0.0119) MinWageHousehold .1368** 0.1009 .10475* (0.0455) (0.0620) (0.0394) N 123856 123856 123856
Notes: Data source is Current Population Survey Unbanked/Underbanked Supplements, 2009, 2011 and 2013. Displayed are coefficients and standard errors (in parentheses) obtained from estimating equation (3). Min Wage Household defined as total family income divided by total family hours worked consistent with the minimum wages, as described in text. Controls include age-group, sex, race/ethnic group, education group, and state fixed effects and state-month unemployment rates. Standard errors adjusted to allow for clustering at state-level. *p=0.05, **p=0.01, ***p=0.001.

40
The appendix to this paper can be found at: www.umich.edu/~jwhsu/dettling_hsu_minwage_credit_appendix.pdf