Embed Size (px)
Citation preview
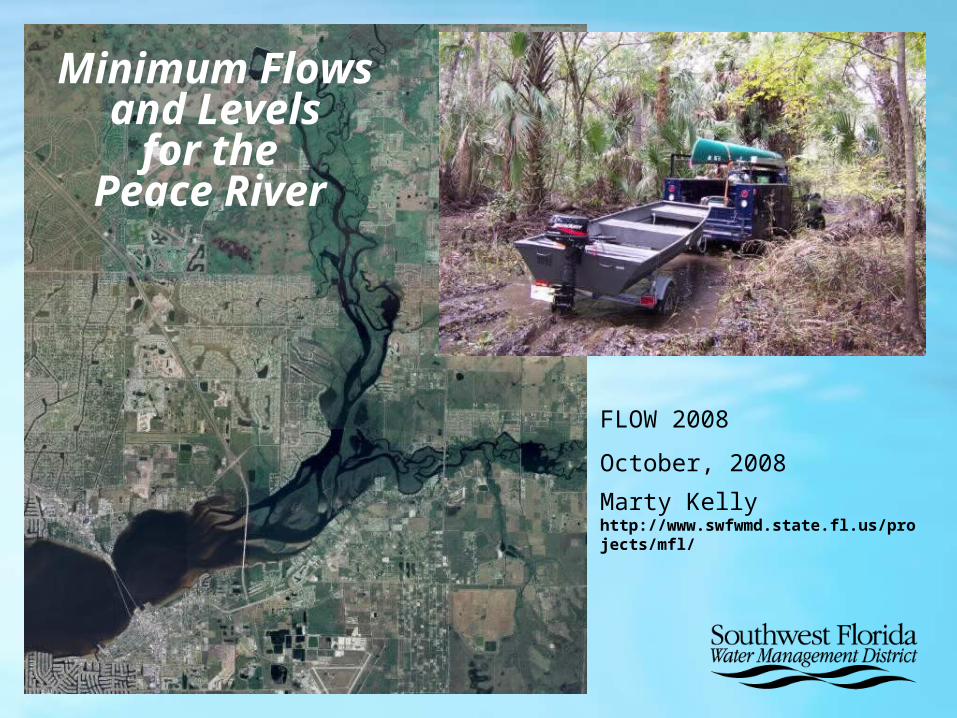
Minimum Flows and
Levels for the
Peace River
FLOW 2008
October, 2008
Marty Kelly http://www.swfwmd.state.fl.us/projects/mfl/

The Issues that Led to the Instream flows Process/Studies
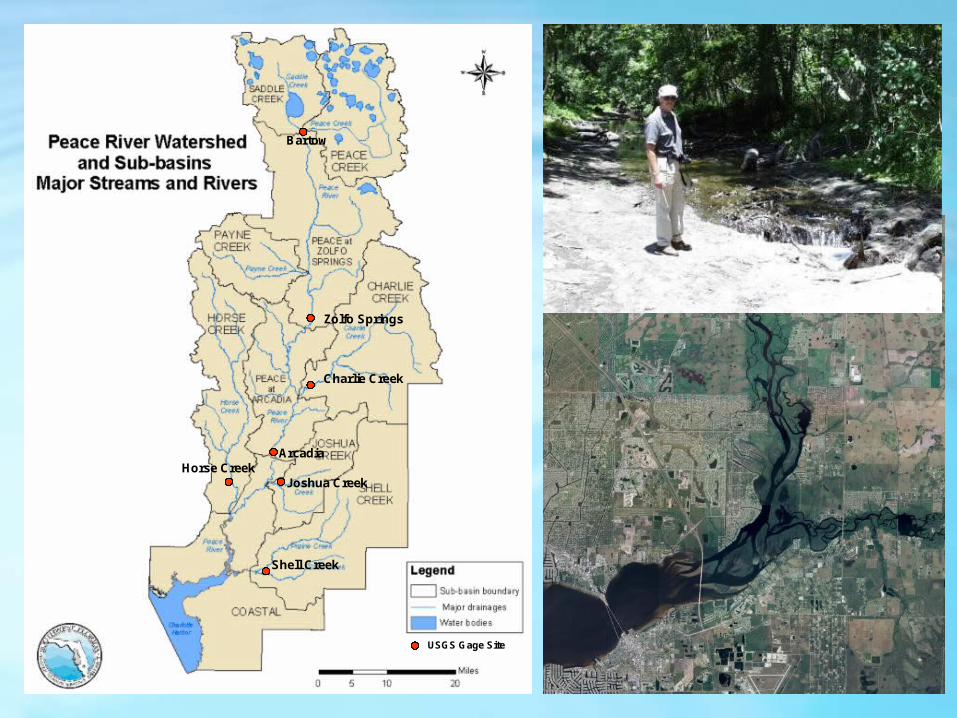
Shell Creek
Joshua Creek
ArcadiaHorse Creek
Charlie Creek
Zolfo Springs
Bartow
USGS Gage Site

Minimum Flows and Levels - Florida Statutes, Section 373.042 -
The minimum flow for a given watercourse shall be the limit at which further withdrawals would be significantly harmful to the water resources or ecology of the area
The Policy Context

The Science Done
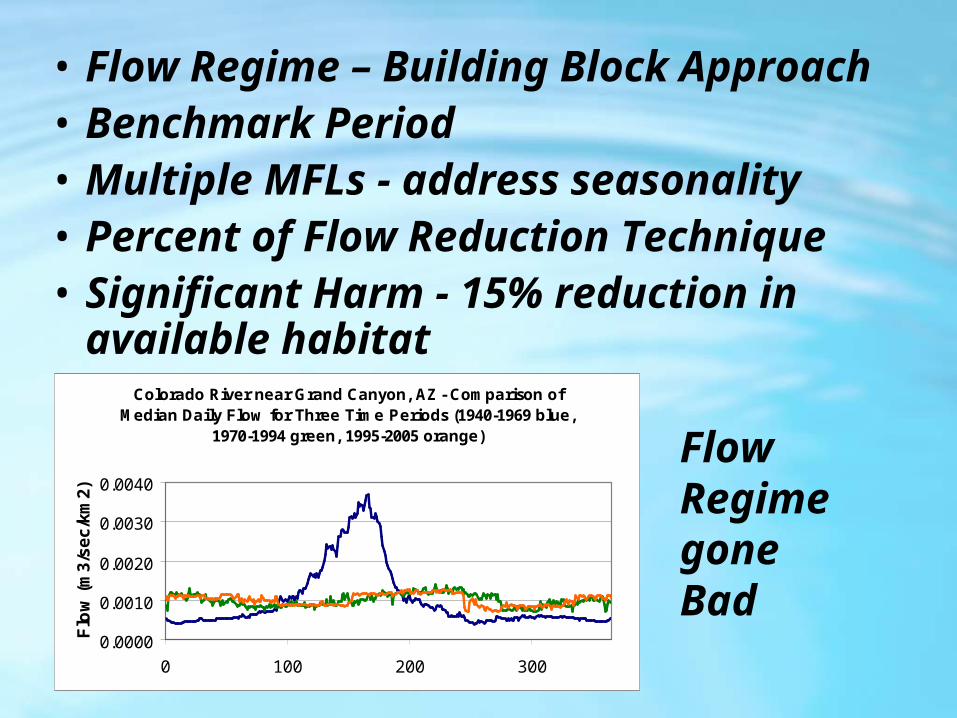
• Flow Regime – Building Block Approach• Benchmark Period • Multiple MFLs - address seasonality• Percent of Flow Reduction Technique• Significant Harm - 15% reduction in
available habitat
Colorado River near Grand Canyon, AZ - Comparison of Median Daily Flow for Three Time Periods (1940-1969 blue,
1970-1994 green, 1995-2005 orange)
0.0000
0.0010
0.0020
0.0030
0.0040
0 100 200 300
Flo
w (
m3
/se
c/k
m2
)
Flow Regime gone Bad
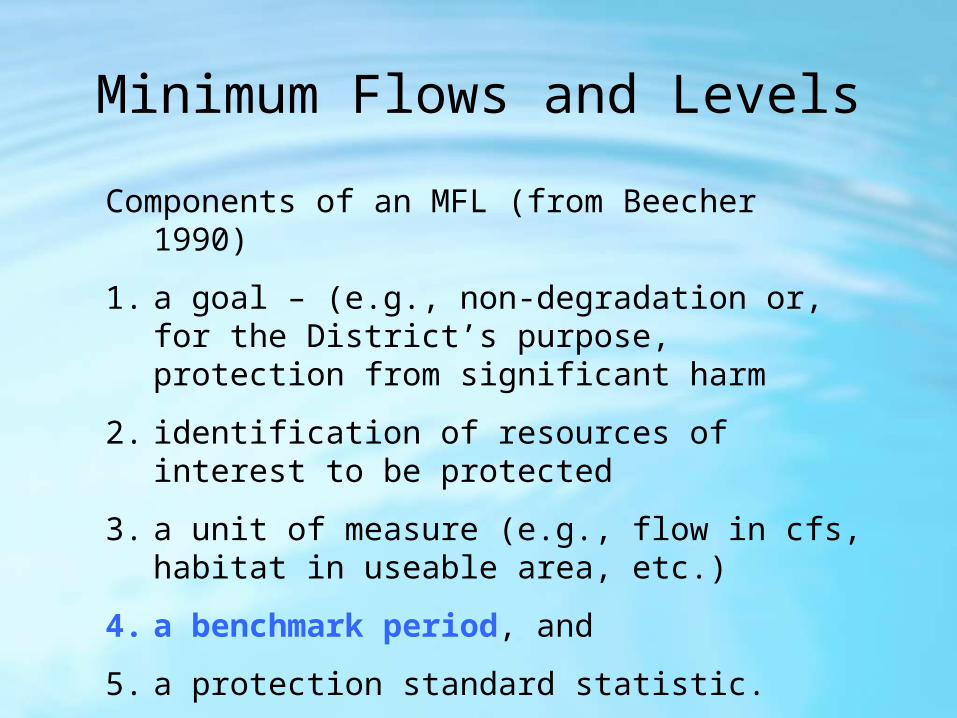
Minimum Flows and Levels
Components of an MFL (from Beecher 1990)
1. a goal – (e.g., non-degradation or, for the District’s purpose, protection from significant harm
2. identification of resources of interest to be protected
3. a unit of measure (e.g., flow in cfs, habitat in useable area, etc.)
4. a benchmark period, and
5. a protection standard statistic.
Peace River at Arcadia - Comparison of Median Daily Flow for Peace River at Arcadia, FL for Three Time Periods (1940-1969 blue, 1970-
1994 green, 1995-2005 orange)
0
20
40
60
80
100
0 50 100 150 200 250 300 350
Flo
w (
m3/
sec)
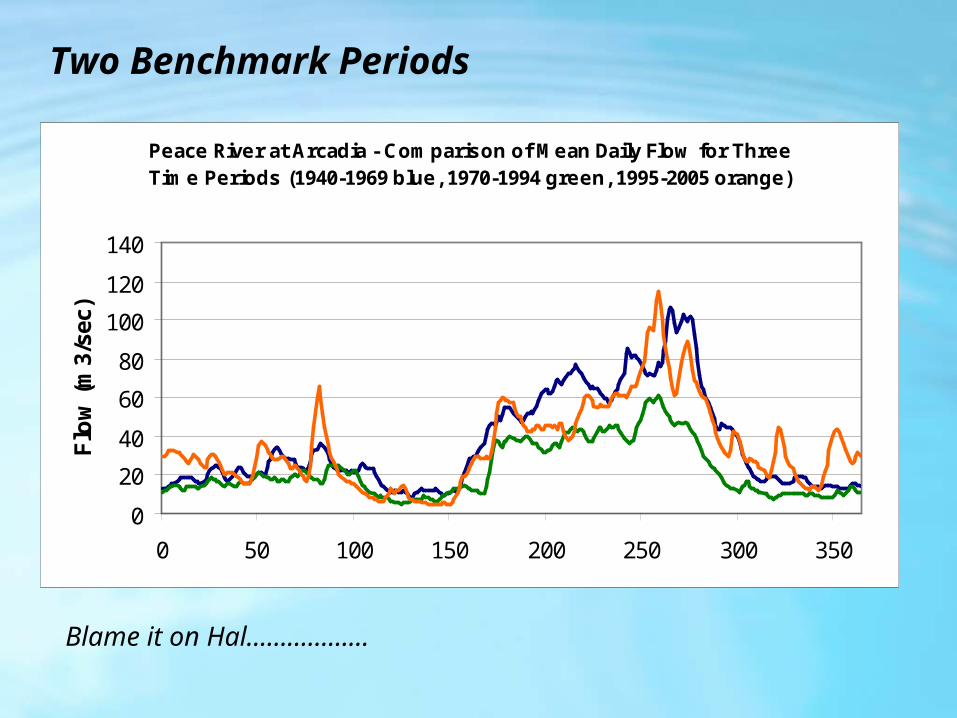
Two Benchmark Periods
Blame it on Hal………………
Peace River at Arcadia - Comparison of Mean Daily Flow for Three Time Periods (1940-1969 blue, 1970-1994 green, 1995-2005 orange)
0
20
40
60
80
100
120
140
0 50 100 150 200 250 300 350
Flo
w (
m3/
sec)

In their peer review report on the Upper Peace River, Gore et al. (2002) stated,
“in general, instream flow analysts consider a loss of more than 15% habitat, as compared to undisturbed or current conditions, to be a significant impact on that population or assemblage."
15%

Low Flow Threshold - Wetted PerimeterUsed for All Blocks

Low Flow Threshold - Fish PassageUsed for All Blocks

Physical Habitat Simulation SystemUsed for Blocks 1 and 2
• Depth• Velocity• Substrate

FloodplainFloodplain
SnagsSnags
Exposed Exposed RootsRoots
Long-Term Inundation AnalysisUsed for Blocks 2 and 3

The PreliminaryResults
Flow Prescription – Percent of Flow and Seasonality (middle Peace River at Arcadia)
0
400
800
1200
1600
2000
0 50 100 150 200 250 300 350
Flo
w (
cfs)
10%
8%
13%
18%
LFT = 67 cfs
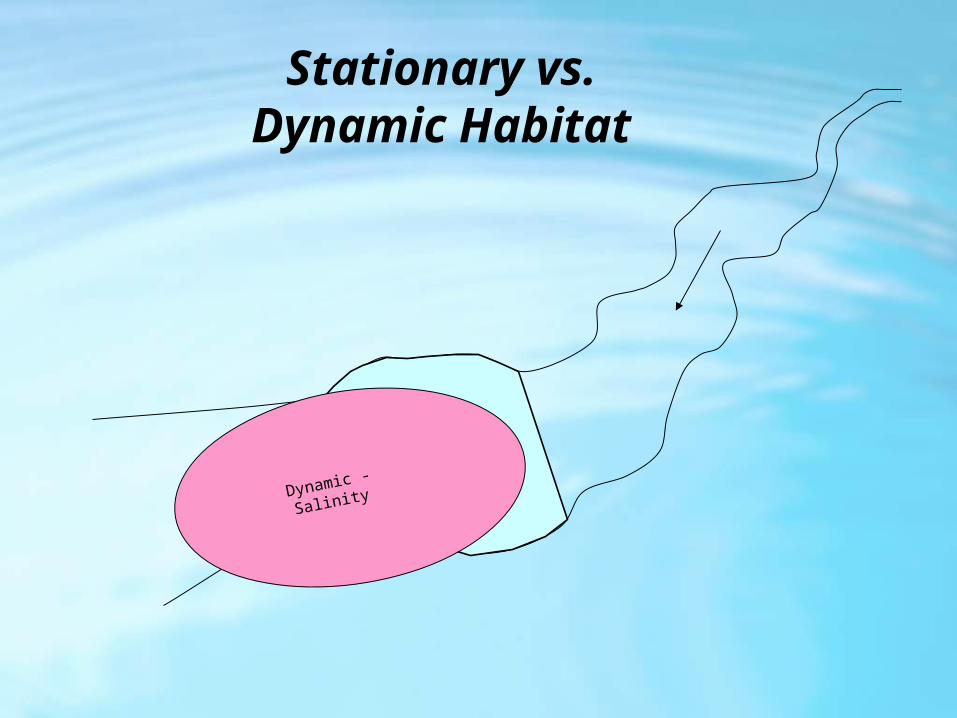
Stationary vs. Dynamic Habitat
Stationary
Dynamic - Salinity

• The volume of water in the system less than a given salinity – e.g. available fish habitat in given salinity zone
• The bottom area in the system less than a given salinity – e.g. benthic invertebrate habitat
• The shoreline length in the system less than a given salinity – e.g. amount of shoreline vegetation
Establishment of an MFL requires identification of a critical biologically-relevant variable that can be defensibly and quantitatively related to variation in freshwater flows.
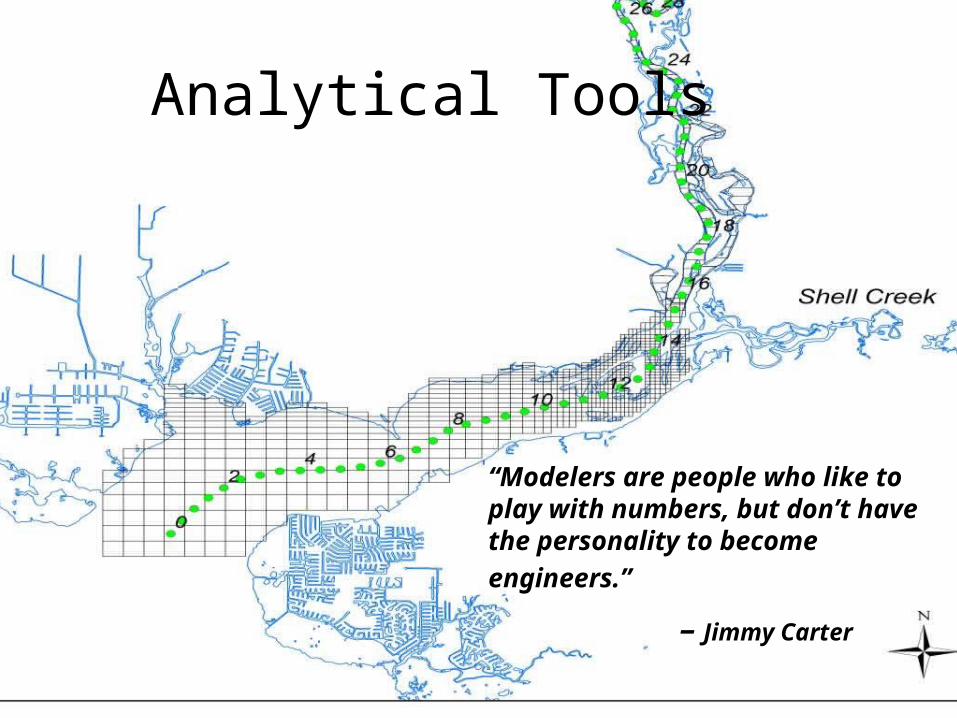
Analytical Tools
“Modelers are people who like to play with numbers, but don’t have the personality to become
engineers.”
– Jimmy Carter
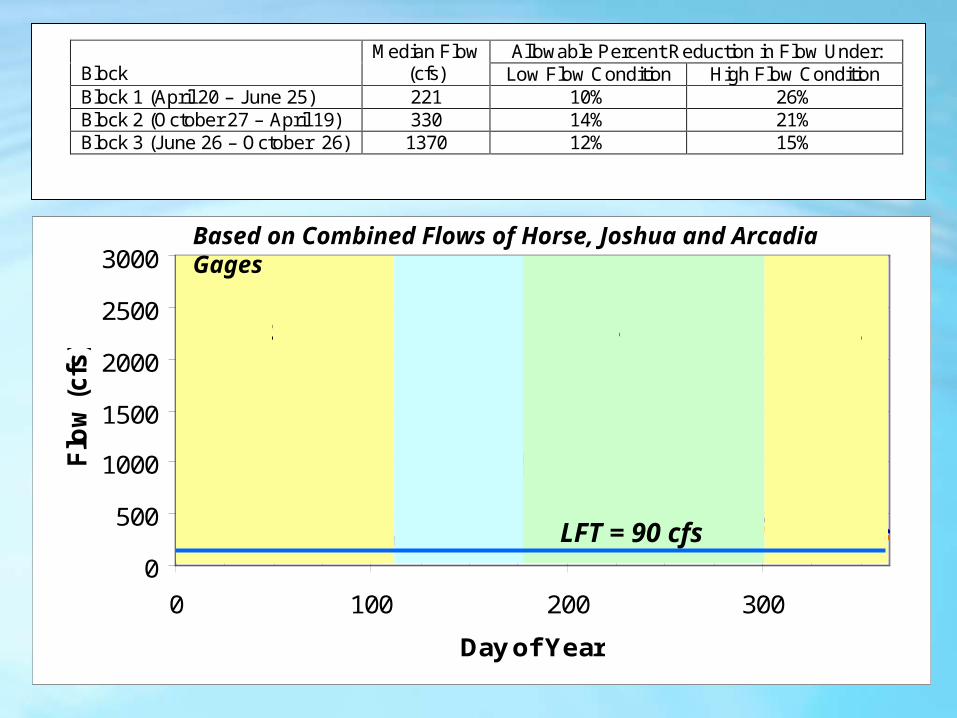
Allowable Percent Reduction in Flow Under: Block
Median Flow (cfs) Low Flow Condition High Flow Condition
Block 1 (April 20 – June 25) 221 10% 26% Block 2 (October 27 – April 19) 330 14% 21% Block 3 (June 26 – October 26) 1370 12% 15%
0
500
1000
1500
2000
2500
3000
0 100 200 300
Day of Year
Flo
w (
cfs
)
Block 1 Block 2Block 2 Block 3
LFT = 90 cfs
Based on Combined Flows of Horse, Joshua and Arcadia Gages

The Public Dialogue• MFL Priority List and Schedule – Annual Update• Proposed MFL – Report for Peer Review and Public
Dissemination• Public Meetings • Waterbody Advocates and TAC’s and NEP’s• Peer Review Report• Staff Response• (Recovery Strategy) $$$$$• Rule Development• Rule Adoption• The Role of the Governing Board
Recommendations for Others /
Lessons Learned
• Legislative mandate has greatly facilitated process
• ad valorem taxing authority of WMDs
• Peer review process
• Recovery
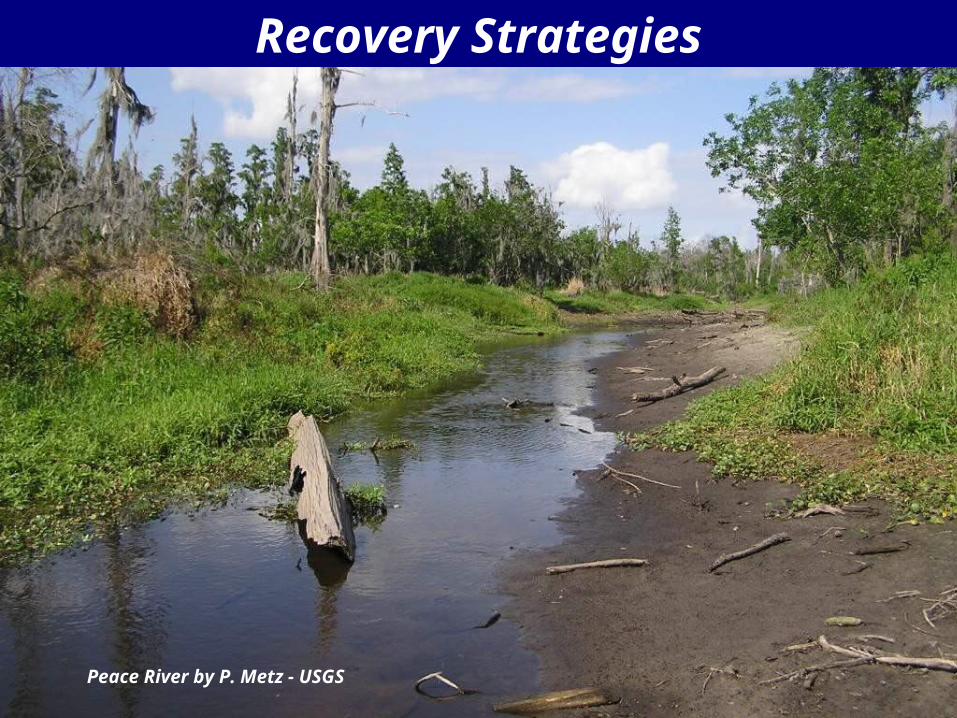
Peace River by P. Metz - USGS
Recovery Strategies

Questions
Photo: Richard Gant – Silver River 2007 Florida photographic collection