Embed Size (px)
Citation preview

MinimizingFuselage Drag
BY BRUCE CARMICHAEL
INTRODUCTION
Now that wing designs are avail-able with less than half theprofile drag coefficient of the
old favorite 23015 (Ref. 1), the fuse-lage drag of even a relatively cleanairplane looms very large. The aircraftdesigner finds considerably less dragdata for fuselages than are available forwings. This lack is true for bodies hav-ing completely turbulent boundarylayers and even more so for those hav-ing partial laminar flow. The reasonfor the latter is that the most popularaircraft configurations have a multi-tude of boundary layer trippers on thefront end including the tractor pro-peller. The subject of partially laminarfuselages has thus been considered bymany to be academic. This article pre-sents theory and experimental resultsfor both fully turbulent bodies and ex-tensively laminar bodies. A typicalfuselage drag minimization study is in-cluded. The practical problems ofachieving extensive fuselage drag re-ductions in practice are covered andthe present state of achievement on ac-tual aircraft is mentioned. Finally, aperformance estimate for an extremeapplication of fuselage drag reductionis presented.
FUSELAGE DRAG MINI-MIZATION CONCEPTS
Total minimization by eliminationof the fuselage, while perhaps of inter-est for gigantic thick wing, span loader,cargo or passenger craft, is not practi-cal for the modest sized mannedaircraft of interest to us. Useful dragreduction concepts include:
1. Reduce fuselage surface areawith pod and boom designs.
2. Use lowest possible pod, length todiameter ratio, to reduce the ratio of wet-64 AUGUST 1996
ted area to the controlling frontal area.3. Where practical, encourage ex-
tensive laminar boundary layer flow.Concept (1) and (2) will be shown topromote (3).
4. Fuselage shaping in the vicinityof the wing trailing edge may possiblyreduce fuselage pressure drag.
FORMULAS
Minimizing fuselage drag meansminimizing the drag area which is theproduct of the drag coefficient and thearea on which it is based. Calculationusing the theory charts involves theproduct of the wetted area drag coeffi-cient and the wetted area. Mostdesigners favor presenting the result asproduct of frontal area drag coefficientand front area. The Young theory (Ref.2) gives wetted area drag coefficient asa function of:
S = Wetted Area in sq. ft.S = Frontal Area in sq. ft.1 = Length in ft.d = Effective Diameter in ft.Body length/diameter, length
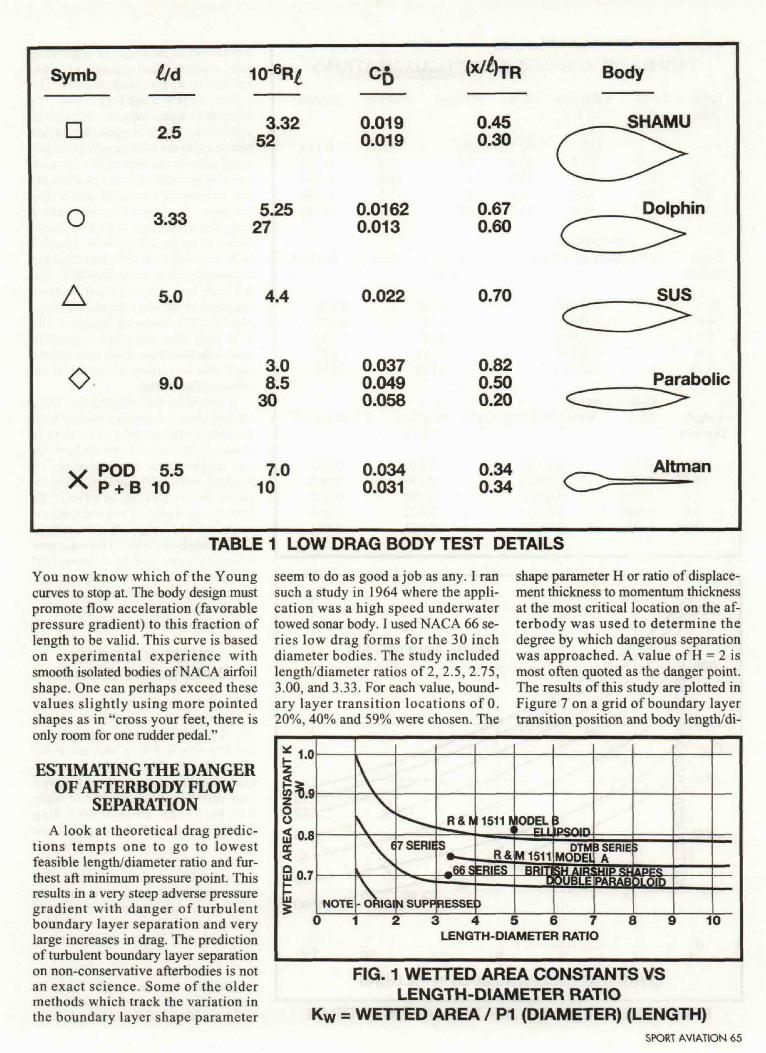
Reynolds number and fraction oflength laminar. The wetted area can beestimated from the formula and Figure1. Length RN = 9354 x speed in mph xlength in ft.
Kw = Wetted Area CoefficientCw = Wetted Area Drag Coefficient05 = Frontal Area Drag. CoefficientDA = Drag Area = CWS = C&S
THEORETICALFUSELAGE DRAG
The drag of a smooth, streamlinedisolated fuselage can be rapidly esti-mated by use of the charts of Young(Ref. 2). These charts are reproducedhere as Figures 2 and 3 for the case oflength/diameter = 3.33 typical of apod/boom design, and 6.67 typical of a
conventional fuselage. One enters onthe horizontal scale, projects verticallyupward to the percent of length as-sumed laminar line, then horizontallyacross to the wetted area coefficient onthe vertical scale. Note the very largedrag coefficient reduction as transitionmoves aft from the nose to 60% oflength. You will note that the wettedarea coefficients for a given length RNand transition location are lower forthe higher length/diameter case. How-ever, later in our illustrative exampleyou will find that the drag area or prod-uct of the wetted area coefficient andwetted area will be lower for the lowlength/diameter case as will the frontalarea drag coefficient. It is the drag areathat must be reduced. By the way, thelength RN for standard sea level condi-tions can be calculated as 9354 x speedin mph x body length in ft. Anotherlook at the magnitude of possible dragreductions is given in Figures 4 and 5for 1/d of 3.33 and 6.67 in the form ofratio of drag with partial laminar flowdivided by the drag for complete turbu-lent flow vs. the transition location.Curves are presented for length RN of1,10 and 100 million. It is possible tocut the drag more than in half.
ESTIMATING POSSIBLEEXTENT OF LAMINAR
FLOW-IDEAL CASE
The boundary layer transition loca-tion for the ideal case of amplificationof infinitesimal disturbances can be es-timated by a complex computationalmethod not available to many design-ers. I have presented my best guess forisolated smooth bodies in terms of themaximum transition length RN as afunction of the length/diameter ratio(Figure 6). Dividing the transitionlength RN by the length RN then givesthe fraction of length ideally laminar.
Symb i/d 10'6R^
r~i o K 3.32U 2.5 52
O 3.33 g5/25
A 5.0 4.4
^ 3.0</ 9.0 8.5
30
. . - • . • s '
v POD 5.5 7.0A p + B 10 10
CD
0.0190.019
0.01620.013
0.022
0.0370.0490.058
0.0340.031
(X/OTR
0.450.30
0.670.60
0.70
0.820.500.20
0.340.34
Body
C5-"DolDhin
(^ ^>>
sus
Parabolic
^ _ ^ Altman
TABLE 1 LOW DRAG BODY TEST DETAILS
You now know which of the Youngcurves to stop at. The body design mustpromote flow acceleration (favorablepressure gradient) to this fraction oflength to be valid. This curve is basedon experimental experience withsmooth isolated bodies of NACA airfoilshape. One can perhaps exceed thesevalues slightly using more pointedshapes as in "cross your feet, there isonly room for one rudder pedal."
ESTIMATING THE DANGEROF AFTERBODY FLOW
SEPARATIONA look at theoretical drag predic-
tions tempts one to go to lowestfeasible length/diameter ratio and fur-thest aft minimum pressure point. Thisresults in a very steep adverse pressuregradient with danger of turbulentboundary layer separation and verylarge increases in drag. The predictionof turbulent boundary layer separationon non-conservative afterbodies is notan exact science. Some of the oldermethods which track the variation inthe boundary layer shape parameter
seem to do as good a job as any. I ransuch a study in 1964 where the appli-cation was a high speed underwatertowed sonar body. I used NACA 66 se-ries low drag forms for the 30 inchdiameter bodies. The study includedlength/diameter ratios of 2, 2.5, 2.75,3.00, and 3.33. For each value, bound-ary layer transition locations of 0.20%, 40% and 59% were chosen. The
shape parameter H or ratio of displace-ment thickness to momentum thicknessat the most critical location on the af-terbody was used to determine thedegree by which dangerous separationwas approached. A value of H = 2 ismost often quoted as the danger point.The results of this study are plotted inFigure 7 on a grid of boundary layertransition position and body length/di-
3 4 5 6 7LENGTH-DIAMETER RATIO
8 9 10
FIG. 1 WETTED AREA CONSTANTS VSLENGTH-DIAMETER RATIO
Kw = WETTED AREA / P1 (DIAMETER) (LENGTH)SPORT AVIATION 65

TABLE 2 DRAG MINIMIZATION CALCULATIONSLengthDiam.
106.675.04.03.33
Length Wetted Area KT6R,ft.
2516.6812.510.08.33
sq-ft-
137 5091.7 33.468.7 25.055.0 20.045.8 16.7
10-6R60o/0 10-6Rtrans_ ,
3020151210
5.79.3
12.615.518.0
X/L trans.
0.1140.2780.5040.6000.600
100%TurbuentLength
Diameter
106.675.04.03.33
LengthDiameter
106.675.04.03.33
Wetted Area Drag Coefficient
PartiallyX/Ltr.
0.1140.2780.5040.6000.600
0.002540.002800.003050.003350.00372
Drag Area FrontalSq Ft.
0.3480.2570.2100.1840.170
Area Drag Coeff.
0.0710.0520.0430.0370.035
Laminar '""* 'Wetted Area Drag.
0.00226:;"""* 0.00257
"""" 0.001550.00131
"••••-- 0.00137
Coeff. Drag Area F.A. Drag Coeff.Sq. Ft.
0.3100.2360.1070.0720.063
0.0630.0480.0220.0150.013
.006
.005
1 2 5 1 0 2 0 5 0
LENGTH REYNOLDS NUMBER IN MILLIONS
100
FIG 2 STREAMLINED BODY THEORETICAL DRAG66 AUGUST 1996
ameter ratio. Boundaries separatingsafe, marginal, and separated regionsare shown by the hatched lines. Thefurther aft that transition occurs, thelower the length/diameter ratio free ofseparation. This is because the thickerboundary layers with transition far for-ward cannot surmount the adversepressure gradient as easily as when thepressure recovery is stated with a thin-ner layer. The length/diameter ratio 2body was separated even when transi-tion was as far aft as 59%. The 2.5body was safe with 59% transition butseparated with transition at 40%. The3.0 body was safe at 59% transition,marginal at 40% transition, and sepa-rated at 20% transition location. The3.33 body was safe from separationeven with transition at the nose and wewere able to confirm this point on theexperimental model.
It should be remembered that thesestudies were for isolated bodies withno wings intersecting. The data isshown to provide a limit on how farone might go in combinations oflength/diameter ratio and transition lo-cation. Great care must be taken in theintersection region of low fineness ra-tio bodies and wings. This is a criticalarea in sailplane design. There are nowcomputational methods powerfulenough to explore such configurations.It would be well to search out thosepeople operating such programs if aserious design is considered.
FUSELAGE DRAGEXPERIMENTAL DATA
'f_
I had the good fortune to carry outperformance measurements on severallow drag bodies in low turbulencewind tunnels, in a deep lake, and in theocean (Ref. 3). These bodies were sta-bilized with boom mounted fins andwere driven by either positive or nega-tive buoyancy. Frontal area dragcoefficients, presented in Figure 8, areplotted vs. the body length/diameterratio and are compared to a similarcurve for fully turbulent bodies. Thethree underwater part ial ly laminarbodies are supplemented with data Iobtained in flight test on a body with alarge value of length/diameter ratio,and also some data on pod boomsailplane body models. The bodylength/diameter ratio, length Reynoldsnumber, frontal area drag coefficientand transition locations are given in

Table 1.Designers are accustomed to frontal
area drag coefficients of 0.07 forsmooth but fully turbulent bodies withlength/diameter ratio of 6.5 as shownon the upper curve. With a length/di-ameter ratio of 3.33 and extensivelaminar flow, a frontal area drag coef-ficient as low as 0.013 has beenmeasured or only 19% of the coeffi-cient for a conventional turbulent flowfuselage! Note that for a long slenderbody with a length/diameter of 9, theextent of laminar flow decreases andthe drag coefficient increases rapidlywith increasing Reynolds number dueto the very limited favorable pressuregradient. At a length Reynolds numberof 3 million, laminar flow extends to82% with a drag coefficient of 0.037while at a length Reynolds number of30 million, laminar flow extends toonly 20% with drag coefficient of0.058. Low fineness ratio yieldsstronger favorable pressure gradientand retains extensive laminar flow tohigher Reynolds number.
While working with Dr. MaxKramer and designer Bill Knoll, I madethe breakthrough experiment in 1961with the Dolphin research vehicleshown in Figure 9. The long slenderbodies had been tested in the mid-1950s with disappointing results at thehigher Reynolds numbers. Our fatbody tests provide encouragement forcertain extensively laminar fuselagesin the Reynolds number range applica-ble to aircraft.
A SPECIFIC BODY DRAGMINIMIZATION STUDYStudy the effect of body length/di-
ameter ratio on the drag of an isolatedsingle person fuselage of 2 foot widthand 3 foot height. This is representa-tive of single place sailplanes, racingplanes and fast sportplanes. Equivalentdiameter is 2.5 feet and frontal area is4.91 sq. ft. Assume NACA 66 seriesform with a wetted area constant of0.7. Let speed at sea level be 214 mphwhich gives a unit Reynolds number of2 million per foot. Compute the frontalarea drag coefficients and drag area forfully turbulent and partially laminarcases. The body design limits the max-imum extent of laminar flow to 60%which is the minimum pressure pointbut laminar extent may be less at thehigher Reynolds number. We will use
.006
.005s-
1 2 5 1 0 2 0 5 0LENGTH REYNOLDS NUMBER IN MILLIONS
100
FIG 3 STREAMLINED BODY THEORETICAL DRAG
my empirical curve ofFigure 6 to define themaximum transit ionlength Reynolds num-ber for each bodylength/diameter ratio.
The procedure is tocalculate the length,wetted area, lengthReynolds number foreach case. Maximumtransition length Rey-nolds number fromFigure 6 is divided bythe length Reynoldsnumber to get the frac-tion of body lengthlaminar. The wetted areadrag coefficients are ob-tained at the propercombination of length/diameter, length Rey-nolds number, and frac-tion of body length laminar. These aremultiplied by the wetted area to obtainthe drag area. The drag area divided bythe frontal area gives the frontal areadrag coefficient (see Table 2).
Frontal area drag coefficients areplotted vs. length/diameter ratio in Fig-ure 10 and the drag area is plotted inFigure 11. Fully turbulent body values
1.0
0.9
0.8
0.7
0.6
0.5
0.4
0.3
0.2
TRAN
PARTIALFULLY T
^^\\
LAMINAIIRBULEIi
————
LEW
i1
DRAGT DRAG
ITH /I
=-tS
h\100\
\
DIAM!
46THINM
\^\
TERI
REYNLLIOt
sK\
iATIO = 3.33
DbOS NUMBERIS
' ,'i
) 0.1 0.2 0.3 0.4 0.5 0.6SITION LOCATION IN FRACTION OF BODY LENGTH
FIG 4 REDUCTION IN BODY DRAGDUE TO LAMINAR FLOW
decease l inearly with decreasinglength/diameter ratio. At highlength/diameter , due to the higherReynolds number, the decease in dragdue to partial laminar flow is modest.Below a value of 6 the reduction in-creases rapidly as we get into the rangewhere larger laminar length percent-ages are possible. Comparing a low
SPORT AVIATION 67

1.0
0.9
0.8
0.7
0.6
0.5
0.4
0.3
0.2C
IRAN
N
PARTIALFULLY Tt
^Svs
LAMINAFRBULEN
LENC
^\
DRAG'DRAG
TH/[
^\>100.
)IAME
LENC\NU
>
\
\
TERF
ITH RMBEF
\1
\\
ATIO = 6.67
EYNOLDS1 IN MILLIONS
„««••
'• C
) 0.1 0.2 0.3 0.4 0.5 0.6SITION LOCATION IN FRACTION OF BODY LENGTH
TRAN
SITI
ON
LEN
GTH
REY
NOLD
S NU
MBE
R IN
MIL
LIO
NS
o
o
S
8
g
S
I
\\V.
^^^-^^
3 2 4 6 8 10BODY LENGTH TO DIAMETER RATIO
FIG 5 REDUCTION IN BODY DRAG DUETO LAMINAR FLOW
FIG 6 EMPIRICAL ESTIMATION OF MAXI-MUM TRANSITION LENGTH RN FOR
NATURAL LAMINAR FLOW BODIES ASFUNCTION OF LENGTH / DIAMETER
drag pod design with a length/diameterof 3.33 having extensive laminar flow,with a conventional fully turbulentfuselage with length/diameter ratio of6.5, we find the drag area of the lowdrag case to be only a quarter of thedrag area of the conventional design.The pod design will require a boom tosupport the tail surfaces. This wouldincrease pod drag by 10% for a slenderboom up to 25% for a thicker boom.With wing designs available with one-third the drag of conventional turbulentflow wings, the next step will be tocombine such wings with fuselage de-signs having the same small fraction ofconventional fuselage drag. While thisis not easy, it is possible. Compositeconstruction as in the wing case solvesmany of the problems.
LAMINAR FUSELAGE DE-SIGN REQUIREMENTS
To obtain extensive laminar flow onthe forward fuselage we must first re-move the propeller from the nose. Eventhough NASA has reported (Ref. 4)that the flow behind the propeller maybe less turbulent than previously be-lieved due to the periodic nature of theprop wake, no comparative drag datahas been shown with and without pro-peller. It is extremely difficult to mountan engine and propeller in the aft pod68 AUGUST 1996
without extension shaft and retain lowpod drag and good propulsion effi-ciency. Alex Strojnik built a very lowdrag airframe with such an arrange-ment (Ref. 6) and was verydisappointed in the achieved speed.The most successful pusher aircraft interms of propulsive efficiency havebeen those with the propeller behindthe tail. Molt Taylor worked out themechanical problems (Ref. 7) and EdLesher flew such a configuration, theTeal, to many world speed at rangerecords (Ref. 8).
With the major disturbance out ofthe way, we must now avoid thesmaller ones. Composite constructioncan achieve surfaces free from wavi-ness to a ratio of wave height to wavelength of one part in a thousand andsurface roughness to 10 microinchlevel. This is adequate for a small 300mph airplane. There can be no protu-berances, air leaks, gaps, grooves orsteps in the forward fuselage. Thefuselage back to the minimum pressurepoint slightly aft of the maximum crosssection must be made a single unit .This can slide forward on tracks for pi-lot entry and exit. This was proposedin my articles in Sport Aviation in Au-gust and September 1976 (Ref. 8).Cockpit ventilation should probablynot be attempted with an opening atthe nose. The air source should be
placed where less laminar surface areais affected.
A:'--' :• ' • • . I
OPERATIONALCONSIDERATIONS
Just as work is the curse of the drink-ing people, so insects are the curse oflaminar aircraft. Most insect impinge-ments will, especially at high speed atlow altitude, trigger a turbulent wedgewith an included angle of 14 to 20 de-grees. They sometime erode with timeand at very high altitude can becomesubcritical and laminar flow can be re-stored. The sailplane people havedeveloped a bug wiper stowed at thewing root which is driven out along thespan by a vane and then reeled back inwith a wire. It actually clears off thebugs and restores laminar flow. Such adevice would be hard to develop for thefuselage nose. Some success has beenfound with liquid sprays to prevent bugadhesion until one climbs above the buglevel. A disposable paper cover has beenfound workable on wing leading edgesif you do not get arrested for littering,but once again harder to work out for thefuselage nose. The best way to have alaminar flight is to take off in earlymorning before the bugs get up. Occa-sionally at high altitude one encountersice crystals which, tumbling in theboundary layer, shed eddies which cause

DIAMETER = 30 INCHESZERO ANGLE OF ATTACKNUMBERS REFER TO BOUNDARY LAYER SHAPE PARAMETERAT MOST CRITICAL SPOT ON AFTERBODY
0.7
g 0.6
3 0.5
0.4
0.3
§0.1
2.0 2.2 2.4 2.6 2.8LENGTH / DIAMETER
3.0 3.2 3.4
0.10
0.08
0.06Drag _.
a ~ °qS0.04
0.02
0
-I
"H
/y
A/^
j/
/
/*s
/*
A,/*
f
/+\<*
rbulent bodies= 25x106
aminar Bodies{ = 3x10010_ 52x10*
2 4 6 8 10 12LENGTH/DIAMETER
FIG 7 LENGTH / DIAMETER-TRANSITION LOCATION BOUNDARY
FOR SEPARATION
FIGS FRONTAL AREA DRAGCOEFFCIENTS OF PARTIALLY LAMINAR AND
FULLY TURBULENT BODIES AS FUNCTIONOF BODY LENGTH /
DIAMETER RATIO EXPERIMENTAL DATAturbulence. This is quite rare. If you flyin rain, the flow will become turbulentbut laminar flow will be restored a fewminutes after leaving the rain. Flight inrough air can vary the angle of attackenough to increase wing drag. The fuse-lage should be less affected.
APPLICATION TO ACTUAL, AIRCRAFTB
Modern production sailplanes enjoysome laminar flow on the forwardfuselage and in general due to lack ofpropeller and with pod and boom fuse-lage configuration have somewhatlower fuselage drag than powerplanes.To date they have not gone to a slidingsingle unit forward fuselage design sothe canopy joints no doubt trip thelaminar boundary layer. There havebeen two sailplanes built with my pro-posed unit construction. The SwissElfe seems to be very nicely done andSutherland in Australia also used thisfeature on his MOBA sailplane. Thename stands for "My Own BloodyAircraft." He reports that the unit canbe slid forward and back in flight withvery low forces. On initial opening thenegative pressure over most of it over-come the positive pressures at thenose. Once the internal pressure be-comes negative this effect would ofcourse reduce. At any rate, it appearsone could get out in an emergency.
There are now a few powerplaneswith the propeller behind the tailsuch as the American Cirrus and theFrench Orion. It would be interestingto check the extent of fuselage lami-nar flow with flow visualization.
PERFORMANCE {
ESTIMATIONOF AN EXTREME
APPLICATIONI did performance estimations for a
very small record attempt airplane tomeet the 661 pound takeoff weightlimitation. Single place, propeller be-hind tail, retractable landing gear. Span14 ft., chord 2 ft., NASA NLF (1) 0414F airfoil. AMW 90 hp 3 cyl. 2 cycle in-line engine. With extensive laminarflow on wing, tail and forward fuse-lage, top speed comes out 328 mph.That is really moving on 90 hp with85% prop efficiency. If we lost allfuselage laminar flow, the speed woulddrop to 294 mph, a loss of 34 mph. Ifwe lost all laminar flow the top speedwould drop to 258 mph, a loss of 70mph from the extensively laminar air-craft. With modern materials it shouldbe possible to meet the weight l imitand provide the required surface per-fection. Not what one would want for asportplane, but for a record attemptand to promote interest in advancedaircraft design, it is tempting.
ABOUT THE AUTHORBruce H. Carmichael, EAA 3133,
34795 Camino Capistrano, CapistranoBeach, CA 92424, graduated with adegree in Aeronautical Engineeringfrom the University of Michigan in1944. Among his teachers was EAAmember Ed Lesher. Bruce later workedat Chance Vought and Goodyear Air-craft in applied aerodynamics.
A chance meeting with Dr. AugustRaspet at a sailplane meet in 1949 ledto Bruce jo in ing him in boundarylayer control flight research usingsailplanes. This in turn led to exten-sion of his research of high subsonicspeeds with Dr. Werner Pfenninger atNorthrop Aircraft, using an F-94A jetaircraft. He later extended both nat-ural laminar flow and ar t i f ic ia lboundary layer control for drag reduc-tion with Dr. Max Kramer, usingunmanned underwater vehicles.
Bruce has served on aerodynamiccommittees for various soaring organi-zations, and written articles for soaringand aviation magazines.
REFERENCES1. Carmichael, B.H. — The Ultimate
Laminar Airfoil? Kitplanes Nov. 19942. Young, A.D. — The Calculation of the
Total and Skin Friction Drags of Bod-ies of Revolution at Zero Incidence.British R & M 1874 April 1939
SPORT AVIATION 69

FLY OURAWARD-WINNING
AIRCRAFT.
Dakota Hawk
AWARD-WINNING DESIGNS
• PROVEN
• RUGGED
• STABLE
Super Koala
• FACTORY SUPPORT AND
SERVICE SECOND TO NONE
• AFFORDABLE FLYING
'::."' . . ' -V j. . • • , - . ' . " • • • ' ' .
The Classic
flSHER Fir/MG PRODUCTS
P.O. Box 468-S95 • Edgeley, ND 58433Phone (701) 493-2286
For full-color into pack on all 9 models, send K in U.S., $7 outside U.S.
FIG 9 PHOTO ILLUSTRATION OF DOLPHIN 13. Carmichael, B.H. — Underwater
Vehicle Drag Reduction ThroughChoice of Shape. June '66. AIAASecond Propulsion Joint SpecialistConference. AIAA Paper 66-657.
4. Holmes, Obara and Yip — NaturalLaminar Flow Experiments onModern Airplane Surfaces. NASATechnical Paper 2256 June 1984.
5. Carmichael, B.H — Laminar Light-plane, The Difficult Dream. SportAviation Aug. and Sept. 1976.
6. Strojnik, A. — Laminar Magic —Sport Aviation, Jan. 1990.
7. Taylor, M. — Shafts in Light Air-craft — Sport Aviation, Dec. 1985.
8. Lesher, E. — Teal Racer — SportAviation, March 1968. ^
For information, use SPORT AVIATION'S Reader Service Card
70 AUGUST 1996
RAG
CO
EFFI
CIE
NT
FRO
NTA
L AR
o §o g
o go o
O 2 4 6 8 1010 FRONTAL AREA DRAG COEFFICIENT VS.
LENGTH/DIAMETER RATIO
FUSELAGE POD DRAGWIDTH = 2 FT. HEIGHT = 3 FT. SPEED = 214 M.P.H.
FRONTAL AREA = 4.91 SQ. FT. NACA 66 SERIES FORM
.;ft
O 2 4 6 8 10FIG 11 FUSELAGE DRAG AREA VS. LENGTH / DIAMETER RATIO


![Road Trippers [Ciudad de México]](https://img.dokumen.tips/doc/110x75/568c4b0e1a28ab49169ab85c/road-trippers-ciudad-de-mexico.jpg)