Embed Size (px)
Citation preview
Articles
nAture methods | VOL.8 NO.10 | OCTOBER 2011 | 871
the light microscope is traditionally an instrument of substantial size and expense. its miniaturized integration would enable many new applications based on mass-producible, tiny microscopes. Key prospective usages include brain imaging in behaving animals for relating cellular dynamics to animal behavior. here we introduce a miniature (1.9 g) integrated fluorescence microscope made from mass-producible parts, including a semiconductor light source and sensor. this device enables high-speed cellular imaging across ~0.5 mm2 areas in active mice. this capability allowed concurrent tracking of ca2+ spiking in >200 Purkinje neurons across nine cerebellar microzones. during mouse locomotion, individual microzones exhibited large-scale, synchronized ca2+ spiking. this is a mesoscopic neural dynamic missed by prior techniques for studying the brain at other length scales. overall, the integrated microscope is a potentially transformative technology that permits distribution to many animals and enables diverse usages, such as portable diagnostics or microscope arrays for large-scale screens.
Modern understanding of technology recognizes miniaturized integration as a pivotal advance that facilitates low-cost produc-tion and typically leads to improved performance and unantici-pated applications1. Such impact has been shown in diverse arenas, including telecommunications, computing and genomics. One technology that has largely resisted integration is the light micro-scope, which generally remains a bulky and costly tabletop instru-ment. In neuroscience, microscopy has achieved widespread use in live animals, but the limitations of conventional microscopes hamper the scope and scale of brain-imaging experiments2. To improve the accessibility, quality and throughput of brain-imaging studies in freely behaving mice, we created a miniature, integrated fluorescence microscope with a design permitting mass-production and high-speed tracking of neural dynamics. The microscope is based on micro-optics and semiconductor optoelectronics, both readily mass-fabricated, and integrates all optical parts in a tiny package that is easily held by the fingertips. Compared to high-resolution fiber-optic microscopes, our device offers advantages in optical sensitivity, field of view, attainable resolution, mechanical flexibility for the animal, cost and portability.
miniaturized integration of a fluorescence microscopeKunal K Ghosh1,2,5, Laurie D Burns2,5, Eric D Cocker2,5, Axel Nimmerjahn2, Yaniv Ziv2, Abbas El Gamal1 & Mark J Schnitzer2–4
Previous methods for microscopy in behaving animals required tabletop optical instrumentation that could not be readily distrib-uted to many mice in parallel2–9. Some methods also required head fixation of the mouse4,5,8,9, which is incompatible with stan-dard rodent behavioral assays. Our microscope clears both these challenges, is 1.9 g in mass and can be carried by an adult mouse on its head. Electrical wires carry power, control signals and data to and from the mouse, but these are sufficiently fine to permit a highly flexible mechanical connection. This is unlike fiber-optic microscopes, which are prone to exerting torque on the mouse owing to the finite bending radius of the optical fiber.
We explored the integrated microscope’s capabilities for brain imaging by visualizing cerebellar microcirculation across different locomotor behaviors. The ~500% increase in optical throughput over our prior fiber-optic microscope6 improved data quality sufficiently that we could analyze capillary diameters and flow speeds with seconds-scale resolution rather than averaging over behavioral epochs6. Although we had expected capillaries across the imaging field would be regulated uniformly, only a spatially scattered minority of vessels significantly changed diameters and flow speeds as the mouse switched from resting to active behaviors. Capillary regulation may thus have unanticipated precision at the tens of micrometers scale.
We also tracked Ca2+ spiking in up to 206 individual cerebellar Purkinje neurons, ~700% more than with our fiber-optic micro-scope6. The improved throughput implied our recordings required lower illumination power and lasted up to 1 h without noticeable photobleaching. These improvements allowed collection of far larger Ca2+-spiking datasets, enabling the initial analysis in freely behaving mice of higher-order spiking correlations among Purkinje neurons. This revealed synchronized Ca2+ spiking that arose during motor behavior in individual cerebellar microzones.
Beyond brain imaging, there has been considerable recogni-tion of new applications that would be enabled by miniaturized integration of the light microscope, particularly portable, image-based diagnostics and high-throughput screening10. Past efforts to address these have yielded miniaturized devices that needed accessory, conventional optical instrumentation11,12 or that did not permit fluorescence imaging and made specialized assump-tions about the specimen13,14.
1David Packard Electrical Engineering Building, Stanford University, Stanford, California, USA. 2James H. Clark Center, Stanford University, Stanford, California, USA. 3Howard Hughes Medical Institute, Stanford University, Stanford, California, USA. 4CNC Program, Stanford University, Stanford, California, USA. 5These authors contributed equally to this work. Correspondence should be addressed to M.J.S. ([email protected]).Received 29 NovembeR 2010; accepted 2 august 2011; published oNliNe 11 septembeR 2011; doi:10.1038/Nmeth.1694
© 2
011
Nat
ure
Am
eric
a, In
c. A
ll ri
gh
ts r
eser
ved
.©
201
1 N
atu
re A
mer
ica,
Inc.
All
rig
hts
res
erve
d.

872 | VOL.8 NO.10 | OCTOBER 2011 | nAture methods
Articles
To illustrate potential usages of the integrated microscope in biotechnology, we show that our device permits fluorescent cell counting, for which conventional instruments have substantial footprints and cost. Regarding diagnostics, we show that our microscope can detect tuberculosis bacteria in a fluorescence assay. The microscope’s portability, potential low cost and simple electronics requirements should aid dissemination to locations inhospitable to conventional microscopy.
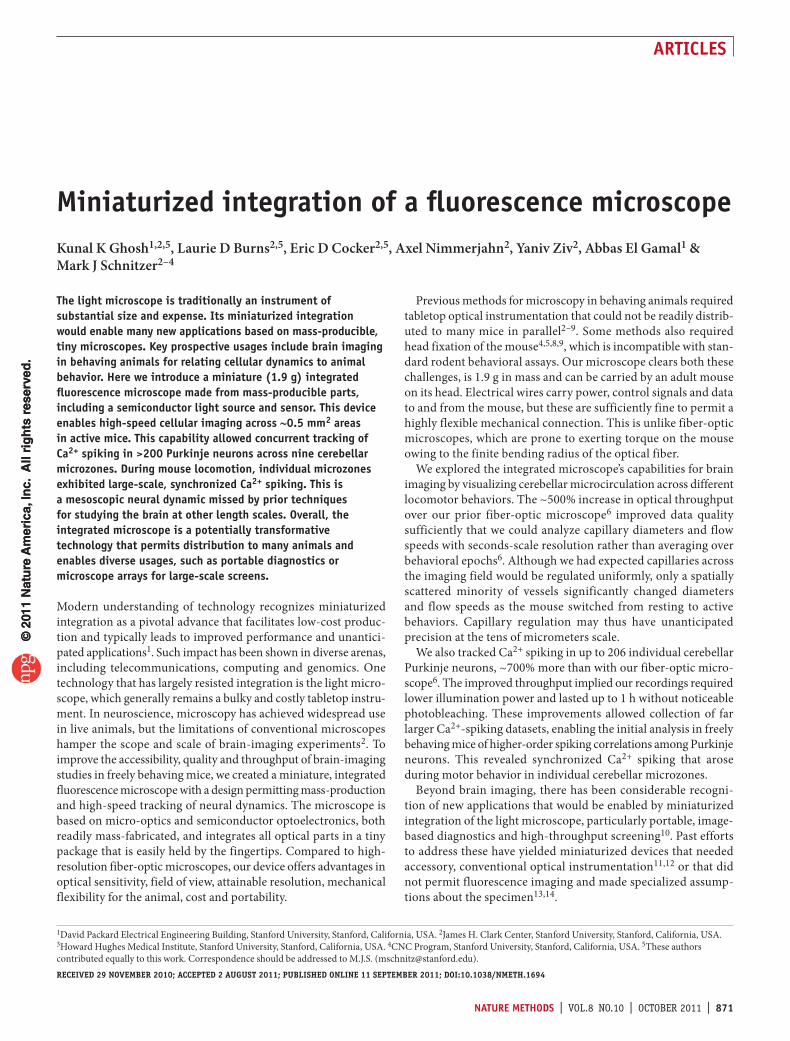
resultsoptical designThe microscope’s design exploits recent advances in optoelectron-ics that have yielded inexpensive but high-quality parts, including tiny but bright light-emitting diodes (LEDs) and complementary metal-oxide semiconductor (CMOS) image sensors with fine pixel sizes and high sensitivity15. This allowed us to incorporate all opti-cal parts in a ~2.4 cm3 housing (Fig. 1a and Online Methods).
A blue LED resides on a custom 6 mm × 6 mm printed cir-cuit board (PCB). A drum lens collects the LED’s emissions, which then pass through a 4 mm × 4 mm excitation filter, deflect off a dichroic mirror and enter the imaging pathway (Fig. 1b). A gradient refractive index (GRIN) objective lens focuses illumination onto the sample. Fluorescence from the sample returns through the objective, the dichroic, an emission filter
and an achromatic doublet lens that focuses the image onto a CMOS sensor (640 × 480 pixels; 60% quantum efficiency at 530 nm) mounted on a custom 8.4 mm × 8.4 mm PCB (Fig. 1b). The housing, made of polyetheretherketone, permits focusing to sub-micrometer accuracy by adjusting the camera position. Nine electrical lines (seven connecting to the sensor and two to the LED) carry power, control signals and image data (Fig. 1c). An intermediary PCB between microscope and computer coordinates data acquisition and allows full-frame imaging at 36 Hz or 100 Hz over 300 × 300 pixel subregions (Fig. 1c). The maximum field of view is 600 µm × 800 µm; the optical magnification is ~5.0×; and the lateral resolution is ~2.5 µm (Table 1). This resolution represents the Nyquist limit set by the camera’s 5.6 µm pixel pitch, not the optical limit of the lens design. As CMOS sensors improve, the optical pathway will sup-port ~1.5 µm resolution (Table 1).
Compared to our fiber-bundle microscope for use in behaving mice6 the integrated microscope has major advantages (Table 1).
a
c
bWirebundle
CMOScamera
Emissionfilter
Collectorlens
LEDExcitationfilter
Interface PCB
LED PCB
LEDdriver
FPGA
Power regulators
13
I2C
Data pathClock
Control
PD
USB controllerPCB
From and tocomputer
OSC
CMOS camera PCB
2
7
Objective
Focusingmechanism
Achromatlens
Dichroicmirror
Figure 1 | Design and fabrication of an integrated fluorescence microscope. (a) Computer-assisted design of an integrated microscope, shown in cross-section. Blue and green arrows mark illumination and emission pathways, respectively. (b) Image of an assembled integrated microscope. Insets, filter cube holding dichroic mirror and excitation and emission filters (bottom left), PCB holding the CMOS camera chip (top right) and PCB holding the LED illumination source (bottom right). The wire bundles for LED and CMOS boards are visible. Scale bars, 5 mm (a,b). (c) Schematic of electronics for real-time image acquisition and control. The LED and CMOS sensor each have their own PCB. These boards are connected to a custom, external PCB via nine fine wires (two to the LED and seven to the camera) encased in a single polyvinyl chloride sheath. The external PCB interfaces with a computer via a USB (universal serial bus) adaptor board. PD, flash programming device; OSC, quartz crystal oscillator; I2C, two-wire interintegrated circuit serial communication interface; and FPGA, field-programmable gate array.
table 1 | Comparison of integrated and fiber bundle–based fluorescence microscopesintegrated microscope Fiber-bundle microscope6
Nyquist detection resolution Optical resolution
~2.5 µm ~1.5 µm
~2.8–3.9 µm ~2.8–3.9 µm
Detection-limited field of view Optical field of view
0.48 mm2 1 mm2
0.07 mm2 0.07 mm2
Fluorescence throughput to sensor ~95% ~20%
Signal transmission Digital image data Fluorescence photons
Mechanical tether to mouse Floppy Deflection-dependent stressReference frame of optics All optics move with mouse Lamp and camera stay in lab frameIllumination field at specimen Does not rotate Rotates with animal movement
Portability of optics Total system portability Portability of optical function
Fit in wallet or purse Briefcase-compatible No realignment needed
Benchtop instrument on air table Benchtop instrument on air table Optical realignment needed
Cost of optoelectronic parts Manufacturing scalability
~$1–10 Mass-producible
~$25,000–50,000 No batch fabrication for lamp and camera
Fluorescence throughput is defined here as the efficiency with which captured fluorescence emissions are relayed from the specimen plane to the detection plane. Given the comparable numeri-cal apertures (~0.5) and sensor quantum efficiencies, the fivefold difference in fluorescence throughput is the chief reason the integrated microscope has far greater sensitivity.
© 2
011
Nat
ure
Am
eric
a, In
c. A
ll ri
gh
ts r
eser
ved
.©
201
1 N
atu
re A
mer
ica,
Inc.
All
rig
hts
res
erve
d.
nAture methods | VOL.8 NO.10 | OCTOBER 2011 | 873
Articles
Fiber bundles restrict resolution according to their density of optical fibers, which in turn is capped by light leakage between the indi-vidual fibers. The integrated microscope also offers ~700% greater field of view, ~500% greater transfer efficiency of fluorescence between the specimen and image detection planes, superior free-dom of movement for the mouse owing to the floppy tether, vastly improved cost structure owing to the reliance on optoelectronics in the single-dollar range, and a much smaller and more portable system that does not need optical realignment when transported. As with resolution, the optical design permits additional gains in field of view (up to ~1.15 mm) as CMOS sensors progress. Microscopes based on fiber bundles are restricted in field of view by the maxi-mum diameter and bending radius of the bundle an animal can tol-erate while behaving naturally. The integrated microscope’s control and data lines carry digital signals, so there is no decline in signal quality for long wires allowing slack in the animal’s tether. Analog fluorescence signals ported in fiber-optics suffer from increased absorption and leakage or cross-talk in fibers of greater length.
Finally, with the integrated microscope all optical parts are in the animal’s reference frame, which substantially improves data quality. In our prior work6, light source and camera were in the laboratory frame; hence we used a commutator so the fiber could swivel, allowing the mouse to move freely. The illumination field thus rotated in real time at the specimen plane, and in the analysis we had to disentangle the spinning illumination from signals in the specimen. Our use of a Hg arc lamp6, far more prone to high-frequency fluctuations than the LED used here, compounded the challenge. The integrated microscope obviates these problems entirely, removing a nonstationary noise source that depended on the mouse’s behavior.
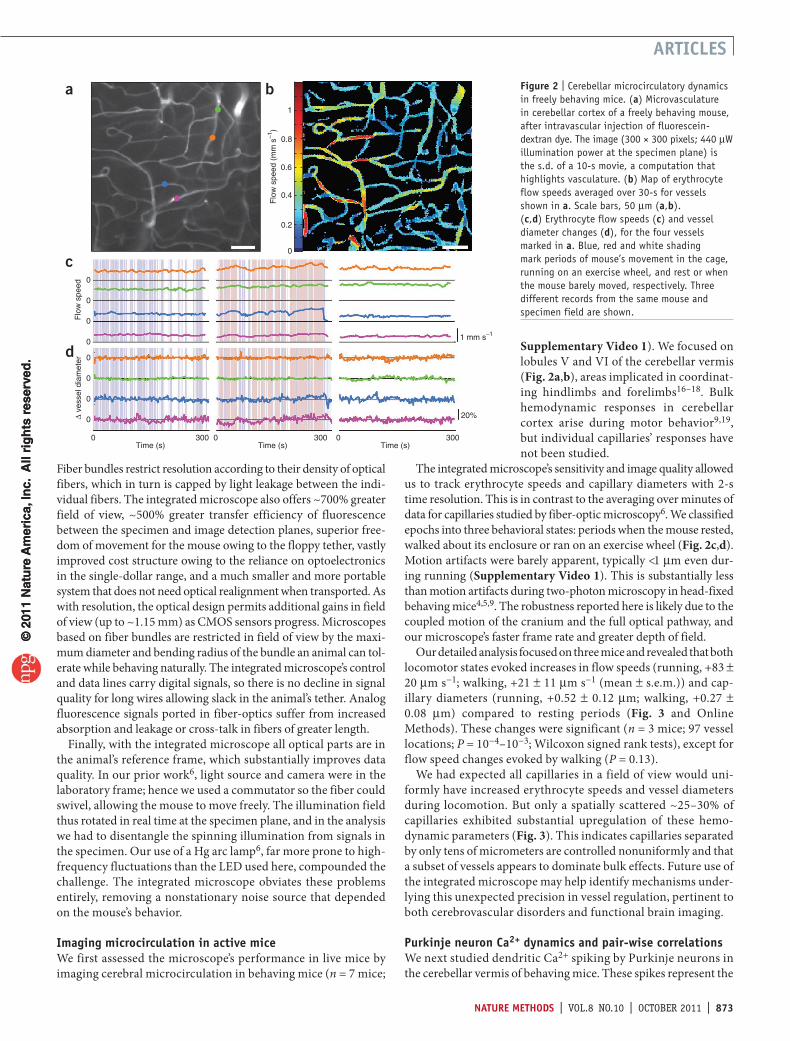
imaging microcirculation in active miceWe first assessed the microscope’s performance in live mice by imaging cerebral microcirculation in behaving mice (n = 7 mice;
Supplementary Video 1). We focused on lobules V and VI of the cerebellar vermis (Fig. 2a,b), areas implicated in coordinat-ing hindlimbs and forelimbs16–18. Bulk hemodynamic responses in cerebellar cortex arise during motor behavior9,19, but individual capillaries’ responses have not been studied.
The integrated microscope’s sensitivity and image quality allowed us to track erythrocyte speeds and capillary diameters with 2-s time resolution. This is in contrast to the averaging over minutes of data for capillaries studied by fiber-optic microscopy6. We classified epochs into three behavioral states: periods when the mouse rested, walked about its enclosure or ran on an exercise wheel (Fig. 2c,d). Motion artifacts were barely apparent, typically <1 µm even dur-ing running (Supplementary Video 1). This is substantially less than motion artifacts during two-photon microscopy in head-fixed behaving mice4,5,9. The robustness reported here is likely due to the coupled motion of the cranium and the full optical pathway, and our microscope’s faster frame rate and greater depth of field.
Our detailed analysis focused on three mice and revealed that both locomotor states evoked increases in flow speeds (running, +83 ± 20 µm s−1; walking, +21 ± 11 µm s−1 (mean ± s.e.m.)) and cap-illary diameters (running, +0.52 ± 0.12 µm; walking, +0.27 ± 0.08 µm) compared to resting periods (Fig. 3 and Online Methods). These changes were significant (n = 3 mice; 97 vessel locations; P = 10−4–10−3; Wilcoxon signed rank tests), except for flow speed changes evoked by walking (P = 0.13).
We had expected all capillaries in a field of view would uni-formly have increased erythrocyte speeds and vessel diameters during locomotion. But only a spatially scattered ~25–30% of capillaries exhibited substantial upregulation of these hemo-dynamic parameters (Fig. 3). This indicates capillaries separated by only tens of micrometers are controlled nonuniformly and that a subset of vessels appears to dominate bulk effects. Future use of the integrated microscope may help identify mechanisms under-lying this unexpected precision in vessel regulation, pertinent to both cerebrovascular disorders and functional brain imaging.
Purkinje neuron ca2+ dynamics and pair-wise correlationsWe next studied dendritic Ca2+ spiking by Purkinje neurons in the cerebellar vermis of behaving mice. These spikes represent the
a b
0.6
Flo
w s
peed
(m
m s
–1)
0.2
0.4
0.8
1
0
0
∆ ve
ssel
dia
met
erF
low
spe
ed
300Time (s)Time (s) Time (s)
c
d1 mm s–1
20%0
0
0
0
0
0
0
0
30003000
Figure 2 | Cerebellar microcirculatory dynamics in freely behaving mice. (a) Microvasculature in cerebellar cortex of a freely behaving mouse, after intravascular injection of fluorescein-dextran dye. The image (300 × 300 pixels; 440 µW illumination power at the specimen plane) is the s.d. of a 10-s movie, a computation that highlights vasculature. (b) Map of erythrocyte flow speeds averaged over 30-s for vessels shown in a. Scale bars, 50 µm (a,b). (c,d) Erythrocyte flow speeds (c) and vessel diameter changes (d), for the four vessels marked in a. Blue, red and white shading mark periods of mouse’s movement in the cage, running on an exercise wheel, and rest or when the mouse barely moved, respectively. Three different records from the same mouse and specimen field are shown.
© 2
011
Nat
ure
Am
eric
a, In
c. A
ll ri
gh
ts r
eser
ved
.©
201
1 N
atu
re A
mer
ica,
Inc.
All
rig
hts
res
erve
d.

874 | VOL.8 NO.10 | OCTOBER 2011 | nAture methods
Articles
Ca2+ component of complex (Na+ and Ca2+) action potentials4,6,20 thought to be crucial for cerebellar motor learning21. After injec-tion of the cell-permeant fluorescent Ca2+ indicator Oregon Green 488–BAPTA-1-acetoxymethyl (AM) into cerebellar cor-tex, the integrated microscope could record Ca2+ spiking from up to 206 individual neurons at frame rates up to 46 Hz (n = 4 mice; Fig. 4a,b).
We used established computational methods to identify indi-vidual Purkinje neurons and extract their Ca2+ activity traces from the image data4 (Online Methods). The identified cells and their spike rates were consistent with anatomical and electro-physiological attributes of Purkinje neurons in mice and prior in vivo Ca2+-imaging studies4,6,20,22 (Fig. 4). As previously, cross-correlograms of Ca2+ spiking activity revealed spatial clustering of neurons into local microzones of 7–36 cells with significant pair-wise synchrony4,22 (Fig. 4c). Microzones are basic cerebellar divisions, each mapped to a specific body part23, and up to nine microzones were present in individual recordings. After classi-fying the mouse’s behavior into periods of rest, grooming, loco-motion or other behavior (Online Methods), we observed that microzones maintained stable identities across different behav-iors4 and showed stronger correlations with cells in neighboring versus distal microzones (Fig. 4c).
In a detailed analysis of three mice, we found that most cell pairs in the same microzone were significantly correlated during both rest (84% of n = 3,985 pairs had P < 0.01, likelihood ratio test; P = 4 × 10⁻⁴ ± 10−3 (mean ± s.d. of the significantly correlated pairs)) and locomotor behavior (98% of n = 3,985 pairs had P < 0.01; P = 6 × 10⁻⁵ ± 5 × 10⁻⁴ (mean ± s.d.)). By comparison, only 9% of n = 21,434 cell pairs in distinct microzones were sig-nificantly correlated during rest (P = 2 × 10⁻³ ± 3 × 10⁻³ for the significantly correlated pairs), which increased to 19% (P = 1 × 10⁻³ ± 2 × 10⁻³) during locomotion. Correlation coefficients for the intrazone cell pairs rose from r = 0.12 ± 0.001 (mean ± s.e.m.) during rest to r = 0.22 ± 0.002 during locomotion (P = 10−50, Wilcoxon signed rank test). Correlation coefficients for interzone pairs were much smaller during both behaviors (r = 0.01 ± 0.001, rest; r = 0.02 ± 0.001, locomotion; n = 21,434 pairs), but slightly higher for cell pairs from adjacent microzones (r = 0.03 ± 0.001, rest; r = 0.06 ± 0.001, locomotion; n = 6,314 pairs).
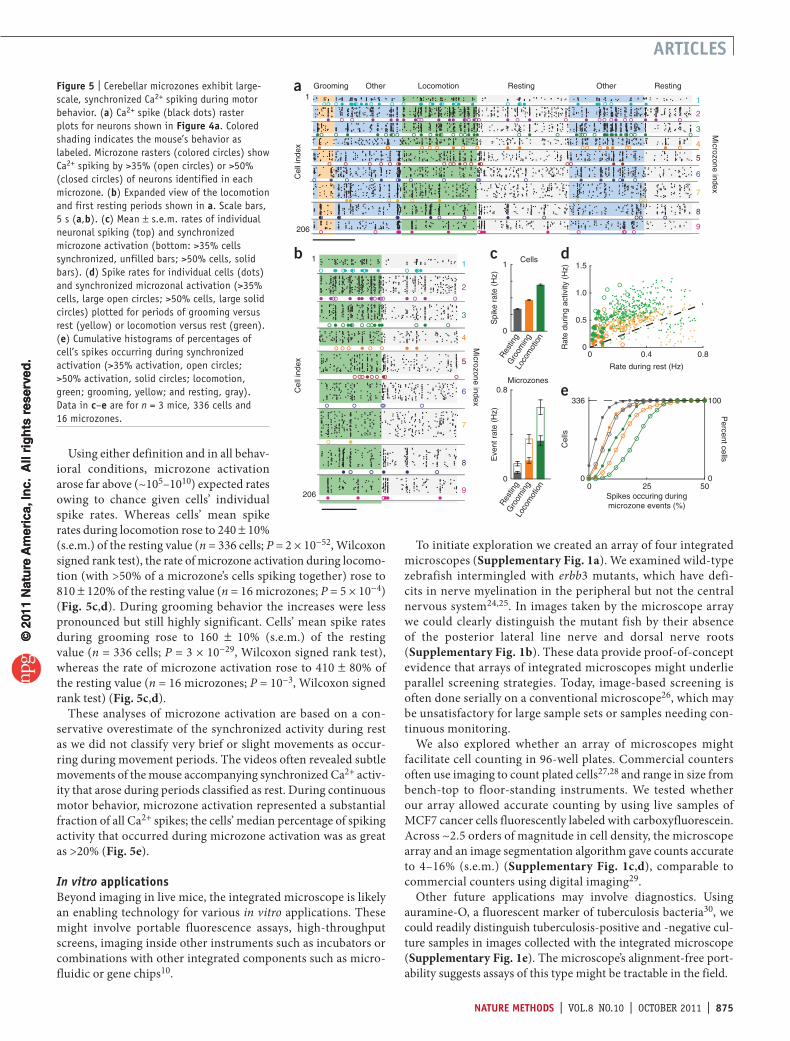
Behaviorally evoked microzone activationThe large sets of Purkinje neurons and ~3,500% more spikes collected in our datasets than previously6, enabled to our knowl-edge the first analysis of higher-order correlations in these cells’ dynamics in freely behaving mice. We found that predomi-nantly during motor activity large cohorts of up to >30 Purkinje neurons in individual microzones fired synchronous Ca2+ spikes (Fig. 5a,b). We used two alternative definitions of synchrony to characterize a microzone’s collective activation: either >35% or >50% of visible neurons in a microzone were required to spike in a 50-ms interval.
a b
c
Cel
l ind
ex
0
0.71
2061 206
Cell index
Correlation coefficient
Resting Grooming Locomotion
Medial
Rostral
3% ∆F/F
1 s
Figure 4 | Purkinje neurons’ Ca2+ spiking dynamics during motor behavior. (a) Contours of 206 Purkinje neurons identified in a freely behaving mouse, superimposed on a time-averaged fluorescence image (480 × 480 pixels; 170–250 µW illumination at the specimen plane) of the cerebellar surface after injection of the Ca2+ indicator Oregon Green 488–BAPTA-1-AM. Each color indicates one of nine identified microzones. Filled contours mark neurons whose activity is shown in b. Scale bar, 100 µm. (b) Relative changes in fluorescence (∆F/F) from filled neurons in a. Black dots mark detected Ca2+ spikes. (c) Spike-train correlation coefficients for pairs of neurons during resting, grooming and locomotion. Colored outlines indicate microzones identified by cluster analysis of the correlation coefficients and correspond to those in a.
Figure 3 | Nonuniform regulation of cerebellar capillaries during locomotion. (a,b) Erythrocyte speeds (a) and vessel diameters (b) compared between rest and locomotion. Each data point represents a vessel location in the vermis. Data above the diagonal indicate upregulation in speed or diameter during motor activity. Shaded blue and red areas demarcate 1 s.d. of measurement fluctuations calculated using the data below the diagonal. (c) Cumulative histogram of changes in flow speeds during walking in the cage or wheel running compared to rest. Histogram portions above and to the right of areas enclosed by colored dashed lines represent data for vessel locations lying above the color corresponding shaded areas in a. Inset, mean ± s.e.m. changes compared to rest. *P = 4 × 10⁻⁵ (walking compared to running) and **P = 2 × 10⁻⁴ (running compared to rest) using Wilcoxon signed-rank tests. (d) Cumulative histogram of changes in vessel diameters during walking or running compared to rest. Histogram portions outside areas enclosed by colored dashed lines represent measurements lying above the corresponding shaded areas in b. Inset, mean ± s.e.m. changes. *P = 6 × 10⁻³ (walking and running), **P = 10−3 and ***P = 10−4 (compared to rest) using Wilcoxon signed-rank tests. Data in a–d are for n = 97 vessel locations from three mice.
dca1.8
00 1.8
Rest flow speed (mm s–1)
Act
ive
flow
sp
eed
(mm
s–1
)
b 16
Rest diameter (µm)
Act
ive
diam
eter
(µm
)
44 16
*
0
100 **
∆ flow speedfrom rest (µm s–1)
–400 4000
50
100
1,200
50
Tot
al p
opul
atio
n (%
)
0
0.4
0.8
**
****
CageWheel
–2 0 2 4 6∆ vessel diameter
from rest (µm)
Tot
al p
opul
atio
n (%
)
0
50
100
Walking in cageRunning in wheel
© 2
011
Nat
ure
Am
eric
a, In
c. A
ll ri
gh
ts r
eser
ved
.©
201
1 N
atu
re A
mer
ica,
Inc.
All
rig
hts
res
erve
d.
nAture methods | VOL.8 NO.10 | OCTOBER 2011 | 875
Articles
Using either definition and in all behav-ioral conditions, microzone activation arose far above (~105–1010) expected rates owing to chance given cells’ individual spike rates. Whereas cells’ mean spike rates during locomotion rose to 240 ± 10% (s.e.m.) of the resting value (n = 336 cells; P = 2 × 10−52, Wilcoxon signed rank test), the rate of microzone activation during locomo-tion (with >50% of a microzone’s cells spiking together) rose to 810 ± 120% of the resting value (n = 16 microzones; P = 5 × 10⁻⁴) (Fig. 5c,d). During grooming behavior the increases were less pronounced but still highly significant. Cells’ mean spike rates during grooming rose to 160 ± 10% (s.e.m.) of the resting value (n = 336 cells; P = 3 × 10⁻²⁹, Wilcoxon signed rank test), whereas the rate of microzone activation rose to 410 ± 80% of the resting value (n = 16 microzones; P = 10−3, Wilcoxon signed rank test) (Fig. 5c,d).
These analyses of microzone activation are based on a con-servative overestimate of the synchronized activity during rest as we did not classify very brief or slight movements as occur-ring during movement periods. The videos often revealed subtle movements of the mouse accompanying synchronized Ca2+ activ-ity that arose during periods classified as rest. During continuous motor behavior, microzone activation represented a substantial fraction of all Ca2+ spikes; the cells’ median percentage of spiking activity that occurred during microzone activation was as great as >20% (Fig. 5e).
In vitro applicationsBeyond imaging in live mice, the integrated microscope is likely an enabling technology for various in vitro applications. These might involve portable fluorescence assays, high-throughput screens, imaging inside other instruments such as incubators or combinations with other integrated components such as micro-fluidic or gene chips10.
To initiate exploration we created an array of four integrated microscopes (Supplementary Fig. 1a). We examined wild-type zebrafish intermingled with erbb3 mutants, which have defi-cits in nerve myelination in the peripheral but not the central nervous system24,25. In images taken by the microscope array we could clearly distinguish the mutant fish by their absence of the posterior lateral line nerve and dorsal nerve roots (Supplementary Fig. 1b). These data provide proof-of-concept evidence that arrays of integrated microscopes might underlie parallel screening strategies. Today, image-based screening is often done serially on a conventional microscope26, which may be unsatisfactory for large sample sets or samples needing con-tinuous monitoring.
We also explored whether an array of microscopes might facilitate cell counting in 96-well plates. Commercial counters often use imaging to count plated cells27,28 and range in size from bench-top to floor-standing instruments. We tested whether our array allowed accurate counting by using live samples of MCF7 cancer cells fluorescently labeled with carboxyfluorescein. Across ~2.5 orders of magnitude in cell density, the microscope array and an image segmentation algorithm gave counts accurate to 4–16% (s.e.m.) (Supplementary Fig. 1c,d), comparable to commercial counters using digital imaging29.
Other future applications may involve diagnostics. Using auramine-O, a fluorescent marker of tuberculosis bacteria30, we could readily distinguish tuberculosis-positive and -negative cul-ture samples in images collected with the integrated microscope (Supplementary Fig. 1e). The microscope’s alignment-free port-ability suggests assays of this type might be tractable in the field.
a1
2
3
4
5
6
7
8
9
Microzone index
Cel
l ind
ex
1
206
1
206
Cel
l ind
ex
1
2
3
4
5
6
7
8
9
Microzone index
LocomotionGrooming RestingOther Other Resting
Eve
nt r
ate
(Hz)
Spi
ke r
ate
(Hz)
Loco
mot
ion
Gro
omin
g
Res
ting
0.8
0
0
1cb Cells
Microzones
d
e
Rate during rest (Hz)
Rat
e du
ring
activ
ity (
Hz)
Percent cells
0
336
Cel
ls
0
100
0Spikes occuring duringmicrozone events (%)
5025
0 0.80.40
0.5
1.0
1.5
Loco
mot
ion
Gro
omin
g
Res
ting
Figure 5 | Cerebellar microzones exhibit large-scale, synchronized Ca2+ spiking during motor behavior. (a) Ca2+ spike (black dots) raster plots for neurons shown in Figure 4a. Colored shading indicates the mouse’s behavior as labeled. Microzone rasters (colored circles) show Ca2+ spiking by >35% (open circles) or >50% (closed circles) of neurons identified in each microzone. (b) Expanded view of the locomotion and first resting periods shown in a. Scale bars, 5 s (a,b). (c) Mean ± s.e.m. rates of individual neuronal spiking (top) and synchronized microzone activation (bottom: >35% cells synchronized, unfilled bars; >50% cells, solid bars). (d) Spike rates for individual cells (dots) and synchronized microzonal activation (>35% cells, large open circles; >50% cells, large solid circles) plotted for periods of grooming versus rest (yellow) or locomotion versus rest (green). (e) Cumulative histograms of percentages of cell’s spikes occurring during synchronized activation (>35% activation, open circles; >50% activation, solid circles; locomotion, green; grooming, yellow; and resting, gray). Data in c–e are for n = 3 mice, 336 cells and 16 microzones.
© 2
011
Nat
ure
Am
eric
a, In
c. A
ll ri
gh
ts r
eser
ved
.©
201
1 N
atu
re A
mer
ica,
Inc.
All
rig
hts
res
erve
d.
876 | VOL.8 NO.10 | OCTOBER 2011 | nAture methods
Articles
discussionOur microscope’s composition of mass-producible components should help promote its dissemination. The LED, image sensor, filters and microlenses are all made via batch fabrication, so their costs per microscope decline rapidly with production volume. The microscope housings were machined, but these could be molded to facilitate greater volumes, with the cost dominated by the initial mold. Overall, we expect costs per microscope to decrease substantially with volume manufacturing. This is not the case with conventional high-resolution microscopes, for which multiple parts still are not amenable to batch fabrication.
Other aspects of the integrated microscope that should aid dis-semination include the energy efficiency of LED illumination and the microscope’s ease of transport without need for realignment. We made seven identical copies of the microscope in the initial production round. These devices contain all optical parts but require a computer and are not standalone. Future, standalone versions should be possible and could benefit in-the-field diag-nostics, which demand a high level of portability.
Creation of the integrated microscope capitalized on recent advances in LEDs and image sensors, but the main innovation was in the system design. We created a miniaturized optical pathway, a data acquisition system, three circuit boards and a housing with fine focusing capability, while keeping the microscope to 1.9 g mass. Prior approaches to fluorescence imaging in miniatur-ized format have generally required accessory, tabletop optical instrumentation6,11,12,31. An earlier integrated system for use in mobile rats exhibited a Nyquist resolution of ~20 µm, insuffi-cient for observing individual cells32. Optofluidic chips have been incompatible with fluorescence contrast and required assump-tions about the specimen, such as that it was flowing at certain speeds at zero optical working distance13. Lens-less approaches do not produce direct images but involve deciphering diffrac-tion patterns produced by cells immobilized at a fixed working distance14. Owing to its fluorescence capability, lack of ancillary optical instrumentation, alignment-free portability and suitabil-ity for mass-production, the integrated microscope differs from prior miniaturized devices and can address distinct applications, including imaging the dynamics of hundreds of individual neu-rons in behaving mice.
The integrated microscope will permit Ca2+ imaging in deep brain areas of behaving mice when it is combined with recently developed methods for time-lapse micro-optical imaging33, genetically encoded Ca2+ indicators that are nonratiometric34 and an accessory microendoscope to access deep tissues6,33. To test this, we imaged cellular Ca2+ dynamics in hippocampal area CA1 of active mice using a GCaMP3 Ca2+ indicator34 genetically targeted to pyramidal neurons (Supplementary Fig. 2). These studies revealed prominent Ca2+ transients that likely corre-sponded to action potential bursts, as GCaMP3 is not sufficiently sensitive to report single action potentials in these neurons34.
These proof-of-concept data showed neuronal Ca2+ imaging in freely moving mice is not restricted to studies of cerebellar cor-tex. Brain areas in which cellular-level epi-fluorescence imaging has worked well in behaving mice and rats include cerebellum6, olfactory bulb35, hippocampus33,36 and neocortex37. Ca2+ imag-ing should be similarly feasible in several other brain regions. Many institutions are investing in rodent behavioral facilities, and the integrated microscope appears compatible with widely used
assays, including fear conditioning, novel-object recognition, tests of rodent social interaction, or assays involving olfactory cues or foraging for rewards. This flexibility should help add a brain-imag-ing component to behavioral research using instrumentation that could be less costly, sizable and challenging to operate than current optical apparatus.
In comparison to two-photon microscopes used to study alert, head-restrained mice4,5,8,9, the integrated microscope provides broader fields of view and decreased susceptibility to motion artifacts owing to its greater depth of field and faster frame rates (Supplementary Video 1). For comparison, two-photon micro-scopy in behaving mice allowed tracking of ~100 Purkinje neu-rons’ Ca2+ spiking at <12 Hz frame rates4,5,9; using the integrated microscope we monitored 206 Purkinje neurons at 46 Hz (Fig. 4). Two-photon microscopy has other virtues, including optical sec-tioning, lower background fluorescence, superior resolution and greater robustness to scattering. These are key advantages for imag-ing cells multiple scattering lengths from the objective lens. However, the pixel dwell times in two-photon microscopy (~0.1–3 µs) are so brief relative to one-photon imaging frame rates that in moderate light-scattering regimes neuronal Ca2+ spikes are approximately equally detectable in either modality because the greater photon counts and less severe photon shot noise in one-photon imaging can compensate for this modality’s lesser contrast (B. Wilt, J.E. Fitzgerald and M.J.S., unpublished results).
The two modalities also appear complementary regarding mouse behavioral assays. The integrated microscope permits free-ranging behavior, whereas head fixation of a mouse for two-photon microscopy seems incompatible with many natural behav-iors, even with virtual-reality methods. However, other behavioral studies should benefit from head fixation because it can restrict and simplify behavioral responses. Still, head fixation seems likely to evoke greater stress responses than naturalistic behavior with a head-mounted device. We expect future roles for both two- photon and integrated microscopy in brain imaging.
We observed synchronization of up to >30 Purkinje neurons but selectively during motor behavior and spatially organized by micro-zone boundaries. Although ~50–100-µm-wide in the medial-lateral dimension, microzones extend millimeters in the rostral-caudal dimension23, suggesting that during microzone activation hun-dreds to thousands of Purkinje neurons could be acting simultane-ously with the ~600-µm-long subsets observed via the integrated microscope. Such concerted activity of large neural ensembles at the millimeter scale has few if any precedents. Imaging studies have typi-cally lacked either the resolution of individual neurons’ spikes or the field of view required to observe mesoscale synchronization. During animal inactivity, individual Purkinje neurons exhibit ongoing Ca2+ spiking, whereas the ensemble activation stops or persists at a much-reduced rate. These observations prompt many questions regarding the extent and mechanisms of the large-scale synchronization, the information encoded and its role in motor behavior.
Neurophysiologic control of motor behavior likely involves large neuronal ensembles acting in an organized fashion. Each microzone is mapped to a part of the body plan23, and coherent microzone activation may carry signals of especial importance for control of this part. The prominence of the microzone’s ensemble activation likely enhances its detection and downstream impact in the deep cerebellar nuclei, the sole recipients of Purkinje neuron output from the vermis.
© 2
011
Nat
ure
Am
eric
a, In
c. A
ll ri
gh
ts r
eser
ved
.©
201
1 N
atu
re A
mer
ica,
Inc.
All
rig
hts
res
erve
d.

nAture methods | VOL.8 NO.10 | OCTOBER 2011 | 877
Articles
An attractive possibility is that microzone activation provides a means for reliably encoding motor errors in the presence of ongoing Ca2+ spiking. Purkinje neurons’ Ca2+ spikes are driven by climbing fiber axons from the inferior olive, an area where excitatory neurons can synchronize via gap-junction networks23 and are thought to convey motor error information to cerebellar cortex. As our and prior recordings4,6,38 show, individual Ca2+ spikes persist in the absence of body movement and thus seem unlikely to signal motor errors in a straightforward way. Ensemble activation of the microzone is nearly exclusive to movement peri-ods and could provide a motor error signal that is readily iden-tifiable against individual cells’ baseline spike rates. Beyond the cerebellum, large-scale synchrony in mesoscale neuronal ensem-bles could be a fundamental means in the mammalian brain to reliably engage downstream circuitry and evoke behavior.
In addition to its use in behaving mice, the integrated micro-scope is a multipurpose instrument for epi-fluorescence imag-ing. For in vitro applications, the microscope has the potential to enable large-scale parallelism, allow imaging inside other instrumentation such as incubators and reduce costs. Moreover, a high-resolution microscope that can be held by the fingertips and can be readily ported should stimulate new imaging appli-cations in biology, including portable uses where microscopy is now challenging or infeasible. We have found the integrated microscope with its laptop computer can be easily transported on commercial air flights and immediately used at the destination. This opens up possibilities for mobile assays, such as for ecologi-cal studies or biomedical diagnostics of potential importance for developing nations.
As our cell counting assays show, the integrated microscope can attain counting accuracies comparable to flow cytometry or conventional instrumentation based on digital imaging. Our array of four microscopes points the way to larger arrays that could enable massively parallel strategies for high-content screening. Today, most image-based screens involve one or a few micro-scopes for serial inspection that ultimately limit throughput. Currently available massively parallel approaches generally do not involve imaging and use simpler screening criteria. When combined with computational tools for analyzing massive data-sets, arrays of integrated microscopes might combine the best of high-content screening and massive parallelism. For instance, screens involving high-speed Ca2+ imaging in neurons or myo-cytes are generally prohibitive today with conventional plate read-ers but should be feasible with an array of integrated microscopes. For screens requiring diffraction-limited resolution, it should be straightforward to substitute the existing micro-objective with one designed for diffraction-limited imaging39.
Integrated technologies usually advance rapidly, which moti-vated our choice of a design that can capitalize on upcoming sensor advances to improve resolution, sensitivity and dynamic range. Multicolor imaging should also be feasible. As CMOS technology underpins most modern electronics, ‘intelligent’ inte-grated microscopes seem likely to emerge with sensors having built-in electronic capabilities to facilitate analysis, screening, data compression or diagnostic evaluations.
methodsMethods and any associated references are available in the online version of the paper at http://www.nature.com/naturemethods/.
Note: Supplementary information is available on the Nature Methods website.
AcKnowledgmentsWe thank E.J. Baron, S.S. Gambhir, E.T.W. Ho, R. Luo, E. Mukamel, J. Perlin, L. Sasportas, W. Talbot and members of the Stanford Varian machine shop for technical assistance, and L. Looger (HHMI Janelia Farm Research Campus) for the GCaMP3 plasmid. We acknowledge graduate fellowships from the US National Science Foundation and Stanford University (L.D.B.), postdoctoral fellowships from the Human Frontier Science Program (A.N.) and the Machiah Foundation (Y.Z.), and research funding to M.J.S. from Lawrence Livermore National Laboratory, the Office of Naval Research, the US National Institutes of Health Nanomedicine Development Center for Optical Control of Biological Function, the National Science Foundation Center for Biophotonics, the Packard, the Bill and Melinda Gates and the Paul G. Allen Family Foundations, and the Stanford University CNC program.
Author contriButionsK.K.G. performed optical analysis, designed electronic circuits, assembled microscopy systems, wrote cell-counting software and performed the zebrafish, tuberculosis and cell-counting experiments. L.D.B. performed optical analysis, designed the optical pathway, assembled microscopy systems, performed cerebellum and hippocampal imaging studies, and analyzed the Ca2+-imaging data. E.D.C. designed the mechanical housing, heat dissipation, focusing mechanisms and illumination control circuitry, assembled microscopy systems, designed and built behavioral enclosures with video acquisition, and analyzed the behavioral and microcirculation data. A.N. developed the cerebellar preparation and performed cerebellar imaging studies. Y.Z. developed and performed the hippocampal imaging methodology. A.E.G. supervised the project. M.J.S. supervised the project and wrote the paper. All authors designed experiments and edited the paper.
comPeting FinAnciAl interestsThe authors declare competing financial interests: details accompany the full-text HTML version of the paper at http://www.nature.com/naturemethods/.
Published online at http://www.nature.com/naturemethods/. reprints and permissions information is available online at http://www.nature.com/reprints/index.html.
1. Arthur, W.B. The Nature of Technology: What It Is and How It Evolves. (Free Press, 2009).
2. Wilt, B.A. et al. Advances in light microscopy for neuroscience. Annu. Rev. Neurosci. 32, 435–506 (2009).
3. Helmchen, F., Fee, M., Tank, D. & Denk, W. A miniature head-mounted two-photon microscope: high-resolution brain imaging in freely moving animals. Neuron 31, 903–912 (2001).
4. Mukamel, E.A., Nimmerjahn, A. & Schnitzer, M.J. Automated analysis of cellular signals from large-scale calcium imaging data. Neuron 63, 747–760 (2009).
5. Dombeck, D.A., Khabbaz, A.N., Collman, F., Adelman, T.L. & Tank, D.W. Imaging large-scale neural activity with cellular resolution in awake, mobile mice. Neuron 56, 43–57 (2007).
6. Flusberg, B.A. et al. High-speed, miniaturized fluorescence microscopy in freely moving mice. Nat. Methods 5, 935–938 (2008).
7. Sawinski, J. et al. Visually evoked activity in cortical cells imaged in freely moving animals. Proc. Natl. Acad. Sci. USA 106 19557–19562 (2009).
8. Andermann, M.L., Kerlin, A.M. & Reid, R.C. Chronic cellular imaging of mouse visual cortex during operant behavior and passive viewing. Front. Cell Neurosci. 4, 3 (2010).
9. Nimmerjahn, A., Mukamel, E.A. & Schnitzer, M.J. Motor behavior activates Bergmann glial networks. Neuron 62, 400–412 (2009).
10. Hayden, E.C. Microscopic marvels: microscope for the masses. Nature 459, 632–633 (2009).
11. Rogers, J.D. et al. Imaging performance of a miniature integrated microendoscope. J. Biomed. Opt. 13, 054020 (2008).
12. Breslauer, D.N., Maamari, R.N., Switz, N.A., Lam, W.A. & Fletcher, D.A. Mobile phone based clinical microscopy for global health applications. PLoS ONE 4, e6320 (2009).
13. Cui, X. et al. Lensless high-resolution on-chip optofluidic microscopes for Caenorhabditis elegans and cell imaging. Proc. Natl. Acad. Sci. USA 105, 10670–10675 (2008).
14. Seo, S., Su, T., Tseng, D.K., Erlinger, A. & Ozcan, A. Lensfree holographic imaging for on-chip cytometry and diagnostics. Lab Chip 9, 777–787 (2009).
© 2
011
Nat
ure
Am
eric
a, In
c. A
ll ri
gh
ts r
eser
ved
.©
201
1 N
atu
re A
mer
ica,
Inc.
All
rig
hts
res
erve
d.
878 | VOL.8 NO.10 | OCTOBER 2011 | nAture methods
Articles
15. El Gamal, A. & Eltoukhy, H. CMOS image sensors. IEEE Circuits and Devices Magazine 21, 6–20 (2005).
16. Andersson, G. & Armstrong, D.M. Complex spikes in Purkinje-cells in the lateral vermis (B-zone) of the cat cerebellum during locomotion. J. Physiol. 385, 107–134 (1987).
17. Leicht, R. & Schmidt, R.F. Somatotopic studies on the vermal cortex of the cerebellar anterior lobe of unanesthetized cats. Exp. Brain Res. 27, 479–490 (1977).
18. Jorntell, H., Ekerot, C., Garwicz, M. & Luo, X.L. Functional organization of climbing fibre projection to the cerebellar anterior lobe of the rat. J. Physiol. 522, 297–309 (2000).
19. Glickstein, M., Sultan, F. & Voogd, J. Functional localization in the cerebellum. Cortex 47, 59–80 (2011).
20. Ozden, I., Lee, H.M., Sullivan, M.R. & Wang, S.S. Identification and clustering of event patterns from in vivo multiphoton optical recordings of neuronal ensembles. J. Neurophysiol. 100, 495–503 (2008).
21. Raymond, J.L., Lisberger, S.G. & Mauk, M.D. The cerebellum: a neuronal learning machine? Science 272, 1126–1131 (1996).
22. Ozden, I., Sullivan, M.R., Lee, H.M. & Wang, S.S. Reliable coding emerges from coactivation of climbing fibers in microbands of cerebellar Purkinje neurons. J. Neurosci. 29, 10463–10473 (2009).
23. Apps, R. & Garwicz, M. Anatomical and physiological foundations of cerebellar information processing. Nat. Rev. Neurosci. 6, 297–311 (2005).
24. Lyons, D.A. et al. erbb3 and erbb2 are essential for Schwann cell migration and myelination in zebrafish. Curr. Biol. 15, 513–524 (2005).
25. Pogoda, H.M. et al. A genetic screen identifies genes essential for development of myelinated axons in zebrafish. Dev. Biol. 298, 118–131 (2006).
26. Pepperkok, R. & Ellenberg, J. High-throughput fluorescence microscopy for systems biology. Nat. Rev. Mol. Cell Biol. 7, 690–696 (2006).
27. Kachouie, N., Kang, L. & Khademhosseini, A. Arraycount, an algorithm for automatic cell counting in microwell arrays. Biotechniques 47, x–xvi (2009).
28. Brinkmann, M., Lutkemeyer, D., Gudermann, F. & Lehmann, J. New technologies for automated cell counting based on optical image analysis ’The Cellscreen‘. Cytotechnology 38, 119–127 (2002).
29. Stone, L.R., Gray, D.R., Remple, K.L. & Beaudet, M.P. Accuracy and precision comparison of the hemocytometer and automated cell counting methods. FASEB J 23 (Meeting abstracts), 827 (2009).
30. Steingart, K.R. et al. Fluorescence versus conventional sputum smear microscopy for tuberculosis: a systematic review. Lancet Infect. Dis. 6, 570–581 (2006).
31. Engelbrecht, C.J., Johnston, R.S., Seibel, E.J. & Helmchen, F. Ultra-compact fiber-optic two-photon microscope for functional fluorescence imaging in vivo. Opt. Express 16, 5556–5564 (2008).
32. Murari, K., Etienne-Cummings, R., Cauwenberghs, G. & Thakor, N. An integrated imaging microscope for untethered cortical imaging in freely-moving animals. Conf. Proc. IEEE Eng. Med. Biol. Soc. 2010, 5795–5798 (2010).
33. Barretto, R.P. et al. Time-lapse imaging of disease progression in deep brain areas using fluorescence microendoscopy. Nat. Med. 17, 223–228 (2011).
34. Tian, L. et al. Imaging neural activity in worms, flies and mice with improved GCaMP calcium indicators. Nat. Methods 6, 875–881 (2009).
35. Carey, R.M., Verhagen, J.V., Wesson, D.W., Pirez, N. & Wachowiak, M. Temporal structure of receptor neuron input to the olfactory bulb imaged in behaving rats. J. Neurophysiol. 101, 1073–1088 (2009).
36. Jung, J.C., Mehta, A.D., Aksay, E., Stepnoski, R. & Schnitzer, M.J. In vivo mammalian brain imaging using one- and two-photon fluorescence microendoscopy. J. Neurophysiol. 92, 3121–3133 (2004).
37. Murayama, M. et al. Dendritic encoding of sensory stimuli controlled by deep cortical interneurons. Nature 457, 1137–1141 (2009).
38. Welsh, J.P., Lang, E.J., Sugihara, I. & Llinas, R. Dynamic organization of motor control within the olivocerebellar system. Nature 374, 453–457 (1995).
39. Barretto, R.P., Messerschmidt, B. & Schnitzer, M.J. In vivo fluorescence imaging with high-resolution microlenses. Nat. Methods 6, 511–512 (2009).
© 2
011
Nat
ure
Am
eric
a, In
c. A
ll ri
gh
ts r
eser
ved
.©
201
1 N
atu
re A
mer
ica,
Inc.
All
rig
hts
res
erve
d.
doi:10.1038/nmeth.1694 nAture methods
online methodsMicroscope design. We made seven microscopes of identical design that were ~8.4 mm × 13 mm × 22 mm and 1.9 g in mass. We performed optical ray tracing design studies using Zemax software (Zemax Development Corporation) and mechanical design using AutoDesk Inventor software. We simulated image acquisition by computationally propagating rays emitted from scenes of virtual specimens through the imaging optics in Zemax. Image systems evaluation toolbox (ISET) software (ImagEval) simulated the acquisition of the resulting images on a virtual model of the image sensor.
Illumination pathway. Each microscope had a blue LED with ~470 nm spectral peak (Philips LumiLeds, LXML-PB01-0023). The LED resided on a custom 6 mm × 6 mm PCB equipped with a heat sink. A drum lens (Edmund Optics, NT45-549) collected illumination light, which then passed through a fluorescence excitation filter (Semrock, bandpass filter, 480/40 nm, 4 mm × 4 mm × 1.05 mm) and reflected off a dichroic mirror (Semrock, FF506-Di02, 4 mm × 4.8 mm) that directed the illumination into the objective lens and to the specimen.
Each LED received power from an external programmable con-stant current source or a digital pulse-width-modulation–based current source (Supertex, CL330). We calibrated each micro-scope’s LED to determine the illumination power delivered to the specimen over a range of drive currents. The illumination power varied with the temperature of the LED’s active element, with observable changes in illumination arising from ~1 °C vari-ations. Power declines of ~10% were apparent during the first 60 s after LED activation, but the illumination output stabilized as the LED reached an equilibrium temperature. The voltage drop across the LEDs terminals provided a good approximation of the active element’s temperature. By using the input current level and the measured LED voltage drop, we estimated the output power to within ± 0.5%.
Imaging pathway. A 2-mm-diameter GRIN objective (GRINTech, GT-IFRL-200, 0.245 pitch length, 0.45 numerical aperture (NA)) collected fluorescence emissions, which then passed through the dichroic mirror and an emission filter (Semrock, bandpass filter, 535/50 nm, 4 mm × 4 mm × 1.05 mm). An achromatic lens (Edmund Optics, NT45-207, f = 15 mm) focused the fluo-rescence image onto the CMOS image sensor (Aptina Imaging, MT9V021). The magnification was 4.5–5.5×, depending on the focal position. The on-axis, lateral spatial resolution of the optical design was ~1.2 µm, as estimated by the FWHM of the computed point-spread function. The resolution degraded to ~1.6 µm at the periphery of the field of view. The size of the pixels on the CMOS sensor (5.6 µm × 5.6 µm) limited the resolution of the acquired images, which we empirically estimated as ~2.5–2.8 µm by imag-ing a Siemens Star resolution test pattern36. The working distance of the specimen plane from the external face of the objective lens was 150–200 µm, depending on the focal plane. The field of view area ranged from 650 µm × 490 µm to 800 µm × 600 µm.
Mechanical design. Each microscope housing was made of black polyetheretherketone (PEEK), which is lightweight, chemically resistant, stiff and machinable. A threaded interface between the CMOS imager housing and microscope body allowed fine adjustment
of the spacing between the two, which in turn set the speci-men plane that was in focus in the acquired image. A removable filter cover allowed the filter and dichroic to be easily cleaned or exchanged.
CMOS image sensor. The CMOS camera chip (Aptina Imaging, MT9V021) used for image acquisition had 640 × 480 pixels, each 5.6 µm × 5.6 µm. The packaged sensor was 5.8 mm × 5.6 mm. We empirically characterized the sensor to determine its specifications (Supplementary Table 1). We estimated the read noise as the s.d. of pixel intensity in 1,000 image frames acquired in full darkness with sufficiently brief exposure that the noise contribution from dark current was negligible. To determine the dark-current and dark-signal nonuniformity, we captured 1,000 frames in the dark, with sufficiently long exposure that read noise represented a fractionally insignificant contribution, and then averaged all the frames to yield a single image. We estimated the dark-current and dark-signal nonuniformity as the mean and s.d., respectively, of all pixels in the averaged image. These measure-ments and the basic electronic properties of the sensor enabled estimates of the sensor’s peak signal-to-noise ratio and dynamic range (Supplementary Table 1), quantities that informed our simulations of microscope performance.
Data acquisition and control. The CMOS imager and LED PCBs were connected to a custom, external interface PCB for real-time data acquisition and control via nine fine and flexible wires encased together in a polyvinyl chloride (PVC) sheath of diameter ~1.5 mm (Fig. 1). Seven of these wires interfaced to the image sensor, and the other two wires powered and controlled the LED. A two-wire inter-integrated circuit (I2C) serial communica-tion interface enabled control of the camera. A field-program-mable gate array (FPGA) chip, at the core of the interface PCB, provided the image sensor with a custom clock signal, which was synthesized from a quartz crystal oscillator and acquired serial data output from the imager.
The image data were transferred from the camera to the FPGA over a low-voltage differential swing (LVDS) serial out-put interface, deserialized by the FPGA and transferred to a computer through a USB-compatible data acquisition adaptor PCB. An electrically erasable programmable read-only memory (EEPROM) flash chip permitted nonvolatile storage of the FPGA configuration file, which automatically loaded into the FPGA at system power-up. This enabled plug-and-play operation of the microscope with real-time image acquisition and in-system camera control.
Brain imaging. The Stanford Administrative Panel on Laboratory Animal Care approved all procedures. We used 7–14-week-old male CD-1 wild-type mice and performed surgery using isoflu-rane (1.5–2.5%; mixed with 1–2 l min−1 O2) anesthesia as previ-ously described6,9. In brief, 1–6 d before imaging, we exposed and cleaned the skull above cerebellum. (Details of the hippoc-ampal preparation are available in Supplementary Methods). Using dental acrylic (Coltene, Whaledent) we fixed to the skull a custom metal plate allowing cranial access. On the imaging day, we opened a craniotomy (1.5–2.5 mm diameter, 6.5 mm posterior to bregma and 0.5 mm lateral) and irrigated the exposed tissue with warm artificial cerebral spinal fluid (ACSF; 125 mM NaCl,
© 2
011
Nat
ure
Am
eric
a, In
c. A
ll ri
gh
ts r
eser
ved
.©
201
1 N
atu
re A
mer
ica,
Inc.
All
rig
hts
res
erve
d.

doi:10.1038/nmeth.1694nAture methods
5 mM KCl, 10 mM d-glucose, 10 mM HEPES, 2 mM MgSO4 and 2 mM CaCl2; pH adjusted to 7.4 with NaOH). To dampen heartbeat- and breathing-induced brain motion, we filled the craniotomy with agarose (2%; type III-A, high electroendosmosis (EEO); Sigma) in ACSF and covered it with a coverslip fixed to the head plate, cre-ating an optical window. We sealed the coverslip edges with dental acrylic. In Ca2+-imaging experiments, we left the dura intact for Ca2+- indicator injections but then removed it before agarose application.
In Ca2+-imaging studies, we labeled cerebellar cortex by mul-ticell bolus-loading using the Ca2+ indicator Oregon Green 488–BAPTA-1-AM6,9. Concentrations of Oregon Green 488–BAPTA-1-AM and DMSO in our pipette solution were 500 µM and 5%, respectively. In microcirculatory studies, we labeled the blood plasma by injection into a tail vein of 0.15–0.25 ml fluorescein-dextran (Sigma, 2,000 kDa, 10 mg ml−1)6.
We positioned the miniature microscope above the optical win-dow and lowered it toward the brain using a translation stage, until fluorescent surface structures were visible under weak illumina-tion (90–200 µW). After locating a suitable recording site and focal depth, we turned the illumination off and fixed the micro-scope to the metal head plate using Cerebond adhesive (http://www.myNeuroLab.com/) and dental acrylic (Henry Schein). We allowed the mouse to recover from anesthesia before plac-ing it into the behavioral arena. Imaging began once the mouse exhibited vigorous locomotor activity, typically 15–60 min after removal from isoflurane. To minimize the possibility of photo-induced alterations in physiology, the duration and mean power of continuous illumination were typically <5 min and ~170–600 µW at the specimen plane for each recording. There were at least 2 min between recordings, and the total recording duration was typically < 45 min. In Ca2+-imaging experiments, we assessed tissue health before and after imaging using an upright two- photon microscope equipped with a 20× water-immersion objec-tive (Olympus, 0.95 NA, XLUMPlanFl) and an ultra-short pulsed Ti:sapphire laser (Tsunami, Spectra-Physics) tuned to 800 nm. The frame acquisition rates of the integrated microscope were 100 Hz for studies of microcirculation and 30–46 Hz for Ca2+-imaging studies.
For studies of freely moving mice, we placed the mouse into a 45 cm × 45 cm × 15 cm arena made of transparent acrylic. A thin layer of bedding, a few food pellets and an exercise wheel (Bio-Serv, K3250 and K3328) were inside the arena to provide a com-fortable environment for the mouse. To record mouse behavior, we used either a video-rate monochrome CMOS camera (Prosilica, EC640) with a high-resolution lens (Computar, M0814-MP2) situated above the arena or a video-rate color charge-coupled device (CCD) camera (Sony, DCR-VX2000NTSC) placed next to the arena. We used two sets of infrared LED arrays (Lorex, VQ2120) for illumination with the overhead camera but simply dim room lighting with the color camera.
Analysis of mouse behavior. During studies of cerebellar blood flow, we recorded the mouse’s behavior in its arena using the over-head camera. To isolate information about the mouse’s move-ments, we computed a movie of the behavioral arena containing only light-intensity differences from the time-averaged image of the entire movie. As the microscope housing appeared darker in these movies than any part of the mouse, we found the position of the mouse’s head by setting to zero all pixels that were brighter
than a threshold value and calculating the centroid of the remain-ing nonzero pixels that represented the microscope.
Using these data on the mouse’s head position, we classified the animal’s behavior in an automated way. We detected periods of wheel running when the mouse remained in a particular subre-gion of the exercise wheel that could only be maintained when the mouse was running and not stationary on the wheel. Mice never exhibited sustained walking on the exercise wheel but did walk about the arena. We identified these walking periods when the mouse’s speed was >100 mm s−1 for at least 1 s outside the vicinity of the exercise wheel. Perhaps owing to the relatively small size of the behavioral arena, the mice did not run when they were not on the wheel. We empirically determined the values of all parameters used for these classification routines by carefully observing the videos of mouse behavior and comparing the results to manual scoring of behavior.
During neuronal Ca2+-imaging studies, we recorded the mouse’s behavior using either the overhead or the color video cameras. In these studies we manually classified mouse behavior at 1 s incre-ments into periods of quiet rest, small local movements (for example, head movements, <3 footsteps, body rotation), grooming, walking around the cage, running on the wheel or other movements.
Basic image processing of brain imaging data. We performed all image processing using custom software written in Matlab (MathWorks). As the Bayer color filter on the CMOS image sensor blocked nearly all green fluorescence from reaching the sensor’s red and blue pixels, we examined only the green pixels and created a resampled image whose rows corresponded to the green pixel diagonals of the raw data.
We then performed a rigid image registration to correct for lateral brain displacements by using an image registration algo-rithm implemented in the ImageJ plugin TurboReg40. We aligned each frame in a video sequence to a reference image that was the average image of the entire sequence. We also aligned the different video sequences from each experiment to each other. Corrections for lateral motion were typically <1 µm.
In our later experiments we also corrected for fluctuations or drift in the illumination power provided by the LED. We nor-malized each image frame by the estimate of illumination power calculated from the measured voltage drop across the LED. We calibrated the LED voltage-to-power conversion factor before imaging. In our earlier studies the LED voltage data were una-vailable, and we omitted this step.
In our Ca2+-imaging studies, in which we focused on neural synchrony at the ~25–50 ms scale (Fig. 4), we corrected for the rolling shutter of the CMOS image sensor, which acquired the rows of each image sequentially rather than simultaneously. For each image frame we assigned the sampling time of a row of pixels to be the frame integration time multiplied by the row index and divided by the total number of rows. In our studies of microcirculation, this correction was unnecessary because all computations of flow speed were performed using small neighborhoods of pixels over which the time differences in data acquisition were at the ~1 ms scale or briefer, given that the interval between frames was 10 ms.
Analysis of microcirculatory dynamics. We determined erythro-cyte flow speeds using a method based on temporal cross- correlations6. We first identified vessels by computing the s.d.
© 2
011
Nat
ure
Am
eric
a, In
c. A
ll ri
gh
ts r
eser
ved
.©
201
1 N
atu
re A
mer
ica,
Inc.
All
rig
hts
res
erve
d.
doi:10.1038/nmeth.1694 nAture methods
image of the raw data using all frames of the video. This compu-tation highlighted vessels, which owing to blood flow exhibited greater temporal fluctuations in intensity than background pix-els6. We then chose measurement points randomly within the identified regions of vasculature.
To compute the speed of erythrocytes passing through a spe-cific reference pixel, we computed the cross-correlation between the intensities of the reference pixel and neighboring pixels, for relative temporal delays, τ, of −1, 0 and +1 image frames6. For this calculation we used 10-s segments of data. We computed the centroid of each of the three cross-correlograms, and we deter-mined the speed of erythrocytes passing through the reference pixel as the average of the distances between the τ = −1 and the τ = +1 centroids, divided by the time between two image frames. To track how a capillary’s flow speed varied over time, we per-formed these calculations at 2-s increments over the entire dura-tion of the movie data. To validate the accuracy of this automated algorithm, we have previously compared erythrocyte speeds as manually determined from the raw movie data to the speed values determined in an automated manner33. The two methods yielded close agreement33 (r = 0.99); median differences between the two were 1.5%, and there were only a small minority of points where discrepancies were >5%.
For each determination of a vessel’s erythrocyte flow speed, we made a corresponding determination of vessel diameter. We computed cross-sectional profiles of the vessel’s intensity along three parallel lines spaced one pixel apart in an image that was the average of 2 s of data. The middle line passed through the reference pixel, and each of the three lines was perpendicular to the direction of flow. We then averaged the three line pro-files and fit the result to a Lorentzian curve. We used the half-width at half-maximum (HWHM) of the fit as a measure of the vessel’s diameter. We used Lorentzian fits, because we found empir-ically that Lorentzian curves provided superior approximations of vessels’ profiles than Gaussians, which gave visible overestimates of vessel width.
Identification of Purkinje neurons. We identified spatial filters corresponding to individual Purkinje cell dendritic trees using an established approach to cell sorting4 that sequentially applies prin-cipal component analysis (PCA) and then independent compo-nent analysis (ICA). For each experiment, to identify the Purkinje neurons we typically used 2,000–2,500 frames of imaging data during which the mouse was awake but resting. We first reduced the dimensionality of these data by applying PCA and discarding the principal components that represented ongoing noise fluctua-tions, determined as in prior work4. We generally retained several hundred principal components in the data representation. As each principal component generally represented a mixture of signals from multiple cells, we performed ICA on the principal compo-nents. As in prior work4, from among the ICA spatial filters it was straightforward to identify spatial filters corresponding to the individual Purkinje cells, which were clearly distinguishable from those conveying noise. Using this combined PCA-ICA analysis, we first examined a set of small regions (~120 × 80 pixels) that tiled the entire field of view. We then combined all of the identified cells into a single set while removing duplicates.
For display purposes only (Fig. 4a), we smoothed each spatial filter with a circularly symmetric Gaussian filter (Matlab function
‘conv2()’; s.d. of 5 pixels) and then deblurred the resultant with an ellipsoidal gaussian filter, with the long axis aligned along the medial-lateral dimension (Matlab function ‘deconlucy()’; s.d. of 1 pixel and 6 pixels along the short and long axes, respectively). To delineate the cells’ perimeters, we then thresholded the indi-vidual spatial filters at 20% of their maximum values.
Detection of Ca2+ spikes. We thresholded the identified spa-tial filter for each Purkinje neuron at 50% of its maximum value before extracting the [Ca2+]-related fluorescence trace. We then corrected for slow declines of fluorescence emissions as well as more rapid fluctuations in the fluorescence background, which were likely activity-induced. These two effects were separate from the fluctuations in LED illumination power. Slow declines of emissions were due to gradual bleaching of the Ca2+ indica-tor9. Activity-induced background fluctuations arose from the indicator’s nonspecific pattern of staining4,9,20, which labeled not only Purkinje neurons but also other, out-of-focus neuronal fibers and processes.
To correct for these two effects, we tracked the mean percent-age change in fluorescence in all pixels situated outside neurons, denoted Φ(t), as a measure of background fluctuations. Φ(t) was typically within (−5%, +10%). We corrected each full frame, F(t), by creating a new image, F′(t), where F′(t) = F(t) − Φ(t) F0, where F0 is the time-averaged mean image of stack F(t). Fluorescence fluctuations in areas outside neurons were much reduced within F′(t). This also facilitated detection of Purkinje neurons’ Ca2+ spikes because the neuronal areas had likewise been corrected for bleaching and the out-of-focal-plane fluctuations.
We performed algorithmic spike detection on the F′(t) traces by applying a temporal deconvolution with a decaying exponen-tial of 150 ms time constant41, applying a high-pass filter (8-pole Butterworth; −3 dB cutoff frequency of 8 Hz) and marking as spikes all positive-going threshold crossings at their local maxi-mum. For each video recording, a spike detection threshold was chosen for each neuron so that false positives would occur at a rate <0.05 Hz, which is ~2.5% – 10% of Purkinje neurons’ typical Ca2+ spike rates and comparable to prior percentages of false posi-tive Ca2+ spike detection in these cells4,6,20. To estimate the rate of false positive detection, we examined 20 fluorescence traces generated from independent sets of randomly chosen pixels. The number of pixels randomly sampled for each trace was set equal to the mean number of pixels in the neurons’ spatial filters for that experiment.
The pair-wise correlation coefficient for two cells was defined as Pearson’s correlation coefficient, the covariance in the activity between the two spike trains divided by the product of their s.d. This yielded a correlation coefficient within [-1,1].
Detection of synchronous microzonal activity. We classified Purkinje neurons into clusters (Fig. 4a,c) of cells based on their pair-wise correlations by using k-means cluster analysis. We set k in each experiment to match the number of blocks in the pair-wise correlation matrices, which we and others have found to have a block-diagonal form4,20,22. We interpreted each cluster of neurons as a microzone. To verify that synchronous activity was essential to identification of microzones, we temporally shuffled the data by shifting each neuron’s trace by a randomly chosen time incre-ment. This preserved all temporal structure in individual traces
© 2
011
Nat
ure
Am
eric
a, In
c. A
ll ri
gh
ts r
eser
ved
.©
201
1 N
atu
re A
mer
ica,
Inc.
All
rig
hts
res
erve
d.

doi:10.1038/nmeth.1694nAture methods
but disrupted concerted activity between neurons. We found no microzones after shuffling. We computed event trains in binary format to represent the concerted dynamics of the microzones. In these event trains, each time bin was assigned a value of 0, unless 50% or more of the visible cells in the microzone exhibited syn-chronous spiking, in which case the value was 1 (Fig. 5). We also calculated event traces using a weaker definition of synchrony, in which 35% or more of the visible cells in a microzone exhibited synchronous spiking (Fig. 5).
Using an algorithm based on a modified version of the Matlab routine nchoosek(), we computed the expected rates of synchro-nized microzonal activation based on the empirically determined spike rates for each neuron and the null hypothesis that the indi-vidual neurons’ dynamics were independent. The measured
rates were ~1010 and ~105 times greater than the expected rates, under the respective criteria that >50% or >35% neurons within a microzone must fire concurrently for an event to qualify as synchronized activity.
Statistical analysis. We performed all statistical tests in Matlab (MathWorks) using nonparametric methods, with the exception of the likelihood ratio tests, which assume binomial distributions.
40. Thevenaz, P., Ruttimann, U.E. & Unser, M. A pyramid approach to subpixel registration based on intensity. IEEE Trans. Image Process. 7, 27–41 (1998).
41. Yaksi, E. & Friedrich, R.W. Reconstruction of firing rate changes across neuronal populations by temporally deconvolved Ca2+ imaging. Nat. Methods 3, 377–383 (2006).
© 2
011
Nat
ure
Am
eric
a, In
c. A
ll ri
gh
ts r
eser
ved
.©
201
1 N
atu
re A
mer
ica,
Inc.
All
rig
hts
res
erve
d.