Embed Size (px)
Citation preview

minerals
Review
Deep Underground Injection of Waste from DrillingActivities—An Overview
Nediljka Gaurina-Međimurec , Borivoje Pašic * , Petar Mijic and Igor Medved
Faculty of Mining, Geology and Petroleum Engineering, University of Zagreb, 10000 Zagreb, Croatia;[email protected] (N.G.-M.); [email protected] (P.M.); [email protected] (I.M.)* Correspondence: [email protected]; Tel.: +385-1-553-58-40
Received: 29 February 2020; Accepted: 25 March 2020; Published: 27 March 2020�����������������
Abstract: Oil and gas exploration and production activities generate large amounts of waste material,especially during well drilling and completion activities. Waste material from drilling activities tothe greatest extent consists of drilled cuttings and used drilling mud with a smaller portion of othermaterials (wastewater, produced hydrocarbons during well testing, spent stimulation fluid, etc.).Nowadays, growing concerns for environmental protections and new strict regulations encouragecompanies to improve methods for the reduction of waste material, as well as improve existingand develop new waste disposal methods that are more environmentally friendly and safer fromthe aspect of human health. The main advantages of the waste injection method into suitable deepgeological formations over other waste disposal methods (biodegradation, thermal treatment, etc.)are minimizing potentially harmful impacts on groundwater, reducing the required surface area forwaste disposal, reducing the negative impact on the air and long-term risks for the entire environment.This paper gives a comprehensive overview of the underground waste injection technology, criteriafor the selection of the injection zone and methods required for process monitoring, as well as acomprehensive literature overview of significant past or ongoing projects from all over the world.
Keywords: drilling waste; injection pressure; waste slurry; drilled cuttings; injection methods andequipment; disposal zone; waste containment; process monitoring; rock fracturing
1. Introduction
Oil and gas industry through exploration and production (E&P) activities generate large amountsof different waste through several different processes, including wellbore drilling, well completionand workover, reservoir stimulation (fracturing and acidizing) and hydrocarbons production,as well as transporting and storage of hydrocarbons and associated products (carbon dioxide,produced/wastewater, etc.). Drilling activities on their own generate the second largest amountof waste, following reservoir water produced during oil and gas production [1–4]. Nowadays, probablythe largest amounts of waste during oil and gas E&P activities are generated during the developmentof unconventional reservoirs, because large amounts of water are required for reservoir stimulationthrough the massive fracturing of reservoir rock.
Waste that is generated through drilling activities primarily consists of spent drilling fluids anddrilling cuttings. The main components of waste generated through drilling activities are listed inTable 1, as well as their significant constituents that can affect the environment. Despite a certain portionof environmentally harmful constituents such as heavy metals, radioactive materials or organic salts,waste from drilling, as well as waste from other exploration and production activities in the UnitedStates of America, are classified as nonhazardous waste according to US regulations [5]. However, it isimportant to note that classification of the waste from oil and gas exploration and production activities(including waste from drilling activities) depends on the state or country regulations and regulatory
Minerals 2020, 10, 303; doi:10.3390/min10040303 www.mdpi.com/journal/minerals

Minerals 2020, 10, 303 2 of 29
requirements, as well as on its composition. In the European Union, drilling waste injection is a wastedisposal method defined by the EU Waste Framework Directive 2008/98 (Disposal Operations: D3Deep injection).
Table 1. Composition of waste generated through drilling activities [1].
Type of Waste Main Components Possible EnvironmentallySignificant Constituents
Waste lubricants Lube oil, grase Heavy metals, organics
Spacers Mineral oil, detergents, surfactants Hydrocarbon, alcohol, aromatics
Spent/contaminated water-basedmuds (include brine)
Whole mud, mineral oil,biodegradable matters
Heavy metals, inorganic salts, biocides,hydrocarbons, solids/cuttings, organics
Waste-based mud cuttings Formation solids, water-basedmuds, mineral oil
Heavy metals, inorganic salts, biocides,hydrocarbons, solids/cuttings
Spent/contaminatedoil-based muds Whole-mud mineral oils Hydrocarbons, heavy metals, inorganic
salts, solids, organics, surfactants
Oil-based mud cuttings Formation solids,oil-based muds
Heavy metals, inorganic salt,hydrocarbons, solids/cuttings
Spent bulk chemicalCement, bentonite, barite,
viscosifiers, thinners, fluid lossreducers, special products
Heavy metals, hydrocarbon,organics, solids
Spent special products H2S scavengers, defoamers,tracers
Zinc carbonates, iron oxides,hydrocarbons, silicon oils, potassium
salts, radioactive materials
Additionally, it is important to emphasize that drilling activities generate several times morevolumes of waste in comparison with volumes of the drilled hole. The reasons for this are numerous,such as changes and modifications of drilling fluids in accordance with the requirements of the drillingprogram, the impossibility of removing all drilling cuttings from the drilling fluid, etc. Sometimes,drilling a shallow well results in large quantities of waste potentially more dangerous to the environmentthan in the case of drilling much deeper wells, even though the water-based mud was used. In the1990s, a large number of shallow horizontal wells were drilled in Eastern Venezuela to produce veryheavy oil, and during the drilling, the majority of the waste generated was contaminated with up to20% of crude oil because a large horizontal section was drilled through the reservoir [6]. The quantityand composition of waste generated by the oil and gas industry greatly depends on specific activitieseach year. In 1994, 75% of all waste generated by the exploration and production activities of theAmoco Production Corporation was the result of drilling activities, with an average of 700 kg of drillingwaste per meter of the drilled hole [7]. A year later, the American Petroleum Institute estimated thatalmost 24 million cubic meters of waste were generated in 1995 solely during drilling onshore wellsin the United States of America [8]. Nowadays, oil and gas companies generate smaller quantitiesof waste during drilling activities for the same drilled volume of the rock in comparison to the pastbecause of the implementation of the smart waste management strategy during the field developmentplanning phase.
2. Overview of Oil and Gas Exploration and Production Waste Disposal Methods
Historically, waste generated by drilling activities has been disposed using the most accessibleand cost-effective methods available to the operators, which resulted in the disposal of large amountsof drilling waste in reserve pits [9]. Depending on the particular technology, the disadvantages ofvarious surface methods for the treatment of waste generated by drilling activities (solidification,bioremediation, incineration or different chemical and mechanical treatments) are: the need for largestorage capacities, production of the residual material after treatment, need for a large land area fortreatment and high cost [10–12]. At the same time, the evolution of different international and local(country or state) regulations encourages operators to develop waste management systems (strategy)

Minerals 2020, 10, 303 3 of 29
providing the greatest possible reduction of waste materials and use disposal methods that are moreenvironmentally friendly and safer for the human health [13,14]. Drilling waste management includesthree basic principles: reduction of the waste volume, recycling or reusing and application of specificwaste disposal methods whose selection strongly depends on state legislation with the particularreference to future liability [8,13,15–17].
In that sense, the injection of waste from oil and gas explorations and production activities(including waste from drilling activities) into deep subsurface formations as one of the on-site permanentwaste disposal methods achieves zero discharge; improves the protection of the groundwater andsurface; has a small surface footprint; reduces the need for waste transportation (via pipelines,marine vessels or tankers on-shore) and disposal costs; eliminates risks associated with the surfaceaccumulation of generated waste and is not limited by locations [10,18–24]. Besides all that wasmentioned above, subsurface injections of drilling waste makes the continuous use of oil-based mudduring drilling troubled shale formations in environmentally sensitive areas possible [25]. Deepunderground waste injections (cutting reinjection (CRI) or downhole waste injection (DWI)) are stillthe most economic methods for the disposal of waste generated through exploration and productionactivities in comparison with other available waste disposal methods [26,27]. For example, in theperiod of two years (concluded by March 2000), in Port Fourchon (Louisiana), more than 160,000 m3
of waste produced by drilling and production activities containing naturally occurring radioactivematerials (NORM) has been injected into a single well with an average cost of $119.5 per cubic meterof waste material, which is far less in comparison with the off-site waste disposal, with an estimatedcost of $629 per cubic meter of the same waste material [18]. Similar to the previous example, in theperiod from 1995 to 2004, Marathon Oil Company implemented a waste slurry injection program in thedrilling waste management system and achieved an 89% disposal cost reduction during operations inAlaska (from $337.3 to $36.8 per cubic meter of waste material) [13]. The quantitative and qualitativecomparison of different drilling waste disposal methods is summarized in Table 2. The cost of wastedisposal by different commercial methods listed in Table 2 depends on different factors, such as thetransportation of waste to the disposal/treatment site, cost of the disposal/treatment process itself andcost of the monitoring process [28].
Table 2. Comparison between different disposal methods for waste from drilling activities [6,29].
ComparisonFactor Fixation Thermal
TreatmentDrilling Cuttings
Reinjection Bioremediation/Composting
Environmentalimpact Low High Low Medium
Cost $57–63 per m3
$90 per metric ton(or $80 per m3 foroil-specific gravity
0.88)
$31 per m3 $500 per m3
Cost factorMay require transportand liner and requires
monitoring
Requires transport;air emission control
More expensive ifdedicated well(s)
are required
May require transport andrequired monitoring
Safety risks High High Low Medium
Technical feasibility Low Medium High Medium
Liability
Liability may belong-term if there aresubsequent problems
with liner, etc.
Little liability apartfrom substances
like heavy metalsremaining in thecleaned material
Little liabilityif performed
correctly
Short-term liability whilematerial is treated duringbiotreatment, or possible
long-term liability if there issubsequent degradation of
stabilized material (spreading)
Generally, E&P companies independently define processing for drilling waste disposal based onwaste composition, best available waste disposal methods, best engineering practices and with respectto regulations. There are also different waste materials that are not suitable for deep underground

Minerals 2020, 10, 303 4 of 29
injections through the slurry fracture injection, such as materials that react with the formation orgenerate gas under downhole conditions [6,21].
3. History of the Drilling Waste Underground Injection
The first drill cuttings (in the form of waste slurry) underground injection projects started withthe injection of small volumes of waste in the annular or tubular wellbore at an offshore drillingproject in an environmentally sensitive area. These injection wells were located in the Gulf of Mexico,and such projects began in the mid-1980s [30–34]. After the proven success of such drilling wastedisposal projects, similar new projects were carried out in the Gulf of Mexico (Ewing Bank and Fushon);the North Sea (Vallhal, Ekofisk, Ula, Gyda and Clyde); the North Slope in Alaska (Prudhoe andEndicott); Canada (Panuke); Venezuela (Pedernalis); Russian Federation (Sakhalin Islands and WesternSiberia); Western Canada and other areas where weather conditions, strict regulations and logisticsproblems made this method a viable disposal option [19,33,35–37]. During the 1990s, waste slurryinjection became a proven method as an environmentally safe and economically viable solution for thedisposal of cuttings and other associated waste from oil and gas exploration and production activities(excess drilling fluids, rain water, oily/wash water, displacement pills, storage waste, produced sand,produced sand and gorp from heavy oil “cold production”, slop, etc.) into subsurface formations,especially for remote and ecologically sensitive areas [36,38,39]. Some oil and gas exploration andproduction companies like Conoco Inc. in the early 1990s successfully tried out an annular injection ofslurry waste composed of waste wash water; oil-coated drilling cuttings and nonhazardous additionalwaste generated on drilling rigs, such as glass, paper, pallets, plastics, rope, styrofoam, metal buckets,etc. [40]. Although subsurface injections of waste materials from drilling activities is a well-known andsuccessful technology whose effectiveness has been confirmed through time, there are many challenges,such as frequent changes in regulation, selection of suitable geological formation, monitoring andverification of injection process, design of the whole process, etc. [41].
According to Bruno et al. [22] from Terralog Technologies, one of the leading companies in wasteslurry injection technology, there are three main engineering goals in the waste injection project:
• To secure injected waste containment within the desired formation (environmental management).• To maintain maximum injectivity during the implementation of the project with minimum well
workover intervention (cost management).• To maximize formation storage capacity and well life (asset management).
4. Injection Methods and Equipment
The surface process of drilling waste injection consists of collecting cuttings from drilling wells;mixing the cuttings with liquid waste, water and additives to create slurry and injecting the slurry intoa selected underground formation through an injection well.
The waste from oil and gas exploration and production can be injected into selected undergroundformations by applying different methods [11]. The screening process of appropriate waste injectionmethods represents a crucial part of any successful waste injection project, and it is based on thequantity and quality of available information about the selected underground formation (formationpressure, fracture pressure, permeability, pore throat diameter, etc.); selected injection well (wellintegrity, completion design, well construction, etc.) and quantity and properties of the waste (volume,chemical composition, rheological properties, solid particle size and content, etc.) [30].
One of the most important steps of waste injection method selection refers to the fracture pressureof the underground formation selected for waste injection. From this standpoint, waste slurry canbe injected at a pressure lower than the fracture pressure of the underground formation selected forwaste slurry injection (subfracture injection) or at a pressure higher than the fracture pressure (slurryfracture injection). Selection of these two injections methods is based on state regulations, as well ascharacteristics of the waste slurry and target formation. Until 2000, in the Gulf of Mexico and nearby

Minerals 2020, 10, 303 5 of 29
producing region, more than 80% of drilling waste from offshore and transition zone operations andmore than 90% of nonhazardous oilfield waste from exploration and production activities was disposedin a selected underground formation below the formation fracture pressure [31,42].
During the subfracture waste injection process, the injected waste slurry flows radially from thewellbore and fills the pore space within the selected geological formation. On the other hand, theslurry fracture injection is a more complex process due to the formation of the fractures. In most cases,it is very difficult to predict the geometry of the created fractures and follow their propagation in realtime because of the lithology, local stress conditions, mineralogical composition of a selected formation,the existence of natural fractures within, etc.
The waste slurry injection can also be conducted as a continuous injection process or an intermittentinjection process [43,44]. Unlike the continuous waste injection process, which implies a constantinjection of a large quantity of waste slurry, intermittent injection is convenient for a smaller volume ofwaste slurry, especially in situations where there is a continuous need for process monitoring in orderto prevent unwanted problems (pore throat plugging, adverse pressure increase over the formationfracture pressure, development of a large uncontained fracture, etc.).
4.1. Selection of the Appropriate Waste Injection Method
From the standpoint of the injection well selection as the conduit for safe slurry waste transportationto the selected underground formation, two main methods for E&P waste injection are acceptedworldwide: tubular injection and annular injection (Figure 1) [30,45,46]. An injection well can beintentionally drilled for drilling waste injection purposes (dedicated wells) or be refitted from itsoriginal purpose (converted or redundant wells).
Minerals 2020, 10, x FOR PEER REVIEW 5 of 29
regulations, as well as characteristics of the waste slurry and target formation. Until 2000, in the Gulf of Mexico and nearby producing region, more than 80% of drilling waste from offshore and transition zone operations and more than 90% of nonhazardous oilfield waste from exploration and production activities was disposed in a selected underground formation below the formation fracture pressure [31,42].
During the subfracture waste injection process, the injected waste slurry flows radially from the wellbore and fills the pore space within the selected geological formation. On the other hand, the slurry fracture injection is a more complex process due to the formation of the fractures. In most cases, it is very difficult to predict the geometry of the created fractures and follow their propagation in real time because of the lithology, local stress conditions, mineralogical composition of a selected formation, the existence of natural fractures within, etc.
The waste slurry injection can also be conducted as a continuous injection process or an intermittent injection process [43,44]. Unlike the continuous waste injection process, which implies a constant injection of a large quantity of waste slurry, intermittent injection is convenient for a smaller volume of waste slurry, especially in situations where there is a continuous need for process monitoring in order to prevent unwanted problems (pore throat plugging, adverse pressure increase over the formation fracture pressure, development of a large uncontained fracture, etc.).
4.1. Selection of the Appropriate Waste Injection Method
From the standpoint of the injection well selection as the conduit for safe slurry waste transportation to the selected underground formation, two main methods for E&P waste injection are accepted worldwide: tubular injection and annular injection (Figure 1) [30,45,46]. An injection well can be intentionally drilled for drilling waste injection purposes (dedicated wells) or be refitted from its original purpose (converted or redundant wells).
Figure 1. Annular waste injection (1) and tubular injections (2 and 3).
1.Annular injection
with simultaneous production
2.Tubing injectionabandoned well
3.Tubing injection
dedicated injection well
Surface casing
Intermediate casing#1
Intermediate casing#2
Production casing
Surface casing
Intermediate casing#1
Intermediate casing#2
Production casing
Surface casing
Intermediate casing#1
Intermediate casing#2
Production casing
WasteWaste
Waste
Oil
USDW USDW USDW
ReservoirDepleted reservoir
Injection zone
Injection zone
Injection zone
CementCement Cement
Figure 1. Annular waste injection (1) and tubular injections (2 and 3).
4.1.1. Annular Injection of Drilling Waste
In an annular waste injection, usually the liquid phase of the drilling waste is injected into theannular space between two casings strings (usually the surface casing and intermediated casing string),

Minerals 2020, 10, 303 6 of 29
while at the same time, the production casing string and tubing may be used for other purposes, e.g.,hydrocarbon production (Figure 1 (1.)). It allows the disposal of usually liquid drilling waste from thewell that is being drilled from an adjacent well or the disposal of all waste from drilling pads that havebeen used for drilling multiple wells in a certain area. The basic prerequisite for this operation is theexistence of uncemented annular space between the casings from the surface right until the selectedformation (the surface casing string is usually cemented in its entire length and the intermediate casingstring only at a certain length from the casing shoe) [47].
The annular drilling waste injection, especially a waste slurry injection above the formationfracture pressure, increases burst loading of the external casing string and collapses the loading of theinner casing string. It also causes wellhead and casing string erosion. Minton and Secoy [48] analyzedthe fluid velocity profile during an annular injection, recognized the inner casing hanger opposite tothe wing valve on the casing spool as a critical point from an erosion point of view and concludedthat erosion is highly dependent on the injected waste volume, as well as the slurry injection rate.To prevent these and similar problems, Okorodudu et al. [16] suggest improvement in the well andcompletion design, which includes the use of corrosion-resistant alloy steel, protective sleeves, hardfacing of the critical parts, etc.
Although the annular waste injection method provides an opportunity to inject waste intoexploratory wells and wells being drilled without interrupting the production or the drilling process(as is often the common practice in the North Sea region), in more than 80% of cases, operators selectedthe tubing injection method for their projects [26,46,49]. The main reason for this can be found in theadaptability of the tubular waste injection method, unlike annular waste injection, where the wasteinjection is a mandatory part of the initial well design.
4.1.2. Tubular Injection of Drilling Waste
If this type of injection is selected, the selected formation is covered with a steel casing andcemented. It is necessary to make a perforation in the steel pipe and set cement into the formationin order to make a pathway for future waste slurry injections (Figure 1 (2. and 3.)). According toSipple-Srinivasan et al. [21] from Terralog Technologies Inc., the maximum length of perforated intervalfor a slurry fracture injection should be 10 m to keep the desired injection pressure and rate and with aperforation density of 20 shots per meter (phasing between 90◦ and 120◦) to get an as good as possiblewaste distribution in the radial direction.
4.2. Waste Slurry Preparation and Disposal Unit
For waste slurry preparation and injection in the selected injection well, the slurry preparationand disposal unit is used. It consists of a feed hopper; conveyance system; grinding and mixing system;water supply pump; high pressure injection pumps and storage tanks for solids, liquid waste andwater (Figure 2). All elements are placed onsite within approximately 60 m from the wellhead of theinjection well [21]. The first part of the system consists of the drilling cuttings (or waste) transportationsystem used for waste transportation from sources up to the slurrification unit. In the case of drillingcuttings, the simplest way for their transportation from shakers to the slurrification unit is by gravity,but there are also several other methods like auger or belt conveyors, vacuum transport systems orpneumatic bulk transports and storage systems. Selection of the appropriate waste transportationsystem depends on the drilling rig configuration and arrangement of equipment on it, and its efficiencydepends on the quantity and composition of the waste, distance and elevation from waste sources tothe slurrification unit, time interval from generation of the waste and slurry preparation and injection,etc. The slurrification unit is the second part of the slurry preparation and disposal unit, and it consistsof a coarse tank (for mixing and blending of waste with water by specially designed centrifugal pumps);a classification shaker and grinder (for separation of particles based on their size and additionalgrinding of particles that are too large) and a fines tank (for final conditioning of the slurry by addingadditional water and additives (corrosion inhibitors, biocide and friction reducers) in order to assure

Minerals 2020, 10, 303 7 of 29
the desired slurry properties and quality control). The third part of the slurry preparation and disposalunit is an injection system consisting of a holding tank (for holding the prepared waste slurry), injectionpumps and a system for data acquisition and monitoring of the injection process [49–51]. Although theslurry waste is traditionally injected by a positive displacement plunger or piston/liner-type triplexmud pumps, new laboratory research and a field trial conducted by Newman et al. [34] indicate thatmultistage centrifugal pumps could be advantageous in some situations.
Minerals 2020, 10, x FOR PEER REVIEW 7 of 29
based on their size and additional grinding of particles that are too large) and a fines tank (for final conditioning of the slurry by adding additional water and additives (corrosion inhibitors, biocide and friction reducers) in order to assure the desired slurry properties and quality control). The third part of the slurry preparation and disposal unit is an injection system consisting of a holding tank (for holding the prepared waste slurry), injection pumps and a system for data acquisition and monitoring of the injection process [49–51]. Although the slurry waste is traditionally injected by a positive displacement plunger or piston/liner-type triplex mud pumps, new laboratory research and a field trial conducted by Newman et al. [34] indicate that multistage centrifugal pumps could be advantageous in some situations.
Shaleshaker
High-pressure triplex injection
pumpCentrifugal grinding pump
Drilling fluid
Oil
Waste slurry
Surface casing
Intermediate casing#1
Intermediate casing#2
Production casing
ReservoirDepletedreservoir
Cement
Injection zone
USDW
Injection zone
Injection zone
Injection zone
Intermediate casing#2
Intermediate casing#1
Surface casing Cement
USDW
Cement Cement
USDW USDW
Intermediate casing#1
Intermediate casing#2
Production casing
Production casing
Surface casing
Surface casing
Intermediate casing#1
Intermediate casing#2
Waste slurry
Waste slurry
Mud&CuttingsCuttings
conveyance
2.Annular injection
with simultaneous production
3.Tubing injectionabandoned well
4.Tubing injection
dedicated injection well
1.Drilling in progress
Coarse tank
Finetank
(solids
>300 µm)(solids
<300 µm)
Holding tank
Waste slurry
Waste slurry
Waste slurry
Centrifugal grinding pump
Waste from reserve pit
or other sources Classifying
shaker
Figure 2. Waste slurry preparation and disposal unit.
In some situations, as in the case of oil and gas exploration and production waste injection in polar regions, it is necessary to heat up the waste slurry preparation water because of frozen waste material in the reservoir pits [41] or to apply winterized measures for the entire unit to assure a minimal internal temperature of 17 °C [50,52].
In Figure 2, the waste slurry and disposal unit are shown in detail, as well as all options for adequate deep underground disposal [53].
Figure 2. Waste slurry preparation and disposal unit.
In some situations, as in the case of oil and gas exploration and production waste injection in polarregions, it is necessary to heat up the waste slurry preparation water because of frozen waste materialin the reservoir pits [41] or to apply winterized measures for the entire unit to assure a minimal internaltemperature of 17 ◦C [50,52].
In Figure 2, the waste slurry and disposal unit are shown in detail, as well as all options foradequate deep underground disposal [53].
5. Waste Slurry
Waste slurry is a homogeneous mixture of different kinds of waste collected during drilling andwell completion activities (cuttings, used drilling fluids, contaminated rainwaters, scale, producedsands and clean up waste); water (regular or sea) and different additives [26,54]. Small amounts of

Minerals 2020, 10, 303 8 of 29
additional waste generated at the rig site like glass, paper, pallets, plastics, rope, etc. can also be groundup, mixed with the drilling waste slurry and injected in an appropriate geological formation. Althoughsuch additional waste in the waste slurry at small concentrations does not have a detrimental effecton the entire drilling waste injection process, especially in highly porous and permeable geologicalstrata, some problems may occur, such as a difficulty in shredding damp or wet material, clogging ofthe mechanical shredding unit, grinding of hard plastic to desired particles size or plugging of theinjection pumps, etc. [40].
The quality of the slurry waste is one of most important parameters in the slurry waste injection,and inadequate slurry waste design frequently leads to the particle settling and sagging [38]. From thispoint of view, the waste slurry rheology, especially viscosity, is the most important parameter in thedesign of waste slurry, and the general rule is that Marsh funnel viscosity should be between 70 and80 s [55]. Particle settling from the slurry suspensions is usually the result of poor slurry design, unlikesagging, which usually occurs in deviated wellbores because of Boycott´s effects in static, as well as indynamic, conditions. In both cases, the result is a significant variation of the injected slurry densitythrough the wellbore profile, especially in the part of wellbore with inclination ranging from 45◦ up to60◦. Particle settling can be accelerated by spontaneous shrinking of injected slurry and separationof the liquid phase (free water and light fluid) from the suspension through the process known assyneresis. Apart from affecting the particle settling and sagging, the waste slurry composition and,especially, rheological properties also affects fracture dimensions and propagation. This problem wasnoticed in the course of one of the first waste slurry injection projects (Celtic Project and the projectin the Cold Lake region) in Canada, where the vertical propagation of the fraction caused by theinjection of the mixture composed of waste slurry (produced sand and wastewater) and grap; thestable emulsion composed of water (from 40% up to 85%); fine-grade silicate minerals (clay, SiO2,etc.) and asphaltene-rich fraction of the heavy oil was observed. Mixing of the grap with the wasteslurry caused fracture sealing and decreasing permeability of the formation and, consequently, verticalfracture growth [37]. After the selection of appropriate waste slurry injection methods, it is necessaryto select a surface system for the waste slurry preparation and injection in the selected subsurfacegeological formation.
Particle size and concentration also affect the above-mentioned process and need to be maintainedat optimum values. The optimal particle size is between 2 µm and 350 µm, with volume concentrationsranging from 30% up to 40% for particles less than 150 µm or 20% for bigger particles [21,55]. Today,waste slurry usually contains particles whose dimensions are less than 300 µm in concentration of20–30% by waste slurry volume [51].
During the injection of waste slurry, several disposal fractures are created through high-pressurepumping [56]. After the pumping of the slurry, which comprises a certain percentage of solids in thetotal volume of the slurry, solids remain within the created fractures, while the liquid phase leaks intothe formation. Injected solids retained within the created fracture cause formation damage by forminginternal and external filter cakes, resulting in fracture propagations with every new injected batchvolume. Intensity of the formation damage depends on the pore throat size distribution and solid sizedistribution, as well as the viscosity of the liquid phase [32].
To avoid different problems which can jeopardize the entire waste injection process, it is necessaryto use one of the commercial fracture simulators to simulate the whole process and optimize differentparameters (injection rate, batch volume, fracture dimensions, etc.). One of the simulator outputparameters is the optional batch volume representing the sum of volumes of the fracture and theleak-off fluid and the maximum batch volume, which depends on the capacity of the drilling rig holdtank, as well as the selected injection rate and rate of cuttings slurry generation. It can be express bythe following equation [55]:
Vbatch max =Vht ×Qinj
Qinj −Qc(1)

Minerals 2020, 10, 303 9 of 29
where Vbatch max—maximum batch volume (m3), Vht—volume of the rig holding tanks (m3), Qinj—wasteslurry injection rate (m3/s) and Qc—rate of cuttings generation (m3/s).
The selected batch volume for an intermittent process must be less than optimal, as well as themaximum batch volume, because of safety and operation limits. The duration of one batch injectioncan range from few hours to few days and depends on the batch volume and injection rate [32,57].
The wellhead pressure during waste injection can be estimated by the following equation [58]:
pWHIP = pnet + pper f + pclos + pa/tub + ∆pbach − ph (2)
where pWHIP—wellhead injection pressure (Pa), pnet—net pressure (Pa), pperf—perforation pressure drop(Pa), pclos—initial fracture closure pressure (Pa), pa/tub—friction pressure drop in casing annulus/tubing(Pa), ∆pbach—pressure increase due to bach injection (Pa) and ph—hydrostatic head (Pa).
After each batch of the injected waste slurry, it is necessary to overflush the rest of the slurry fromthe wellbore and the near-wellbore region to prevent solids accumulation, plugging of the injectionwellbore and the deterioration of wellbore integrity. The overflushing is performed using solid-freewater or seawater at offshore operations and applying the viscous pill as a spacer between the injectedwaste slurry and overflushing fluid. According to the research conducted by Ji et al. [36], the viscouspill volume has more a conspicuous influence on slurry displacement efficiency from wellbore then itsviscosity. Gumarov et al. [33] also concluded that proper post-slurry overflushing effectively reducesin-situ stress increments after each waste slurry batch as a result of the propulsion of solids far awayfrom the wellbore. Properties of the disposal (and cleaning) fluids depend on the properties of thedisposal formation, especially if the disposal formation is shale where it is necessary to adopt disposalfluid salinity and density to prevent possible shale instability problems [55].
Table 3 summarizes the available data regarding properties of waste slurry injected in a convenientgeological formation during different projects conducted worldwide in the period from late-1980s untiltoday. Waste slurry injection parameters that were used worldwide in different injection projects in theperiod from late-1980s until today are shown in Table 4.
Table 3. Properties of injected waste slurry used in different injection projects.
ReferenceWaste SlurryPreparation
Properties of the Injected Waste Slurry
Type of Solid Waste
ParticleConcentration
(by % ofVolume)
InjectedVolume (m3)
Density(kg/m3)
Mahrous et al.[59] N/A Drilled cuttings and
discharged mud 10–20 95,867 1000–1200
Mohamed et al.[60]
N/A
Waste from oil and gasproduction 10–23
N/A N/AOrganic municipal waste 10–12
Waste from oil and gasproduction 5–12
Guo et al. [61] N/A N/A up to 20 N/A N/A
Romero et al.[62]
Grinding of cuttings upto particle diameter lessthan 175 µm and mixing
with produced water
Drilled cuttings, dischargedmud and waste water up to 20 33,231 1008–1272
Mehtar et al.[63]
Grinding of cuttings upto particle diameter lessthan 300 µm and mixing
with sea water and liquidwaste
Drilled cuttings, dischargedmud, slop and sea water 15–20 80,000 1200–1400
Xia et al. [64] Using of sea water forwaste slurry preparation
Drilled cuttings, water-basedand oil-based mud, cleaning
water10–25 168,436 1200–1250

Minerals 2020, 10, 303 10 of 29
Table 3. Cont.
ReferenceWaste SlurryPreparation
Properties of the Injected Waste Slurry
Type of Solid Waste
ParticleConcentration
(by % ofVolume)
InjectedVolume (m3)
Density(kg/m3)
Kunze et al.[65]
Mixture of drilledcuttings and producedwater, removing of the
particles with lowdispersibility
Drilled cuttings, water-basedmud and produced water 21 5928 1320
Fetsenets et al.[50]
Grinding of cuttings andmixing with water
Drilled cuttings, dischargedmud and waste water N/A 79,182 N/A
Gumarov et al.[33] N/A Drilled cuttings and
discharged mud 20 160,000 N/A
Ovalle et al.[66] N/A Drilling waste from reservoir
pit N/A 11,766 N/A
Arfie et al. [10]Mixture of drilled
cuttings and producedwater
Viscous oily fluids (oil, sandand water emulsions) 10–33 1,033,000 N/A
Reed et al. [67] Mixture of waste andproduced water
Drilled cuttings, producedsand, produced water, crude
oil (with low portion ofNORM)
20–70 469,002 N/A
Sipple-Srinivasanet al. [68]
Grinding ofcontaminated soil and
mixing with water
Contaminated soil (with highportions of clay) and
discharged mud10–35 2290 N/A
Sipple-Srinivasanet al. [21]
Mixing of waste withproduced water
Oily residue from bottom ofthe tanks N/A 45,000 1150–1210
Dusseault et al.[37]
Slop diluted withdoubled volume of the
produced waterSlop <3 3911 1020–1080
Moschovidiset al. [69]
Grinding of cuttings upto particle diameters lessthan 400 µm and mixing
with sea water
Fluid (usually water) usedfor rinsing of oily cuttings 4 >19,080
≈1200
Drilled cuttings, seawaterand 2% of oil 22 ≈54,060
Minton andSecoy [48]
Grinding of oily cuttingsup to particle diameters
less than300 µm and mixing with
sea water
Oily drilled cuttings N/A N/A N/A
Willson et al.[70]
Grinding of cuttings andmixing with sea water
Oil-based mud, oily drillcuttings ≈15 22,187 1170–1430
Abou-Sayedet al. [71] N/A
Waste crude oil, acids,unused proppant, dischargedmud, residue from bottom of
the tanks
N/A 318,000 N/A
Table 4. Waste slurry injection parameters used in different injection projects.
Reference Duration of WasteInjection
Type ofInjection Way of Injection Injection
Pressure (MPa)Flow Rate
(m3 per Day)
Mahrous et al.[59] 14 mounts Tubing
injection N/A Maximum 34.5 N/A
Mohamed et al.[60]
January2012–December 2015
Tubinginjection
Intermittent (batch volume 16–480m3) 6.9 900–1150
December 2015–June2017
Intermittent (batch volume 1270–1590m3) 19 1800–2300
January 2012–March2018
Intermittent (batch volume 795–1590m3) 9.5 2300–2750
Guo et al. [61] 10 February 2016–25January 2017
Tubinginjection
Intermittent (12 h of batch slurryinjection) with water flushing before
and after injection10.3–16.7 Maximum 2750

Minerals 2020, 10, 303 11 of 29
Table 4. Cont.
Reference Duration of WasteInjection
Type ofInjection Way of Injection Injection
Pressure (MPa)Flow Rate
(m3 per Day)
Romero et al.[62]
June 2014–December2015
Tubinginjection
Intermittent (12 h of batch slurryinjection) with water flushing before
and after injection12.4–13.8 916
Mehtar et al.[63] N/A Tubing
injection
Intermittent (batch volume 48 m3)with maximum 4 h delay between
two batches of slurry injection10.7–11.2 1150
Xia et al. [64] February 2012–April2014
Tubinginjection
Intermittent, with 3–4 h delaybetween two batches of slurry
injection and flushing with sea waterbefore and after injection
17.2 1603
Kunze et al.[65]
13 October 2010–31March 2011
Tubinginjection
Intermittent (18 h of batch slurryinjection) with injection of 0.8 m3 of
viscous pill before waste slurryinjection and 16 m3 water after
injection
3.2–5.6 1227–1479
Fetsenets et al.[50] October 2008–July 2009 Tubing
injection N/A 12 318
Gumarov et al.[33]
January 2008–August2008
Tubinginjection
Intermittent and flushing with water(1.5 × tubing capacity) after injection
to prevent cuttings settling
22.8–33.1 up to 1150
November2007–January 2008 15.2–26.9 N/A
June 2008–November2008 15.2–31.7 up to 1360
Ovalle et al.[66] N/A Tubing
injection N/A Maximum 12.1 N/A
Arfie et al. [10] December 2002–March2005 N/A
Intermittent (duration of injection9–10 h per day) with 14 h delaybetween two batches of slurry
injection
5.5 N/A
Reed et al. [67]November 1997–May
1998Tubing
injectionIntermittent (duration of injection
9–11 h) with 13–15 h delay betweentwo batches of slurry injection
24.7–27.21832–3663
June 1998–March 2000 23.1–25.5
Sipple-Srinivasanet al. [68]
31 August 1997–21September 1997
Tubinginjection
Intermittent (duration of injection 6–8h) with 12 h delay between two
batches of slurry injection and 2 h offlushing with water
N/A 2290–2748
Sipple-Srinivasanet al. [21]
30 December 1996–14April 1997
tubinginjection N/A N/A 1584–2160
Dusseault et al.[37]
22 April 1996–15 May1996 Tubing
injection
Intermittent (duration of injection 12h) with 10 h delay between two
batches of slurry injection and 2 h offlushing with water
8 57.623 May 1996–11September 1996
Moschovidiset al. [69]
1 January 1990–13January 1992 Tubing
injectionIntermittent (more than 100 batches
with volume 160–480 m3)
Maximum 31N/A
January1992–December 1993 Maximum 28.3
Minton andSecoy [48] N/A Annular
injectionIntermittent (only three batches
injected) 5.2 570–900
Willson et al.[70]
30 July 1991–5November 1992
Annularinjection Intermittent (batch volume 32–64 m3) 6.2–11 870–2518.6
Abou-Sayedet al. [71] N/A Tubing
injection Intermittent Maximum 9.7 916–1832
6. Criteria for the Injection Zone Selection and Characterization
The most important parameters for determining a suitable slurry fracture injection site arepermeability, porosity, reservoir thickness, depth and structural geology characteristics of the area.Their values for successful waste injection are shown in Table 5. An equally important parameter inthe selection of suitable geological formations for the waste injection above the fracture pressure is the

Minerals 2020, 10, 303 12 of 29
fracture containment mechanism, which ensures that the created fracture will not extend beyond theinjection formation borders.
Table 5. The most important parameters and their values for a successful waste injection [72,73].
Parameter Value of Parameter
Reservoir thickness More than 2 mCap rock thickness 4 times higher than reservoir thickness
Permeability Between 10 × 10−3 µm2 and 10,000 × 10−3 µm2
Reservoir depth Between 200 and 3000 mStructural setup Intermediate or simple
Sand-shale sequence Few layers
According to Guo et al. [23], there are three basic fracture containment mechanisms (barriers):stress barrier (existing of a formation above the injection zone with the higher fracture pressure),permeability barrier (existing of a high permeability formation above the injection zone with the lowerfracture pressure) and modulus barrier (existing of a formation above the injection zone with the higherelastic modulus). An ideal stress barrier is the salt formation because of a higher fracture pressuregradient in comparison with the injection formation, while the ideal modulus barrier is provided bythe existing limestone formation. All above-mentioned formations, such as salt, limestone or highlypermeable formations, are not difficult to recognize in the lithological profile, especially in well-knownareas with a large quantity of geological data.
Saif ud Din et al. [74] have taken into consideration some other parameters, putting an emphasison the geological aspects and environmental considerations of a slurry fracture injection (Table 6).They use the same values for most parameters as those mentioned in Table 5, but some of them aresomewhat different, such as reservoir thickness, which should be more than 5 m. Additionally, porosityof the target zone should be higher than 15%.
Table 6. Criteria for site suitability of an slurry fracture injection operation [74].
Geological Criteria Environmental Criteria
Parameter Value of Parameter Parameter Value of Parameter
Reservoir thickness More than 5 m Economic value of formation LowCap rock thickness More than 10 m Urban/industrial development Far
Permeability from 10 × 10−3 µm2 to 1000 × 10−3 µm2 Impact on vegetation Nil—minimalPorosity More than 15% Micro-climatic impact Reduction in temperature
Reservoir depth Between 200 and 3000 m Land use/landcover ReclamationStructural complexity Undeformed or simple Micro-elevation changes Infinitesimal
Lithology Intercalated sand-shale Transportation Short distanceReservoir strength Intermediate–weak - -
Groundwater source No source nearby - -
During waste injection, an abnormally high pore pressure can occur. Therefore, it is importantthat the induced pressure at a short distance from the injection zone rapidly decreases to a normal levelafter each injection interval. Permeability is the most important factor that affects the rapid reductionof pressure, and if its value is greater than 10,000 × 10−3 µm2, the rapid leak-off (bleed-off) occurs,and such a well is not a good candidate for waste disposal [73]. Low porosity always implies a lowerwaste disposal capacity and more difficulty in compressing rock mass to achieve the required capacity,making it much more difficult to achieve a long-term stable waste disposal site. Waste injection intodeep formations requires minimal vertical migration outside the disposal zone, whereby it is essentialto have a low permeable cap rock such as a shale. This is particularly important in cases wheresandstone is selected for the target zone.
The injection zone must be isolated from potable water aquifers and away from any location ofeconomic interest, such as oil and gas fields or mines. The injection wells must be equipped withsurface casing cemented to the wellhead to protect low salinity aquifers near the surface through which

Minerals 2020, 10, 303 13 of 29
the well is drilled [11]. The distance from potable water aquifers is almost always directly related tothe depth, since most aquifers are not more than 200 m deep [75].
There is a number of different laboratory and field techniques and tests for the characterization ofthe disposal domain [76] (Figure 3).
Minerals 2020, 10, x FOR PEER REVIEW 13 of 29
Reservoir strength Intermediate–weak - - Groundwater
source No source nearby - -
During waste injection, an abnormally high pore pressure can occur. Therefore, it is important that the induced pressure at a short distance from the injection zone rapidly decreases to a normal level after each injection interval. Permeability is the most important factor that affects the rapid reduction of pressure, and if its value is greater than 10,000 × 10−3 μm2, the rapid leak-off (bleed-off) occurs, and such a well is not a good candidate for waste disposal [73]. Low porosity always implies a lower waste disposal capacity and more difficulty in compressing rock mass to achieve the required capacity, making it much more difficult to achieve a long-term stable waste disposal site. Waste injection into deep formations requires minimal vertical migration outside the disposal zone, whereby it is essential to have a low permeable cap rock such as a shale. This is particularly important in cases where sandstone is selected for the target zone.
The injection zone must be isolated from potable water aquifers and away from any location of economic interest, such as oil and gas fields or mines. The injection wells must be equipped with surface casing cemented to the wellhead to protect low salinity aquifers near the surface through which the well is drilled [11]. The distance from potable water aquifers is almost always directly related to the depth, since most aquifers are not more than 200 m deep [75].
There is a number of different laboratory and field techniques and tests for the characterization of the disposal domain [76] (Figure 3).
Figure 3. Disposal domain characterisations.
Table 7 summarizes the available data regarding formations selected for deep underground waste slurry injection projects worldwide in the period from the late-1980s until today.
Figure 3. Disposal domain characterisations.
Table 7 summarizes the available data regarding formations selected for deep underground wasteslurry injection projects worldwide in the period from the late-1980s until today.

Minerals 2020, 10, 303 14 of 29
Table 7. Characteristics of the disposal formations.
Reference Service Company Location
Characteristic of the Disposal Formation
Type of Rock Depth (m) Permeability(µm2)
Porosity(-)
FormationFracture PressureGradient (kPa/m)
Depth ofPerforation or
AnnularInjection (m)
Cap Rock
Mahrous et al.[59] Halliburton Sakhalin, Russia N/A N/A N/A N/A N/A N/A N/A
Mohamedet al. [60]
Advantek WasteManagement
ServicesN/A Sandstone
1670–1710 0.35–3.5 0.25 10.1N/A N/A1380–1460 0.3–0.5 0.26 10.1
1900–1950 0.05–0.1 0.17 9.1
Guo et al. [61]Advantek Waste
ManagementServices
Texas, USASandstone
interbeddedwith shale
1950–2030 0.0001–0.105 0.185–0.259 17.2–18.1 N/A Tick shale layer
Romero et al.[62]
Halliburton/Petroamazonas
Apaika-NenkeField, Ekvador N/A N/A N/A N/A 12.9 N/A N/A
Mehtar et al.[63] M-I Swaco Abu Dhabi, UAE Limestone 1315–1390 N/A N/A 17.7–19 N/A Dolomite and limestone
Xia et al. [64]Terralog
Technologies Inc.,Saudi Aramco
Manifa, SaudiArabia Sandstone 1827–1994
(MD) 2.24 0.24 N/A 1981–1990 Shale and sandstone alteration
Kunze et al.[65] ExxonMobil Colorado, USA Sandstone 1684–1752
(MD) N/A N/A N/A 1710–1725 N/A
Fetsenets et al.[50]
Gazpromneft-Khantos/M-I Swaco
Western Sibir,Russia N/A ≈1300 and
1700 N/A N/A N/A N/A N/A
Gumarov et al.[33] M-I Swaco Caspian Sea Mudstone N/A N/A N/A N/A N/A N/A
Ovalle et al.[66] M-I Swaco South America Sandstone 1401 N/A N/A N/A 1401–1408 Limestone
Arfie et al.[10]
TerralogTechnologies Inc. Duri, Indonesia Unconsolidated
sandstone383 N/A N/A N/A 380–389
Shale418 419–430

Minerals 2020, 10, 303 15 of 29
Table 7. Cont.
Reference Service Company Location
Characteristic of the Disposal Formation
Type of Rock Depth (m) Permeability(µm2)
Porosity(-)
FormationFracture PressureGradient (kPa/m)
Depth ofPerforation or
AnnularInjection (m)
Cap Rock
Reed et al.[67] Chevron Louisiana, USA Sandstone 1341–1524 0.5–2.0 0.23
16.5–18.1 1512–1524 Shale and sand alteration(thickness of the layers
3–45 m)17.4–19.5 1378–1390
Sipple-Srinivasanet al. [68]
TerralogTechnologies Inc.
West Coyote,California
Depleted oilreservoir 1250 0.5 0.3 5.2 1237–1264 Shale (969–1189 m)
Sipple-Srinivasanet al. [21]
TerralogTechnologies Inc.
Saskatchewan,Canada N/A N/A N/A N/A N/A N/A N/A
Dusseaultet al. [37]
TerralogTechnologies Inc. Alberta, Canada Sandstone 732–752 0.5 0.27 17.5–19.5 745.5–748.5 Low permeability shale
(454–717 m)
Moschovidiset al. [69] Amoco Valhall,
The North SeaSiltite (shale) 2395 N/A N/A ≈13.6 N/A Shale
2467
Minton andSecoy [48]
BP ExplorationOperating Co.
Offshore platformClyde, The North
SeaShale 760–1720 N/A N/A N/A 760 N/A
Willson et al.[70] BP Norway
Offshore platformGyda, The North
Sea
Mudstone(shale) 900 N/A N/A 10.2 900 Sandstone interbedded with
shale (250–400 m)
Abou-Sayedet al. [71]
ARCO Oil & GasInc.
Prudhoe Bay,Alaska
Sandstone andgravel ≈650 1–2 N/A 18.5–19.2 N/A 30 m of shale and permafrost
up to surface

Minerals 2020, 10, 303 16 of 29
7. Disposal Domain Characterization during the Planning and Executing Phase of UndergroundWaste Disposal
The main task of engineers is the characterization and visualization of the waste disposal domain,especially during waste injection above the fracture pressure of the disposal formation and predictionwith some certainty of the fracture geometry (height and length). Disposal of the waste from drillingactivities through a slurry injection into a suitable geological formation is very similar to the hydraulicfracturing as a method for reservoir stimulation, as well as to the lost circulation as a common problemduring well drilling [57]. Due to that, for the purpose of numerical simulations and modeling ofdownhole waste slurry injection, commercial hydraulic fracture stimulators were used [25]. Similarityand differences between these two downhole injection methods in the oil and gas industry arepresented in Table 8. As in the case of a reservoir stimulation through hydraulic fracturing, the qualityof the created model and simulation strongly depends on accessibility and reliability of geologicaland operational information, as well as its improvement with additional information during theimplementation of the project [26,77]. The required input information about the geological formationwhich is being considered for waste slurry injection can be obtained from wireline logs, well testingor through special petrophysical laboratory methods applied to core samples with reference to theirreliability [39]. Guo et al. [16] suggest the probabilistic approach for the assessment of the risk andcontainment of injected waste slurry, while Okorodudu et al. [57] propose using a three-dimensionalhydraulic simulator because of its capability to predict fracture geometry with more confidence througha simulation of single/multiple fractures, visualization capability, ability to achieve a more accurateresult using less assumptions and assess risks based on a probabilistic model.
Table 8. Comparison between reservoir stimulations by fracturing and underground drilling wasteinjection above the formation fracture pressure [2,35].
Per Well Site Stimulation(Hydraulic Fracturing)
Waste Injection(Above Formation Fracturing Pressure)
Batch volume (m3) 160–800 8000–800,000Injection rate (m3/s) 0.0265–0.265 0.00265–0.053
Treatment time Hours Weeks, months or yearsFluid type Crosslinked guar Bentonite mud, xanthan gum
Viscosity (P·s) 0.2 0.002–0.08
Solid type and size (m) Proppant (1680 × 10−6/1000 × 10−6–841 × 10−6/420 × 10−6)or (12/18–20/40 mesh)
Cutting (less than 300 × 10−6 m)or (less than 40 mesh proppant)
Concentration (vol%) 10–30 Most <10
The information provided in Table 8 is average and based on field experience. There are manyexamples that exceed these numerical values by several orders of magnitudes. For examples, one ofthe largest underground drilling waste injection projects was realized in Alaska by the end of 2002,with more than 2.5 million cubic meters of slurry waste injected per well [19].
Fracture propagation is governed by the mechanical properties of the injection zone andsurrounding formations. During slurry injection, surface injection pressure must be carefully observed,considering that undesirable or rapid injection pressure build-up could jeopardize the operational lifeof an injection well and limit its waste disposal capacity [33]. Usually, the waste disposal domain in aslurry fracture injection is idealized with a “wagon-wheel” uniform multi-fracture domain (Figure 4a),with multiple fractures of uniform width or uniform strain [56]. Despite this assumption, Ji et al. [51]and Shokanov et al. [78] found that a “wagon-wheel” multi-fracture disposal domain is not a generalcase in slurry injection, and in some cases, it is more likely to reopen the existing fracture and increaseit or make a branch from it than to create a new fracture with a different azimuth (Figure 4b,c). Willsonet al. in 1999 [25] conducted a comprehensive laboratory research related to the fracture formation indifferent types of rocks and observed a formation of multiple fractures in the majority of examinedrock (formation) samples as a result of an intermittent injection process. The appearance of formationdamage during the batch slurry waste injection and consequent change of the formation leak-off
properties can directly affect the fracturing process and propagation of the disposal domain. If a

Minerals 2020, 10, 303 17 of 29
new fracture or branch is created with each newly injected batch volume, the leak-off propertiesand the formation damage will depend on the proportion of the formation damage from previousinjections [57]. Based on a large number of data from eight projects in the USA and Canada and thepublished information, Bruno et al. concluded that, in large-scale injection projects, multiple fracturesare likely to occur as a result of reduction in the fracture conductivity in combination with a stressincrease within the waste pod. Additionally, with every newly injected volume during the intermittentinjection process, a new fracture will be created with a variation in azimuth between 30◦ and 60◦
compared to the previous one [22].
Minerals 2020, 10, x FOR PEER REVIEW 17 of 29
research related to the fracture formation in different types of rocks and observed a formation of multiple fractures in the majority of examined rock (formation) samples as a result of an intermittent injection process. The appearance of formation damage during the batch slurry waste injection and consequent change of the formation leak-off properties can directly affect the fracturing process and propagation of the disposal domain. If a new fracture or branch is created with each newly injected batch volume, the leak-off properties and the formation damage will depend on the proportion of the formation damage from previous injections [57]. Based on a large number of data from eight projects in the USA and Canada and the published information, Bruno et al. concluded that, in large-scale injection projects, multiple fractures are likely to occur as a result of reduction in the fracture conductivity in combination with a stress increase within the waste pod. Additionally, with every newly injected volume during the intermittent injection process, a new fracture will be created with a variation in azimuth between 30° and 60° compared to the previous one [22].
Figure 4. Different models for the characterization of a disposal domain.
There is also a possibility of the creation of a horizontal fracture during a fracture waste injection if overburden stress is or becomes less stressed because of horizontal maximum and minimum stress alterations in the disposal zone. In this situation, regardless of the principle stress state around the cased cemented hole, the first fracture is vertical, and after that, it changes direction in the horizontal plain (“T” shape fracture). If a previous simulation indicates the possibility for the creation of a horizontal fracture at any moment, special attention should be paid to the possibility of fracture propagation up to the surface or the seabed through branching because of the decrease of overburden stress [2,79].
No matter which of the above theories is correct, waste slurry injection inevitably leads to changes in local in-situ stress, regardless of the formation that has been selected for injection. Injected waste changes the local stress through three basic mechanisms [27,32,33]:
• increasing the local in-situ stress as a result of filling the formation with injected material. • thermal alteration of the local stress as a result of temperature dilatation during and after waste
injection. These alterations are consequences of cold slurry injection within subsurface formations with certain constant temperatures.
• In-situ local stress changes as the result of a pore pressure increase and poro-elastic effect.
Except the local in-situ stress and their changes during slurry injection, the creation of a new fracture strongly depends on the stress anisotropy, especially in deviated wells.
Slurry fracture injection at pressures above the formation fracture pressure is usually used for the disposal of large quantities of waste generated during the drilling and completion phase into sandstones of relatively high porosity. On the other hand, the injection of the same slurry waste in soft formations is still relatively unexplored and usually results in various downhole problems, such as a casing collapse because of excessive movement of the soft formation and permanent
Figure 4. Different models for the characterization of a disposal domain.
There is also a possibility of the creation of a horizontal fracture during a fracture waste injectionif overburden stress is or becomes less stressed because of horizontal maximum and minimum stressalterations in the disposal zone. In this situation, regardless of the principle stress state around the casedcemented hole, the first fracture is vertical, and after that, it changes direction in the horizontal plain(“T” shape fracture). If a previous simulation indicates the possibility for the creation of a horizontalfracture at any moment, special attention should be paid to the possibility of fracture propagation upto the surface or the seabed through branching because of the decrease of overburden stress [2,79].
No matter which of the above theories is correct, waste slurry injection inevitably leads to changesin local in-situ stress, regardless of the formation that has been selected for injection. Injected wastechanges the local stress through three basic mechanisms [27,32,33]:
• increasing the local in-situ stress as a result of filling the formation with injected material.• thermal alteration of the local stress as a result of temperature dilatation during and after waste
injection. These alterations are consequences of cold slurry injection within subsurface formationswith certain constant temperatures.
• In-situ local stress changes as the result of a pore pressure increase and poro-elastic effect.
Except the local in-situ stress and their changes during slurry injection, the creation of a newfracture strongly depends on the stress anisotropy, especially in deviated wells.
Slurry fracture injection at pressures above the formation fracture pressure is usually used forthe disposal of large quantities of waste generated during the drilling and completion phase intosandstones of relatively high porosity. On the other hand, the injection of the same slurry waste in softformations is still relatively unexplored and usually results in various downhole problems, such as acasing collapse because of excessive movement of the soft formation and permanent pressurizationand filling of the injection zone or spreading of the injected waste slurry out of target formation [22].Although soft formations have large storage capacities, fracture modeling is always challenging,because the relationships between pressure and fracture widths are different in comparison with hardformations. Abou-Sayed et al. [32] found that fractures with branches and channels are occurring

Minerals 2020, 10, 303 18 of 29
during slurry waste injections into the soft formation above the fracture pressure. Waste from oiland gas exploration and production activities can also be injected into salt caverns as waste slurryinjection below the formation fracture pressure. This concept has been continuously developed andresearched since 1990 but with limited applications in the North American region, mostly because ofstate regulations and rules.
Slurry waste can be injected in vertical, deviated and horizontal wells. Although the approach toslurry injection and the process itself are similar, Zaki et al. [58] found that the disposal domain formedby a batch injection of slurry waste through a horizontal well is different from the disposal domainformed during injection of the same waste trough a vertical or slightly deviated wellbore. This is theresult of the wellbore position in regards to the injection zone and dynamic field stress distributionalong the horizontal part of the wellbore.
8. Injection Well Integrity
During drilling waste injection, it is necessary to ensure both the internal and the externalmechanical integrity of the injection wells. According to regulations provided by the US EnvironmentalProtection Agency, the injection well is considered to possess mechanical integrity if there is nosignificant leakage in the pipes installed inside the wellbore (tubing or casing) or on the packer andif there is no significant injected fluid movement behind the wellbore to the underground sourcesof drinking water [80]. Well integrity of the offset well within the radius of 600 m from the injectionwell site is also important to prevent possible unwanted movements of the injected waste outside theinjection formation and the contamination of underground sources of drinking water. According tothe research conducted by Bruno et al. [22], almost all contamination during the waste slurry injectionprocess is the result of communication through an adjacent offset well because of a poor primarycementation. Some authors provide special recommendations for injection well drilling and completiondesign to meet the requirements of the slurry injection process itself and to ensure mechanical andhydraulic integrity. For example, during the planning phase for an oily waste slurry injection at theDuri Oil Field, engineers have special technical requirements for injection well drilling and completiondesign, considering specific characteristic of the selected geological formation (larger diameter of adrilled hole with regards to selected casing to ensure a thicker cement sheath, drilling rate of a holewhose minimum length is 75 m to accept any formation sand intake and deep perforation to ensurebetter communication between the injection well and selected formation) [10]. In some areas like theNorth Slope of Alaska with a permanently frozen ground and without sources of drinking water, thereis no possibility of ground water contamination [9,31,47].
The injected waste can leak out of the disposal zone through an inappropriately plugged wellbore,microchannels beyond the casing, fracture that intersects another wellbore, faulted zone or overcomethe disposal zone sealing layer (cap rock), etc. (Figure 5).

Minerals 2020, 10, 303 19 of 29Minerals 2020, 10, x FOR PEER REVIEW 19 of 29
Figure 5. Possible injected waste migration pathways [81].
9. Injection Process Monitoring
One of the most important engineering tasks in downhole waste slurry injection is to provide a permanent retention of injected waste within the disposal domain and prevent any unwanted movement of waste back to the surface or up to subsurface sources of drinking water.
Although deep subsurface waste injection is proven to be an environmental acceptable disposal option for waste from oil and gas exploration and production activities, the possibility of severe impacts on the environment still exist. This possibility stems from inappropriate process designs, lack of data and inadequate engineering practices, as well as poor project implementation and lack of systematic surveillance. The existence of natural faults in the vicinity of injection wells can represent possible pathways for injected waste migration upward towards the top of the fault or to the surface if the injection process and created fractures caused its reactivation. Shen et al. [82] suggest using numerical and analytical/semi-analytical methods for simulation of the reactivation process for a specific fault, where the first one is more useful because of its simplicity. Based on their simulations and the developed of a numerical geomechanical model, it was possible to predict fault reactivation in the vicinity of an injector well during deep waste injection offshore of West Africa. They strongly suggest direct or indirect pore pressure monitoring at the fracture/fault intersection point during the injection process to minimize the risk of fault reactivation. According to Lele et al. [83] and Liu et al. [84], hydraulic fracturing, which is a reservoir stimulation method, causes microseismic events with magnitudes from 2 to 3, though microseismic events with the magnitudes higher than 2.5 are really rare. It is to be expected that similar microseismic events would occur also during deep underground waste injection above the formation fracture pressure, but it does not mean that a consequence of this action is the appearance of an earthquake [85]. Injection of wastewater from a reservoir stimulation and hydrocarbon production from an unconventional reservoir also results in seismic activity [86]. The aforementioned microseismic events, caused by the injection process itself or naturally occurring
Figure 5. Possible injected waste migration pathways [81].
9. Injection Process Monitoring
One of the most important engineering tasks in downhole waste slurry injection is to providea permanent retention of injected waste within the disposal domain and prevent any unwantedmovement of waste back to the surface or up to subsurface sources of drinking water.
Although deep subsurface waste injection is proven to be an environmental acceptable disposaloption for waste from oil and gas exploration and production activities, the possibility of severe impactson the environment still exist. This possibility stems from inappropriate process designs, lack of dataand inadequate engineering practices, as well as poor project implementation and lack of systematicsurveillance. The existence of natural faults in the vicinity of injection wells can represent possiblepathways for injected waste migration upward towards the top of the fault or to the surface if theinjection process and created fractures caused its reactivation. Shen et al. [82] suggest using numericaland analytical/semi-analytical methods for simulation of the reactivation process for a specific fault,where the first one is more useful because of its simplicity. Based on their simulations and the developedof a numerical geomechanical model, it was possible to predict fault reactivation in the vicinity ofan injector well during deep waste injection offshore of West Africa. They strongly suggest direct orindirect pore pressure monitoring at the fracture/fault intersection point during the injection processto minimize the risk of fault reactivation. According to Lele et al. [83] and Liu et al. [84], hydraulicfracturing, which is a reservoir stimulation method, causes microseismic events with magnitudesfrom 2 to 3, though microseismic events with the magnitudes higher than 2.5 are really rare. It isto be expected that similar microseismic events would occur also during deep underground wasteinjection above the formation fracture pressure, but it does not mean that a consequence of this actionis the appearance of an earthquake [85]. Injection of wastewater from a reservoir stimulation andhydrocarbon production from an unconventional reservoir also results in seismic activity [86]. The

Minerals 2020, 10, 303 20 of 29
aforementioned microseismic events, caused by the injection process itself or naturally occurringevents, can result in unwanted movement of disposed waste upwards towards the surface. Since theinjected waste from drilling activities may contain certain amounts of oily cuttings, oil-based muds,lubricants, heavy metal ions, etc., its movement up towards the surface can have tremendous unwantedeffects on underground sources of drinking water and the environment in general [87].
Monitoring of the slurry waste injection process can be accomplished through active single-wellmonitoring of the injection process (injection rate and pressure, injected volume and slurryrheology); downhole monitoring (radioactive tracers, bottomhole tilt meters, temperature survey andelectromagnetic measurements); testing formation response (measurement of bottom hole pressure)and remote unconventional monitoring by microseismic or surface deformation (surface tilt meters)or from adjacent wells (multiple well methods) [21,39,41]. Except surface and bottomhole pressuremonitoring, all other methods provide limited data or are applicable in certain periods of time, andsome of them, like microseismic and tilt meters, are too expensive and limited to large-scale projects [39].Microseismic is a pretty accurate method for defining the main fracture and its propagation but with alimited possibility of the differentiation in downhole seismic events from different sources (for example,propagation of the same fracture or creation of branches and fissures). This problem can be eliminatedby adding different materials which create noise (detonation) in the main fracture during the injectionor shut-in period [26]. Utilization of different radioactive tracers in waste slurry and an appropriatelogging program may be very useful in the determination of the disposal domain, especially in thedetermination of injection points and their changes during the lifetime of the project [40].
Pressure changes during the injection of one batch’s volume is presented in Figure 6. Despite theflow being constant, the injection pressure may vary for a given value during the slurry waste injectionbecause of the fracture’s growth change, change in local in-situ stress and disposal of solids withinthe formation. Fracture growth and thermal changes during the injection of cooler waste slurry willcause the decrease of injection pressure, while pore pressure increases, and solid storage within theformation has a completely opposite effect on injection pressure.
Minerals 2020, 10, x FOR PEER REVIEW 20 of 29
and hydrocarbon production from an unconventional reservoir also results in seismic activity [86]. The aforementioned microseismic events, caused by the injection process itself or naturally occurring events, can result in unwanted movement of disposed waste upwards towards the surface. Since the injected waste from drilling activities may contain certain amounts of oily cuttings, oil-based muds, lubricants, heavy metal ions, etc., its movement up towards the surface can have tremendous unwanted effects on underground sources of drinking water and the environment in general [87].
Monitoring of the slurry waste injection process can be accomplished through active single-well monitoring of the injection process (injection rate and pressure, injected volume and slurry rheology); downhole monitoring (radioactive tracers, bottomhole tilt meters, temperature survey and electromagnetic measurements); testing formation response (measurement of bottom hole pressure) and remote unconventional monitoring by microseismic or surface deformation (surface tilt meters) or from adjacent wells (multiple well methods) [21,39,41]. Except surface and bottomhole pressure monitoring, all other methods provide limited data or are applicable in certain periods of time, and some of them, like microseismic and tilt meters, are too expensive and limited to large-scale projects [39]. Microseismic is a pretty accurate method for defining the main fracture and its propagation but with a limited possibility of the differentiation in downhole seismic events from different sources (for example, propagation of the same fracture or creation of branches and fissures). This problem can be eliminated by adding different materials which create noise (detonation) in the main fracture during the injection or shut-in period [26]. Utilization of different radioactive tracers in waste slurry and an appropriate logging program may be very useful in the determination of the disposal domain, especially in the determination of injection points and their changes during the lifetime of the project [40].
Pressure changes during the injection of one batch’s volume is presented in Figure 6. Despite the flow being constant, the injection pressure may vary for a given value during the slurry waste injection because of the fracture’s growth change, change in local in-situ stress and disposal of solids within the formation. Fracture growth and thermal changes during the injection of cooler waste slurry will cause the decrease of injection pressure, while pore pressure increases, and solid storage within the formation has a completely opposite effect on injection pressure.
Figure 6. Pressure development during the waste slurry injection. Figure 6. Pressure development during the waste slurry injection.

Minerals 2020, 10, 303 21 of 29
10. Abandonment and Plugging of Injection Wells
The final task in the injection of waste from drilling activities is proper plugging and abandonmentof the injection well, including well preparation and plugging. Injection well preparation phaseincludes cleaning of the well and establishing static equilibrium with proper density of the mud weightto prevent inflow of different fluids or gases into the wellbore. The inflow of fluids or gases into thewellbore during the well-plugging process and setting of the cement plug may have detrimental impactson the quality of the cement plug, as well as the quality of the entire injection well-plugging process.
The injection well-plugging process can be done in two ways: filling the whole borehole withcement slurry or setting cement plugs at different, previously determined depths by applying some ofthe cement plugs setting techniques, known in the petroleum industry as the balance method, cementretainer method or two-plug method. According to the survey that was conducted early in the 1980sin the United States of America and ordered by the U.S. Environmental Protection Agency, only 15% ofabandoned wells were cemented from the top down to the bottom [88].
Although immediate well plugging and abandonment activities are recommended when projectrequirements and tasks have been fulfilled, prolongation of this process can be useful for many reasons.Some alternatives to immediate well plugging and abandonment may be setting the time period forrenewing operations or abandonment, mechanical integrity test, self-reporting and monitoring waterlevels or aquifers. Their advantages and disadvantages are presented in Table 9.
Table 9. Different alternatives to immediate plugging and abandonment of an injection well [88].
Alternatives Advantage Disadvantage
Set time period for renewingoperations or abandoning
Reduces potential for operator’seconomic loss; assures eventual
closing by setting plugging date; cansupplement reporting, testing or
monitoring requirements
Imposes higher surveillance workload thanimmediate abandonment; marginally
increases possibility of improperabandonment
Mechanical integrity test
Identifies well deterioration, whichrequires immediate abandonment; can
supplement other alternatives;reduces potential for economic loss
Requires periodic testing, which mayimpose significant cost; increases the
likelihood of improper abandonment if notaccompanied by specific abandonment date
Self-reporting
Keeps agency informed of welllocation, ownership and status;
reduces potential for economic loss;can supplement other alternatives
Increases regulatory agency surveillanceworkload; increases likelihood of improper
abandonment
Monitoring of water level oraquifer
Can provide useful scientific data;reduces potential for loss of
recoverable energy or minerals
Can be costly, does not provide data onenvironmental impacts of improperabandonment; creates burdensome
surveillance workload; increases likelihoodof improper abandonment
11. Discussion and Conclusions Remarks
Petroleum industry through oil and gas exploration and production activities generates largeamounts of different wastes which must be disposed of in a safe manner, with minimum environmentalimpacts and without any influence on human health. Most of this waste is made up from drilledcuttings, discharged muds and produced water, and its quantities depend on activities in a certainyear. Over the decades, produced reservoir water has been constantly and permanently disposed ofthrough underground injection in the same reservoir where it came from, with the positive impact ofkeeping the reservoir pressure. Waste, generated through well-drilling and completion activities, canbe permanently disposed of using different available techniques whose selection primarily depends onstate or country regulations and legislature and the availability of certain waste disposal methods in anarea, as well as waste kinds and quantities.
With the new regulations and growing concerns for the environment, operators make additionalefforts to meet the new standards and requirements. This is especially important in the case of the

Minerals 2020, 10, 303 22 of 29
development of new oil and gas fields in environmentally sensitive areas, onshore and offshore. Inthat regard, the operators try to minimize generated waste volume through recycling and reusing andselecting the best available methods for permanent waste disposal.
Since the 1990s, when it became widely used, deep downhole injections of waste generated bydrilling activities, as well as other wastes from oil and gas exploration and production activities,positioned itself as the leading technology for permanent waste disposal. Despite large numbers ofdifferent ongoing and past deep underground waste slurry injection projects, there is limited andincomplete information about them. As can be seen from Tables 4, 5 and 7, information is mostlyavailable through conference papers and provided by service companies that ensure technology andtechnical support for the project on an operator’s site. Although the data collected is limited andincomplete, some general statements can be made, because it covers the period from the beginningup until today. Based on the data presented in Figure 7, it can be concluded that the majority ofwaste is injected in sandstone formations (67% of all analyzed projects), followed by mudstoneand shale formations (13% each) and, finally, in limestone formations (7%) (Figure 6). Despite thefact that sandstone represents the best choice for deep underground waste disposal by injection,selection of an appropriate formation is more complex. The data obtained are in direct correlation withrecommendations and general information provided in this paper.
Minerals 2020, 10, x FOR PEER REVIEW 22 of 29
With the new regulations and growing concerns for the environment, operators make additional efforts to meet the new standards and requirements. This is especially important in the case of the development of new oil and gas fields in environmentally sensitive areas, onshore and offshore. In that regard, the operators try to minimize generated waste volume through recycling and reusing and selecting the best available methods for permanent waste disposal.
Since the 1990s, when it became widely used, deep downhole injections of waste generated by drilling activities, as well as other wastes from oil and gas exploration and production activities, positioned itself as the leading technology for permanent waste disposal. Despite large numbers of different ongoing and past deep underground waste slurry injection projects, there is limited and incomplete information about them. As can be seen from Tables 4, 5 and 7, information is mostly available through conference papers and provided by service companies that ensure technology and technical support for the project on an operator’s site. Although the data collected is limited and incomplete, some general statements can be made, because it covers the period from the beginning up until today. Based on the data presented in Figure 7, it can be concluded that the majority of waste is injected in sandstone formations (67% of all analyzed projects), followed by mudstone and shale formations (13% each) and, finally, in limestone formations (7%) (Figure 6). Despite the fact that sandstone represents the best choice for deep underground waste disposal by injection, selection of an appropriate formation is more complex. The data obtained are in direct correlation with recommendations and general information provided in this paper.
Figure 7. Formations selected for deep underground disposal of waste from drilling activities (based on data from Table 7).
The porosity of selected formations for deep underground waste injection ranged between 0.238 and 0.247 (average lower and upper value), and permeability ranged between 0.604 and 1.272 μm2 (average lower and upper value), which is in line with the recommended values provided by Tables 5 and 6.
When the geological formations selected for underground waste slurry injection are analyzed based on depth, it can be concluded that, in one-third of the analyzed projects (in 33% of the projects), the waste was injected in intervals between 1000 and 1500 m, followed by intervals from 1500 to 2000 m (28%) and intervals from 500 to 1000 m (22%). Lower values were observed in intervals from 2000 to 2500 m (6%) and below 500 m (11%) (Figure 8). This can be explained by technical and safety limitations. Injections in intervals deeper than 2500 m causes a significant increase in wellhead injection pressure as a consequence of the increased pressure drop, while injections in formations at depths lower than 500 m pose a security risk.
67%7%
13%
13%
SandstoneLimestoneShaleMudstone
Figure 7. Formations selected for deep underground disposal of waste from drilling activities (basedon data from Table 7).
The porosity of selected formations for deep underground waste injection ranged between 0.238and 0.247 (average lower and upper value), and permeability ranged between 0.604 and 1.272 µm2
(average lower and upper value), which is in line with the recommended values provided by Tables 5and 6.
When the geological formations selected for underground waste slurry injection are analyzedbased on depth, it can be concluded that, in one-third of the analyzed projects (in 33% of the projects),the waste was injected in intervals between 1000 and 1500 m, followed by intervals from 1500 to2000 m (28%) and intervals from 500 to 1000 m (22%). Lower values were observed in intervals from2000 to 2500 m (6%) and below 500 m (11%) (Figure 8). This can be explained by technical and safetylimitations. Injections in intervals deeper than 2500 m causes a significant increase in wellhead injectionpressure as a consequence of the increased pressure drop, while injections in formations at depthslower than 500 m pose a security risk.
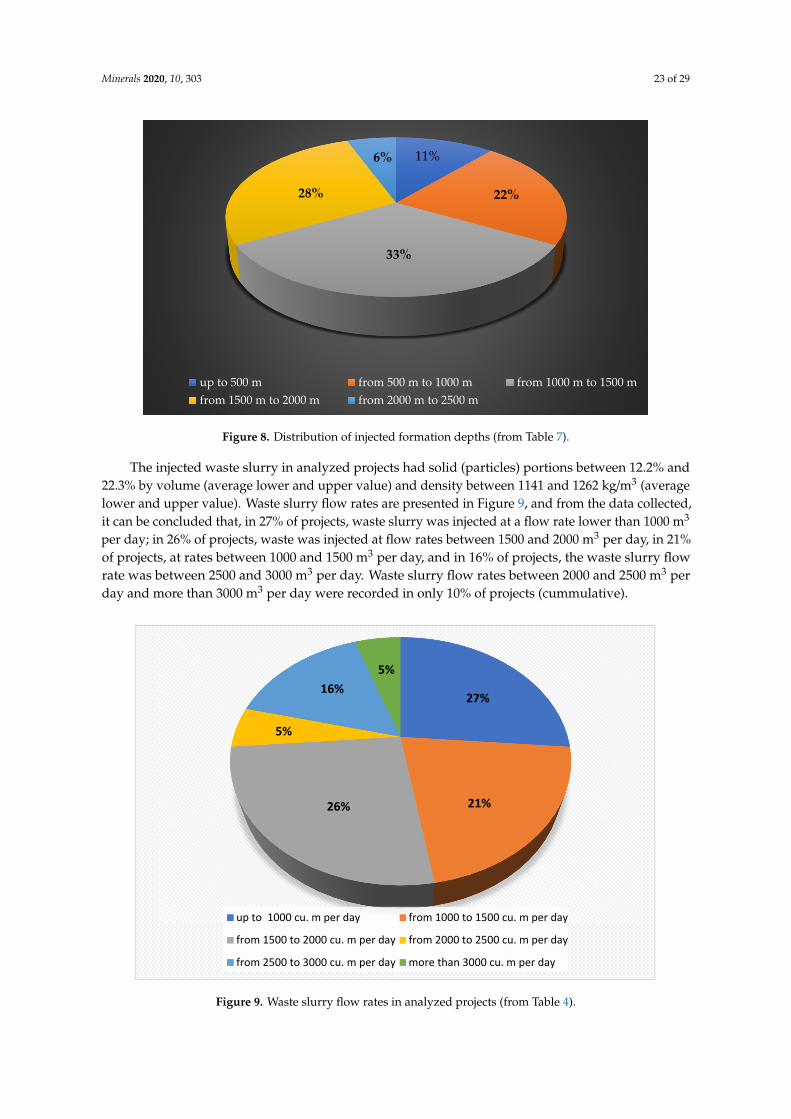
Minerals 2020, 10, 303 23 of 29
Minerals 2020, 10, x FOR PEER REVIEW 23 of 29
Figure 8. Distribution of injected formation depths (from Table 7).
The injected waste slurry in analyzed projects had solid (particles) portions between 12.2% and 22.3% by volume (average lower and upper value) and density between 1141 and 1262 kg/m3 (average lower and upper value). Waste slurry flow rates are presented in Figure 9, and from the data collected, it can be concluded that, in 27% of projects, waste slurry was injected at a flow rate lower than 1000 m3 per day; in 26% of projects, waste was injected at flow rates between 1500 and 2000 m3 per day, in 21% of projects, at rates between 1000 and 1500 m3 per day, and in 16% of projects, the waste slurry flow rate was between 2500 and 3000 m3 per day. Waste slurry flow rates between 2000 and 2500 m3 per day and more than 3000 m3 per day were recorded in only 10% of projects (cummulative).
Also, in 16 of the 19 analyzed projects, deep underground waste slurry injections were conducted through tubing, as could be expected for safety, economic and technological reasons.
Figure 9. Waste slurry flow rates in analyzed projects (from Table 4).
11%
22%
33%
28%
6%
up to 500 m from 500 m to 1000 m from 1000 m to 1500 mfrom 1500 m to 2000 m from 2000 m to 2500 m
27%
21%26%
5%
16%5%
up to 1000 cu. m per day from 1000 to 1500 cu. m per day
from 1500 to 2000 cu. m per day from 2000 to 2500 cu. m per day
from 2500 to 3000 cu. m per day more than 3000 cu. m per day
Figure 8. Distribution of injected formation depths (from Table 7).
The injected waste slurry in analyzed projects had solid (particles) portions between 12.2% and22.3% by volume (average lower and upper value) and density between 1141 and 1262 kg/m3 (averagelower and upper value). Waste slurry flow rates are presented in Figure 9, and from the data collected,it can be concluded that, in 27% of projects, waste slurry was injected at a flow rate lower than 1000 m3
per day; in 26% of projects, waste was injected at flow rates between 1500 and 2000 m3 per day, in 21%of projects, at rates between 1000 and 1500 m3 per day, and in 16% of projects, the waste slurry flowrate was between 2500 and 3000 m3 per day. Waste slurry flow rates between 2000 and 2500 m3 perday and more than 3000 m3 per day were recorded in only 10% of projects (cummulative).
Minerals 2020, 10, x FOR PEER REVIEW 23 of 29
Figure 8. Distribution of injected formation depths (from Table 7).
The injected waste slurry in analyzed projects had solid (particles) portions between 12.2% and 22.3% by volume (average lower and upper value) and density between 1141 and 1262 kg/m3 (average lower and upper value). Waste slurry flow rates are presented in Figure 9, and from the data collected, it can be concluded that, in 27% of projects, waste slurry was injected at a flow rate lower than 1000 m3 per day; in 26% of projects, waste was injected at flow rates between 1500 and 2000 m3 per day, in 21% of projects, at rates between 1000 and 1500 m3 per day, and in 16% of projects, the waste slurry flow rate was between 2500 and 3000 m3 per day. Waste slurry flow rates between 2000 and 2500 m3 per day and more than 3000 m3 per day were recorded in only 10% of projects (cummulative).
Also, in 16 of the 19 analyzed projects, deep underground waste slurry injections were conducted through tubing, as could be expected for safety, economic and technological reasons.
Figure 9. Waste slurry flow rates in analyzed projects (from Table 4).
11%
22%
33%
28%
6%
up to 500 m from 500 m to 1000 m from 1000 m to 1500 mfrom 1500 m to 2000 m from 2000 m to 2500 m
27%
21%26%
5%
16%5%
up to 1000 cu. m per day from 1000 to 1500 cu. m per day
from 1500 to 2000 cu. m per day from 2000 to 2500 cu. m per day
from 2500 to 3000 cu. m per day more than 3000 cu. m per day
Figure 9. Waste slurry flow rates in analyzed projects (from Table 4).

Minerals 2020, 10, 303 24 of 29
Also, in 16 of the 19 analyzed projects, deep underground waste slurry injections were conductedthrough tubing, as could be expected for safety, economic and technological reasons.
Despite well-known and proven technology, future progress is necessary in terms of betterunderstanding disposal domain characterizations during the planning and execution phases. Thisincludes using 3D simulators as well as real-time monitoring of injection parameters and continuousimprovements of created disposal domain models and fracture networks. Only by continuouslymonitoring all parameters and through real-time visualization of disposal domains can the maximumvolume of slurry waste be disposed in the safest and economically most efficient manner, withoutimpacting the environment and the community.
Author Contributions: N.G.-M.—creation of the idea for the paper, writing, reviewing and editing of text relatedto waste injection technology and equipment and reviewing of the discussion and conclusion section, B.P.—writingand editing of text related to disposal domain characterizations, wellbore integrity, injection well plugging andabandonment and discussion section; P.M.—preparation of the comprehensive literature overview of the pastand ongoing deep underground slurry waste injection projects and preparation of the tables and diagrams andI.M.—preparation of the comprehensive literature overview of the past and ongoing deep underground slurrywaste injection projects and preparation of tables and diagrams. All authors have read and agreed to the publishedversion of the manuscript.
Funding: This research received no external funding.
Conflicts of Interest: The authors declare no conflicts of interest.
References
1. Onwukwe, S.I.; Nwakaudu, M.S. Drilling Waste Generation and Management Approach. Int. J. Environ. Sci.Dev. 2012, 3, 252–257. [CrossRef]
2. Shokanov, T.A.; Nolte, K.G.; Fragachán, F.E.; Ovalle, A.; Geehan, T. Waste Subsurface Injection: PressureInjection and Decline Analysis. In Proceedings of the SPE Hydraulic Fracturing Technology Conference,College Station, TX, USA, 29–31 January 2007. [CrossRef]
3. Kholy, S.M.; Sameh, O.; Mounir, N.; Shams, M.; Mohamed, I.M.; Abou-Sayed, A.; Abou-Sayed, O. Evaluatingthe Feasibility of Waste Slurry Injection in an Oil Prospect in the Western Desert, Egypt. In Proceedings ofthe SPE Middle East Oil and Gas Show and Conference, Manama, Bahrain, 18–21 March 2019. [CrossRef]
4. Matanovic, D.; Gaurina-Međimurec, N. Environmental Aspects of Waste Generation and Disposal inPetroleum Engineering. In Proceedings of the 9th Conference on Sustainable Development of Energy, Waterand Environment Systems, Venice, Italy; Istanbul, Turkey, 20–27 September 2014; paper SDEWES2014-0327.
5. Bruno, M.S.; Qian, H.X. Economic Disposal of Solid Oilfield Wastes. JPT 1995, 47, 775. [CrossRef]6. Getliff, J.M.; Silverstone, M.P.; Sharman, A.K.; Lenn, M.; Hayes, T. Waste Management and Disposal of
Cuttings and Drilling Fluid Waste Resulting from the Drilling and Completion of Wells to Produce OrinocoVery Heavy Oil in Eastern Venezuela. In Proceedings of the SPE International Conference on Health, Safetyand Environment in Oil and Gas Exploration and Production, Caracas, Venezuela, 7–10 June 1998. [CrossRef]
7. Cline, J.T.; Piper, W.A. Drilling Waste Controls. In Proceedings of the Second International Conference onHealth, Safety & Environment Oil & Gas Exploration and Production, Jakarta, Indonesia, 25–27 January1994; pp. 573–581. [CrossRef]
8. Veil, J.A. Drilling Waste Management: Past, Present and Future. In Proceedings of the SPE Annual TechnicalConference and Exhibition, San Antonio, TX, USA, 29 September–2 October 2002. [CrossRef]
9. McKay, M.; Seward, M.W.; Smith, G.; Brady, S.J. Minimizing Drilling Fluid Waste Discharges While Drillingan Arctic Exploratory Well. In Proceedings of the Western Regional Meeting, Long Beach, CA, USA, 20–22March 1991. [CrossRef]
10. Arfie, M.; Marika, E.; Purbodiningrat, E.S.; Woodard, H.A. Implementation of Slurry Fracture InjectionTechnology for E&P Wastes at Duri Oilfield. In Proceedings of the SPE Asia Pacific Health, Safety andEnvironment Conference and Exhibition, Kuala Lumpur, Malaysia, 19–20 September 2005. [CrossRef]
11. Gaurina-Međimurec, N. Waste Disposal Methods in Petroleum Engineering. In Annual 2002 of the CroatianAcademy of Engineering; Croatian Academy of Engineering: Zagreb, Croatia, 2002; pp. 35–49.

Minerals 2020, 10, 303 25 of 29
12. Gaurina-Međimurec, N.; Matanovic, D.; Simon, K. Oil Field Waste Disposal Methods. In Transactions of theVŠB-Technical University Ostrava, Mining and Geological Series, Monograph 15. 51; Technical University Ostrava,Faculty of Mining and Geology: Ostrava, Czech, 2005; Volume 1, pp. 67–70.
13. Susich, M.L.; Schwenne, M.W. Onshore Drilling Waste Management: Beneficial Reuse of Cuttings. InProceedings of the Seventh SPE International Conference on Health, Safety and Environment in Oil and GasExploration and Production, Calgary, AB, Canada, 29–31 March 2004. [CrossRef]
14. Gaurina-Međimurec, N. The Environmental Impact of Drilling and Production Operations. In Proceedingsof the 4th International Scientific-Professional Consultation “Energetic and Process Plants”, Dubrovnik,Croatia, 24–26 May 2000; pp. 631–636.
15. Mokhalalati, T.; Al-Suwaidi, A.; El-Fatah Hendi, A. Managing Onshore Drilling Waste—Abu DhabiExperience. In Proceedings of the 9th Abu Dhabi International Petroleum Exhibition and Conference,Abu Dhabi, UAE, 15–18 October 2000. [CrossRef]
16. Okorodudu, A.; Akinbodunse, A.; Linden, L.; Anwuri, L.; Irrechukwu, D.O.; Zagi, M.M.; Guerrero, H.Feasibility Study of Cuttings-Injection Operation: A Case Study of the Niger Delta Basin. In Proceedingsof the SPE International Conference on Health, Safety and Environment in Oil and Gas Exploration andProduction, Abu Dhabi, UAE, 2–4 April 2006. [CrossRef]
17. Gogan, R.; Vencenzo, M.; Ayapbergenov, Y. Waste Management for Drillers. In Proceedings of the SPECaspian Carbonates Technology Conference, Atyrau, Kazakhstan, 8–10 November 2010. [CrossRef]
18. Reed, A.C.; Mathews, J.L.; Bruno, M.S.; Olmstead, S.E. Safe Disposal of One Million Barrels of NORM inLouisiana Through Slurry Fracture Injection. SPE Drill. Complet. 2002, 17, 72–81. [CrossRef]
19. Guo, Q.; Abou-Sajed, A.S. World Drill Cuttings Injection Permitting Requirements and Guidelines. InProceedings of the SPE/EPA/DOE Exploration and Production Environmental Conference, San Antonio, TX,USA, 10–12 March 2003. [CrossRef]
20. Bruno, M.S. Slurry Fracture Injection of Petroleum and Municipal Sanitation Wastes. In Proceedings of the5th Asian Rock Mechanics Symposium (ARMS5), Teheran, Iran, 24–26 November 2008; pp. 51–58.
21. Sipple-Srinivasan, M.; Bruno, M.S.; Bilak, R.A.; Danyluk, P.G. Field Experiences with Oilfield Waste DisposalThrough Slurry Fracture Injection. In Proceedings of the 67th Annual Western Regional Meeting of the SPE,Long Beach, CA, USA, 23–27 June 1997. [CrossRef]
22. Bruno, M.; Reed, A.; Olmstead, S. Environmental Management, Cost Management and Asset Managementfor High-Volume Oil Field Waste Injection Projects. In Proceedings of the IADC/SPE Drilling Conference,New Orleans, LA, USA, 23–25 February 2000. [CrossRef]
23. Guo, Q.; Geehan, T.; Ovalle, A. Increased Assurance of Drill Cuttings Reinjection: Challenges, RecentAdvances, and Case Studies. SPE Drill. Complet. 2007, 22, 99–105. [CrossRef]
24. Gaurina-Međimurec, N.; Krištafor, Z. Waste Disposal Methods Applied in Croatia. In Proceedings of theThird International Symposium Mining and Environmental Protection, MEP 01, Vrdnik, Serbia, 21–23 May2001; pp. 314–321.
25. Willson, S.M.; Steiger, R.P.; Moschovidis, Z.A.; Abou-Sayed, A.S.; de Bree, P.; Sirevåg, G. LaboratoryInvestigation of Drill Cuttings Disposal by Downhole Injection. In Rock Mechanics for Industry; Amadei, B.,Kranz, R.L., Scott, G.A., Smeallie, P.H., Eds.; Balkema: Rotterdam, The Netherlands, 1999.
26. Fragachán, F.E.; Shokanov, T.A.; Ovalle, A.P.; Nolte, K.G. Mitigating Risks from Waste Subsurface PressureInjection and Decline Analysis. In Proceedings of the SPE E&P Environmental and Safety Conference,Galveston, TX, USA, 5–7 March 2007. [CrossRef]
27. Ovalle, A.; Ronderos, J.; Benelkadi, S.; Gumarov, S.; Simmons, S. Improved Waste Injection Monitoring andModified Operational Procedures: The Key to Prolong Well Storage Capacity. In Proceedings of the SPEMiddle East Oil & Gas Show and Conference, Bahrain International Exhibition Centre, Manama, Bahrain,15–18 March 2009. [CrossRef]
28. Puder, M.G.; Veil, J.A. Options and Costs for Off-Site Disposal of Oil and Gas Exploration and ProductionWastes. In Proceedings of the SPE E&P Environmental and Safety Conference, Galveston, TX, USA, 5–7March 2007. [CrossRef]
29. Zoveidavianpoor, M.; Samsuri, A.; Shadizadeh, S.R. Chapter 17—Overview of Environmental Managementby Drill Cutting Re-injection through Hydraulic Fracturing in Upstream Oil and Gas Industry. In SustainableDevelopment—Authoritative and Leading Edge Content for Environmental Management; Curkovic, S., Ed.; In Tech:Rijeka, Croatia, 2012; pp. 389–410. [CrossRef]

Minerals 2020, 10, 303 26 of 29
30. Gaurina-Međimurec, N. Underground Injection of Oil Field Waste. In Handbook of Research on Advancementsin Environmental Engineering; Engineering Science Reference (An Imprint of IGI Global): Hershey, PA, USA,2015; pp. 400–437.
31. Marinello, S.A.; Lyon, F.L.; Ballantine, W.T. Disposal of E&P Waste by Injection: An Assessment of Technologyand Regulatory Impacts. In Proceedings of the SPE/EPA/DOE Exploration and Production EnvironmentalConference, San Antonio, TX, USA, 26–28 February 2001. [CrossRef]
32. Abou-Sayed, A.S.; Guo, Q.; Meng, F.; Zaki, K. Ultimate Capacity of a Disposal Well in Drilling Waste InjectionOperations. In Proceedings of the SPE/IADC Drilling Conference, Amsterdam, The Netherlands, 19–21February 2003. [CrossRef]
33. Gumarov, S.; Ovalle, A.P.; Shokanov, T.A.; Park, G.; Simmons, S.L. Evaluation of Extended SeawaterInjections Impact on Waste Injection Pressure Response and Waste Disposal Capacity. In Proceedings of theEUROPEC/EAGE Conference and Exhibition, Amsterdam, The Netherlands, 8–11 June 2009. [CrossRef]
34. Newman, K.; Woolsey, G.; McCosh, K.; Hand, E.; Boodhai, M. Multistage Centrifugal Pumps for Drilling andProduction Waste Injection Operations. In Proceedings of the SPE Asia Pacific Health, Safety, Security andEnvironment Conference and Exhibition, Jakarta, Indonesia, 4–6 August 2009. [CrossRef]
35. Keck, R.G. Drill Cuttings Injection: A Review of Major Operations and Technical Issues. In Proceedings ofthe SPE Annual Technical Conference and Exhibition, San Antonio, TX, USA, 29 September–2 October 2002.[CrossRef]
36. Ji, L.; Gumarov, S.; Shokanov, T.; Anokhin, V.; Ronderos, J. Evaluating Wellbore Displacement Efficiency ofPost-Slurry Overflushing and Its Effect on Injection Pressure in Waste Injection Operations. In Proceedingsof the International Petroleum Technology Conference, Beijing, China, 26–28 March 2013. [CrossRef]
37. Dusseault, M.B.; Bolak, R.A.; Rodwell, L.G. Disposal of Dirty Liquids using Slurry Fracture Injection. InProceedings of the SPE/EPA Exploration and Production Environmental Conference, Dallas, TX, USA, 3–5March 1997. [CrossRef]
38. Ronderos, J.R.; Ovalle, A.P. Geomechanical Modeling Techniques Applied to Waste Injection Process. InProceedings of the 44th US Rock Mechanics Symposium and 5th US-Canada Rock Mechanics Symposium,Salt Lake City, UT, USA, 27–30 June 2010.
39. Fragachán, F.; Ovalle, A.; Shokanov, T. Pressure Monitoring: Key for Waste Management Injection Assurance.In Proceedings of the First International Oil Conference and Exhibition in Mexico, Cancun, Mexico, 31August–2 September 2006. [CrossRef]
40. Louviere, R.J.; Reddoch, J.A. Onsite Disposal of Rig-Generated Waste Via Slurrification and Annular Injection.In Proceedings of the SPE/IADC Drilling Conference, Amsterdam, The Netherlands, 23–25 February 1993.[CrossRef]
41. Guo, Q.; Abou-Sayed, A.S.; Engel, H.R. Feeling the Pulse of Drill Cuttings Injection Wells—A Case Study ofSimulation, Monitoring and Verification in Alaska. SPE J. 2007, 458–467. [CrossRef]
42. Gaurina-Međimurec, N.; Matanovic, D.; Krištafor, Z. Injection of Drilling Wastes in Dry Hole. In Proceedingsof the International Conference “Special Methods of Deposit Utilization”, Ostrava, Czech Republic, 12–13November 1998; pp. 87–94.
43. Gaurina-Međimurec, N.; Krištafor, Z.; Matanovic, D.; Kulenovic, I.; Gospic-Miocev, D. Subsurface disposalof technological waste—Present and future in Croatia. Nafta 1999, 50, 279–283.
44. Gaurina-Međimurec, N.; Pašic, B.; Medved, I.; Mijic, P. Drilling Waste Injection. In Proceedings of the7th International Symposium on Mining and Environmental Protection—MEP 19, Vrdnik, Serbia, 25–28September 2019; Ristovic, I., Ed.; pp. 56–62.
45. Krištafor, Z.; Gaurina-Međimurec, N.; Matanovic, D. Well Design for Subsurface Injection of Drilling andIndustrial Liquid Waste. In Proceedings of the International Congress “Energy and Environment”, Opatija,Croatia, 28–30 October 1998; Volume I, pp. 307–314.
46. Maliardi, A.; Cecconi, F.; Simeone, D.; Gumarov, S.; Shokanov, T.; Anokhin, V.; Benelkadi, S.; Bosisio, F.;Mangiameli, R. Subsurface Cuttings Injection: Technical Challenges and Opportunities. In Proceedings ofthe International Petroleum Conference, Doha, Qatar, 19–22 January 2014. [CrossRef]
47. Fristoe, B.R. Drilling Wastes Management for Alaska’s North Slope. In Proceedings of the InternationalArctic Technology Conference, Anchorage, AK, USA, 29–31 May 1991. [CrossRef]
48. Minton, R.C.; Secoy, B. Annular Re-Injection of Drilling Wastes. J. Pet. Technol. 1993, 45, 1081–1085. [CrossRef]
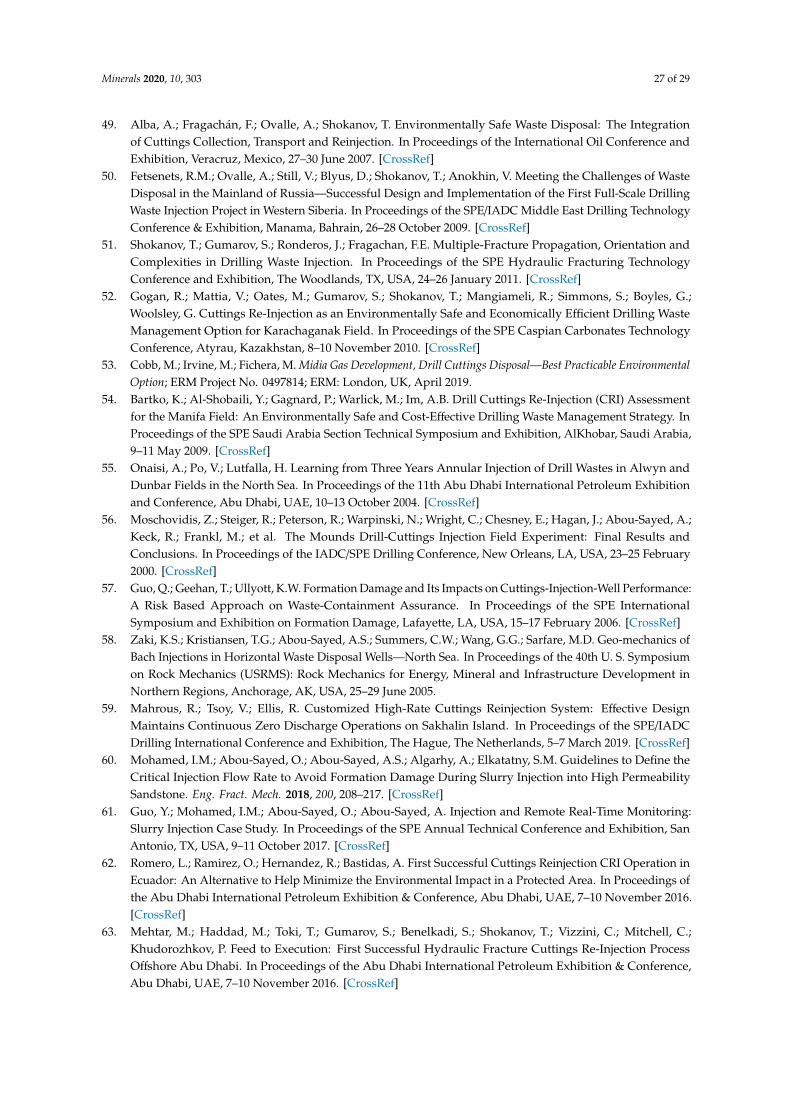
Minerals 2020, 10, 303 27 of 29
49. Alba, A.; Fragachán, F.; Ovalle, A.; Shokanov, T. Environmentally Safe Waste Disposal: The Integrationof Cuttings Collection, Transport and Reinjection. In Proceedings of the International Oil Conference andExhibition, Veracruz, Mexico, 27–30 June 2007. [CrossRef]
50. Fetsenets, R.M.; Ovalle, A.; Still, V.; Blyus, D.; Shokanov, T.; Anokhin, V. Meeting the Challenges of WasteDisposal in the Mainland of Russia—Successful Design and Implementation of the First Full-Scale DrillingWaste Injection Project in Western Siberia. In Proceedings of the SPE/IADC Middle East Drilling TechnologyConference & Exhibition, Manama, Bahrain, 26–28 October 2009. [CrossRef]
51. Shokanov, T.; Gumarov, S.; Ronderos, J.; Fragachan, F.E. Multiple-Fracture Propagation, Orientation andComplexities in Drilling Waste Injection. In Proceedings of the SPE Hydraulic Fracturing TechnologyConference and Exhibition, The Woodlands, TX, USA, 24–26 January 2011. [CrossRef]
52. Gogan, R.; Mattia, V.; Oates, M.; Gumarov, S.; Shokanov, T.; Mangiameli, R.; Simmons, S.; Boyles, G.;Woolsley, G. Cuttings Re-Injection as an Environmentally Safe and Economically Efficient Drilling WasteManagement Option for Karachaganak Field. In Proceedings of the SPE Caspian Carbonates TechnologyConference, Atyrau, Kazakhstan, 8–10 November 2010. [CrossRef]
53. Cobb, M.; Irvine, M.; Fichera, M. Midia Gas Development, Drill Cuttings Disposal—Best Practicable EnvironmentalOption; ERM Project No. 0497814; ERM: London, UK, April 2019.
54. Bartko, K.; Al-Shobaili, Y.; Gagnard, P.; Warlick, M.; Im, A.B. Drill Cuttings Re-Injection (CRI) Assessmentfor the Manifa Field: An Environmentally Safe and Cost-Effective Drilling Waste Management Strategy. InProceedings of the SPE Saudi Arabia Section Technical Symposium and Exhibition, AlKhobar, Saudi Arabia,9–11 May 2009. [CrossRef]
55. Onaisi, A.; Po, V.; Lutfalla, H. Learning from Three Years Annular Injection of Drill Wastes in Alwyn andDunbar Fields in the North Sea. In Proceedings of the 11th Abu Dhabi International Petroleum Exhibitionand Conference, Abu Dhabi, UAE, 10–13 October 2004. [CrossRef]
56. Moschovidis, Z.; Steiger, R.; Peterson, R.; Warpinski, N.; Wright, C.; Chesney, E.; Hagan, J.; Abou-Sayed, A.;Keck, R.; Frankl, M.; et al. The Mounds Drill-Cuttings Injection Field Experiment: Final Results andConclusions. In Proceedings of the IADC/SPE Drilling Conference, New Orleans, LA, USA, 23–25 February2000. [CrossRef]
57. Guo, Q.; Geehan, T.; Ullyott, K.W. Formation Damage and Its Impacts on Cuttings-Injection-Well Performance:A Risk Based Approach on Waste-Containment Assurance. In Proceedings of the SPE InternationalSymposium and Exhibition on Formation Damage, Lafayette, LA, USA, 15–17 February 2006. [CrossRef]
58. Zaki, K.S.; Kristiansen, T.G.; Abou-Sayed, A.S.; Summers, C.W.; Wang, G.G.; Sarfare, M.D. Geo-mechanics ofBach Injections in Horizontal Waste Disposal Wells—North Sea. In Proceedings of the 40th U. S. Symposiumon Rock Mechanics (USRMS): Rock Mechanics for Energy, Mineral and Infrastructure Development inNorthern Regions, Anchorage, AK, USA, 25–29 June 2005.
59. Mahrous, R.; Tsoy, V.; Ellis, R. Customized High-Rate Cuttings Reinjection System: Effective DesignMaintains Continuous Zero Discharge Operations on Sakhalin Island. In Proceedings of the SPE/IADCDrilling International Conference and Exhibition, The Hague, The Netherlands, 5–7 March 2019. [CrossRef]
60. Mohamed, I.M.; Abou-Sayed, O.; Abou-Sayed, A.S.; Algarhy, A.; Elkatatny, S.M. Guidelines to Define theCritical Injection Flow Rate to Avoid Formation Damage During Slurry Injection into High PermeabilitySandstone. Eng. Fract. Mech. 2018, 200, 208–217. [CrossRef]
61. Guo, Y.; Mohamed, I.M.; Abou-Sayed, O.; Abou-Sayed, A. Injection and Remote Real-Time Monitoring:Slurry Injection Case Study. In Proceedings of the SPE Annual Technical Conference and Exhibition, SanAntonio, TX, USA, 9–11 October 2017. [CrossRef]
62. Romero, L.; Ramirez, O.; Hernandez, R.; Bastidas, A. First Successful Cuttings Reinjection CRI Operation inEcuador: An Alternative to Help Minimize the Environmental Impact in a Protected Area. In Proceedings ofthe Abu Dhabi International Petroleum Exhibition & Conference, Abu Dhabi, UAE, 7–10 November 2016.[CrossRef]
63. Mehtar, M.; Haddad, M.; Toki, T.; Gumarov, S.; Benelkadi, S.; Shokanov, T.; Vizzini, C.; Mitchell, C.;Khudorozhkov, P. Feed to Execution: First Successful Hydraulic Fracture Cuttings Re-Injection ProcessOffshore Abu Dhabi. In Proceedings of the Abu Dhabi International Petroleum Exhibition & Conference,Abu Dhabi, UAE, 7–10 November 2016. [CrossRef]

Minerals 2020, 10, 303 28 of 29
64. Xia, G.; Bilak, R.; Marika, E.; Al-Shehri, H.A.; Al-Qahtani, F.Y. Performance Assessment of CuttingsRe-Injection (CRI) Operations at the Manifa Oil Field, KSA. In Proceedings of the Rock Mechanics for NaturalResources and Infrastructure, ISRM Specialized Conference, Goiania, Brazil, 9–13 September 2014.
65. Kunze, K.R.; Romer, E.E.; Duck, S. Colorado Drill Cuttings Injection Pilot Results. In Proceedings of theIADC/SPE Drilling Conference and Exhibition, San Diego, CA, USA, 6–8 March 2012. [CrossRef]
66. Ovalle, A.; Shokanov, T.; Simmons, S.; Ronderos, J. Field Implementation of Sub-Surface Waste Injection: AnIntegrated Approach for Field Disposal Perspective. In Proceedings of the IADC/SPE Asia Pacific DrillingTechnology Conference and Exhibition, Jakarta, Indonesia, 25–27 August 2008. [CrossRef]
67. Reed, A.C.; Mathews, J.L.; Bruno, M.S.; Olmstead, S.E. Safe Disposal of One Million Barrels of NORM inLouisiana Through Slurry Fracture Injection. In Proceedings of the SPE Annual Technical Conference andExhibition, New Orleans, LA, USA, 30 September–3 October 2001. [CrossRef]
68. Sipple-Srinivasan, M.M.; Bruno, M.S.; Hejl, K.A.; Danyluk, P.G.; Olmstead, S.E. Disposal of CrudeContaminated Soil Through Slurry Fracture Injection at the West Coyote Field in California. In Proceedingsof the SPE Western Regional Meeting, Bakersfield, CA, USA, 10–13 May 1998. [CrossRef]
69. Moschovidis, Z.A.; Gardner, D.C.; Sund, G.V.; Veatch, R.W., Jr. Disposal of Oily Cuttings by DownholePeriodic Fracturing Injections, Valhall, North Sea: Case Study and Modeling Concepts. In Proceedings of theSPE/IADC Drilling Conference, Amsterdam, The Netherlands, 22–25 February 1994. [CrossRef]
70. Willson, S.M.; Rylance, M.; Last, N.C. Fracture Mechanics Issues Relating to Cuttings Re-Injection atShallow Depth. In Proceedings of the SPE/IADC Drilling Conference, Amsterdam, The Netherlands,23–25 February 1993. [CrossRef]
71. Abou-Sayed, A.S.; Andrews, D.E.; Buhidma, I.M. Evaluation of Oily Waste Injection Below the Permafrostin Prudhoe Bay Field. In Proceedings of the SPE California Regional Meeting, Bakersfield, CA, USA,5–7 April 1989. [CrossRef]
72. Nadeem, M.; Dusseault, M.B.; Bilak, R.A. Assessment Criteria for Deep Waste Disposal Sites. In Proceedingsof the 40th US Symposium on Rock Mechanics (USRMS), Anchorage, AK, USA, 25–29 June 2005.
73. Nadeem, M.; Dusseault, M.B. Geological Engineering Criteria for Deep Solids Injection. Environ. Geosci.2007, 14, 61–77. [CrossRef]
74. Saif ud Din, S.; Reza Oskui, G.P.; Al-Dousari, A.; Al Ghadban, A.N.; Al Murad, M. An EnvironmentallyViable Waste Disposal Method for Oil-producing Countries. Waste Manag. Res. 2009, 28, 169–176. [CrossRef][PubMed]
75. Ferguson, G.; McIntosh, J.C.; Perrone, D.; Jasechko, S. Competition for Shrinking Window of Low SalinityGroundwater. Environ. Res. Lett. 2018, 13, 1–9. [CrossRef]
76. Baker, B.D.; Rieke, H.H. A Balanced Approach to Waste Disposal using UFI (Underground FractureInjection). In Proceedings of the SPE Annual Technical Conference and Exhibition, New Orleans, LA, USA,30 September–3 October 2001. [CrossRef]
77. Shokanov, T.A.; Fragachán, F.E.; Feyereisen, S.B.; Greener, J.M. Mitigating Risks from Waste SubsurfaceInjection through Accurate Downhole Pressure Measurement, Analysis, and Fracture Monitoring. InProceedings of the IADC/SPE Drilling Conference, Orlando, FL, USA, 4–6 March 2008. [CrossRef]
78. Ji, L.; Shokanov, T.A.; Fragachan, F.E.; Ovalle, A.; Ronderos, J. Multi-Fracture Complexities in Drilling WasteInjection: Wagon-Wheel Uniform Disposal Domain or Secondary Fracture Branching. In Proceedings of the43rd US Rock Mechanics Symposium and 4th US—Canada Rock Mechanics Symposium, Asheville, NC,USA, 28 June–1 July 2009.
79. Shokanov, T.; Still, V.; Hernandez, E.; Anokhin, V.; Ovalle, A.; Fragachán, F. Subsurface Drilling WasteInjection: Real-Time Waste Domain Characterization Using Injection Monitoring and Pressure Interpretation.In Proceedings of the SPE Russian Oil & Gas Technical Conference and Exhibition, Moscow, Russia, 28–30October 2008. [CrossRef]
80. Thornhill, J.T.; Benefield, B.G. Detecting Water Flow Behind Pipe in Injection Wells; EPA/600/R-92/041; UnitedStates Environmental Protection Agency: Washington, DC, USA, February 1992.
81. Gaurina-Međimurec, N.; Pašic, B. Design and Mechanical Integrity of CO2 Injection Well. InMining-Geological-Petroleum Engineering Bulletin; Faculty of Mining, Geology and Petroleum Engineering:Zagreb, Croatia, 2011; Volume 23, pp. 1–8.

Minerals 2020, 10, 303 29 of 29
82. Shen, X.; Shen, G.; Standifird, W. Numerical Calculation of Fault Reactivation and Resultant SeismicBehavior Related to Cuttings Reinjection in Offshore West Africa. In Proceedings of the 49th US RockMechanics/Geomechanics Symposium, San Francisco, CA, USA, 28 June–1 July 2015.
83. Lele, S.P.; Tyrrell, T.; Dasari, G.R. Geomechanical Analysis of Fault Reactivation due to Hydraulic Fracturing.In Proceedings of the 51st US Rock Mechanics/Geomechanics Symposium, San Francisco, CA, USA, 25–28June 2017.
84. Liu, K.; Dahi Taleghani, A.; Gao, D. Semianalytical Model for Fault Slippage Resulting from PartialPressurization. SPE J. 2019, 1–14. [CrossRef]
85. Cappa, F.; De Barros, L.; Wynants-Morel, N.; Guglielmi, Y.; Birkholzer, J. From Aseismic Slip to SeismicityDuring Fluid Injection Controlled by Interactions Between Stress Perturbation, Permeability Increases andFault Structure. In Proceedings of the 53rd US Rock Mechanics/Geomechanics Symposium, New York, NY,USA, 23–26 June 2019.
86. Haddad, M.; Eichhubl, P. Poroelastic Models for Fault Reactivation in Response to Injection and Production. InProceedings of the 52nd US Rock Mechanics/Geomechanics Symposium, Seattle, WA, USA, 17–20 June 2018.
87. Bakhshian, S.; Dashtian, H.; Paiaman, A.M.; Al-Anazi, B.D. A Review on Impacts of Drilling Mud Disposalon Environment and Underground Water Resources in South of Iran. In Proceedings of the SPE/IADCMiddle East Drilling Technology Conference & Exhibition, Manama, Bahrain, 26–28 October 2009. [CrossRef]
88. Booz, Allen and Hamilton Inc. Development of Procedures and Costs for Proper Abandonment and Plugging ofInjection Wells; 68-01-5971; Prepared for the U. S. Environmental Protection Agency: Washington, DC, USA,30 April 1980.
© 2020 by the authors. Licensee MDPI, Basel, Switzerland. This article is an open accessarticle distributed under the terms and conditions of the Creative Commons Attribution(CC BY) license (http://creativecommons.org/licenses/by/4.0/).