Embed Size (px)
Citation preview

MINERALOGY AND MICROSTRUCTURE OF
DINOSAUR EGGSHELLS
by
MARK L. POLLINGER, B.A.
A THESIS
IN
GEOSCIENCE
Submitted to the Graduate Faculty of Texas Tech University in
Partial Fulfillment of the Requirements for
the Degree of
MASTER OF SCIENCE
Approved
Accepted
December, 1997

'^3 ACKNOWLEDGEMENTS
A. / ^
y I wish to thank my major professor. Dr. Sankar
Chatterjee, for helping me to obtain the materials for
this project, his guidance through this project, and,
most importantly, his enthusiasm. His constant
excitement concerning the project kept me going.
I am grateful to the members of my committee. Dr.
Necip Guven not only allowed the use of his x-ray
diffractometer, but he took the time to quality check my
methods to ensure that things were done correctly.
Thanks to Dr. George Asquith for taking the time to
review the manuscript.
Thanks Jack Horner, David Varricchio, and Mark
Norell for contributions of eggshell for this study.
Dr. Calvin Barnes allowed the use of his
petrographic microscope for photographing the thin
sections for the chapter on light microscopy. Mike Gower
of Texas Tech made all the thin sections.
Last but not least, I thank my wife, Brianna
Pollinger, for forcing me to continue working and being
patient with the loss of her husband until this was
completed.
11

TABLE OF CONTENTS
ACKNOWLEDGEMENTS ii
LIST OF TABLES iv
LIST OF FIGURES v
CHAPTER
I. INTRODUCTION 1
II. SCANNING ELECTRON MICROSCOPE ANALYSIS 8
Materials and Methods 8
Avian Eggshell Microstructure 9
Non-Avian Dinosaur Eggshell Microstructure . . 13
Mineralogy 16
Eggshell Measurement by S.E.M 17
Discussion 18
III. X-RAY DIFFRACTION 36
Methods of X-ray Diffraction 36
Avian and Dinosaur Mineralogy 42
IV. LIGHT MICROSCOPY 45
Methods 45
Mineralogy and Microstructure 45
Discussion 51
BIBLIOGRAPHY 61
111

APPENDIX
A. PHYLOGENY OF BIRDS SAMPLED 63
B. X-RAY DIFFRACTION TABLES 65
C. X-RAY DIFFRACTION CHARTS 71
IV

LIST OF TABLES
2 .1 Shell measurements 32
B. 1 X-ray Diffraction Results for Rhea 66
B.2 X-ray Diffraction Results for Troodon 67
B. 3 X-ray Diffraction Results for Maiasaur 68
B. 4 X-ray Standard Values for Quartz 69
B. 5 X-ray Standard Values for Calcite 70
v

LIST OF FIGURES
1.1 Phylogeny of Dinosaurs and Birds Sampled 3
1. 2 Cladogram of the Dinosaurs 5
2.1 Generalized Egg Illustrating Radial View 11
2.2 Photomicrograph of Organic Core of a Turkey Eggshell 21
2.3 Photomicrograph of Interior Surface of a Chicken Eggshell 22
2.4 Photomicrograph of Fibrous Membrane of a Chicken Eggshell 23
2.5 Photomicrograph of a Radial Section through A Rhea Eggshell 24
2.6 Photomicrograph of External Surface of a Rhea Eggshell 25
2.7 Photomicrograph of Exterior of Prairie Falcon Eggshell 26
2.8 Generalized Structure of Avian and Non-avian
Dinosaur Eggshells 27
2 . 9 Photomicrograph of Maiasaura Eggshell 28
2.10 Photomicrograph of Radial Section through a
Maiasaur Eggshell 29
2.11 Photomicrograph of a Sauropod Eggshell 30
2.12 Photomicrograph of a Troodon Eggshell 31
2.13 Shell Thickness versus Shell Circumference 34
2.14 Layer Thickness versus Thickness of Shell 35
4.1 Photograph of Troodon Eggshell Showing Cleavage Planes (lOx) 55
VI

4.2 Photograph of Sauropod Eggshell Viewed Through Crossed Nicols (5z) 56
4.3 Photograph of Sauropod Eggshelx Viewed Through Plain Light (5z) 5"
4.4 Photograph of Titanosaur Eggshell Viewed Through Crossed Nicols (5x) Showing Chalcedony Replacement 58
4.5 Photograph of Troodon Eggshell Viewed Through Crossed Nicols (5x) 59
4.6 Photograph of Emu Eggshell Viewed Through Plain
Light (lOx) 60
A. 1 Phylogeny of Birds Sampled 64
C. 1 X-Ray Diffraction Chart for Rhea 72
C. 2 X-Ray Diffraction Chart for Troodon 73
C. 3 X-Ray Diffraction Chart for Maiasaura ''4
vii

CHAPTER I
INTRODUCTION
The egg plays an important part in the reproduction
of vertebrates. It contains the offspring until the
animal has a chance of survival in the environment
outside of the egg. The basic purpose of the eggshell is
to regulate fluid and gas movement between the inside of
the egg and the outside world.
The earliest vertebrates were aquatic. The entire
process of reproduction for these animals took place in
water. Since the eggs were deposited in water, no need
existed for anything more than a water permeable membrane
to contain the growing embryo. As animals became
terrestrial, the same strategy was used. Amphibians
sought out standing water with which to deposit their
eggs. If the chosen location became dry, the eggs would
be in danger of drying out, killing the embryo. This
tied the amphibians to environments with sufficient
water. This water might be a river, a lake or pond, or
puddles of standing water.
1

The reptilian advancement of the hard eggshell was a
clear advantage. For the first time, the reproductive
process was not tied to sources of water. The reptilian
shell held moisture in, but also allowed for the transfer
of gasses in and out of the shell. The creation of a
solid calcite or aragonite layer, the body of the
eggshell, gave the shell its strength. The shell had to
be strong enough to protect the egg from either the
incubating parent, the overlying sediment, or other eggs
in the nest, yet weak enough to allow the young animal to
hatch out of the egg.
The invention of the ^amniote' eggshell made the
impermeability to fluids possible. At the same time,
pores allowed the embryo to inhale oxygen and exhale
carbon dioxide. Dinosaurs used this basic reptilian
design, while the modern birds took this same format with
added complexity.
Recent phylogenetic analysis suggests that the
members of the class Aves, the birds, are theropod
dinosaurs (Gauthier, 1986; Chatterjee, 1997). Birds are
the closest living relatives of the extinct non-avian
dinosaurs. Because of the close relationship between the

birds and other dinosaurs, any broad comparative study of
dinosaur phylogeny should include the birds. It is for
this reason that this work begins with nineteen eggshell
samples of a wide variety of modern birds. Using the
variation of the modern birds, study proceeds to the non-
avian dinosaurs. We then work our way outward to
dinosaurs that are less and less related to the modern
birds. The basic concept of this investigation is that
the farther removed a dinosaur is from modern birds, the
more different its eggshells will be to eggshells of the
birds. Figure 1.1 shows the phylogenetic relationships
of the members of the dinosaurs as it is now understood
(simplified from Chatterjee, 1997).
Dinosauri
Saurischia
Theropoda
Neornithes
Maiasaura (ornithopod) Titanosaur (sauropod) Oviraptor (non-avian theropod) Troodon (non-avian theropod) Gobipipus Palaeognathae Neognathae
(Galiiformes/Answeriformes) Neognathae(All others)
Figure 1.1 Phylogeny of Dinosaurs Sampled

The Neognathae and Palaeognathae are the two groups
that make up the modern birds. Both groups have living
members. Gobipipus is an extinct bird of modern form.
All other groups listed in the cladogram are extinct non-
avian dinosaurs. The Neognathae represent the bulk of
the modern birds. The Neognathae eggshells come from the
Canada goose, domestic chicken, wild turkey, pied-billed
grebe, California brown pelican, sora rail, Forster's
tern, great blue heron, common pigeon, turkey vulture,
prairie falcon, osprey, red shouldered hawk, great horned
owl, belted kingfisher, and white-necked raven. The
Palaeognathae are the ratites. These are the large
flightless birds such as the Ostrich, Emu, and Rhea.
They are considered primitive to the other flying birds.
Additionally, fragments of eggshell of the early bird
Gobipipus were included. Gobipipus is an extinct bird
from the Cretaceous Barun Goyot Formation of the Gobi
desert in Mongolia.
The first non-avian dinosaur represented is Troodon.
Troodon was a small, intelligent theropod and a member of
a sister group of the Aves. It had a swivel wrist joint,
a characteristic of the maniraptorans. The Troodon

eggshells were collected in the Late Cretaceous Two
Medicine Formation in Montana. Another maniraptoran
theropod is the Oviraptor from the Cretaceous. Oviraptor
has been found in the Gobi Desert of Mongolia. Among the
sauropods, the titanisaurid eggshells from the Upper
Cretaceous Lameta Group of India have been studied.
Finally, the Maiasaura, an ornithopod, is the most
phyiogeneticaily removed dinosaur from modern birds. The
eggshells of the Maiasaura were also collected from the
Two Medicine Formation of Montana. Figure 1.2
illustrates the relationship between the members of the
dinosaurs as it is now believed (from Chatterjee, 1997).
Thyreophora
Ornithischia I
Dinosauria
t Cerapoda
Saurapodomorpha
i i
Saurischia
Theropoda c
• Stegosauria
•Ankyiosauria
. Ceratopsia
•Ornithopoda*
•Prosauropoda
•Sauropoda*
Other Theropods*
Aves*
Figure 1.2 Cladogram of the Dinosaurs
Asterisks represent groups with a sample included

These eggshells were studied using three main tools,
the scanning electron microscope, the x-ray
diffractometer, and the polarizing light microscope. The
scanning electron microscope (SEM) was used to view the
microstructure of the eggshells. Using the SEM, the
shell material can be viewed in three dimensions to see
the relationship between crystals within the shell and
the relationship between layers that make up the shell.
This information can then be used to compare eggshells of
differing species. The x-ray diffractometer was used to
analyze the mineralogical content of the eggshells. X-
ray diffraction sample results were compared to known
samples to identify mineral composition. The polarizing
light microscope was used to view the interaction of the
individual crystals that make up the shells.
Identification of the mineralogy of the shell material
and any surrounding matrix was also attempted.
It is through a comparative process that an attempt
to link the eggshell material of the non-avian dinosaurs
to those of the avian dinosaurs. It is hoped that a
progression of shell morphology can be seen ranging from

the most distantly related species of dinosaur to th(
eggshell modern birds.
7

CHAPTER II
SCANNING ELECTRON MICROSCOPE ANALYSIS
Materials and Methods
For scanning electron microscope (SEM) analysis, a
small chip of shell was removed from each egg. Since
most of the non-avian dinosaur shell was broken material
smaller than a dime, a single small chip was used. One
exception was the sauropod shell. It was attached to a
matrix of rock on its interior surface. In this case,
the shell was broken to a manageable size and as much
matrix was removed as possible without damaging the shell
above. Each avian and non-avian dinosaur eggshell piece
used ranged from about five millimeters to fifteen
millimeters in diameter. The bird shell was broken from
an intact eggshell; therefore, all surfaces were freshly
broken. For the fossil dinosaur eggshell, the sample was
broken to obtain a fresh surface. These samples were
then mounted on aluminum specimen holders by double-sided
carbon tape. For best viewing by the microscope, the
fragments used were mounted so that a freshly broken
surface was visible when looking straight down on the
8

sample holder. Up to four samples were mounted on one
sample holder, each placed so that it would not obstruct
the view of another sample on the same holder. Colloidal
silver paste was then applied to connect the specimens to
the aluminum holder. This silver paste provides an
electrical connection between the shell material and the
sample holder. The paste was then allowed to dry.
The specimens were next placed in a Technics Hummer
V sputter coater. A sputter coater is a machine that is
used to apply a thin (-20 nm) coat of gold palladium to
the egg fragments. This gold coating allows -the entire
surface to be grounded through the colloidal silver, down
the stub, and to the rest of the machine through the
stage- The coating enhances electron emission for
detection by the microscope. After coating, the samples
were ready for use in the SEM. The microscope used in
this study was a Hitachi S-570 scanning electron
microscope.
Avian Eggshell Microstructure
Many workers have looked at the microstructure of
dinosaur eggshell (Hirsh and Quinn 1990, Mikhailov 1991,

Mikhailov et. al. 1994, Hirsh 1994, Zhao 1994). These
workers have found that avian eggshell morphology is
relatively uniform throughout the Class Aves. Growth of
the eggshell begins at a point called the organic core.
From this spot, close to the fibrous membrane lining the
interior surface of the shell, the crystals grow outward.
Mikhailov (1991) calls these crystals ''the zone of radial
plates". In Figure 2.2, the organic core of a Wild
Turkey {Meleagrus gallopavo) is visible. The surface of
the shell is toward the top of the photomicrograph. The
zone of radial plates spreads outward from this central
point. As can be seen in an interior view, the basal
radial crystals are called mammillae (Hirsch and Quinn
1990). This lends its name to the interior layer of the
shell, called the mammillary layer. The degree to which
the mammillae connect to each other varies. The
interiors of some specimens appear almost continuous;
whereas, others have distinct, separate mammillae. Figure
2.3 is an interior view of a modern chicken {Gallus
gallus) eggshell. The fibrous membrane has been
partially removed to expose the mammillae. In Figure
2.4, the connection of a mammilla to the underlying
10

fibrous membrane can be seen. This photomicrograph is
also of a chicken eggshell.
Above the radial units, the crystals begin to grow
upward toward the surface. They radiate outward until
they meet the radial units of the neighboring mammilla,
then continue parallel toward the exterior of the shell.
This has been named the zone of tabular aggregates (ZTA)
(Mikhailov 1991). Together with the zone of radial
crystals, the zone of tabular aggregates makes up the
mammillary layer. Figure 2.5 is of a Rhea {Rhea
americana) eggshell. The top of the photomicrograph is
toward the surface, and the bottom is toward the interior
with the fibrous membrane visible at the bottom. This
edge-on view of an eggshell fragment is referred to as
the radial view. Figure 2.1 illustrates a radial view.
Figure 2.1 Generalized Egg Illustrating
Radial View
11
The radial view allows the shell to be seen from the
inside to the outside of the shell. It is in this way
that we can look at the crystals that make up the shell.
The mammillary layer is visible in the bottom half of the
photomicrograph. The discrete crystals give way to what
is referred to as the zone of squamatic aggregates
(Mikhailov 1991) or squamate zone. This section has also
been referred to as the spongy layer, the palisade layer
(Solomon et. al. 1994), or the prismatic layer (Hirsh and
Quinn 1990) . This squamate zone is identifiable in
Figure 2.5 above the zone of tabular aggregates. Many
vesicles pierce the squamate zone. I have found that
some species appear to have many vesicles, such as the
birds of prey, in comparison to other species, such as
the chicken, which have fewer. The number of vesicles
also varies throughout the squamate zone (Solomon et. al.
1994). Above the squamate zone is a thin layer called
the external zone (Mikhailov 1991) . This zone varies in
compaction and crystaliinity. Some samples have a
readily recognizable separate layer, as can be seen in
Figure 2.6 of a Rhea. The external zone is contacting a
pore and can be seen running from the center right to the
12

bottom center. Above, this zone is contacting pore
material; and below, it meets the squamate zone. The
contact between the two zones is fairly distinct.
Figure 2.7 is of the same area of a Prairie Falcon
(Faico mexicanus) eggshell. The external zone is on top,
and the squamate zone is below. The distinction between
the two is not completely distinct, as in the previous
example. Here, the two zones are differentiated by their
relative compactness. The external zone lacks the number
and degree of vesicles that are contained within the
squamate zone.
Non-Avian Dinosaur Eggshell Microstructure
Non-avian dinosaur eggshell microstructure is
similar to avian microstructure, as should be expected
from their close phylogenetic relationship. There are,
however, some very important differences. The
generalized non-avian dinosaur eggshell does not contain
either the squamate zone or the external zone. The shell
thickness is comparable to that of the birds, but the
mammillary layer takes up the extra thickness. This zone
13

extends to the surface. This generalized form is shown
in Figure 2.8.
More specifically an attempt to further
differentiate the eggshells of non-avian dinosaurs has
led to the creation four basic groups based on pore
geometry and crystal pattern:
Augustispherulitic: "pore canals narrow, more or less
straight, and of fairly constant diameter; shell units
interlock laterally and have tendency to fuse".
(Hirsch and Quinn 1990).
Prolatospherulitic: "pore canals rather irregular and of
varying diameter, changing their course; similar
crystalline structure as in the angusti-type". (Hirsch
and Quinn 1990).
Tubospherulitic: "pore canals similar to the a/igusti-type
with some enlarged openings; shell units not
interlocking and never fused". (Hirsch and Quinn
1990).
Multispherulitic: "narrow, more or less straight,
extremely numerous and closely spaced pore canals;
crystalline structure unknown." (Hirsch and Quinn
1990).
14

Two additional groups added by Hirsch (1994) are
Dendrospherulitic and Obliquiprismatic. Additionally,
the Augusti-type has been divided into spherulitic and
prismatic forms based on the whether or not the crystals
continue parallel or interlock.
Figure 2.9 is a radial cross section through a
Maiasaura eggshell. The crystallites appear to be fused.
Later, we see that in thin section, the crystals can be
seen as distinct. The pore canal in the center is fairly
regular continuing upwards into the shell. Based on this
information, this shell fragment would be best classified
as angustiprismatic. Figure 2.10 is of another fragment
of Maiasaura eggshell. The interlocking crystals are
readily visible. In the middle, a large amount of
recrystallization has occurred.
Zhao (1994) put forth an interesting deviation from
these models. In this case, growth proceeds from the
organic core out to the zone of tabular aggregates, then
begins again through several layers. Shell thickness is
not increased, only divided into several layers. Figure
2.11 is from a sauropod. What appears to be the beginning
of a crystal of the shell is actually positioned halfway
15

from the base and the surface. Furthermore, it is
located above another similar crystal.
Mineralogy
Many zones of recrystallization can be seen. The
most extensive of these can be seen in Figure 2.10. This
appears to simply be calcite to calcite
recrystallization. Figure 2.12 is of the base of a
Troodon shell. Almost all of the lower part of the shell
has been recrystallized, again probably to calcite.
We can correlate our samples with the groups set up
by earlier workers. With an increasing collection of
known samples, we will be able to identify shell type to
its respective dinosaur group. Also, we are now able to
take the samples we have, and with the same technique,
those we obtain and identify those parts we wish to do a
mineralogical study.
Eggshell Measurements by S.E.M.
Using the scale of the photomicrographs of the
scanning electron microscope, measurements of the shell
thickness and the thickness of the individual layers of
16

the shell were taken. These measurements were then
charted to gather information as to the differences or
similarities between the shells of individual species.
The measurements used in the chart are as follows:
SZ/ML is the ratio of thickness between the squamate
zone (SZ) and the mammillary layer (ML). This was found
by dividing the thickness of the squamate zone, as
determined from SEM photomicrograph scale, by the
thickness of the mammillary layer.
Height and width were measured from photographs of
the whole egg using the millimeter ruler used for scale.
For the non-avian dinosaur eggs, height was calculated
from spherocity divided by width. Width was found by two
times the radius.
Spherocity is a measure of the roundness of the
shells and, for the bird eggs, is found by taking the
width divided by the height. For the non-avian
dinosaurs, this value is found by using the average
roundness for all the bird samples.
The radius for the bird eggs is found by taking
dividing the width in half. In the case of the
17

dinosaurs, this was back calculated by dividing the
circumference by n and taking the square root.
The equatorial circumference is found by multiplying
the radius-squared times TI. For the non-avian dinosaurs,
the circumference was found by plotting the circumference
to shell thickness for all the birds on a log-log chart.
Using a straight-line correlation, the fossil dinosaurs
were plotted by thickness and circumference was
determined from the regression line for the avian
dinosaurs.
Thickness of the shells was taken from SEM
photomicrographs using the scale of the bar produced by
the microscope and printed on the photomicrograph. The
units are in micrometers ()Jin) .
Discussion
Several plots were created using the data presented
above. One such plot was a comparison between eggshell
thickness and the circumference of the eggs. The
thickness (im) of each avian eggshell was plotted on the
horizontal axis, and the circumference (cm) was plotted
on the vertical axis. The plot scale was set to
18

logarithmic for both axes. Next, a regression analysis
was performed to acquire a predicted circumference line.
The resulting formula for this line is y = 0.0188x - '' .
This equation suggests that the circumference of the egg
(in centimeters) is equal to the constant 0.0188
multiplied by the shell thickness (in micrometers) raised
to the 1.1421 power. The r-squared value equaled to
.903, allowing us to place a high degree confidence in
the resulting regression equation. From this equation,
other eggshells can be plotted by shell thickness to give
an approximate shell circumference. Care must be used in
a determination of circumference in this manner. Shell
thickness can vary depending on the point of measurement.
This has been provided only as a rough estimate for
determining shell size from eggshell fragments.
The ratio of the squamate zone (SZ) to the
mammillary layer (ML) was plotted against the thickness
of the shell. In examining this resulting graph, a clear
division between the paleognathae and neognathae can be
seen. For the neognathae, as the ratio of the SZ/ML
changes, the shell thickness remains within a range from
90^m to 700|Lim. In the case of the ratites, as the shell
19

thickness increases, the squamate zone increases in
relative thickness to the mammillary layer.
20

c u r e s . z. Core of a
•urke\" ^ .cosne- l

r ' laure z Photcrr.icrograpr. of ^ r . t e r i o r Surf ace
P r ri_c.<er. ^ggshe^i

Figure 2.4 Photomicrograph of Fibrous Membrane
of a Chicken Eggshell
23

r'r.otorr.icroorap. ._ , I.. a
jre 2.5 of £ Radial : Rhea Eooshel^
z

^feplc
•^- r\~ ,,' 'r.o i: igure z . c
rograpr. of Externa^ CI a Rnea Zzzs'rie^l
Surface

-•^ "J 1 >" o
r l a u r
e Fa-ocn Eoosne.
^ c

i\or.-.-viar. T^ -• ^ ^ _, ^ ^
Ka-
c - • 1 >- c
^ ^ '
. c : _ - i c ; _ -_^,'..—
y.a~-
Soructure ci Avian an: >- ~ " ~ e ^ ."." T {sjor. — cv'ic:!- — w iG —_ i j^^s , ie_is

Figure 2.9 Photomicrograph of Maiasaura Eggshell
28

r icuT' Pnctcr.ic: ;oi_c;-L o t ; !wU ion
+- V-, ->^ r^ 1 -, '-T "l-- »/ „ , - e -3zas3'jr3 zioc^s. V'. ,

r i g u r e 2 . Photorr . ic rocrapn of
L
a Saurop: "C"* ,'-T rr c •'; C-

-3z

o O O LD LD L^ 0 0 CO cs! CO r o
• ^ CSJ CNJ Csj r - i
o 'J-, L i LT:. LD L I O ^ '!=• (N 0 0 CN r-- ^
L O C L D
LO ro c\
>
TK
rr-
•r\; CN; CS] CNJ CN] C \
^ 00 'sD CO -C t ^ L O r-^
T—I PO CO ^cr
CO ro -^ c\' cr. CO CO o — uo o ^ CO r^ "vT)
o o o
CN
Q) — Z^ -C: r E 2:: C £
CN
CO
c
\0 ^ JO
C O L.O •=:r
c\
a
CD -^ CO u ^ I
> r •
SZ Z2 -^
^ . ^ •J~) - w
o o o o I I I I
cc m 00. CO c\ c v ^ r - . --
o c o
CvJ r \ ' ^ CO V£5 i_0 O CNJ 0\' CN; Ovi
^ r^ r - CO CO r - v o r - r~~ r^ r~
o o c o o
CM C" _0 r - L O ^ C : ex <—: vT) i n <T ivD
r \ 0 ' ^ w r - L O o o c \ j c o - = c - < — I
00 -^ 'w m '<x> -'^ LO _": oo oo 'c-
O")
00 r^
LP_
r~ •j~)
• — !
' ^ o
^^^ ^ p ^
oo -pr" „
C C
^ CO - oo —, -T^,
r~ 0 \
c :
c
O 00
r - r ^ 'c- CO >sD L.O r - — ' c o I—i cT' 'C^ - ^ •<?• ^ oo 0^'
^ ^ O " ^ O "C .—:
O
z: o ^ — LH cr,
cc
!T 03 r-.
c := c
is ::3 03
--r\ w
r r —" .— —
a x-l
D ., ' . — i
^ >
^
r ^ —: fT --^
> O i ^
o. CO
o
^ 5
~
—! 5 C
:c •— '— D> d
•r-,
i ^
c (D > ST
/-v^
.- • —
' ^ • s---
^
C^
r ,
'D O O ^ t -
^ r-
rc - i j • r*J
p -
::3 fT'
c/: 03
- i-J^
i2 ^

00 D c
03 0
o
-O o ^ CO
CM OO LO . '-^ r^^.
<o
. CO Ovi Os:
c cr, » ;
CTi 0 0 ,—
• cr. 1 —
'~
c o\-/- ^
_' •
w
CO
r-0 0
. C\; O 'C-
O OO 0 0
c\ r\ o
w -ex
'^
n
O ON: LO
CO VX)
LO _ , 'C"
~ ' L O ^ ^ L.O
o -^ o.- "'
c ~ 03
CD — I— rn
cc O -^
o >
t) ^ ii:
C ^ C > i
^ ' w >wL.
-.— • ' —
r-T-C r
^ —
• r -
c *»<
6
Q .— r
r> fr-,
'^
c r v ' £- = : ! - > C. M: 5 —• rr 0 i- • - rj 0 = 0 : ^ 2 : ^ 0 5-!^- 2:
^ ^

03
Q
C
• H > <
i-J d) 5 0
03 - H
--^
.—. 03 ;
j _ '
03
i i
i 1 ' ' i i i ' ' M H • h • , ., , 1 , ^v , , ' H ' 1 ! :
\ * \
\ •
,
1 1 i : i l l
M i .
i 1
!
00' V O
S o "^ i;
1,
>. ; : 1 • :
s •
• \ \ * *
^
;
•
i
i h • ! i : : ! i 1 ; M ! i ! •
o o
a) u c CD
CD
U o
o ' — i
o C '
,, ^ — c Z3
^ CO CO (U • i _ ^
ick
^^ b-
00 , — I
Osi
CD i j
.—1
S-i
o , ,
Z I CO
l/J
—'
:>
C/J CO
ckn
e
CO
c c c c c
o o o o
• o o
o o o o
o o o o
(UIO) ^ ecus,
34

o o o o I — I
T
CO 0) -P H 4-J
03 •^
1
\
\
r
o o o r—1
(uir
• Ratites
•Galliformes and
Answeriformes
AOther
Neognathes
xGobipipus
hes
1 <i
1
'4 '
-1 1 ( i
ii^
•t
4
D —1
Ji
7
1
^
x -1
1 ,._
O O r-O rH rH
1) ss9u>[0Tm TTsqS
o ^ r-l
LOO
1.000
10.
Layer Thickness
Ratio
Figure 2.14
Layer
Thickness
versus
Thickness
of Sh
ei
- CD
35

CHAPTER III
X-RAY DIFFRACTION ANALYSIS
Methods of X-ray Diffraction
X-ray powder diffraction has proven itself to be a
valuable tool in geochemistry and mineralogy. Its main
use is to identify minerals present within a powdered
sample. This is accomplished by the detection of a beam
of radiation reflected from the sample to be studied.
X-ray radiation produced by an X-ray generator
begins with a high voltage source. In the case of the
machine used for our experiments, an X-ray tube emits
energy that strikes a copper plate. The energy excites
the electrons in the copper, causing x-rays to be emitted
in all directions. This radiation is channeled out of
the generator to the sample to be studied. A detector
receives refracted beams of the x-rays and then transmits
the information it receives to the computer
instrumentation (Moore and Reynolds, 1989) .
The X-ray tube is powered by a ten to fifty kilovolt
energy source. Energy is released across a gap in the
circuit to strike a copper plate, referred to as the
36

'target.' Within this copper plate, electrons move from
a higher orbit to replace those removed from the lower
orbits (Moore and Reynolds, 1989). As the electrons
jump, they release characteristic x-rays for the target
material and the shell positions that were involved. The
x-rays are emitted as waves and have a vector quality
similar to visible light. The wavelength, however, is
much shorter. These x-rays are allowed to escape the
tube tower by a controlled shutter, forcing the waves to
the sample (Moore and Reynolds, 1989).
The diffractometer, also called the goniometer, is
where the x-rays from the source come in contact with the
sample to be studied. The incoming x-rays are filtered
by the Seller slit and the divergence slit (Moore and
Reynolds, 1989). These slits control the beam that will
strike the sample. The divergence slit controls the
width of the beam and the Seller slits make the x-rays
uniform. On the detector side of the diffractometer are
more Seller slits, a receiving slit, and a scatter slit.
The receiving slit controls the amount of rays entering
the detector, and the scatter slit eliminates any
scattering that has occurred.
37
The diffractometer rotates the sample about a
uniform degree set in the computer and at specified time
increments. This is to get the amount of radioactive
counts per time unit. As the detector rotates around the
sample and collects counts of radiation, the sample is
also rotated so that the angle of the incoming waves
diffracts at the same angle as the exiting waves.
The detector is mounted on an arm that rotates
around the sample chamber. Its function is to capture
the incoming diffracted x-rays and provide the computer
system with the number of 'counts' of radiation it is
receiving. The detector is a hollow tube filled with
Argon gas (Moore and Reynolds, 1989). The center of the
tube contains an anode wire connected to a high voltage
source. As the x-rays enter the chamber, the Argon atoms
lose an electron. These electrons, attracted to the
anode wire, create a current that is measured by the
computer system. The amount of current generated gives
an intensity for that angle of diffraction.
The computer system measures the intensity of the
diffracted beam. The intensity is then printed either as
a scrolling pattern or in counts per preset time unit.
38

The instrumentation also controls the speed and angle
increment of rotation of the detector arm and sample.
The waves reaching the sample are uniform in that
they are parallel and in phase with each other. This is
ensured by the slits mentioned previously. As these
parallel waves strike the sample, two waves result from
the contact. The first type is called the primary waves.
These are the original waves that continue in a straight
line into the sample until they are absorbed. These are
unimportant in x-ray diffraction. The other wave type is
the secondary x-ray. These secondary x-rays are what is
read by the detector. The intensity of the sum of these
waves is what is important in x-ray diffraction.
Bragg's Law is the relationship between the incident
wave angle that strikes the sample, the wavelength of the
wave, and the distance between lattice planes of the
sample powder. The wavefronts that reach the sample
being diffracted are all in phase. For the secondary
waves to be of the greatest intensity, they must be in
phase after the diffraction. For instance, if wave 1
strikes the surface, wave 2 must travel a distance that
will allow it to complete one wavelength before becoming
39

parallel to wave 1'. Using geometry, we get the following
equation
HA = H'A = d X sin 0 (3.1)
In equation 3.1, HA and H'A are distances between those
points, d is the distance between lattice planes, and 0
is the angle between the x-ray beam and the lattice
plane.
From equation 3.1, the distance from H to H' is:
HA + H'A = 2d X sin0. (3.2)
Adding the x-ray into the equation gives the following
(Moore and Reynolds, 1989):
2d X sin @ = n X. (3.3)
In the above equation, X is the wavelength of the beam
and n is an integer. Solving equation 3.3 for the
distance between lattice planes results in Bragg's Law;
d = n x { X / 2 X sin 0 ) . (3.4)
40

We find that when n (the distance between H and H') is
equal to a whole number (1,2,...), the waves will be in
phase after the diffraction. However, when n is equal to
a whole number plus one-half (^,1^,...), the resulting
phase will be destructive. Any n between these values
will produce a varying degree of destructiveness
depending on its value.
The intensity of the beam reaching the detector can
be affected by eight factors. The first is called the
structure factor (Fhki) • This is the effect that the
atoms within the powder have on the beam. The intensity
of the original beam (lo) affects the resulting
intensity. The volume (v) of the material being
diffracted alters intensity. Another factor is the
multiplicity factor (m). This is the effect of the
crystal symmetry and number of lattice planes. The
Lorentz-polarization factor (Lp) attempts to correct for
inconsistencies in the change of the sine of theta as
theta changes and the polarization of the diffracted
beam. The atomic scattering factor (fo) is a correction
for secondary waves destructing or amplifying the main x-
41

rays. Phase differences from differing temperatures is
considered by the temperature factor (T). Finally, the
absorption factor (A) takes into account the amount of x-
rays being absorbed by the material. All of these
factors are summed, giving the final intensity equation
for the indices hkl.
2 Ihki=IoXLp (0)xmx I Fhki I xA(0) xT (G) xv ( 3 . 5 )
Avian and Dinosaur Mineralogy
Using the x-ray diffraction principles described
above, avian and dinosaur eggshell was tested for mineral
composition. The shell was first prepared for
diffraction. This was accomplished by grinding the shells
to a fine powder using a mortar and pestle. The powder is
then packed into the sample holder, which is placed into
the diffractometer. The diffractometer output is in the
form of a graph. This graph plots relative intensity in
radiation counts per degree of angle of incidence between
the beam of radiation and the sample. As the sample is
rotated through various degrees, intensity varies. The
resulting chart produces a relatively constant base
42

punctuated by peaks of high intensity. The placement of
the peaks and the relative intensity for each varies
depending on the mineral content. These intensity peaks
are compared to tables of known minerals in order to make
a mineralogical identification.
Upon analysis, the main mineral content of the
samples was found to be calcite. This can be seen by
comparing the data from Tables B.l to B.3 with the x-ray
diffraction standards table for calcite (Table B.4). The
d value of 3.05 for a maximum peak is an x-ray
characteristic of calcite. In some of the dinosaur
samples, quartz was also found to be present. This can
be seen in table A.5 as having a d value of 3.34 for the
maximum peak. The relative intensity of the quartz peaks
was many times lower than that of the calcite peaks.
This lower relative intensity suggests a lower quantity
of quartz in the sample. The origin of the quartz was
originally thought to be replacement. After looking at
the samples with a polarizing light microscope, the
origin of some of the quartz was confimed to be
chalcedony replacement of the original calcite. In other
cases, it was found to be sandstone matrix that was
43

cemented to the shell exterior and filled pore spaces
within the shell. In either case, ohe original shell
material was composed of calcite.
44

CHAPTER IV
LIGHT MICROSCOPY
Methods
The dinosaur and avian eggshells were examined
under a light microscope. The purposes of using the
-ighr rrdcroscope incluoed the examination of the
rr.inera_ogy of the she_ls and their surrounding rr.aorix
and tne observation of the structure of the crystals
that ::;ake up the shell.
Preparation began by piecing off small chips that
were approximately two centim.ezers in size. These
pieces were mounted in epoxy and ground into one thin
section for each specimen by the technician of the
~exas Tech Geology department. The mounting done so
that each sample would oe cut oo expose a radial view
Mineralogy and Microsoructure
Each rhin section was stuaied for mineralogical
content. Calcite (CaCOs) was found to be the primary
mineral present for a^^ shelis. Under poiarized
45

light, the calcite in these sam ples was tan in color
and had.a symmetric extinction as indicated by Ehlers
(1987) . The offsetting extinctions of the crystals
within the shells revealed the interlocking
relationship between these crystals. For the avian
eggshells, r.o other mineral appeared present. The
dinosaur eogshells contained variations of quartz
(Si02) . This quartz inc_uded and surrounded the
original calcite of the eggshell. Some of the quartz
was present as grains. These grains made up the
sandstone r.atrix that surrounding the eggshells as
they were curled. Other quartz is chalcedony, filling
pore spaces and, in places, partially replacing the
original calcite shell.
The "icrostructure types of the bird eggshe_-s
can be divided between the Palaeognathae and
Neognathae. The Palaeognathae eggshells have two
distinct .avers when viewed through crossed nicols.
The interior of the shell has distinct prismatic
crystal structure. This prismiatic structure abruptly
ends, giving a spherulitic exterior. This form varies
between the species.
46

The emu has only one quarter of its eggshell in
prismatic form. The rhea, however, has two thirds of
its eggshell miade up of distinct prismatic form. The
prismatic section of the ostrich makes up about one-
fifth of the shell thickness. The spherulitic section
of the ostrich is very different from that of the emu.
The individual crystals of the ostrich egg retain a
columnar snape all the way to the shell exterior.
This is similar to the Neognathae eggshells. The
difference between the ostrich and the Neognathae is
that the prisms of the ostrich are not as consistent
and uniforiTL. While oriented in the correct direction,
the prismis of the ostrich vary in thickness and
positioning within the shell.
When viewed through crossed nicols, the
Neognathae eggshells retain a prismatic shape from
interior to exterior. Although the boundaries between
the crystals are erratic, individual crystals are well
defined from the surrounding crystals. Viewed through
a light microscope, the shell appears as bands of
light and dark extinction zones. Each band is fairiy
constant in thickness.
4 7

The microstructure of the dinosaur eggshells
varies with species. Each shell can be typed
according to the structural morphotypes described in
Chapter II. The basic morphotype that best fits
Troodon is ornithoid.
The Troodon eggshells are very similar to the
modern bird eggshells when viewed through a light
microscope. This similarity can be seen in the
crystal structure. Both the modern bird shells and
these dinosaur shells have interlocking crystals that
extend in the prismatic layer from the mammillary
layer to the exterior surface of the eggshell. A
sharp crystal boundary exists between adjoining
crystals in the prismatic layer. This can be seen as
neighboring crystals exhibit extinction at separate
degrees of sample rotation. Both avian and these
dinosaur samples also contain a very visible
mamimillary layer.
Figure 4.1 is of Troodon, At a magnification of
lOx, this photograph views the eggshell in plain
light. The letter A in the bottom-right of the
picture is located on the interior side of the shell.
48

The line from A to B is drawn from, the interior of the
shell to the exterior of the shell. This line fol.ows
the c-axis cf the crystals that make up the shell.
Short, thin, dark lines can be seen running at a 45-
degree angle frcrr; the c-axis throughout the shell.
These lines are cleavage planes for the calcite
crystals.
A other di' csaur eo'^'^'riQ^I-S aoDear to be of the
Dincsaurcid type. Both sauropod shells can be best
describee as tubospherulitic. Figures 4.2 and 4.3 are
both cf a sauropod. Figure 4.2 was taken at 5x vvith
crossed niccls. In this view, the replacement cf the
original calcite by chalcedony is clearly visible.
The rep_acement occurs from the exterior and interior
surfaces invrard, using the pores as an access to the
crystals. Fioure 4.3 is the same view under plain
light. In this second view, the replacing chalcedony
^ appears as lightened areas within the shell. Under
plain light, vre see that the replacing quartz takes
the shape of the original calcite.
As the shell grows, excess material is included.
This extra organic ingredient to the shel^ can be seen
as a layering texture within the shell. In Figures
4.2 and 4.3, the organic content appears as lines
running perpendicular to the c-axis of the crystals.
This layering is partially retained by the replacing
chalcedony, suggesting that the replacement was a
gradual process of calcite removal that was
iminediately followed by chalcedony deposition.
Another sauropod can be seen in Figure 4.4. Much
of the original caicite has been replaced. An
original crystal of calcite remains at the center left
of the photograph, as well as partial remains
throughout the top half of the photograph. At the
bottom one fourth of the photograph is the matrix
which the shell was contained after burial. A line of
chalcedony cuts across the shell from the center
right, into the shell at the center, and upward to the
upper left of the photograph. This chalcedony not
only crosses the shell, but also cuts through the
matrix surrounding the shell. This implies that this
reolacement is secondary to the burial of the shell.
The last dinosaur sample is of the Maiasaura.
This shell appears angustiprismatic. The prisms that
50

make up the shell are not uniform in size or
thickness, but they are oriented in an interior-
exterior direction. This shell has the greatest
amount of organic material included within the shell
This included material gives the shell a strong
layered effect when viewed in plain light. The
resulting effect gives the eggshell an appearance
similar to the rinas of a tree.
Discussion
Comparing the dinosaur eggshells, a progression
can be seen in the steps leading to the miodern birds.
The Maiasaura eggshells bear the least resemblance to
the avian eggshells. These eggshells contain only one
layer, the mammillary layer. The growth begins at the
organic core. Crystal growth proceeds outward to the
surface with fairly uniform crystal growth. The
Titanosaur eggshell follows this form. It too is only
composed of the mammillary layer.
When we reach the theropods, a change in the
structure can be seen. The theropod eggshells retain
the mammillary layer as seen in the ornithischian and
51

sauropodomorpha. Through light microscopy, we can see
the addition of the squamate zone. In Figure 4.5, we
see a Troodon eggshell (5x). The mammillary layer and
the squamate zone appear different as viewed in cross
nicols. The mammillary layer can be identified, as it
appears brighter than the squamate zone. The squamate
zone is now visible as a distinct shell layer. The
crystals are irregu_ar and interlocking. As we get
closer to the birds, the crystals become more
palisade.
In the avian eggshells, the crystals are very
distinct in light microscopy. There is a strong
linear relationship to the c-axes. More importantly,
we see the addition of the third layer, the external
zone. This is very evident in the emu eggshell as
viewed in plain light (Figure 4.6). The interior is
to the bottom cf the photograph. The mamimillary layer
is distinct. It appears as tne brown and white
interior layer. Throughout the crystals, layers of
growth are evident. Above this layer, the squamate
zone can be seen. This zone appears homogeneous
laterally. Toward the exterior, the zone becomes less

compact. Sitting immediately above the squamate zone
is the external zone. This zone is easily
distinguished as a compact zone of calcite. The
external zone is only a small percentage of the
overall shell thickness, but it is a very important
identifier to the t\^e of dinosaur which produced the
egg.
Supported by fossil evidence, current thought
holds that the m.cdern birds are theropod dinosaurs.
Phyiogeneticaily, their closest extinct relatives are
other theropod dinosaurs, such as the Oviraptor ani
Troodon. According to this thought, the m.odern birds
can be placed in the saurischia with sauropods. It
would be expected that the eggshell evidence support
the anatomical evidence. We can see a transition from
the non-theropod dinosaur eggshells to the sheiis of
the theropods. There is the addition cf the squam ate
zone and a decrease in the surface ornam.entation. We
can also show a change w ithzn the theropod dinosaurs.
The avian theropods have added an additional layer,
the external zone, v;hich the other theropods lack.
^ ^

^ - / P -y^ /~, ^ 'y- r2. c: <z: ": •
v _ . : ^ - _ - ^ K ^ ' ^ ^ s ^ f ^' ^ r.^ " h s zr c c c li s
-^ - ^ -• r- -- f witr. o » ^ , - y^ ^-~i
. w t ; ^«. k^'.. y .
^r ± ±^ I '. • ' ^ ^ r^. - ^ ^ > V -
; ^ ^ — - - . p - t - p-", '-N- -|-^, o o T , c - i c i ' ^ c -!-^ - i c t o r "
1 -;
D-t

Figure 4.1 Photograph of Troodon Eggshell Showing Cleavage Planes (lOx)

Figure 4.2 Photograph of Sauropod Eggshell Viewed
Through Crossed Nicols (5x)
56

Figure 4.3 ootograph of Sauropod Eggshell Viewed
Through Plain Light (5x)
R'

_ > V- /-N * - r-s "T > " —, r—V r~,
sr.e__ viewe: Tn; fh C; ::n owing

r i g u r e 4 . o
rpv-> ,TJQV^ ^zrosssci N ~ c ^ ' ^ (^x) ewG

Figure 4.6 Photograph of Emu Eggshell Viewed
Through Plain Light (lOx)
60

BIBLIOGRAPHY
Card Number 5-0490 (Quartz). Swarthmore, PA: Joint Committee on Powder Diffraction Standards, n.d.
Card Number 5-586 (Calcite). Swarthmore, PA: Joint Committee on Powder Diffraction Standards, n.d.
Chatterjee, S. The Rise of Birds: 225 Million Years of Evolution. The Johns Hopkins University Press, Baltimore, 1997.
Craycraft, J. ''The origin and early diversification of birds"; Paleobiology 12:383-399, 1986.
Ehlers, E.G. Optical Mineralogy, pp. 107-109. Blackwell Scientific Publications, Palo Alto, 1987.
Gauthier, J. ''Saurischian monophyly and the rise of birds"; pp. 1-55 in K. Pandian (ed.), The Origin of Birds and the Evolution of Flight. California Academy of Sciences, San Francisco, 1986.
Hirsch, K.F. "Upper Jurassic eggshells from the Western Interior of North America"; pp. 137-150 in K. Carpenter, K.F. Hirsch, and J.R. Horner (eds.). Dinosaur Eggs and Babies. Cambridge University Press, Cambridge, 1994.
Hirsch, K. and B. Quinn. "Eggs and eggshell fragments from the Upper Cretaceous Two Medicine Formation of Montana" J. Vert. Paleo. v.10, no. 4, pp. 491-511, 1990.
, K. Sabath, and S. Kurzanov. "Eggs and nests from the Cretaceous of Mongolia"; pp. 87-115 in K. Carpenter, K.F. Hirsch, and J.R. Horner (eds.). Dinosaur Eggs and Babies. Cambridge University Press, Cambridge, 1994.
61

Mikhailov, K.E. "The Microstructure of Avian and Dinosaurian Eggshell: Phylogenetic Implications"; in K. Cambell (ed.). Papers in Avian Paleontology Honoring Pierce Broderick. Contributions in Science. Natural History Museum of Los Angeles County, Los Angeles, Ca. pp. 361-373, 1991.
Moore, D.M. and R.C. Reynolds, Jr. X-Ray Diffraction and the Identification of Clay Minerals. Oxford University Press, New York, 1989.
Solomon, S.E., M.M. Bain, S. Cranstoun, and V. Nascimento. "Hen's egg shell structure and function"; in R.G. Board and R. Fuller (eds.). Microbiology of the Avian Egg. Chapman and Hall, London, pp. 1-24, 1994.
Zhao Zi-Kui. "Dinosaur eggs in China: On the structure and evolution of eggshells"; pp. 184-203 in K. Carpenter, K.F. Hirsch, and J.R. Horner (eds.). Dinosaur Eggs and Babies. Cambridge University Press, Cambridge, 1994.
62

APPENDIX A
PHYLOGENY OF BIRDS SAMPLED
63

Rhea
Ostrich
Emu
Canada Goose
Domestic Chicken
Wild Turkey
Pied-Billed Grebe
Brown Pelican
Sora Rail
Forster's Tern
Blue Heron
Pigeon
Turkey Vulture
Prairie Falcon
Osprey
f •
•
•
•
•
f
•
•
•
•
•
Red-Shouldered Hawk^
Great Horned Owl ^
Belted Kingfisher A
White Necked Raven 0
Figure A.1 Pnylogeny of Birds Sampled
64

APPENDIX B
X-RAY DIFFRACTION TABLES
65
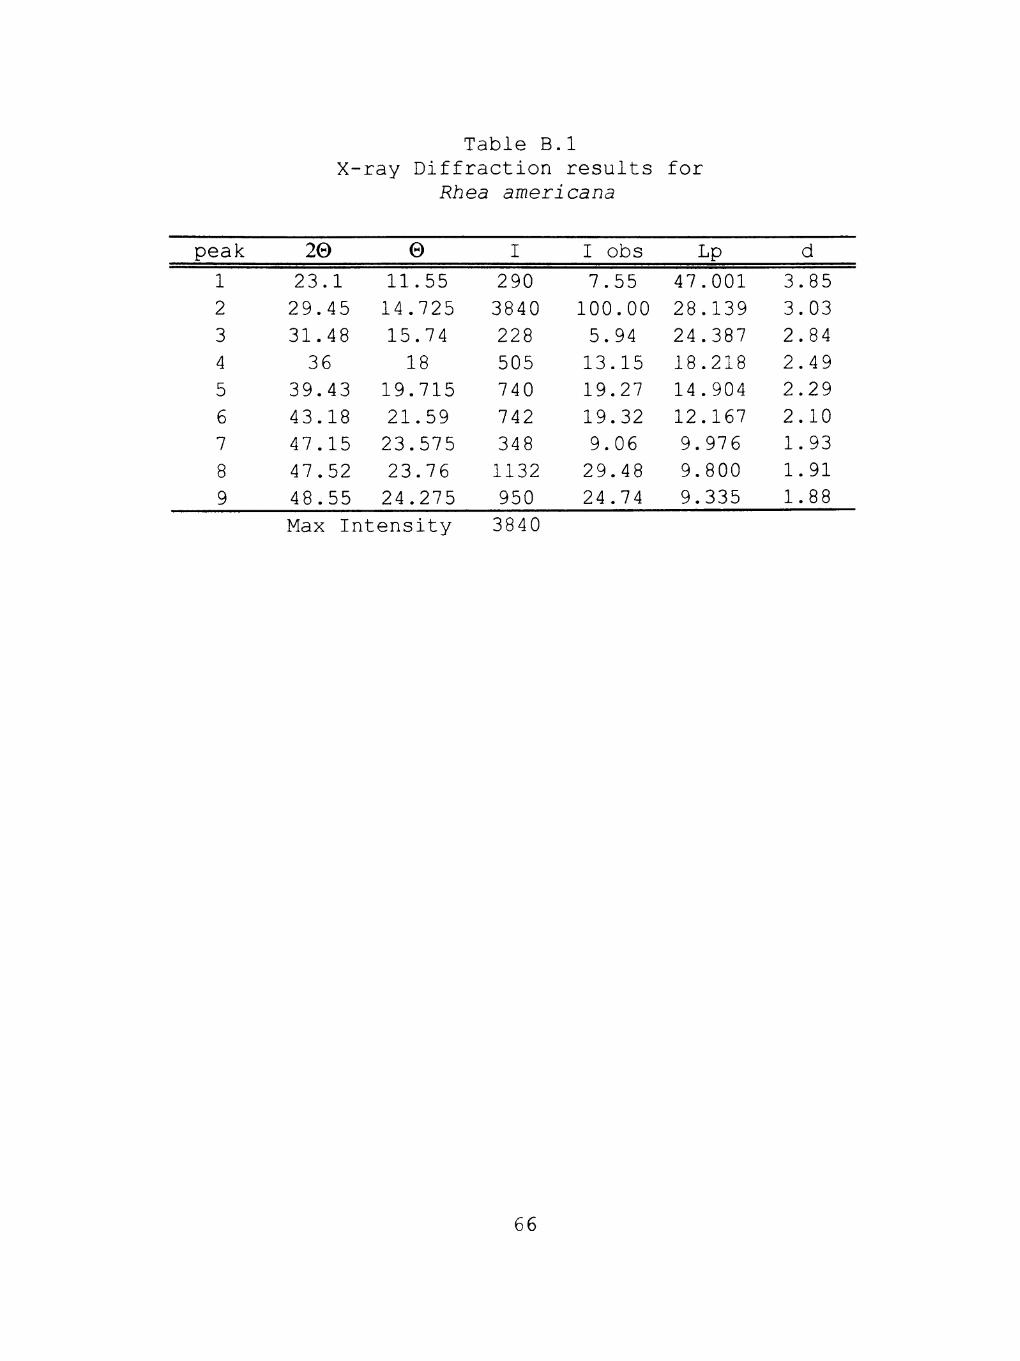
Table B.l X-ray Diffraction results for
Rhea americana
peak
1 2 3 4 5 6 7 8 9
20
23.1 29.45 31.48 36
39.43 43.18 47.15 47.52 48.55
0
11.55 14.725 15.74 18
19.715 21.59 23.575 23.76 24.275
I
290 3840 228 505 740 742 348 1132 950
I obs
7.55 100.00 5.94 13.15 19.27 19.32 9.06 29.48 24.74
Lp
47.001 28.139 24.387 18.218 14.904 12.167 9.976 9.800 9.335
d
3.85 3.03 2.84 2.49 2.29 2.10 1.93 1.91 1.88
Max Intensity 3840
66

peak
1 2 3 4 5 6 7 8 9 10 11 12 13 14 15 16 17
X-
20
23.05 26.65 27.9 29.41 31.41 35.97 38.38 39.4 43.15 44.55 47.1 47.5 48.47 50.08 26.37 27.38 58.03
Table B. ray Diffraction
0
11.525 13.325 13.95 14.705 15.705 17.985 19.19 19.7
21.575 22.275 23.55 23.75 24.235 25.04 13.185 13.69 29.015
,2 results
Troodon
1
297 170 98
8310 180 510 97 815 785 295 350 1288 1162 80 218 455 138
I obs
0.36 0.20 0.12 10.00 0.22 0.61 0.12 0.98 0.94 0.35 0.42 1.55 1.40 0.10 0.26 0.55 0.17
for
Lp
47.214 34.801 31.577 28.221 24.504 18.251 15.822 14.929 12.186 11.341 10.000 9.810 9.370 8.698 35.587 32.864 6.223
d
3.86 3.34 3.20 3.04 2.85 2.50 2.35 2.29 2.10 2.03 1.93 1.91 1.88 1.82 3.38 3.26 1.59
Max I n t e n s i t y 8310
67

peak
1 2 3 4 5 6 7 8 9 10 11 12 13 14 15 16 17 18 19 20
X-
20
23.1 26.65 27.95 29.48 30.96 31.45 36.05 36.57 38.4 39.5 43.23 44.6 47.25 47.6 48.6 50.17 50.8 56.6 57.45 58.1
Table B. ray Diffraction
0
11.55 13.325 13.975 14.74 15.48 15.725 18.025 18.285 19.2 19.75 21.615 22.3 23.625 23.8 24.3 25.085 25.4 28.3 28.725 29.05
,3 results
Maiasaura
I
270 215 89
7750 100 182 580 82 179 952 901 210 328 1260 1028 102 102 219 430 120
I obs
3.48 2.77 1.15 100.00 1.29 2.35 7.48 1.06 2.31 12.28 11.63 2.71 4.23 16.26 13.26 1.32 1.32 2.83 5.55 1.55
for
Lp
47.001 34.801 31.457 28.078 25.277 24.437 18.163 17.600 15.804 14.845 12.135 11.312 9.928 9.763 9.313 8.663 8.420 6.584 6.366 6.206
d
3.85 3.34 3.19 3.03 2.89 2.84 2.49 2.46 2.34 2.28 2.09 2.03 1.92 1.91 1.87 1.82 1.80 1.63 1.60 1.59
Max I n t e n s i t y 7750
68

Table B.4 X-Ray Standards for Calcite
d 3.04 2.29 2.10 3.86
I/Il 100 18 18 12
3.86 3.035
2.845 2.495 2.285 2.095 1.927
1.913
1.875 1.626 1.604 1.587
1.525 1.518
1.510 1.473 1.440 1.422
1.356 1.339
12 100 3 14
18 18 5 17 17
4
8 2 5 4
3 2
5 3 1
2
102 104
006 110 113 202 204
108 116 211 212 1010 214 208 119 215 300
0012 217
2010
d A I/Io hkl d A I/Io hkl
1.297 1.284 1.247 1.235 1.1795 1.1538 1.1425 1.1244
1.0613 1.0473 1.0447 1.0352 1.0234 1.0118 0.9895 0.9846 0.9782 0.9767
0.9655
2 1 1 2 3 3 1 <1 1 3 4 2 <1 2 <1 1 1 3 2
218 306 220
1112 21i^ 314 226 2111 2011 404 138
0116,1115 1213
3012 231 322 1011
2111 234
(from JCPDS Card 5-586)
69

Table B.5
X-ray Standard Values for Quartz
d I/Il
3.34 4. .26 1.82 100 35 17
4.26 35
d A
4.26 3.343
2.458 2.282 2.237
2.128 1.980 1.817
1.801 1.672 1.659 1.608 1.541 1.453 1.418 1.382 1.375 1.372
1.288 1.256
I/Io
35
100 12 12
6 9 6 17
<1 7
3 <1
15 3 <1 7 11
9 3 4
hkl
100 101 110 102 111
200 201 112
003 202 103 210 211 113 300 212 203 301 104 302
d A
1.228 1.1997
1.1973 1.1838 1.1802 1.1530 1.1408 1.1144
1.0816 1.0636 1.0477 1.0437
1.0346 1.0149 0.9896 0.9872 0.9781 0.9762 0.9607 0.9285
I/Io
2 5 2 4 4 2 <1 <1 4 1 2 2 2 2 2 2 <1 1 2 <1
hkl
220 213 221 114
310 311 204 303 312 400 105 401 214 223
402,115 313 304 320 321 410
(from JCPDS Card 5-0490)
70

APPENDIX C
X-RAY DIFFRACTION CHARTS
71

t " ^ T - i ^ ' m ! M | : : M K : - j n v i : : : i ! . ^:T^;:74•--^^Il^-T^7-- .rT-• 1
pTr^ii=^K:!^}|:i'
rt^^y r n H » : --—• •"— : • • ? " "
i.:..Li?:~;Lill!|:-i.^!i.,.'. ;
I ' * ' ! I l i ' ' * ' ^ i » ! ^ •—-^ ' . — ' . — — t
tH'
rr^.--:t-r.^ii
.I-i:^-• I - - - • • irniJil"'-^;[l:.ij~3^llll!iLL:l T" '. \"'. -
X : " I . : - «
li—:_U
-7'~^\.::i-::i^:z^~[' • t i!:* lifir^^F:!;
TT
•5oi :" •::!:•:: t " . . . • " • . . : i _ i » • • ; • ! . . .JO. tr.. : ^ i z~ sc'rr
' • ^ • • : ^ : - L : - V
HtHui - : : : - L i ; . - ! - ^ i - t - : : t r
•[.;;TI;:
^-•:Ui:;i:.i: ; . - ' t - - t J - r - - [
[T
•n.-. q^^.4-
— — ' — • — t
U—(-
' • i - - ^ — - T : ; t • " . ! . ' . . . . • i - - j ^ *—
Ll .
F^if^^^^s^vHTH'Hr: ' - - ' '*^^H^'^rL!; irf ." .T-":! : : ' , ' ° ' . 'f'~
•rB^^
111:!;
^ - - ' ' : • • ! " ' •
^ - r t T ' - r - i i : ^ ] ; ; ; .
•_lf~i_-j '•;i_; _v_vg^ign:-4S"-4i--U
j L - ; r g r : : ; ^ = L : : ~ : | ^ ^ : : ; . ^ U : - - : - — t , - r ^ - - i h i i ; } ^ i j IS—
- U .
;»:"_;j^4: «;•_ L i ; . . I . ' . - . •• t '
U—X i :— zil—. :L_i_ ...U^-t H-
U- ; «u-Tr. :;Tc-; MK , 1 . JS'
.. t ^ ^ u . ' l . . : u : r r lii ^^Miii
^f-Eff {Simt^Ien^^'K,: .li<'•l . : - iUni!SI3ili3£3!i^i^
r ^ " - " " • - ' „ - ! :
t ' - j :
: P : l : : ; [ : . b : n /-:::.:--;•!•. J.-I I ! 1 . . . . I - . • . • 1 — 4 . I ' - --:
> — 1
u CD U t—*
03 CD -<
X
u o
li-J
-p
u fC3 , — 1
• fc *
7 ^
0 • H
Cn -P -H U-i
u a ;-i
V-, U-l
• H ' - N
> 1
x:

-7id3;;ii;;a;aj[j.;j'i:;i-r^..ixf4 4--4-
tz.U'iu--.-rTHHtSTtf 13111 [ rE^ ;^ !? : i i .
-i:.n,-4-..j:
'r=n~-^^%^^~^
:: • ~:y':#:rir;5i|n-iH::l;-^H^TFui.i3i
.'_• • 1
±"zrot J—4:. -
; t j j a «^-:nr.i-''o ; U U : - _ K ; - u . ' - t , . -rr
?gH
— l % - . t x l | . .-rraj L I : - , . ! - L U - . j . : -J-: H-„-i-_::": ' '
H j i ^ "STS^uJTHfHTyT^HrrrjlTTO ^ k - h P ^ : i | ^ - : ^ ^ ^
— .. i ; | u - i ; ^ ; . . i - . . . . - . . : -.;--r^.. -•' 4 _: . - . . l i - 1 J~ i- ,
l:i: •:nTz:T£-r^ - - 1 : — i ^ - 1 i I i t — ' — - — — — f - — • t ' _ — ^ 1
. - 3 r - . - : ; x . ^ ; r : i i p i ; : i ; r u t : ^ t r . r t ; - r r^ : : ^K:v t — ;—1 u...-:;• - - .. •- >. ]
r ^ r r tn i5 T..rD-rL''J?-V"'fV^--'-i^- t?
^^^Mls:
- t - • -* t — — > - - • - » — • - ' _I I T — . J ^ . i ^ i - . - M . . IM - f c i . ^ . . l . 1 1 «•
, -___
:r::r ri'-r^rrirri . . - I L . . . . I I . . ^ . • • ' r - - l _ - I 1 1 -
rx - - + ^
-:c=i::rm»in
-lii^Witttaimir! ii '^ f4^:H:: i : i lO-[^^t : -Tr t r rH; i^ ; ;"unr : r | r^- . i^ - i l l " ~ ^ ^ ^
- I 11
Tff rn-Uf : r ' : p t - t | : . 4 t 4 . - :L : . t | . i . | • • , _ j _ , _ , . .
L:L-h^ .- . i l ' -M ::: ; . • . ; ; • • •, - 4 - '! " ' ' -r '
' : T " r i i ' g r. '•^fi^=gj>^ ilixlli^-iw •": Mi T-i:
- . -4
__t-U-
CsJ
o 'O o o
o
-p
u 0 s-l :3
- f - i
i^
r'
U _, 0
-H
to u K-\
y-i • H
Q
>y
(d OS
X
- 3

•c 1 »c
:;=i«rii -• lltfrLrniliUi.
i iirii^f'^-^^nTi^4^-^^i^"^-f—
; :c; 1 : : ; : ; 1:cu;;;;;: jft i; a;• : _ I :,,t—lIlXitiP-'rCTTTi—U:'•!/'.!:: -Li—1^ aI--::|tTr^«ict7Tl I:t;«i:: j : [T. -K: \:ri:•: y •: :i-;-t::>oc-::rrn::'o.:
E r -
; lg^i::dn;;K- L? p-i ""
^ C"4i-^ir^iii^ii'
I : - - ' i : ' • s*snt -::ti-:i::-: -
-I—-
f
- ; — 1 -
-f-
1 —
M - - : j : - • I S
MmMi
rn;ii::Ii:ii
- - 1 - ^ ! - - : • - • -
4—;
I
M- li^.._ : -;t. • - • » • ( . ' - :
^-^^ —.1. !e
CO
•--I
o U-I
oo
u
txj
-p
(Ti
:^ ^ CO :: ._, o
• H -p u fo
M-l 4-1 • H
Q
> 1 ftJ 0^ I
X
74

PERMISSION TO COPY
In presenting this thesis in partial fulfillment of the requirements for a
master's degree at Texas Tech University or Texas Tech University Health Sciences
Center, I agree that the Library and my major department shall make it freely
available for research purposes. Permission to copy this thesis for scholarly
purposes may be granted by the Director of the Library or my major professor.
It is understood that any copying or publication of this thesis for financial gain
shall not be allowed without my further written permission and that any user
may be liable for copyright infringement.
Agree (Permission is granted.)
/ Z - / ^ - 9 7 student's Signature ^ Date
Disagree (Permission is not granted.)
Student's Signature Date