Embed Size (px)
Citation preview

Mineralogical and Geochemical Changes Associated with Sulfide and
Silicate Weathering in Natural Alteration Scars, Taos County, New
Mexico
By
Gabriel James Graf
Submitted in partial fulfillment of the requirements
for the Degree of Master of Science in Geology at New Mexico Institute of Mining and Technology
Earth and Environmental Science Department Socorro, New Mexico
May, 2008

ABSTRACT
Natural alteration scars occur along the Red River valley, NM and were
studied as mineralogical analogs to future weathering in rock piles created by Chevron
Mining Inc, (formerly Molycorp, Inc.) during open pit mining from the Questa mine.
These natural alteration scars provide a glimpse into weathering that may affect these
rock piles in the long term (up to 4.5 million years) (Lueth et al., 2006). The alteration
scars provided excellent analogues to the rock piles because they are located within
close proximity (~2 miles) from the Questa mining operation and contain similar
lithologies and hydrothermal alteration mineral suites. The weathering processes
(sulfide and silicates) and overall architecture of these systems (open) appear very
similar.
Three distinct weathering profiles were collected in the Hansen and Southwest
Hansen alteration scars to document chemical and mineralogical changes that occur
related to sulfide and silicate weathering. These weathering profiles are different from
classic weathering profiles since they were profoundly influenced by hydrothermal
alteration, and commonly contain multiple lithologies.
Within each profile particle size decreases upward, which suggests physical
weathering processes are active. The mineralogical changes associated with grain size
reduction include pyrite oxidation with the precipitation of gypsum, jarosite and Fe-
oxides. Acid base accounting has documented limited acid consuming minerals (i.e.
calcite) to buffer the acid created during pyrite oxidation. Stable isotope analysis of
pyrite and gypsum indicate δ34S pyrite range from -1.0 to -6.6 ‰. δ34S of gypsum
range from -2.1 to -5.1 ‰ and gypsum δ18OSO4 range from -7.0 to 5.2 ‰. This data

provides convincing evidence that sulfates within the alteration scars are formed only
in the weathering environment.
Silicate mineralogical changes through the weathering profiles include,
decreasing feldspar and increasing clay upwards. The working hypothesis was silicate
mineral changes result from feldspar weathering to form secondary clay minerals.
Clay mineral analysis, however, indicates the clay minerals are similar to
hydrothermal alteration minerals. Much of the fining upward character may be due to
hydrothermal alteration. Clay mineral stable isotope analysis, δ18O (-0.3 to 4.6‰) and
δD (-65 to
-95‰), documents the clays analyzed are hydrothermal in origin and provide no
evidence for weathering clays. Review of USGS (Nordstrom et al., 2005) ground and
surface water geochemistry, along with silicate mineral observations, indicate
congruent dissolution of silicate minerals is active in the alteration scars.
The major active chemical weathering system in the alteration scars is the
oxidation of pyrite. The soil pH of 2 to 3 is compatible with silicate minerals
dissolution, and the chemical conditions do not favor precipitation of new clay
minerals. Physical weathering in the alteration scars continues by freeze-thaw and
precipitation of gypsum that causes a volume increase; providing pathways for fluid
and oxygen for the further oxidation of pyrite. This acidic environment is responsible
for the precipitation of jarosite, gypsum and dissolution of silicate minerals. Sulfide
weathering will continue to occur in the alteration scars until the remaining pyrite has
oxidized.

ACKNOWLEDGEMENTS
The funding for this study was provided by Chevron Mining, Inc. (formerly
Molycorp, Inc.) in the form of a research assistantship. I express my sincere
appreciation to Chevron for providing me the opportunity to further enhance my
education in geology through this funding. I would like to thank Bruce Walker and
Dave Jacobs, Chevron Geologists, for providing insight and guidance to the geology
of the alteration scar areas and also for the safe and hard work put forth in mapping
and collection of samples.
I would especially like to thank my advisors, Dr. Andrew Campbell and Dr.
Virgil Lueth for the discovery and thorough insight into this thesis project. Their
guidance, insight, and support during this research project were outstanding and the
projects success relied on their expertise in the research area. Appreciation is also
extended to Dr. Virginia McLemore for her guidance in the field. I would also like to
thank Dr. David Norman and Dr. Virginia McLemore for serving on the thesis
committee and for the thorough input on this thesis document to improve the final
manuscript.
Members of the Questa Weathering Rock Pile and Stability Weathering Index
Committee provided constant encouragement and insight to this study. Members of
the committee that I would especially like to thank include: Andrew Campbell, Virgil
Lueth, Virginia McLemore, Mark Logsdon, Dave Jacobs, Dirk van Zyl and Bruce
Walker. A special thanks also to the members of the Acid Drainage Technology
Institute (ADTI) committee of the Questa Weathering Rock Pile and Stability Project
for their thorough review and common suggestions on project improvements.
ii

Laboratory work for this project would not have been possible without the
guidance and help of many friends and coworkers on the project. Kelly Donahue
provided guidance and help during the project, including but not limited to, enormous
work on preparing and analyzing clay minerals. Dawn Sweeney located the
mineralogical modeling program, ModAn, and provided documentation on how to use
the program. Kwaku Boayke provide assistance in geotechnical lab procedures and
Jon Morkeh aided in geochemical lab procedures. Leann Giese aided in other lab
procedures.
This thesis is dedicated to my family, especially Jim and Teri Graf, for without
their encouragement and support, none of my higher education studies would have
been possible. I finally like to thank my girlfriend, Leann Giese, for all the support
and assistance she provided me over the past two years while completing my thesis.
She spent many hours editing versions of my thesis and providing suggestions on how
to greatly improve the manuscript. The encouraging and insightful environment she
provided for me greatly helped to fulfill my master’s degree.
iii

TABLE OF CONTENTS
LIST OF FIGURES….……………………………………………………………...vii
LIST OF TABLES…………...………………………………………………………xi
1. INTRODUCTION…….………………………………….…………………...…….1
1.1 Background......….….…….…………………………………………………...1
1.2 Natural Alteration Scars ………………………………….…….……..….…..3
1.3 Weathering Systems ……………..……………….….……….………….…...5
1.3.1. Sulfide Weathering ………………………….………..…………..6
1.3.2. Silicate Weathering……..…..…………….....……………….……7
2. GEOLOGIC BACKGROUND……………………………………………….…….9
2.1 Geologic Setting….……………………………………………………...……9
2.2 Regional Alteration………….…………………………………………..…..12
2.2.1 Potassic Alteration……………….…...………………………..12
2.2.2 Magnetite-Hematite Veining…………………….…………….13
2.2.3 Quartz-Sericite-Pyrite Alteration .……...…………….………..13
2.2.4 Propylitic Alteration ………………….………………………..15
2.2.5 Advanced Argillic Alteration ……….…………………………16
2.3 Local Geology and Alteration……..……….…………………………...…...16
3. METHODS……………………………….………………………………………..23
3.1 Sampling …………………………………………………………………….23
3.2 Particle Size Analysis…………..…..………………………………………..28
3.3 Whole Rock and Particle Size Split Geochemistry………....……………….30
3.3.1 Isocons………………………………………………………...31
3.4 Acid Base Accounting………………...…………………………….……….33
3.4.1 Neutralizing Potential (NP)……………………………...……34
3.4.2 Acid Potential (AP)…………………………………………...36
3.4.3 Paste pH………………………………………………………37
iv

3.5 Sulfide to Sulfate Ratios……….………..……………………………………….38
3.6 Mineralogical Analyzes………………………….………………………………39
3.6.1 Petrography………………………………………………..…40
3.6.2 Clay Mineralogy……………………………………….…….40
3.6.3 Quantitative X-Ray Diffraction…………….………………..41
3.6.4 ModAn Mineralogical Modeling…………………….………41
3.7 Stable Isotope Geochemistry………….…………………………………………44
3.7.1 Sulfide and Sulfate Minerals……………………………..….44
3.7.1.1 Gypsum preparation……………………………….44
3.7.1.2 Pyrite preparation………………………………….46
3.7.1.3 δ18O Analysis of Sulfate Isotopes………………....46
3.7.1.4 δ34S Analysis of Sulfide and Sulfate Isotope..…….47
3.7.2. Clay Isotopes…………………………….………………….48
3.7.2.1 Physical separation……………….………………..50
3.7.2.2 Acetic Acid Treatment ……………..……………..50
3.7.2.3 Na-Dithionite-Citrate-Bicarbonate Treatment….....51
3.7.2.4 0.5 M Sodium Hydroxide Treatment……………...52
3.7.2.5 XRD Analysis……………………………………..53
3.7.2.6 δ18O Analysis……………………………….……..54
3.7.2.7 δD Analysis……………………………….……....55
4. RESULTS.….……………..……………………………………………………….57
4.1 Particle Size Analyzes...………………………………………………………..57
4.2 Geochemistry.…………….….....……………………………………………....60
4.3 Acid Base Accounting………...….………………………………………….....60
4.4 Sulfide and Sulfate Ratios………...……………………………………………63
4.5 Mineralogical Results…………….…...………………....…………………..…66
4.5.1 Petrography…………………………………...……...…..….66
4.5.2 Clay Mineralogy……………………………………….……69
4.5.3 Comparison of Mineralogical Methods………………….….70
4.5.4 Bulk Mineralogy…………………………………………….72
v

4.5.4.1 Hansen “Weathering Profile”….………….….…..76
4.5.4.2 Upper Southwest Hansen “Weathering Profile”…77
4.5.4.3 Lower Southwest Hansen “Weathering Profile”....77
4.6 Stable Isotopes……………………………………………………………….....79
4.6.1 Sulfides and sulfates…….….….……………….………..….79
4.6.2 Clays……..…….………………………………………...….80
5. DISSCUSION………………………………………………………………..……84
5.1 Weathering Profiles………..…………………………………………...….…...84
5.2 Physical Weathering………………………………………………………..…..85
5.3 Chemical Weathering………………………………………………..…….…...88
5.3.1. Sulfide Weathering…………………………………….…...88
5.3.2. δ34S & δ18OSO4 Isotopes of Sulfide Weathering....….……...93
5.3.3. Silicate Weathering……...………………….…...…….…...95
5.3.4. Isocon Calculation.………………………………………....98
5.3.5. Clay Isotopes………...……………………………….…...106
5.3.5.1 Quartz Contamination……..………….…..……....107
5.3.5.2 Propylitic vs. (QSP) Alteration…………………...109
5.3.5.3 Effect of alteration type on δ18O………...….....….109
5.4 Relative Role of Physical and Chemical weathering………………..……..…114
6. CONCLUSION………………………………………………………….…..…....119
6.1 Conclusions…..………………………………………………………….....…119
6.2 Recommendations……..………………………………………………....…...121
REFERENCES……...……………………….……………………………………....123
APPENDIX A. Individual Sample Particle Size Results…………………….………128
APPENDIX B. Petrographic Results………….………………………...……...……149
APPENDIX C. Stable Isotope results from Campbell and Lueth, 20008….…….….156
APPENDIX D. Clay XRD scans………………………………….………....….…...158
APPENDIX E. In-situ profile sample pictures…………………...………..………...178
vi

LIST OF FIGURES Figure 1. Location map of study area…………………………………………………2
Figure 2. Example of a natural alteration scar………………………………………...4
Figure 3. Generalized geologic map of the Questa Mining District……………....…11
Figure 4. A) Photomicrograph of quartz-pyrite stockwork veining; B) Hydrothermal
QSP vein in andesite bedrock……………………………………………...………...14
Figure 5. Photomicrograph of QSP overprinting propylitic alteration………………16
Figure 6. Generalized geologic map of study area……………………..……………18
Figure 7. Tertiary andesite rocks…………………………………………..……..….19
Figure 8. Tertiary dacite rocks…………………………………………………..…..19
Figure 9. Tertiary quartz latite porphyry rocks………………………………….…..20
Figure 10. “Gray clay” layers from alteration scars………………………………....21
Figure 11. Locations and sample numbers of lower Southwest Hansen alteration scar
weathering profile……………………………………………………………….…...25
Figure 12. Locations and sample numbers of Hansen alteration scar weathering
profile…………………………………………………………………………..….....26
Figure 13. Locations and sample numbers of upper Southwest Hansen alteration scar
weathering profile…………………………………………………………………....27
Figure 14. Comparison graph of two methods used for particle size analysis….…..30
Figure 15. Example of isocon diagram from Hansen weathering profile…………..33
Figure 16. Flow chart of sample preparation procedures used prior to stable isotope
analysis (modified from Gilg et al., 2004)……………………………....……….….49
Figure 17. Comparison of XRD patterns pre-and post-chemical treatments to check
for sample purity (SWH-GJG-0022)………………………………………………...54
vii
Figure 18. A) Particle size distribution for the Hansen weathering profile; B) Particle
size distribution for the Lower Southwest Hansen weathering profile; C) Particle size
distribution for the Upper Southwest Hansen weathering profile……………......….58
Figure 19. Graphical representation of ratio of total sulfur from sulfide divided by
total sulfur from sulfate vs. location in weathering profile; A) Hansen Profile; B)
Lower Southwest Hansen Profile; C) Upper Southwest Hansen Profile…………….65
Figure 20. Thin section photomicrographs of different alteration types…………….67
Figure 21. Clay X-Ray diffraction scans of rock fragments to soil matrix for samples
SWH-GJG-0008 (SWH-08) and HAS-GJG-0006 (HAS-06) (from Donahue et al,
2008). Number above peaks correspond to 2θ of clay minerals (abbreviated by
capitalized first letter). (S = smectite, C = chlorite, I = illite, J = jarosite)…….....….69
Figure 22. Mineralogical changes of identified minerals vs. sample locations in the
Hansen weathering profile……………………………………………………....…...76
Figure 23. Mineralogical changes of identified minerals vs. sample locations in the
upper Southwest Hansen weathering profile……………………………………..….78
Figure 24. Mineralogical changes of identified minerals vs. sample locations in the
lower Southwest Hansen weathering profile.…………………………………….….79
Figure 25. δ34S and δ18OSO4 diagram of sulfates and sulfides………………………80
Figure 26. δ18O vs. δD diagram of Questa clays……………………………...…….83
Figure 27. Photomicrograph of HAS-GJG-0007 illustrating gypsum and Fe-oxide
filled fractures at the base of the Hansen Profile. (Gyp = gypsum, Red Staining = Fe-
oxides)…………………………………………………………………………..…...86
viii

Figure 28. Geochemical and mineralogical changes associated with sulfide
weathering in the Hansen alteration scar profile…………………………….....…….89
Figure 29. Geochemical and mineralogical changes associated with sulfide
weathering in the lower Southwest Hansen alteration scar profile………………..…90
Figure 30. Geochemical and mineralogical changes associated with sulfide
weathering in the upper Southwest Hansen alteration scar profile………………..…92
Figure 31. δ34S and δ18OSO4 diagram of sulfates and sulfides………………….....…94
Figure 32. Silicate mineralogical changes in the Hansen alteration scar profile……96
Figure 33. Silicate mineralogical changes in the upper Southwest Hansen alteration
scar profile………………………………………………………………………...…97
Figure 34. Silicate mineralogical changes in the lower Southwest Hansen alteration
scar profile………………………………………………………………………...…98
Figure 35. Chemical variation diagrams using the isocon method for coarse to fine
particle. Sample HAS-GJG-0006……………………………………………….…..99
Figure 36. Histogram of QXRD mineralogy for total feldspar and total phyllosilicates
between coarse and fine fractions (HAS-GJG-0006)………………………..…...…101
Figure 37. Chemical variation diagrams of the upper Southwest Hansen alteration scar
profile using the isocon method………………………………………….…….…...102
Figure 38. Chemical variation diagrams of the Hansen alteration scar profile using the
isocon method……………………………………………………………..….…..…103
Figure 39. Chemical variation diagrams of the lower Southwest Hansen alteration scar
profile using the isocon method………………………………………………….…105
ix

x
Figure 40. Observation of andesite xenolith located with the quartz latite porphyry
from the lower Southwest Hansen alteration scar………………………………....105
Figure 41. Compilation δ18O vs. δD diagram clay studies…………………...…...107
Figure 42. X-ray diffraction quartz intensity/illite intensity vs. δ18O of Questa
clays……………………………………………….…………………………..…...108
Figure 43. X-ray diffraction intensities vs. δ18O of Questa clays to determine quartz
contamination in intensely QSP altered scar rocks………………………………...111
Figure 44. X-ray diffraction intensities (Chlorite & Quartz) vs. δ18O of Questa clays
to determine quartz and chlorite contamination in QSP>Prop altered scar rocks.....111
Figure 45. X-ray diffraction intensities (Chlorite & Quartz) vs. δ18O of Questa clays
to determine quartz and chlorite contamination in all samples……………….…....112
Figure 46. δ18O vs. δD diagram of Questa clays showing estimation of possible
amount of clay in heavy δ18O samples……………………………………….….....114
Figure 47. Phase diagram for the solubility of kaolinite………………………......115

LIST OF TABLES
Table 1. Samples used in study……………………………………………….…..24
Table 2. Summarizing the differences in results between the two methods of particle
size analysis (SWH-GJG-0011)…………………………………………………...29
Table 3. Observation, fizz rating and amount and normality of acid required for NP
analysis……………………………………………………………………….……35
Table 4. Mineral compositions from the Questa Area………………………….…43
Table 5. Summary of particle size analysis…………………………………….…57
Table 6. Major oxide XRF geochemistry (weight %)…………………………..…61
Table 7. Trace element geochemistry (ppm)…………………………………..….62
Table 8. Acid Base Accounting and Paste pH results……………………………..63
Table 9. Sulfide and sulfate ratio results…………………………………….…….64
Table 10. Clay abundances reported as parts in ten……………………………….70
Table 11. Comparison of mineralogical methods……………………………...….73
Table 12. Mineralogy of weathering profiles using ModAn……………………....74
Table 13. δ34S and δ18OSO4 results of sulfides and sulfates……………………..…81
Table 14. δ18O and δD isotopic results of clay minerals……………………….….82
xi

1. INTRODUCTION
1.1 Background
The Hansen and Southwest Hansen alteration scars are located between the
villages of Questa and Red River, Taos County, New Mexico (Figure 1). Alteration
scars occur along the Red River valley in pyrite rich-rocks and are characterized by
steep slopes, a lack of soil, iron oxide staining, rapid erosion and common slumping
and landsliding following major rainfall events (Meyer and Leonardson, 1990). A
number of geologic factors control the formation of scars including slope angle,
tectonic fracturing, pyrite content, and vegetation cover (Meyer and Leonardson,
1990).
This study of alteration scars documents an example of long-term physical and
chemical weathering of pyrite-bearing rocks. These alteration scars are being used as
mineralogical analogs for rock piles constructed by Chevron Mining Inc, (formerly
Molycorp, Inc.) during a period of open pit mining from 1964 to 1983. The rock types
and hydrothermal alteration types in the alteration scars and rock piles are similar.
This thesis will focus on the mineralogical changes in the alteration scar due to
weathering, which provides a basis for predicting mineralogical changes that could
occur in the rock piles.
This thesis documents mineralogical and geochemical changes through three
weathering profiles from the Hansen and Southwest Hansen alteration scars. Methods
utilized in this study include geological mapping, whole rock geochemistry, particle-
size geochemistry, petrography, acid base accounting, stable isotope analysis of
sulfates, sulfides and clay minerals, quantitative X-Ray diffraction (QXRD), particle
1

size distribution, and sulfide-sulfate ratios. The ability to differentiate supergene
weathering minerals from hydrothermal alteration minerals is critical to this study.
Figure 1. Location map of study area. Aerial photo courtesy of USGS.
2

1.2 Natural Alteration Scars
Numerous naturally formed, colorful (yellow to red to orange to brown)
alteration scars are located throughout the Red River valley, NM and are characterized
by badlands-type topography, a lack of soil, steep unstable slopes, sulfide content
>1%, little to no vegetation, and extensively fractured bedrock (Figure 2) (McLemore
et al. 2004; Ludington et al., 2004; Meyer and Leonardson, 1990). The scars in the
area range in size from 100 acres to less than 1 acre in size (Shaw et al., 2003). Public
and scientific interest in these scars has increased during the last decade because of
sporadic, but destructive, mudslides or debris flows that emanate from the scar areas
during wet periods (McLemore et al., 2004).
The first interpretation proposed for scar formation was by low-temperature
fumerolic alteration related to breccia pipes and/or tectonic pipes formed during the
end processes of volcanism (Schilling, 1956; Ishirara, 1967; Clark and Read, 1972).
However, after an extensive mapping study by Meyer and Leonardson (1990) was
completed, a new interpretation was proposed that these scars were not volcanic
features, but rather resulted from sulfide oxidation, acid weathering, and erosion of
altered rock. Four major controls that are now thought to induce scar formation: 1)
steep slope angle; 2) strong tectonic shearing; 3) high-sulfide content (mostly pyrite,
>1%); and 4) low vegetation cover (Meyer and Leonardson, 1990).
Geological relationships indicate the scars are associated with Tertiary
andesitic rocks that have been extensively altered by hydrothermal fluids, and are
developed locally in the base of the Amalia Tuff. The Amalia Tuff is physically more
competent than the underlying andesitic rocks, resulting in the formation of near-
3

vertical spires or hoodoos at the highest ridges of the scars. Recent studies by Lueth
and others (2006), suggest that these scars initiated near the contact of the Amalia Tuff
(rhyolite tuff) and older andesitic rocks as hydrothermal fluids ponded at the base of
the more competent rhyolitic rocks, causing intense alteration.
The combination of this intense QSP alteration coupled with zones of
conjugate fractures over intrusions was critical in localization of modern scars with
respect to deposition of pyrite and the establishment of pathways for modern
Figure 2. Example of natural occurring alteration scar located throughout the Red River valley, NM. Photograph taken on knife ridge located between Upper Southwest Hansen and Lower Southwest Hansen alteration scars. Photograph courtesy of Leann Giese.
groundwater penetration (Lueth et al., 2006). Fracturing in these areas is pervasive
down to the microscopic level (Caine, 2003; Ludington et al. 2004), which enhances
the physical weathering in the scar areas (Lueth et al. 2006). Recent dating of
4

supergene jarosite indicates weathering of the scar material may have begun as early
as 4.5 million years ago and continues to the present (Lueth et al., 2006).
The main geologic factor that affects the mineralogy of the alteration scars is
the oxidation of pyrite. This oxidation process creates sulfuric acid that dissolves
hypogene minerals forming sulfates and precipitation of Fe-oxides and Fe-
oxyhydroxide minerals (McLemore et al., 2004). The production of sulfuric acid from
pyrite oxidation has the potential to dissolve silicate minerals; however, the
precipitation of secondary clay minerals is dependent on pH and fluid chemistry.
The chemical weathering to form sulfates can cause the rock to become
incompetent, causing landsliding, slumpage and erosion of the interior of the scar,
causing physical weathering of the material. However, this weathering also can form
a ferricrete, an iron oxide-cemented conglomerate. Ferricrete formation occurs at the
base of scars where iron-rich solutions mix with local groundwater under highly
oxidizing conditions and precipitates hematite and goethite (Lueth et al., 2006).
1.3 Weathering Systems
Physical and chemical weathering occurs within the alteration scars. Chemical
weathering enhances physical removal of material by disaggregating the rock and
physical weathering enhances chemical dissolution by increasing access of fluids to
rock material, increasing the exposed mineral surface area (White and Brantley, 1995).
These two types of weathering co-exist in nature and influence one another.
Two types of chemical weathering are proposed to exist in the alterations scars
and include: 1) sulfide weathering (pyrite-calcite to gypsum) and 2) silicate
5

weathering. The general concepts of these two different types of chemical weathering
are discussed below.
1.3.1 Sulfide weathering
The reaction of pyrite with aqueous solutions containing ferric iron or oxygen
ultimately produces sulfuric acid and dissolved ferric iron (McKibben and Barnes,
1986). The two reactions listed below are thought to control the oxidation of pyrite to
aqueous sulfate (Garrels and Thompson, 1960).
FeS2 + 7/2O2 + H2O Fe2+ + 2 SO42- + 2H+ (1)
FeS2 + 14 Fe3+ + 8 H2O 14 Fe2+ + 2 SO4
2- + 14H+ (2)
The oxidation of pyrite, in the first equation, is controlled by the oxidant oxygen,
which is supplied by the atmosphere and water. This oxidant produces aqueous
sulfate, dissolved iron and an acidic environment. Reaction (2) oxidizes pyrite by
ferric iron in water. The products from reaction (2) are ferrous iron, sulfate, and even
more acid.
For reaction (2) to continue, the supply of ferric iron needs to be rejuvenated
through the oxidation of ferrous iron as described by the reaction:
Fe2+ + ¼ O2 + H+ Fe3+ + ½ H2O (3)
6

The rate of reaction (3) is greatly enhanced by the bacterium Acidothiobacillus
ferrooxidans, which can accelerate the rate of aqueous ferrous iron oxidation by a
factor of at least 105 relative to the abiotic rate (Singer & Stumm, 1968, 1970). The
bacteria feed on sulfur from pyrite, and ferrous iron is released and oxidized by
atmospheric oxygen. The resulting equation for the oxidation of ferric iron to
continue is:
FeS2 + 10 Fe3+ + 6 H2O + O2 11 Fe2+ + 2 SO42- + 12 H+ (4)
As ferrous iron begins to leach out of the crystal sites, the sulfur-rich surface
will become unstable and either disrupt and reorganize into elemental sulfur or
dissolve into solution, which would be highly unstable and would form sulfate rapidly
in the presence of a strong reacting agent (Nordstrom, 1982).
1.3.2 Silicate Weathering
The chemical weathering of feldspar minerals results from the differences in
the thermodynamic conditions that existed at the time of mineral formation and that of
ambient conditions at the earths surface (White and Brantley, 1995). Surfical
processes that mostly affect silicate weathering are the flow and chemistry of water at
the earth’s surface (White and Brantley, 1995).
The alteration of feldspars generally involves initial dissolution of feldspar into
solution, and the subsequent precipitation of kaolinite and other secondary phases
from solution (Blum and Stillings, 1995). The dissolution and growth of secondary
7

white phyllosilicates occurs mainly on the base and edges of feldspar grains, and along
cleavage planes (White and Brantley, 1995). Reaction (5) represents the weathering
2 NaAlSi3O8 + 2 H+ + 9 H2O Al2Si2O5(OH)4 + 4 H4SiO4 + 2 Na+ (5) Feldspar Kaolinite
of feldspar minerals. The equation can vary in both products and reactants depending
on the type of feldspar dissolving. The dissolution of silicate minerals will not always
precipitate clay minerals as the environmental conditions (pH) and fluid chemistry will
influence if secondary clay minerals will precipitate.
Increasing concentrations of secondary mineral phases (i.e. clays and Fe-
oxides) in soils with time exerts a negative impact on the dissolution rates by
effectively shielding chemical interaction between the physical mineral surface and
soil water (White, 1995). High solute concentrations may promote the effects of
aluminum and other species (Fe) in fluids that have been experimentally shown to
inhibit feldspar dissolution (White, 1995). Low pH fluids tend to dissolve clay
minerals and prevent the precipitation of kaolinite or other secondary clay minerals
(Krauskopf and Bird, 1995; Lawson et al., 2005).
8

2. GEOLOGIC BACKGROUND
2.1 Geologic Setting
The Questa mining district, located in the Sangre de Cristo range of northern
New Mexico, has had a long and complex volcanic, plutonic, tectonic and
hydrothermal geological history (Meyer, 1990). It is situated on the southern margin
of the Oligocene Questa caldera of the late-Oligocene Latir volcanic field and on the
eastern flank of the modern Rio Grande rift valley (Lipman, 1983; Meyer, 1990). The
Latir volcanic field covers about 1200 km2 and is composed primarily of alkaline
rocks of intermediate composition that range from basaltic andesite volcanic and
volcaniclastic rocks to peralkaline rhyolite flows and ash-flow tuffs (Figure 3)
(Lipman, 1983). Mid-Miocene to present day uplift of the Sangre de Cristo range has
exposed a complex geologic history of the volcanic field (Meyer, 1990).
Pre-volcanic rocks located in the Questa mining district are composed of
Proterozoic metasedimetary and metaigneous rocks overlain by lower Tertiary fluvial
sedimentary rocks (Meyer and Foland, 1991). These sedimentary Tertiary rocks were
produced from Paleocene to Eocene erosion of Laramide highlands of Precambrian
provenance (Lipman, 1983). This upward-fining sequence of sedimentary rocks range
from 0-180 meters in thickness and is an excellent stratigraphic marker, when
exposed, between pre-and syn-volcanic rocks (Meyer and Foland, 1991).
Volcanism initiated during the development of early rift extension of the
modern Rio Grande rift, approximately 29 Ma (Meyer and Foland, 1991). During this
period of volcanic activity, a thick sequence of intermediate composition (mostly
andesitic) rocks was erupted. During the waning stages, a change in volcanism
9

occurred and rhyolitic rocks were erupted on top of the intermediate composition
rocks. The final stages of volcanism were associated with the eruption of the Amalia
Tuff and the formation of the Questa caldera (Meyer 1990).
Pre- and syn-volcanic intrusions are found within the Latir volcanic field and
range in composition from felsic to intermediate (Meyer, 1990). After the formation
of the Questa Caldera, volcanic rocks were intruded by a series of highly evolved
silica granites and subvolcanic porphyries that are the apparent source of hydrothermal
fluids that formed a series of molybdenum deposits in the mining district (Ludington
et al., 2004). These intrusions were emplaced after 25 Ma and occur as small dikes
and stocks along a N 75°E trend that extends about 20 km from the Bear Canyon
Pluton, on the western range front, and extend to at least the reaches of Bitter Creek,
northeast of the village of Red River (Ludington et al., 2004). Lueth et al. (2006)
presented one of the first successful 40Ar/39Ar ages (alunite) of hydrothermal alteration
in the Red River area (24.86 ± 0.15 Ma), which is similar in age to numerous
intrusions.
Approximately 15 Ma, modern Rio Grande rifting began and is characterized
by north-south-striking axial grabens and rift-flanking uplifts (Chapin, 1979; Tweto,
1979; Morgan et al., 1986; Meyer and Foland, 1991, Ludington et al., 2004). This
Miocene to recent tectonic event is responsible for the uplift and erosion of the present
day Sangre de Cristo range, which exposes the batholiths and the lower reaches of the
Questa Caldera (Meyer and Foland, 1991). The western flank of the Rio Grande rift
block is down dropped and covered with rift-fill sediments, covering the western side
of the Questa Caldera (Meyer and Foland, 1991).
10

Figure 3. Generalized geologic map of the Questa Mining District. Modified from Lipman and Reed (1989) and Ludington et al., (2004). (SWH = Southwest Hansen alteration scar and HAS = Hansen alteration scar)
11

2.2 Regional Alteration
Extensive hydrothermal alteration of volcanic rocks, resulting from
hydrothermal fluids evolved from numerous intrusions, occurs along a N 75°E trend
along the lower Red River Valley; an area of about 18 km long by 4 km wide
(Ludington et al., 2004). Economically important mineralization occurs in the Questa
deposits as molybdenite (MoS2) and has been mined from a horseshoe shaped ore
body from 1919 to the present. The ore deposit formed from magmatic-hydrothermal
fluids that were expelled from magma as it crystallized to form intrusive rocks
(Ludington et al., 2004). The magmatic-hydrothermal fluids deposited quartz,
molybdenite, pyrite, fluorite, carbonates and associated minerals in veins, stockwork
vein systems, and breccia ore bodies (Ross et al., 2002). This mineralization event
created an alteration shell around the ore deposit, which is composed of the following
alteration suites: potassic, magnetite-hematite veining, QSP, propylitic, and advanced
argillic.
2.2.1 Potassic Alteration
Potassic alteration is directly associated with the molybdenite mineralization.
This altered the rocks, regardless of their type or composition, to a mixture of biotite,
potassium feldspar, quartz, fluorite and molybdenite. Potassic alteration occurs closest
to the intruding porphyry stock, so it is interpreted to be the highest temperature
alteration of the deposit. Locating an unrecognized potassic alteration zone in the
Questa area could be used as an exploration tool for locating economically important
ore bodies.
12

2.2.2 Magnetite-Hematite Veining
Stockwork veining of magnetite-hematite occurs in a shell overlapping the
outer portions of the potassic zone in the Molycorp open pit (Ludington et al., 2004).
Also associated with this magnetite-hematite veining is hydrothermal anhydrite with
intergrown secondary gypsum that occurs in the stockworks around the periphery of
the potassically-altered rocks (Martineau et al., 1977). Similarly, limited occurrences
of gypsum and anhydrite have been noted in drill core beneath the alteration scars
(Loucks et al., 1977).
2.2.3 Quartz-Sericite-Pyrite (QSP) Alteration
QSP alteration occurs above and outwards from the main potassic alteration
zone (Ludington et al., 2004). This alteration is characterized by the extensive
development of quartz, pyrite, and white phyllosilicates. In addition to altering the
host rock, crosscutting veinlets of quartz and pyrite as well as crosscutting veinlets of
dominantly sericite, with lesser abundances of quartz and pyrite, are present in this
alteration stage (Figure 4) (Ludington et al., 2004). The most pyrite-rich QSP
alteration in the Questa area occurs in andesitic rocks and apparently resulted from the
reaction of abundant iron-bearing silicates and iron-titanium oxides with sulfur rich
hydrothermal fluids (Ludington et al., 2004). Alternatively, in the silicic host rocks,
rhyolite porphyries and the Amalia Tuff, QSP alteration is not well developed because
of the lack of iron-bearing silicate minerals to react with hydrothermal sulfur
(Ludington et al., 2004).
13

Andesite Bedrock
C
QSP Vein
Andesite bedrock
Figure 4. Photomicrographs of quartz and pyrite stockwork veinlets crosscutting QSP altered rocks, as described by Ludington et al., 2004. Samples are from upper Southwest Hansen alteration scar. A) SWH-GJG-0022, Cross Polarized Light (XPL); B) SWH-GJG-0022, Plane Polarized Light, (PPL), (Qtz= quartz, Py = pyrite); C) Hydrothermal QSP vein in andesite bedrock, located east of lower Southwest Hansen alteration scar. Note hammer for scale
14

Clay mineralogical analysis in the current study has documented the presence
of dominantly illite in gray clay zones (described below), while smectite occurs
around these intense QSP zones (gray clays). These mineralogical variations are
suggestive that the dominant mineral assemblage classified as QSP is more
representative of an intermediate argillic alteration. These two alteration types appear
to be complexly interrelated. The remainder of this thesis will use the term QSP when
describing either alteration, to be consistent with geological and alteration studies
from previous authors.
2.2.4 Propylitic Alteration
Propylitic alteration associated with the magmatic-hydrothermal fluids
partially overlaps and in part occurs peripherally to the QSP alteration (Ludington et
al., 2004). These altered rocks contain chlorite, epidote, albite and some calcite and
are usually green in color. This alteration is also associated with andesitic rocks as
there was high Ca, Mg, and Fe to form abundant chlorite and epidote (Ludington et al.,
2004). This alteration is associated with the main mineralizing event; however, there
was an earlier regional propylitic alteration event that affected the rocks of the Latir
volcanic field (Ludington et al, 2004).
It is difficult to differentiate between propylitic alteration from the
mineralizing event and pre-mineralizing alteration. The older propylitic alteration
event has been altered, in places, to a QSP-overprinting propylitic alteration from the
mineralizing event. Depending on the extent of the QSP alteration, a mix of quartz,
15

pyrite and white phyllosilicates are observed in thin section replacing feldspars,
chlorite, carbonates and epidote (Figure 5)(Ludington, et al., 2004).
Figure 5. Photomicrographs of QSP alteration overprinting older propylitic alteration, as described by Ludington et al., 2004. Samples are from Hansen alteration scar. A) HAS-GJG-0006 XPL; B) HAS-GJG-0006-PPL, (XPL= Cross Polarized Light), (PPL = Plane Polarized Light), (QTZ/FLD= quartz replacing feldspar, QTZ/EPD = quartz replacing epidote, WPHY & PY/CHL = white phyllosilicates and pyrite replacing chlorite)
2.2.5 Advanced Argillic
Advanced argillic alteration occurs as an outer halo of the magmatic-
hydrothermal system at Questa. The advanced argillic zone is characterized by well-
crystallized kaolinite, poorly crystallized kaolinite, alunite, and sericite alteration
(Livo and Clark, 2002). This alteration zone occurs in the highest elevation alteration
scars and is generally associated with the Amalia Tuff (rhyolite).
2.3 Local Geology and Alteration
Geologic mapping of the study area was completed on a scale of 1:5700
(Figure 6). The area is located approximately 2.5 miles from the Questa Molybdenum
16

Mine and encompasses the ridge west of the Southwest Hansen alteration scar to the
ridge east of the Hansen alteration scar. Geologic mapping was completed to
determine the lithologic units and geologic features common to both of the alterations
scars.
The rocks in the area (oldest to youngest) include: Tertiary porphyritic andesite
(Tpa), Tertiary dacite flow (Td), Tertiary quartz latite porphyry (Tap), Quaternary
debris flow (Qdf), and Quaternary alluvium and colluvium (Qac). The porphyritic
andesite erupted during the early stages of the Oligocene Latir volcanic field. This
unit is dark green to gray, massive and very thick (~2500 ft, Martineau et al., 1977).
The andesite contains abundant plagioclase phenocrysts (5-20%) that range in size
from 1-4 mm. Other identifiable minerals in hand specimen include chlorite, epidote,
pyrite, quartz and goethite/hematite (Figure 7). The mineralogy varies locally
depending on the intensity of propylitic and QSP alteration.
Tertiary dacite flows lie stratigraphically below the Amalia Tuff unit and
directly above the Tertiary andesitic units. This dacite (Td) unit may represent the
onset of felsic volcanism, erupted before the Amalia Tuff and the collapse of the
Questa caldera. The Amalia Tuff is not located with in the mapping area, but lies
directly to the north at the head of both alteration scars. Dacite is porphyritic to
aphanitic and contains potassium and plagioclase feldspar phenocrysts (5-10%)
ranging in size from 1-4 mm. Pumice fragments are located within the groundmass,
suggesting an extrusive origin of the rock. Orbicular quartz and white phyllosilicates
are abundant in hand sample (Figure 8).
17

Figure 6. Generalized geologic outcrop map of the Southwest Hansen and Hansen alteration scars. Dark color variations represent outcrops mapped in the area. Area mapped by Gabriel Graf, Leann Giese and Virginia McLemore (September 2007)
18

Figure 7. Tertiary andesite rocks from the alteration scars. Notice the dark green to brown color, which is remnant of propylitic alteration.
Figure 8. Tertiary dacite rocks from the alteration scars.
19

A post volcanic intrusive rock has been identified in the lower reaches of the
Southwest Hansen drainage. This intrusive rock has been identified as a hypabassal
quartz latite porphyry sill (Figure 9). The rock intruded into the porphyritic andesite
and contains large xenoliths (meter-size) of andesite within the intrusive unit. The
quartz latite porphyry is white-gray in color and contains abundant plagioclase (15-
30%) and potassium feldspar (5-10%) phenocrysts that range in size from 4-10 mm.
The rock also contains identifiable quartz, white phyllosilicates and pyrite.
Figure 9. Tertiary quartz latite porphyry rocks from the alteration scars.
Alteration in the study area is restricted to propylitic alteration, QSP alteration,
and QSP overprinting of propylitic alteration in the study area. The ridge to the west
of the Southwest Hansen scar is the only area containing dominantly propylitic
alteration, with minimal evidence of QSP alteration. Andesitic rocks outside of the
alteration scars still contain abundant chlorite and epidote in hand specimen and are a
20

dark green color. Minimal pyrite is present in the rocks mapped to the west of the
Southwest Hansen Drainage.
Andesite and quartz latite porphyry located within the Southwest Hansen and
Hansen drainage are intensely QSP altered. These rocks are pyrite rich (2-5%) and
contain abundant clay minerals. These areas of intensely QSP alteration contain “gray
clay” layers or veins (Figure 10), which occur in 1-3 meter bands or 1-2 mm veins
within the bedrock.
Figure 10. Gray clay layers located throughout the alteration scars. Note: gypsum crystal in bottom right corner
21

The dacite flow located at the top of the central ridge of the study area appears
to have experienced less QSP and propylitic alteration. Pyrite is present but in small
components (<1%). These rocks are more competent and have experienced less
chemical and physical weathering.
A large debris flow (probably Quaternary in age) emanated from the Upper
Hansen alteration scar. The debris flow caused the drainage to shift further to the east
and incised a channel (~10 ft.) deep within the present Hansen drainage. Debris
aprons of alluvium and colluvium developed on both the Hansen and Southwest
Hansen drainages. Mudslides and/or debris flows transport large amounts of material
into the drainages and onto the debris aprons during extremely wet periods.
22

3. METHODS
3.1 Sampling
Sampling was conducted in November 2006 during which samples were
collected from three distinct profiles. These samples were collected to determine the
mineralogical changes through each profile. Two weathering profiles were collected
in Southwest Hansen alteration scar and one weathering profile was collected in the
Hansen alteration scar.
Eight samples were collected from the lower amphitheater of Southwest
Hansen (LSWH) (UTM Coordinates 458732 E., 4062439 N.) (Figure 6), which
spanned thirty-seven feet (Figure 11). Sample locations were selected based on
interpreted changes in lithology or mineralogy (color changes). Samples were
collected using a rock hammer, shovel and a ladder to access the higher reaches of the
profile. The lithologies encountered included unweathered quartz latite porphyry,
weathered quartz latite porphyry, gray clay segregations (QSP veins), and residual
soils with rock fragments, near the top of the profile.
Five samples were collected from the Hansen alteration scar profile (HAS)
(UTM Coordinate 459288 E., 4062957 N.) (Figure 6) that spanned twenty-two feet
(Figure 12). These samples were collected where, by observation, it appears that the
lithology and/or mineralogy changes. Samples were collected with a rock hammer
and shovel, from andesite bedrock, to weathered andesite bedrock, and finally residual
soils.
The final weathering profile was collected in the upper amphitheater of
Southwest Hansen alteration scar (USWH) (UTM Coordinates 458592 E., 4062741
23

N.) (Figure 6). This was the shortest profile with four samples that spanned seven feet
(Figure 13). The profile was sampled from andesite bedrock, weathered andesite
bedrock and was capped by a ferricrete.
The samples collected from the weathering profiles in Southwest Hansen and
Hansen alteration scars were subjected to a variety of analyses. Weathering changes
can clearly be recognized in samples spanning the weathering profiles. Table 1 is a
list of samples studied. In-situ sample photographs are located in Appendix E.
Table 1. List of Samples used in study
24

Figure 11. Photo showing locations and sample numbers of profile samples in lower amphitheater Southwest Hansen alteration scar.
25

Figure 12. Photo showing locations and sample numbers of profile samples in the Hansen alteration scar.
26
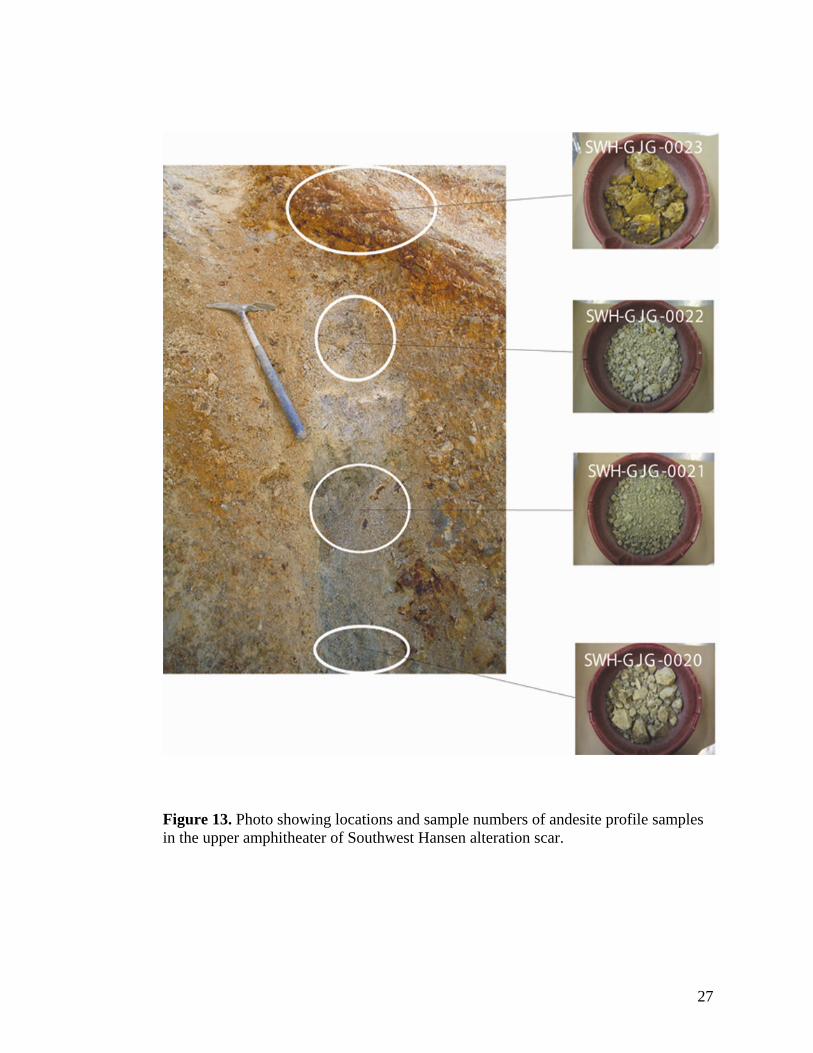
Figure 13. Photo showing locations and sample numbers of andesite profile samples in the upper amphitheater of Southwest Hansen alteration scar.
27

3.2 Particle Size Analysis
Particle size analysis was performed on samples, based on ASTM standards,
from the three profiles to determine the amount of gravel, sand, and fine particles.
Using the assumption that the top of any given profile has experienced a longer period
of weathering than the samples at the bottom of a profile, a prediction was made that
the samples should decrease in grain size from the bottom to the top of the profiles.
Two methods were used because of the misrepresentation of the total amount
of fines in the samples due to the agglomeration of clay particles. For each method,
the total amount of sample was weighed, and the resulting gravel, sands and fines
were weighed to determine the percentage of each size fraction. All samples were
performed using U.S. Standard Sieves.
Method 1, “Dry Sieving” consisted of mechanically dry sieving particles that
were larger than 75 μm. The samples were shaken in a W.S. Tyler, Inc. Sieve Shaker
Rx-86 for approximately 30 minutes and weighed. Particles that were smaller than 75
μm were not analyzed using the hydrometer test, as the total amount of fines was more
important in this study than the distribution of silt to clay.
Method 2, “Wet Sieving Equivalent” consisted of mechanically sieving
particles larger than 75 μm in the sieve shaker for approximately 30 minutes. After
this, the agglomerated particles were physically removed and were broken by a
physically induced technique using a mortar and pestle. The broken agglomerated
particles were then returned to the sieves and shaken for another 30 minutes. The
samples were then weighed to determine the percentage of gravel, sand and fines
28

present in each sample. Even though this method was termed “Wet Sieving
Equivalent,” water was never used in the preparation and analysis.
The two methods were completed on all of the profile samples. The results
were then compared to determine which procedure provided a more representative
analysis of the fines present in the samples. It was determined that Method 2, “Wet
Sieve Equivalent” provided more representative results of the percentage of fines
present in the samples because of the known agglomeration of clay particles. The
remainder of this thesis will focus on particle size results from Method 2 “Wet Sieve
Equivalent.” Table 2 provides a summary of the results of the two different methods
preformed for particle size analysis for sample SWH-GJG-0011. Figure 14 is a plot
showing the comparison of the two methods used in the particle size analysis.
Table 2. Table summarizing the differences in results between the two methods of particle size analysis (SWH-GJG-0011).
Method 1, “Dry Sieving” Method 2, “Wet Sieve Equivalent”
Fines (%) 0.35 2.87
Sand (%) 41.29 58.71
Gravel (%) 58.37 38.42
29

Particle Size Distribution
0
10
2030
40
50
60
7080
90
100
0.0010.0100.1001.00010.000100.0001000.000GRAIN SIZE MILLIMETERS
PER
CEN
T FI
NER
BY
WEI
GH
T
C OB B LES GR A V EL SAND SILT C LA Y
B OU LD ER S
Coarse
Fine Coarse M edium Fine
HYDROMETER3/ 83 41-1/ 21 103/ 4 16 30 40 50 60 200100
U.S. STANDARD SIEVE S2
“Wet Sieve Equivalent”
Dry Sieve
Figure 14. Comparison graph showing the results from the two different methods used in particle size analysis
3.3 Whole Rock and Particle Size Split Geochemistry
Geochemical analysis was completed on whole rock samples and on particle
size splits from the three weathering profiles. The particle size splits included both
coarse (>25 mm) material and fine grain (<0.2 mm) material. Whole rock analyzes
were completed on all the profile samples and particle size splits were completed on
one profile (HAS). These analyses were completed to determine the effect of both
chemical and physical weathering that may occur in the weathering profiles. Any
chemical changes between the coarse and fine grain particle sizes could indicate
chemical weathering occurring as the particle size of the material decreases.
30
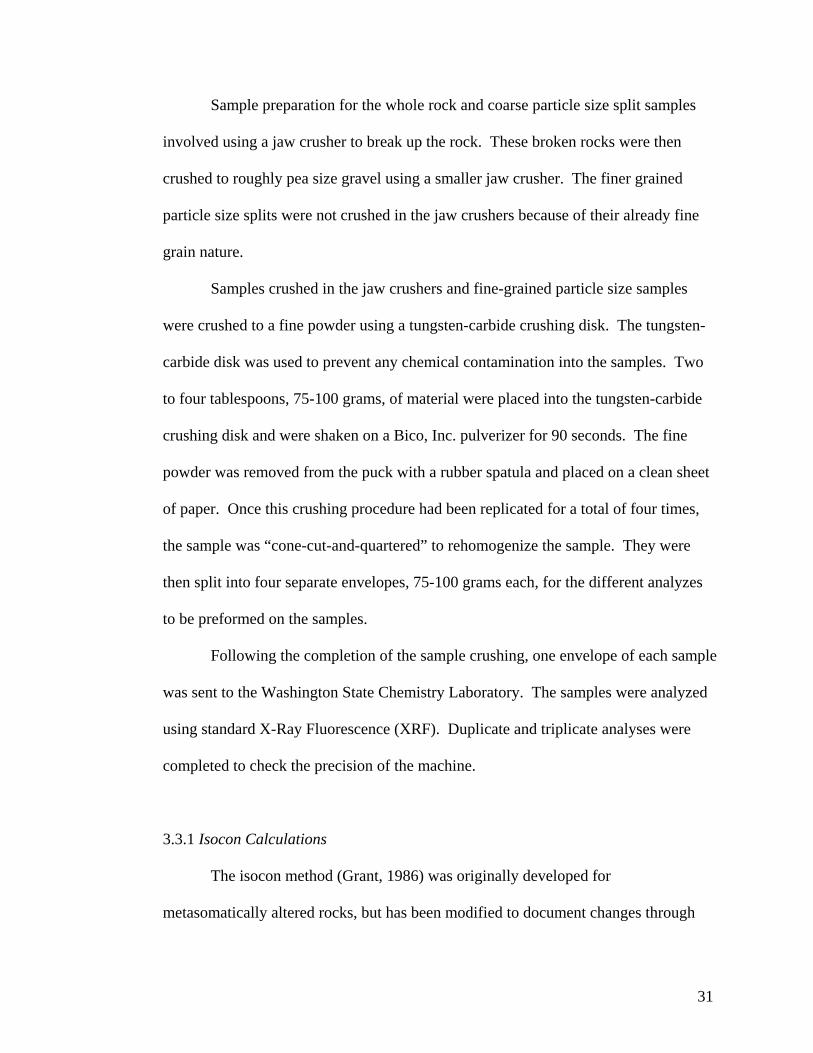
Sample preparation for the whole rock and coarse particle size split samples
involved using a jaw crusher to break up the rock. These broken rocks were then
crushed to roughly pea size gravel using a smaller jaw crusher. The finer grained
particle size splits were not crushed in the jaw crushers because of their already fine
grain nature.
Samples crushed in the jaw crushers and fine-grained particle size samples
were crushed to a fine powder using a tungsten-carbide crushing disk. The tungsten-
carbide disk was used to prevent any chemical contamination into the samples. Two
to four tablespoons, 75-100 grams, of material were placed into the tungsten-carbide
crushing disk and were shaken on a Bico, Inc. pulverizer for 90 seconds. The fine
powder was removed from the puck with a rubber spatula and placed on a clean sheet
of paper. Once this crushing procedure had been replicated for a total of four times,
the sample was “cone-cut-and-quartered” to rehomogenize the sample. They were
then split into four separate envelopes, 75-100 grams each, for the different analyzes
to be preformed on the samples.
Following the completion of the sample crushing, one envelope of each sample
was sent to the Washington State Chemistry Laboratory. The samples were analyzed
using standard X-Ray Fluorescence (XRF). Duplicate and triplicate analyses were
completed to check the precision of the machine.
3.3.1 Isocon Calculations
The isocon method (Grant, 1986) was originally developed for
metasomatically altered rocks, but has been modified to document changes through
31

these weathering profiles. The final results from the isocon calculations document
changes in the gains or losses of elemental oxide compositions relative to the least
altered sample. “By careful considerations of the field relationships and petrology of
the area, one may be able to determine a “least-altered equivalent” (Grant, 1986)”.
In this study, the bottom samples of the each weathering profile were selected
as the “least altered equivalent” based on the previous assumption that the bottoms of
the profiles have undergone the shortest period of weathering. Major elemental oxides
from XRF results for each sample in a profile were compared to the least altered rock
(bottom profile). This chemical data was then scaled to ensure all chemical elemental
oxides plot within the same scale for each sample. This scale is arbitrary and any
value can be assigned to each individual element.
Another assumption needs to be made for plotting the results. A choice of
constant volume, constant mass, or a constant element oxide is needed to determine
the percent gains and losses for each individual element. The most constant of the
elemental oxides in the alteration scar profiles was TiO2. The scaled chemical data for
TiO2 can be used to determine the slope of a line for constant TiO2 (6). The scaled
data is plotted with least altered on the x-axis and altered on the y-axis (Figure 15).
This diagram provides the relative gains and losses relative to constant TiO2. The
exact gains and losses can then be calculated using an equation from Grant, 1986 (7).
Constant TiO2 = TiO2 altered rock / TiO2 least altered rock (6)
% gain or loss = (((oxide altered/ oxide least altered)/Constant TiO2)-1) x 100 (7)
32

0
5
10
15
20
25
30
35
40
45
0 5 10 15 20 25 30 35
Least Altered (HAS-GJG-0006)
Alte
red
(HA
S-G
JG-0
007)
FeO
CaO P2O5
Na2O
Al2O3
MgOMnO K2O
TiO2
SiO2
Figure 15. Example of an Isocon diagram for samples in weathering profile. Red line represents constant TiO2 and blue line represents constant mass. Elemental oxides plotting above red line are enriched and oxides below and depleted, with respect to the least altered sample.
3.4 Acid Base Accounting
Pyrite oxidation of the samples results in the generation of sulfuric acid in the
alteration scars. Acid potential, neutralizing potential and paste pH measurement were
completed on the profile samples to determine the balance between acid producing
and acid consuming minerals and the relative pH of samples through a profile. The
33

results will help to identify the potential for any further pyrite oxidation in the
samples. Acid potential and neutralization potential are from Sobek Acid Base
Accounting Method (Sobek, 1978).
3.4.1 Neutralizing Potential (NP)
The amount of neutralizing bases, including carbonates, present in alteration
scar material is found by treating a sample with a known excess of standardized
hydrochloric acid. The sample and acid are heated to insure that the reaction between
the acid and the neutralizers goes to completion. The calcium carbonate equivalent of
the sample is obtained by determining the amount of unconsumed acid by titration
with standardized sodium hydroxide (Questa Project, SOP 62).
The procedure begins with weighing 0.5 g of pulverized material on a watch
glass to check for the presence of calcium carbonate (CaCO3). One or two drops of
25% hydrochloric acid (HCl) are added to the material to determine if there is a
reaction of CaCO3 with the HCl acid. An observation is made on the degree of
reaction that is observed (Table 3) and a “fizz rating” is assigned to each individual
sample based on the observations.
Following the observation of the “fizz rating,” 2.00 g of pulverized sample was
weighed and added to a wide mouth conical flask. Then HCl acid was added to the
flask, amount and normality dependent of the “fizz rating.” The flask was placed on a
hot plate and heated until the sample begins to boil. The flask was swirled every 5
minutes until the reaction goes to completion; when no gas evolution is visible and the
particles settle evenly over the bottom of the flask. Distilled water (125 mL) was
34

Table 3. Observation, fizz rating and amount and normality of acid required for NP
analysis (from SOP 62).
Observation Fizz Rating HCl (ml) (Normality)
Not audible nor visible None 20 0.1 Audible but not visible Slight 40 0.1
Audible and visible Moderate 40 0.5 Very audible and visible Strong 80 0.5
added to the flask and the material was placed on the hot plate and boiled for one
minute. The samples are then removed from the hot plate and set aside to cool to
slightly above room temperature. Parafilm was placed over the flask and the material
was allowed to cool to room temperature. The samples are set aside until analysis can
be completed.
The analysis begins with titrating the sample using standardized NaOH, either
0.1 or 0.5 N depending on fizz rating assigned, to a pH of 7.0. The total volume of
NaOH used to titrate the sample to pH 7.0 is recorded for NP calculations (below). A
blank sample is analyzed for each of the different “fizz ratings” used in that batch of
samples. This blank is comprised of only HCl and is titrated to a pH of 7.0. The
blank allows for a calculation of a constant that is used in calculating the total NP.
The following calculations are used to complete the NP analysis:
Constant {C} = (mL of acid in blank – mL of base in blank)
mL of acid consumed = (ml of acid added – (mL of based added x C))
NP (kg CaCO3/ton) = (mL of acid consumed) x (25) x (N of acid)
35

A simple calculation of the NP can also be completed if the amount of carbon in each
sample is known and assumed to only be from CaCO3:
1 weight % C = 83.33 tons CaCO3 equivalent / 1000 tons of rock
NP = weight % C x 83.33
3.4.2 Acid Potential (AP)
Acid Potential (AP) tests were completed on the pulverized sample material to
determine the amount of potential (kg CaCO3 /ton) need to neutralize the acid
produced. The principle behind the method is that reduced sulfur in a soil sample is
directly oxidized to acid with hydrogen peroxide and titrated with a standard base to
evaluate the acid potential of the soil (SOP 62). By completing both AP and NP tests,
the potential for the rock to be acid producing or acid consuming can be determined.
The treatment and analysis began by adding 3.0 g of sample material into a
funnel fitted with filter paper. Leaching of the sample was completed by adding 300
mL of 40 % hydrochloric acid (HCl) in funnel filled increments, followed by distilled
water rinsing of the material using funnel filled increments. This was done until the
effluent is free from chloride. To test for presence of chloride, 10% silver nitrate
solution was added in the effluent. If a white cloudy coloration did not form in the
effluent, no chloride remained in the samples. The filter paper and sample were set
aside to air-dry overnight.
After the material had air-dried, 2.00 g of material was scraped from the filter
paper into a 150 mL tall form beaker and 24 ml of 30% H2O2 was added to the beakers
36

and heated to 40°C on a hot plate. The samples were removed from the hot plate
when they reached the desired temperature and set aside for 30 minutes to allow for
the reaction to go to completion. An additional 12 mL of 30% H2O2 was added to the
flask to allow the solution and material to react for 30 minutes. The beaker was placed
back onto the hot plate at approximately 90-95°C and allowed to react for 30 minutes
until the unreacted H2O2 was completely destroyed. The sides of beaker are rinsed
with distilled water, filling the beaker to 100 mL. The beaker was placed back onto
the hot plate to drive off any dissolved CO2 and then set aside to cool at room
temperature.
The resulting solution is titrated using 0.1 N NaOH, which was CO2 free and
sealed off from the atmosphere. The solution is titrated to pH of 7.0 and the amount of
0.1 N NaOH needed to reach a solution with pH equal to 7.0 is recorded. Calculations
can then be used to determine the AP of each sample:
meq (H+)/100g = (mL of NaOH) x (Normality of NaOH) x (50)
tons (H+)/thousand tons of material = meq (H+)/100g x 0.01
• one ton of H+ requires 50 tons of CaCO3 to neutralize the material
AP (kg of CaCO3/ton) = (mL of NaOH) x (Normality of NaOH) x (25)
3.4.3 Paste pH
Paste pH analyses were completed to evaluate the geochemical behavior of
alteration scar materials subject to weathering under field conditions and to estimate
the pH and conductivity of the pore water resulting from dissolution of secondary
mineral phases on the surfaces of oxidized rock particles (SOP 11). These analyses
37

will estimate the pH of the samples and help determine the acidity of the alteration
scar samples. The method is based on the Sobek method (1978).
This method is completed on uncrushed samples once the samples are returned
from the field. The sample is sieved through US Standard Sieve size 10 to obtain both
sand, silt and clay sized material for the test. After sieving the material, 25 g of the
material is placed in a decontaminated beaker. Approximately 25 mL of deionized
water is added to the beaker and the material and solution is stirred with a glass rod
until it forms a paste. The beaker is set-aside for 10 minutes.
The pH and conductivity meters are calibrated during this 10-minute period.
The probes are calibrated using standard solutions of known pH and conductivities.
Once calibrated, the paste pH, paste conductivity and total dissolved solids (TDS) of
the samples can be analyzed. The beakers are tipped to one side to allow a pool of
water or slurry to collect on that side. The probe is then inserted into this slurry to
measure the pH, conductivity, and TDS. The measurements are recorded and the
probes are decontaminated between each sample.
3.5 Sulfide-Sulfate Ratios
Sulfide and sulfate ratios were determined to document the degree of pyrite
oxidation to form sulfates (i.e. gypsum). The results from these ratios may help to
determine the reaction progress in the sulfide weathering system in the weathering
profiles. One packet of the finely powdered and homogenized sample from whole
rock and particle size split geochemistry preparation was sent to the ALS Chemex
laboratory in Reno, NV for analysis.
38

Geochemical analysis of total sulfur and sulfate was completed using the
standard Leco furnace method. This procedure analyzes the samples, at low
temperature, for total sulfate from S2 gas. The samples are reanalyzed at higher
temperature for the total sulfur as S2 gas. The amount of total sulfide can be
determined from the subtraction the two reported results (total sulfur – sulfur from
sulfate = sulfur from sulfide). Total carbon is also analyzed and reported as CO2 from
the method.
3.6 Mineralogical Analyses
The weathering profile samples have been analyzed using petrographic
analysis, clay XRD analysis, standard quantitative X-Ray diffraction (QXRD) and a
mineralogical modeling software program (ModAn) that uses Gaussian elimination
and multiple linear regression techniques to solve simultaneous mass balance
equations (Paktunc, 2001). By using the four unique methods, best estimates of
mineralogy can be determined for the three profiles.
QXRD was only performed on the Hansen profile so an alternate method was
needed to establish semi-quantitative mineralogy for the remaining two profiles. The
results of the ModAn modeling simulations are compared to the QXRD from the
Hansen profile to determine if the ModAn modeling program can be used to determine
the best estimate of mineralogy through the weathering profile and then be applied to
the other profiles.
39

3.6.1 Petrography
Large and small rock fragments from the bulk composite samples were
selected to make thin section billets and fabricated into polished thin sections for
mineralogical analysis. The thin sections were analyzed by standard petrographic
analysis (mineralogy, percentages, and textures) using both reflected and polarized
light on a Nikon Optiphot Pol research petrographic microscope.
3.6.2 Clay Mineralogy
The mineralogy of the clay material may potentially help determine the origin
of clay minerals and to see possible weathering effects occurring in the silicate
weathering system. The clays analyzed were from both the weathered matrix and the
core of rock clasts.
Preparation of matrix clay minerals was completed by grab sampling of the
fine-grained material. The preparation of the rock clays was completed by grab
sampling crushed rock fragments used for the geochemical preparations. Both types
of samples were placed in a beaker of water to allow for any clay-sized minerals to
stay in suspension longer than silt-sized minerals. The clay minerals were then
carefully removed from the beaker with a dropper and placed onto a thin section slide
and set aside to dry. The samples were analyzed at New Mexico State University in
Las Cruses, NM using standard X-Ray Diffraction techniques (XRD).
40

3.6.3 Quantitative X-Ray Diffraction (QXRD)
QXRD sample preparation for the whole rock, coarse particle size (>25 mm)
and fine grained material (<0.2 mm) was completed using the same procedure for
whole rock geochemistry described in section 3.3. One envelope of each sample
packet from the Hansen weathering profile was analyzed using standard QXRD
analysis. The analysis provided mineralogical weight percentages for each of the
mineral phases identified using the XRD Topaz computer program. The values are
reported in weight percentage and the reported standard error is ± 2-weight % for this
procedure. QXRD analysis was completed at the Nicolet National Laboratories,
Madison, WI.
3.6.4 ModAn Mineralogy Modeling
The ModAn modeling program (Paktunc, 2001) is used to estimate mineral
quantities in sulfide-rich rocks using whole rock geochemical analysis. Geochemistry
of the weathering profile samples was completed using standard XRF procedures at
the Washington State Chemistry Laboratories. The percentage of elemental oxides is
input to the model to calculate the mineral abundances of each sample.
A few parameters constrain the use of this program and must be considered
before attempting to model mineralogy with ModAn. These parameters include the
presence of sulfide minerals, in addition to the presence of sulfate minerals. The
program is only useful when one sulfide mineral is present. If pyrite and chalcopyrite
are both present, the program can only model one of the sulfide minerals and will not
accurately report the sulfide mineral abundances. In the case of the alteration scar
weathering profiles, pyrite is the dominant sulfide mineral phase. Chalcopyrite has
41
been observed in the profile samples but only in small abundances (<0.1%), and was
ignored in the calculations.
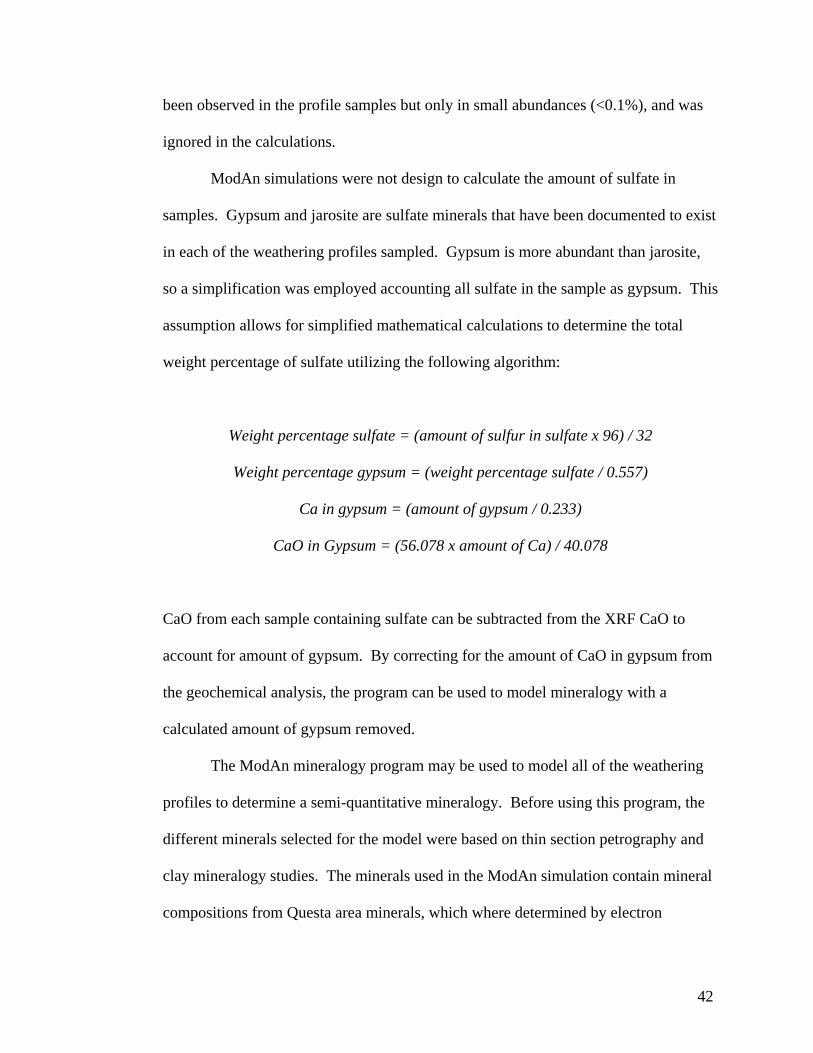
ModAn simulations were not design to calculate the amount of sulfate in
samples. Gypsum and jarosite are sulfate minerals that have been documented to exist
in each of the weathering profiles sampled. Gypsum is more abundant than jarosite,
so a simplification was employed accounting all sulfate in the sample as gypsum. This
assumption allows for simplified mathematical calculations to determine the total
weight percentage of sulfate utilizing the following algorithm:
Weight percentage sulfate = (amount of sulfur in sulfate x 96) / 32
Weight percentage gypsum = (weight percentage sulfate / 0.557)
Ca in gypsum = (amount of gypsum / 0.233)
CaO in Gypsum = (56.078 x amount of Ca) / 40.078
CaO from each sample containing sulfate can be subtracted from the XRF CaO to
account for amount of gypsum. By correcting for the amount of CaO in gypsum from
the geochemical analysis, the program can be used to model mineralogy with a
calculated amount of gypsum removed.
The ModAn mineralogy program may be used to model all of the weathering
profiles to determine a semi-quantitative mineralogy. Before using this program, the
different minerals selected for the model were based on thin section petrography and
clay mineralogy studies. The minerals used in the ModAn simulation contain mineral
compositions from Questa area minerals, which where determined by electron
42

microprobe analysis (D. Sweeney, personal comm.). The minerals used in the ModAn
program include: Moly Na-spar 1, Moly ksp 2, avg. Moly clay, Moly epidote 1, Moly
chlorite 1, Fe-oxides 1, calcite, quartz and pyrite (Table 4). Quartz and calcite are
from the ModAn database of ninety-two general mineral compositions. The Avg.
Moly clay is the average composition of Questa composition illite, smectite, kaolinite
and mixed layer clays. Parts in ten calculations completed from clay mineralogy
studies, (Hall, 2004; Donahue, et al., 2007) were used to determine the weight
percentages of each of these simulated clay minerals.
Table 4. Mineral compositions from the Questa Area
Mineral Composition
Moly Na-Spar 1 (K0.03, Na0.78, Ca0.18)Al1.22Si2.8O8
Moly ksp 2 (K0.99, Na0.04)Al1.03Si2.97O8
Avg. Moly clay (K0.33, Na0.05,Ca0.07)(Fe0.29,Mn0.01,
Mg0.61) Al2.56Si3.85O13
Moly Epidote 1 Ca1.82(Fe1.47Al1.82)Si2.74O13
Moly Chlorite 1 (K0.03, Na0..17,Ca0.02)(Fe1.83,Mn0.24,
Mg6.16) Al1.67Si2.67O18
Fe-Oxides (Fe0.9, Ti0.05,Mg0.08)O2
To run a simulation for each individual sample, geochemical data was
imported into the ModAn program, and corrected for gypsum CaO. The petrographic
mineral assemblages were entered into the simulation to estimate the abundance of
each mineral. If a mineral contained a negative mode, it was suppressed from the
43

simulation and the process restarted. This was completed until all negative mineral
modes were removed from the simulation. Only the minerals noted in individual
sample petrography were allowed for the ModAn simulations.
3.7 Stable Isotope Geochemistry
Stable isotopes from a variety of minerals were completed in this study to
determine the origin of these minerals. The minerals and isotopes analyzed include: 1)
pyrite (δ34S); 2) gypsum (δ34S & δ18OSO4); and 3) clays (mixture of illite, smectite,
chlorite, and kaolinite) (δ18O & δD). The results from these analyzes will help
determine the origin of the minerals (i.e. hydrothermal or weathering).
3.7.1. Sulfide and sulfate minerals
Sulfur were completed on both pyrite and gypsum and oxygen isotopes
completed on gypsum. By completing both the δ34S and δ18OSO4 it may be possible to
discriminate supergene gypsum from hydrothermal gypsum. The following
preparation methods were used prior to stable isotope analysis.
3.7.1.1 Gypsum preparation
Gypsum crystals were hand-picked using a tweezers under a Wild M8 variable
magnification binocular microscope. The gypsum was picked from the fine-grained
sample material, fracture fillings, gypsum coatings on rock fragments, and large
crystals found in the field near sample locations.
44

Gypsum contains two oxygen sites within its chemical structure (CaSO4 •
2H2O), however, the oxygen in the sulfate (SO4) is the desired oxygen to be analyzed.
This oxygen will provide insights into the origin of the sulfate minerals (ancient
supergene, modern supergene, or magmatic). A method was developed by
Wasserman et al., (1998) to dissolve alunite and reprecipitate the dissolve sulfate as
barite (BaSO4). This method was modified at the New Mexico Institute of Mining and
Technology Stable Isotope Laboratory for gypsum (Campbell and Lueth, 2008).
The procedure began by adding 120 mg of 0.5 N NaOH to a 150-200 mL
beaker. Then 60 mg of gypsum was weighed and added to the solution in the beaker.
The beaker was heated on a stirring hot plate at 80°C for 3 hours and periodically
checked to see that the gypsum was being dissolved. After 3 hours of heating, the
samples were set aside to cool until filtering can be performed.
Once the samples have cooled sufficiently, the solution was filtered through a
1.0μm cellulose nitrate membrane Whatman filtering device. This filtering ensures
that any solid residue that was not dissolved will remain on the filter. The solution
was then reheated to 80°C on the stirring hot plate and quickly acidified using 10 N
HCl to a pH of < 2. One 2 ml squirt of 0.5 N BaCl2 was added to the solution. The
sample was heated for 2-3 hours and periodically checked for the presence of
precipitating white material (barite). The sample was removed from the heating plate
and set aside to cool overnight. The material was then filtered with a 0.45μm cellulose
nitrate membrane Whatman filtering device, dried in the oven at 30°C, weighed and
stored until analysis could be completed.
45

3.7.1.2 Pyrite Preparation
Selected rock fragments containing pyrite from the bottom samples of the three
weathering profiles were prepared for δ34S analysis. These samples were selected
because of the abundance of pyrite towards the bottom of the profiles. Because of the
fine-grained nature of the pyrite grains in the rock fragments, the samples were
crushed in a disk grinder to a fine powder.
Pyrite grains were separated using sodium metatungstate heavy liquid with a
density of three. This allows for the pyrite grains to sink to the bottom of the device
and the lighter minerals (i.e. quartz, feldspars, and clays) to float to the top of the
device. The pyrite crystals were placed into a funnel fitted with filter paper to remove
the heavy liquids and leave the remaining pyrite crystals. The samples were rinsed
with distilled water until the heavy liquids were completely removed and then dried in
an oven.
The resulting material was examined under a binocular microscope to
determine if there were any other minerals besides pyrite. Some quartz and clay
minerals were observed, so the material was run through a Franz magnetic separator to
try to concentrate as much of the pyrite as possible. Pyrite crystals were then hand
picked from the material and placed in sample vials until the material could be
analyzed.
3.7.1.3 δ18O Analysis of Sulfate Isotopes
Gypsum crystals that were chemically converted to barite were analyzed to
determine the δ18O of sulfate. This method uses the continuous flow method on the
46

FinniganMAT Delta Plus XP Gas Mass Spectrometer using a CO reference gas.
Reference samples analyzed include NBS127 (National Bureau of Standards isotope
standard) and benzoic acid (HEKA isotopic standard). The known reference values
are used to make a correction curve to correct the unknown samples isotopic values.
The procedure involved weighing 0.1 milligrams of barite into 3 x 5 mm silver
cups (Costech # 041072). These cups were placed into a turret that drops the samples
into a Thermo Finnigan TC/EA Elemental Analyzer furnace set to 1450ºC. The
furnace contains a reactor of glassy carbon granules, which converts the oxygen from
sulfate into carbon monoxide gas. The gas is carried through a gas chromatograph,
and into the mass spectrometer through a continuous flow of helium. The gas samples
were measured against the carbon monoxide reference gas to determine the oxygen
isotopic value and then corrected to the known mineral standards. Reproducibility of
δ18O isotopic values measured on the mass spectrometer is 0.1 ‰.
3.7.1.4 δ34S Analysis of Sulfur Isotopes
Pyrite crystals that were separated using the heavy liquid separation method
were analyzed to determine the δ34S of pyrite. This method uses the continuous flow
method on the FinniganMAT Delta Plus XP Gas Mass Spectrometer using a SO2
reference gas. Reference samples analyzed include AJC (barite) (NMT SI Laboratory
in house standard), FeS (pyrrhotite) (NMT SI Laboratory in house standard), NBS123
(sphalerite)(National Bureau of Standards isotope standard) and NBS127 (barite)
(National Bureau of Standards isotope standard). The known reference values are
used to make a correction curve to correct the unknown samples isotopic values.
47

The procedure involved weighing, depending on amount of sulfur in the
mineral, 0.7 mg of pyrite or 2.8 mg of barite into 3 x 5 mm pressed tin cups (Costech
#041077). An additional 6.0 mg of Vanadium Pentaoxide (V2O5) is added to the
barite samples to aid in combustion of the material. These cups are placed into a turret
that dropped the samples into a Costech Elemental Combustion System CHNS-O
(ECS 4010) set to a temperature of 1020°C. A sample is dropped automatically into a
combustion reactor and a pulse of high purity oxygen (purity = 99.99%) is injected
into the reactor. The samples combust with the addition of the oxygen and create SO2
gas; the sulfur in the SO2 gas is derived directly from the mineral analyzed. The gas is
carried through a gas chromatograph, and into the mass spectrometer through a
continuous flow of helium. The gas samples are measured against the sulfur dioxide
reference gas to determine the sulfur isotopic value and then corrected to the known
mineral standards. Reproducibility of δ34S isotopic values measured on the mass
spectrometer is ± 0.1 ‰.
3.7.2 Clay Isotopes
The preparation methods involved in this study were modeled after a flow
chart from Gilg et al. (2004), but were modified to meet specific needs, based on the
mineralogy of clay-sized material (Figure 16). Sample selection was based in part on
X-Ray Diffraction (XRD) patterns from clay mineralogy studies of the Questa area
(Donahue et al., 2007). Samples selected for isotope analysis from the alteration scars
include, 1) “gray clay” layers, 2) HAS-GJG-0009 (pure illite), and 3) various samples
from the Southwest Hansen and Hansen alteration scar profiles. The pure illite sample
48

is a potential end-member for determining the isotopic composition of hydrothermally
produced clay. The Southwest Hansen and Hansen profile samples were selected to
see the variations of clay compositions through a weathering profile. Rock pile clays
from the clay leach study of Goat Hill North were also analyzed to determine the
isotopic similarities and/or differences between rock pile and alteration scar clay
origin.
Figure 16. Flow chart of sample preparation procedures used prior to stable isotope analysis (modified from Gilg et al., 2004).
49

The diversity of clay-sized oxygen and hydrogen bearing minerals, identified
by XRD, within the rock piles and alteration scars necessitated sample purification
procedures before isotopic analysis. Clay purification treatments used in this study
include a sequential treatment of the clay-sized samples in the following order: 1) 1N
acetic acid buffered to pH 5; 2) Na-dithionite-citratre-bicarbonte (DCB) and 3) 0.5 M
Sodium Hydroxide. These methods are described in detail below.
3.7.2.1 Physical Separation
The physical separation of clay-sized minerals was completed using a
sedimentation process. A split of each sample was wet sieved through US Standard
size sieves 10 (2 mm), 50 (0.3 mm), and 200 (0.075 mm). Clay and silt-sized material
passing the 200 sieve was screened through a 2μ filter using a Millipore vacuum
system. This material was then transfer to 500mL beakers and dried in an oven at
30ºC until the water evaporated. The remaining clay was pulverized using a mortar
and pestle and transferred into sample bottles for storage.
3.7.2.2 Acetic Acid Treatment
The abundance of gypsum and calcite (both hydrothermal and supergene) in
the samples could affect the final δ18O of the clays. No gypsum or calcite was
detected in the XRD scans of the clay-sized material; however, because of their
common occurrence in local rocks, this treatment was performed.
50

This treatment involves treating 1.5 grams of clay-sized sample with 1N acetic
acid, adjusted to a pH =5 using 1M Na-acetate (Gilg et al, 2004) and heating at 25-
50ºC for 2-3 hours. Following the treatment, the sample was rinsed with distilled
water and filtered through a 1.0μm cellulose nitrate membrane Whatman filtering
device. The sample was weighed and stored in sample vials.
3.7.2.3 Na-Dithionite-Citrate-Bicarbonate Treatment
Sulfide weathering (pyrite and calcite to gypsum) of the rock piles and
alteration scars precipitates goethite, hematite, and jarosite. These minerals contain
oxygen, which will affect the bulk δ18O. Samples that were treated to remove
carbonates and sulfates were subsequently treated using the Na-dithionite-citrate-
bicarbonate (DCB) method (Mehra and Jackson, 1960). This treatment was completed
to remove any iron oxides and hydroxides.
This treatment involves adding 1g of clay-sized sample to a mixture of 40mL
of 0.3 M Na-citrate and 5mL of 1 M Na-bicarbonate into a 50mL centrifuge tube and
heating in a water bath to 60ºC. After the solution reaches the desired temperature, 2
grams of Na-dithionite are added to the centrifuge tube. The sample is then stirred
continuously for 1 minute and stirred for 15 seconds after every 5 minutes, for
duration of fifteen minutes. The time to complete a set of ten samples was 30-45
minutes. The samples, independent of starting color, should turn gray upon
completion of the test. If the sample stayed the original color, the treatment was
repeated a second time.
51

The samples are then set aside to cool. Upon cooling of the solution, the tubes
are centrifuged for 15 minutes to separate the solution and the clay material. The
solution is discarded (using hazardous waste protocols because of its strong oxidizing
potential) and the clay samples are rinsed with distilled water, filtered through 1.0μm
cellulose nitrate membrane Whatman filtering device, and dried in an oven at 30ºC.
The sample is weighed and stored in sample vials.
3.7.2.4 0.5 M Sodium Hydroxide Treatment
The presence of amorphous or poorly ordered aluminosilicate minerals (i.e.
amorphous silica) that could affect the final δ18O of the samples cannot be ruled out
because these amorphous minerals are not readily detected in XRD scans. The sodium
hydroxide treatment (Hashimoto and Jackson, 1960) was used to remove any
amorphous minerals from the sample before isotopic analysis.
This treatment involves adding 100-150 mg of the clay sample to 100 mL of
0.5 M solution of NaOH. The addition of larger amounts of clay sample to the
solution will result in the supersaturation of the solution, which will prevent the
dissolution of amorphous materials (Hashimoto and Jackson, 1960). The mixture of
sample and solution is brought to a rapid boil and boiled for two and a half minutes.
The samples are removed from the heat and placed in a water bath at room
temperature to cool.
They are washed with distilled water, filtered with a 0.45μm cellulose nitrate
membrane Whatman filtering device, dried in an oven at 30ºC, weighed and stored in
sample vials until isotopic analysis could be completed. The amount of treated sample
52

recovered ranged from 45mg to 145mg because of the sticky nature of the clay
material, which made it difficult to remove all of the treated material from the
Whatman filtering paper.
3.7.2.5 XRD Analysis
Clay mineralogy of the samples was determined by X-Ray Diffraction analysis
at New Mexico State University, Las Cruces, New Mexico. These analyzes were
completed prior to the chemical treatments and after the chemical treatments to check
for sample purity (Figure 17). It is evident that non-clay minerals containing oxygen
were removed from the clay-sized fraction before isotopic analysis. This specific
sample (SWH-GJG-0022) contains jarosite as an oxygen-bearing sulfate before
chemical treatments, and the post-treat XRD pattern indicate jarosite was removed
from the sample prior to analysis. Comparison of all the samples pre- and post-
treatment XRD patterns indicates that non-clay oxygen-bearing minerals (i.e. jarosite)
were removed from the samples, with the exception of quartz.
The chemically treated clays were prepared for isotopic analysis using a
technique created by Taylor and Epstein, (1962) and modified by Borthwick and
Harmon, (1982). This method uses a fluorinating agent to break the silica-oxygen
bond and release the oxygen as O2 gas. The O2 gas is converted to carbon dioxide by
heating with a hot carbon rod. The CO2 gas is measured using the dual inlet method
on a FinniganMAT Delta Plus XP Gas Mass Spectrometer. δ18O isotopic values are
measured on the mass spectrometer with a precision of 0.1 ‰.
53

Figure 17. Comparison of XRD patterns pre-and post-chemical treatments to check for sample purity (SWH-GJG-0022). A) post-treatment XRD pattern, B) pre-treatment pattern. Notice that jarosite (J) was removed from the sample by performing chemical treatments. (Minerals – S/C = smectite & chlorite; I = illite; C/K = chlorite & kaolinite; J = jarosite; C = chlorite; Q = quartz, H = halite)
3.7.2.6 δ18O Analysis
15 mg of chemically treated clay-sized sample were loaded into stainless steel
vials for transfer into vacuum-sealed heating nickel reaction vessels. A fluorinating
agent (ClF3) is introduced into the reaction vessels and heated at 550ºC for 8 hours.
The O2 gas is expanded into a cold trap containing an electrically heated carbon rod.
The carbon rod, using platinum wire as a catalyst, converts O2 gas to carbon dioxide.
The carbon dioxide is frozen in the cold trap containing the carbon rod by liquid
nitrogen. The trap is heated, using a heat gun, transferring the carbon dioxide to the
cold finger to measure the converted carbon dioxide gas. Liquid nitrogen is placed on
54

a sample vial and the cold finger is heated to transfer the carbon dioxide gas to the
sample vial.
The carbon dioxide gas is measured using the dual inlet system on a
FinniganMAT Delta Plus XP Gas Mass Spectrometer using an Oztech certified stable
isotope gas standard. Quartz reference samples (NBS-28 from NIST) were analyzed
to determine the accuracy and precision of the extraction procedure. NBS-28
reference samples known δ18O isotopic composition is 9.64 ‰. The NBS-28
reference samples analyzed during this experiment were 9.0 ± 0.1 ‰.
3.7.2.7 δD Analysis
Chemically treated samples were analyzed to determine the hydrogen isotope
composition of the clay minerals. This method uses the continuous flow method on
the FinniganMAT Delta Plus XP Gas Mass Spectrometer using an Oztech certified
stable isotope gas standard. Reference samples analyzed include CH7 (IAEA isotopic
standard) and benzoic acid (Costech isotopic standard). The known reference values
are used to make a correction curve to correct the unknown samples isotopic values.
The procedure involves weighing 1-1.5 grams of treated clay-sized sample into
a 3 x 5 mm silver cup (Costech # 041072). These cups are placed into a turret that
drops the samples into a Thermo Finnigan TC/EA Elemental Analyzer furnace set to
1450ºC. This furnace contains a reactor of glassy carbon granules, which converts
oxygen to carbon monoxide gas and hydrogen to hydrogen gas. The gas is carried
through a gas chromatograph, and into the mass spectrometer through a continuous
flow of helium. The gas samples are measured against the hydrogen reference gas to
55

determine the hydrogen isotopic value and then corrected to the mineral standards.
Reproducibility of δD isotopic values measured on the mass spectrometer is ±1 ‰.
56

4. RESULTS
4.1 Particle Size
A summary of the particle size results is presented in Table 5. These results
illustrate how grain size changes with respect to the height in each sample profile.
Each individual sample particle size analysis is located in Appendix A.
Table 5. Summary of particle size analysis
Sample # Height from Bottom of Profile (Ft.) %Gravel %Sand %FinesHAS-GJG-0010 22 50.07 47.53 2.40 HAS-GJG-0009 17 33.78 62.71 3.51 HAS-GJG-0008 10 75.94 22.94 1.12 HAS-GJG-0007 1 94.40 5.48 0.11 HAS-GJG-0006 0 78.01 21.64 0.35
SWH-GJG-0015 37.1 36.61 62.52 0.86 SWH-GJG-0014 28.9 34.94 64.05 1.01 SWH-GJG-0013 18.8 2.37 85.87 11.76 SWH-GJG-0012 11.3 44.38 54.53 1.09 SWH-GJG-0011 1.5 38.42 58.71 2.87 SWH-GJG-0010 1.3 0.00 87.40 12.60 SWH-GJG-0009 1.1 44.28 53.80 1.92 SWH-GJG-0008 0 59.41 39.28 1.30
SWH-GJG-0023 7 85.35 13.91 0.74 SWH-GJG-0022 5 50.65 48.22 1.13 SWH-GJG-0021 3 37.33 59.26 3.41 SWH-GJG-0020 0 92.44 7.15 0.42
Figure 18 A-C depicts the location of each sample in a weathering profile
versus the resulting percent finer by weight for gravel, sand, and fines (silt and clay).
Generally, from the bottom to the top of each weathering profile, the percentage of
gravels decrease and the percentages of sands and fines increase.
57

Figure 18. Caption on the following page.
58

Figure 18. A) Particle size distribution for the Hansen weathering profile; B) Particle size distribution for the Lower Southwest Hansen weathering profile; C) Particle size distribution for the Upper Southwest Hansen weathering profile. (Note: y-axis is location of each sample in weathering profile; 1 = bottom).
Figure 18A represents apparent particle size trend in the Hansen profile where
there is an increase in particle size at the top of the profile. The apparent increase in
gravels in the top of the profile is due to the presence of a “gray clay” layer below,
which contains few gravel fragments. In figure 18B, the spikes in the percentage of
sands and fines correspond with other “gray clay” layers located within the profile. In
contrast, the large increase in the percentage of gravel in figure 18C represents
recementation by a ferricrete at the top of the profile.
59

4.2 Geochemistry
The results from the whole rock XRF geochemistry are located in Table 6
(major chemistry) and Table 7 (trace elements). The results from these analyzes have
been employed in a variety of different methods in this study. The study was focused
on the major element geochemistry to determine any geochemical signatures from
mineralogical changes.
4.3 Acid Base Accounting
Acid base accounting (ABA), and paste pH results are located in Table 8. The
results from these tests determine the potential for the materials to be acid producing
or acid consuming and provide a pH of the composite samples. The Neutralizing
Potential (NP) is the neutralizing potential given in kg of CaCO3/ton and Acid
Potential (AP) is the amount of CaCO3 needed to buffer all the acid that will be
produced from the composite samples. NP of the samples range from –20.63 to 7.54
kg of CaCO3/ton. The Acid Potential (AP) of the samples range from 104.06 to 0.00
kg of CaCO3/ton.
The Net Acid Producing Potential (NAPP) is the potential for the sample to be
acid producing or acid consuming. Positive values are acid producing and negative
values are acid consuming. Only two samples (SWH-GJG-0011 & SWH-GJG-0014)
have negative NAPP, which means there is potentially enough acid consuming
minerals to consume the acid produced. The remaining samples will be acid
producing from the time the acid consuming minerals are consumed or until all of the
60

Table 6. Major oxide XRF geochemistry (weight %)
61

Table 7. Trace element geochemistry (ppm)
62

acid-producing minerals (pyrite) are oxidized. Paste pH results indicate a very acidic
environment with pH’s ranging from 2.05-2.98.
Table 8. Acid Base Accounting and Paste pH results
Sample #
Wt % Sulfide
AP
NP
NAPP
Paste pH
HAS-GJG-0010 0.09 2.81 -0.80 3.61 2.60
HAS-GJG-0009 0.17 5.31 -4.04 9.35 2.05
HAS-GJG-0008 0.25 7.81 -0.39 8.21 2.80
HAS-GJG-0007 3.33 104.06 -7.26 111.32 2.98
HAS-GJG-0006 2.55 79.69 7.50 72.18 2.52
SWH-GJG-0015 0.08 2.50 0.08 2.42 2.64
SWH-GJG-0014 0.15 4.69 5.34 -0.65 2.17
SWH-GJG-0013 2.34 73.13 4.45 68.67 2.65
SWH-GJG-0012 0.4 12.50 4.47 8.03 2.59
SWH-GJG-0011 0.09 2.81 5.39 -2.58 2.46
SWH-GJG-0010 1.76 55.00 -14.89 69.89 2.42
SWH-GJG-0009 0.59 18.44 -20.63 39.06 2.37
SWH-GJG-0008 0.32 10.00 -6.49 16.49 2.36
SWH-GJG-0023 0 0.00 -13.68 13.68 2.36
SWH-GJG-0022 0.68 21.25 -0.88 22.13 2.56
SWH-GJG-0021 0.41 12.81 3.39 9.42 2.39
SWH-GJG-0020 2.33 72.81 7.54 65.27 2.49
4.4 Sulfide to Sulfate Ratios
The ratio of sulfur in sulfide to sulfur in sulfate tends to decrease as a function
of height in each profile (Figure 19 A-C). The highest S/SO4 ratios correspond with
“gray clay” layers and the base of two profiles. The S/SO4 ratios in the Hansen and
63

upper Southwest Hansen profile document the increasing sulfate content, coupled with
the decrease in sulfide, which is the expected weathering scenario within a profile.
The lower Southwest Hansen profile does not follow the expected weathering scenario
as the S/SO4 ratio varies within the profile.
Table 9. Sulfide-Sulfate ratio results
Sample # Sulfur in Sulfide Sulfur in SO4 Sulfide/Sulfate Wt % Carbon
HAS-GJG-0010 0.09 0.89 0.10 0.02
HAS-GJG-0009 0.17 0.97 0.18 0.01
HAS-GJG-0008 0.25 2.98 0.08 0.05
HAS-GJG-0007 3.33 2.68 1.24 0.02
HAS-GJG-0006 2.55 1.70 1.50 0.03
SWH-GJG-0015 0.08 3.41 0.02 0.02
SWH-GJG-0014 0.15 0.45 0.33 0.02
SWH-GJG-0013 2.34 0.66 3.55 0.01
SWH-GJG-0012 0.40 0.75 0.53 0.02
SWH-GJG-0011 0.09 1.05 0.09 0.02
SWH-GJG-0010 1.76 1.33 1.32 0.05
SWH-GJG-0009 0.59 2.59 0.23 0.05
SWH-GJG-0008 0.32 1.49 0.21 0.03
SWH-GJG-0023 0.00 2.11 0.00 0.10
SWH-GJG-0022 0.68 1.39 0.49 0.04
SWH-GJG-0021 0.41 1.78 0.23 0.04
SWH-GJG-0020 2.33 0.43 5.42 0.03
64

Figure 19. Caption on the following page.
65

Figure 19. Graphical representation of the ratio of sulfur from sulfide divided by sulfur from sulfate versus location in weathering profile. A) Hansen Profile; B) Lower Southwest Hansen Profile; C) Upper Southwest Hansen Profile
4.5 Mineralogical Results
4.5.1 Petrography
Thin section petrography was completed on all samples where rock fragments
were large enough to cut and make a thin section. The results from each individual
petrographic analysis are located in Appendix B. These analyses provide semi-
quantitative results on mineral abundances and textures and provide a method to
determine the alteration type of each sample (Figure 20 A-B).
66

A)
Quartz and Clay Groundmass
Pyrite
Quartz vein
1 mm
B)
Plagioclase Lath Clay and Quartz groundmass
Chlorite Pyrite
1 mm
Figure 20. Thin section photomicrographs of samples of different hydrothermal alteration. A) Intense QSP hydrothermal alteration (HAS-GJG-0009) (Crossed Polarized Light); B) QSP overprinting propylitic alteration (SWH-GJG-0008) (Plane Polarized Light).
67

Figure 20A represents an intense QSP altered rock that has been
hydrothermally altered to quartz, pyrite and clay. The fine-grained groundmass of the
sample makes it difficult to distinguish the types of clay minerals, but the abundance
of total clay can be estimated. Quartz is easily recognized in phenocrysts, groundmass
and as crosscutting veinlets. The black minerals are pyrite grains and are most easily
recognized using reflected light. This intense QSP alteration typically occurs near the
tops of the profiles, but also has been noted to occur near the bottom of the profiles in
bedrock samples, were it is associated with gray clay veinlets.
Figure 20B illustrates QSP overprinting propylitic alteration. In this alteration
we see propylitic minerals, epidote and chlorite, being replaced by quartz, clay and
pyrite. Pyrite and other oxides minerals replace chlorite in the samples. A small,
fresh plagioclase crystal still remains and appears to have been unaffected by the
hydrothermal alteration. The groundmass of the sample contains abundant quartz and
clay minerals.
These two photomicrographs represent examples of the two distinct
hydrothermal alteration types seen in the alteration scars. Many of the plagioclase
crystals seen in other samples have a very distinct hydrothermal texture. Pyrite
crystals in other samples have oxide rims and/or gypsum rims indicating that oxidation
is occurring. The main purpose for the petrographic analysis is to determine the
mineralogy of each sample as an input to the modeling of the mineralogy using the
ModAn modeling program.
68

4.5.2 Clay Mineralogy
Clay mineralogy (reported as parts in ten) results are located in Table 10.
Sample numbers that contain (–20) are clays liberated by crushing rock fragments and
samples with (–06) are matrix clays. Figure 21 illustrates similarities between clays
liberated from rock fragments and matrix clays. All clay documented within the rock
fragments also are located within the matrix clays. Each individual clay XRD scan
can be found in Appendix D.
Figure 21. Clay X-Ray diffraction scans of rock fragments to soil matrix for samples SWH-GJG-0008 (SWH-08) and HAS-GJG-0006 (HAS-06) (from Donahue et al, 2008). Number above peaks corresponds to 2θ of clay minerals (abbreviated by capitalized first letter). (S = smectite, C = chlorite, I = illite, J = jarosite).
The results from the XRD clay mineralogy indicate there is no systematic
variation with the types and abundances of clays upwards in each profile. However, in
the intense QSP alteration, illite is the dominant clay mineral phases (i.e. HAS-GJG-
0009 & SWH-GJG-0013). Where QSP overprints propylitic alteration, clay phases
69

that are present include kaolinite, chlorite, illite, smectite, and mixed layer clays, with
illite and chlorite being the dominant clay phases.
Table 10. Parts in ten clay results
Sample Kaolinite Chlorite Illite Smectite Mixed LayerHAS-GJG-0010-06 0 2 5 1 2 HAS-GJG-0009-06 0 0 10 0 0 HAS-GJG-0007-06 0 6 2 1 1 HAS-GJG-0006-06 1 4 1 2 2 SWH-GJG-0015-06 1 3 2 2 2 SWH-GJG-0014-06 0 0 6 1 3 SWH-GJG-0013-06 1 0 7 0 2 SWH-GJG-0012-06 0 3 3 2 2 SWH-GJG-0011-06 0 1 1 5 3 SWH-GJG-0010-06 1 2 3 2 2 SWH-GJG-0009-06 1 2 2 3 2 SWH-GJG-0008-20 1 2 3 3 1 SWH-GJG-0008-06 2 1 2 3 2 SWH-GJG-0023-06 1 2 4 1 2 SWH-GJG-0022-06 0 3 5 1 1 SWH-GJG-0021-06 0 2 2 2 4 SWH-GJG-0020-20 1 2 1 2 4 SWH-GJG-0020-06 1 2 0 3 4
4.5.3 Comparison of Mineralogical Methods
Quantitative X-Ray diffraction was completed on only the Hansen weathering
profile samples. The QXRD results from the Hansen profile were then used to verify
the ModAn mineralogical models in the Hansen profile (Table 11). ModAn,
constrained with petrographic analysis, is used to refine mineralogical percentages
from all three profiles. This is possible in all profiles because petrographic analysis,
whole rock geochemistry and sulfide-sulfate measurements had been completed on all
samples.
Mineral abundances vary slightly from the QXRD and petrographic analysis
but are within ranges of error in these reported values. Silicate mineral abundances
70

(Table 11) simulated with ModAn and constrained with petrography, generally agree
within ± 5 % of the reported values from the QXRD. This close agreement between
QXRD and ModAn analysis provide confidence that the ModAn simulations, when
coupled with petrographic data, are reliable for estimating semi-quantitative
mineralogy of the other two profiles.
Several discrepancies in Table 11 are the amount of gypsum, illite and chlorite
determined by QXRD and ModAn. The majority of gypsum in the samples is
contained within the fine-grained fraction of the sample. No gypsum is detected in
petrography because the petrography was completed on the larger rock fragments,
which contain little to no gypsum, unless noted in fracture filling veinlets.
The discrepancy in illite and chlorite are attributed to the fine-grained nature of
these minerals. Biotite also is rarely seen in thin section but is reported in QXRD. The
biotite in QXRD could represent illite or chlorite, because it is documented that there
is chloritization of biotite in propylitic alteration. The QXRD does not account for the
extremely high amounts of illite that were identified in thin section because those
peaks may have been assigned to different minerals in the XRD Topaz modeling
program.
Chlorite is apparently overestimated in the reported QXRD results, while
chlorite from petrography and ModAn are nearly equal in abundances. This
discrepancy is attributed to using a generalized clay composition of Questa clay (Avg.
Moly Clay) in the ModAn simulation. Accordingly, it appears as the ModAn models
remove iron from the chlorite composition and add iron to the general clay
composition, resulting in a misrepresentation of the true total chlorite in each sample.
71

Table 11 illustrates data that suggests ModAn, when coupled with petrography,
is an acceptable way to refine the mineralogy seen in thin section petrography. By
using only the minerals identified in petrography, it is possible to accurately model
sample mineralogy by suppressing minerals not observed in thin section.
4.5.4 Bulk Mineralogy
The bulk mineralogy, determined by ModAn, is based on petrography and
whole rock geochemistry. A set of locally important minerals (with average
composition determined by microprobe analysis) (Table 4) forms the basis for the
ModAn calculations. However, if ModAn predicts a mineral not noted in petrographic
analysis, it is suppressed and ModAn rerun. In this way, the minerals in the bulk
mineralogy are determined petrographically, with the refined percentages coming
from ModAn.
The results from the ModAn simulations for individual profile samples are
provided in Table 12. Using mineralogy (weight %) vs. location in weathering profile
figures, the mineralogical changes can be identified in each weathering profile. The
profiles presented in Figures 22, 23 and 24 represent the results for the mineralogical
changes in each weathering profile.
Whole rock, coarse-grained (>25mm), and fine-grained (<0.2 mm) material
was analyzed from the Hansen profile to determine any mineralogical changes
between coarse and fine-grained material (Figure 21). These particle size split
samples are from the bottom of the profile and the two samples near the top of the
72

Table 11. Comparison of QXRD, Petrography and ModAn Modeling results from the
Hansen profile
73

74
Table 12. Mineralogy of weathering profiles (ModAn)
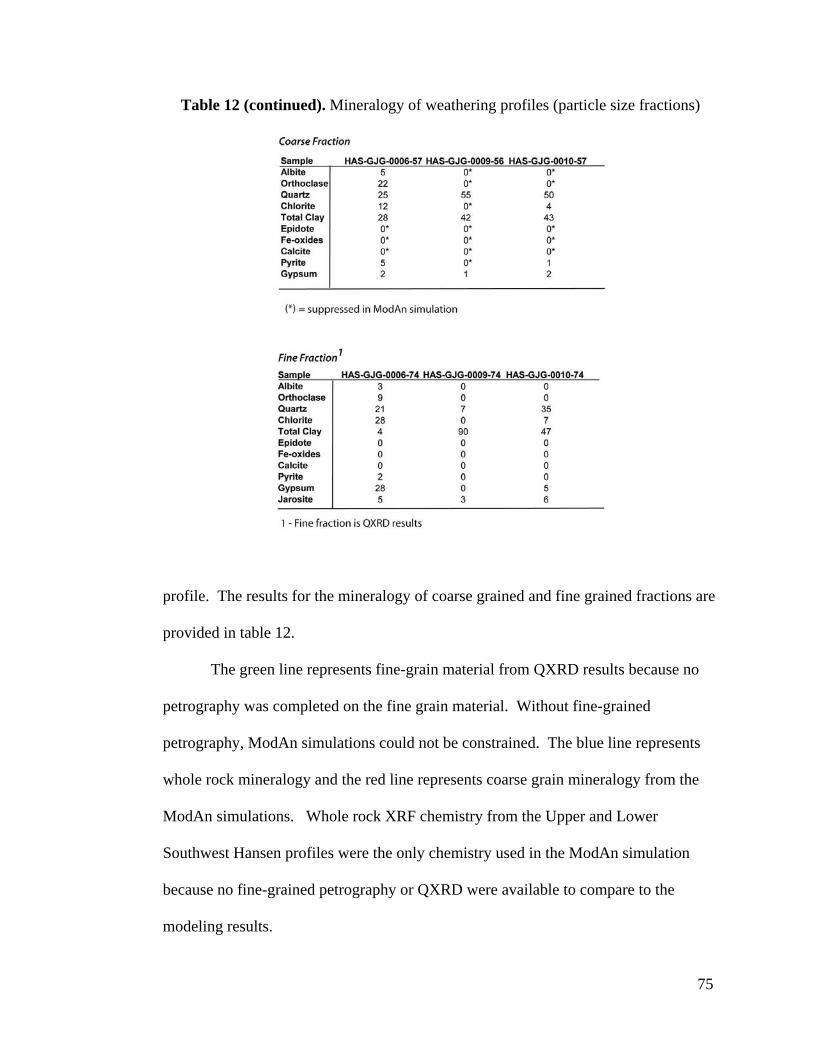
Table 12 (continued). Mineralogy of weathering profiles (particle size fractions)
profile. The results for the mineralogy of coarse grained and fine grained fractions are
provided in table 12.
The green line represents fine-grain material from QXRD results because no
petrography was completed on the fine grain material. Without fine-grained
petrography, ModAn simulations could not be constrained. The blue line represents
whole rock mineralogy and the red line represents coarse grain mineralogy from the
ModAn simulations. Whole rock XRF chemistry from the Upper and Lower
Southwest Hansen profiles were the only chemistry used in the ModAn simulation
because no fine-grained petrography or QXRD were available to compare to the
modeling results. 75

4.5.4.1 Hansen “Weathering Profile”
The changes in mineralogy through the Hansen weathering profile are
illustrated in Figure 22. For whole rock samples, quartz is the only mineral that
remains relatively unchanged, except in the top sample, in the profile. Chlorite and
Figure 22. Mineralogical changes of identified minerals vs. sample locations in the Hansen weathering profile. Shaded gray area represents QSP overprinting propylitic alteration and white area represents intense QSP alteration. Blue line = whole rock, Red line = >25 mm, Green line = <0.2 mm. Note: jarosite plot is from QXRD results; not all plots have same scale.
illite are inversely correlated and relate to hydrothermal alteration type. Other clay
minerals are relatively unchanged throughout the profile. Both of the feldspars, albite
and orthoclase, also decrease as the samples get closer to the intense QSP alteration
76

zones (“gray clay”). Pyrite decreases and gypsum, Fe-oxides, and jarosite increase
towards the top of the profile.
Comparison between the coarse and fine-grained material shows all minerals
are located in both size fractions, except jarosite. Silicate minerals and pyrite are
generally more abundant in the coarse grained material. The minerals associated with
sulfide oxidation (gypsum and jarosite) are more abundant in the finer-grained
material.
4.5.4.2 Upper Southwest Hansen “Weathering Profile”
The changes in mineralogy through the Upper Southwest Hansen weathering
profile are shown in Figure 23. Quartz increases upwards in the profile, except in the
ferricrete at the top of the profile. Chlorite decreases and illite increase towards the
top of the profile. Both chlorite and illite decrease in the top of the profile, which is a
ferricrete. Other clay minerals are relatively unchanged upwards in the profile.
Orthoclase and albite decrease towards the top of the alteration profile. Pyrite
decreases upwards in the profile, whereas gypsum and Fe-oxides increase towards the
top of the profile.
4.5.4.3 Lower Southwest Hansen “Weathering Profile”
The changes in mineralogy through the Upper Southwest Hansen weathering
profile are presented in Figure 24. This profile has a more complex alteration zonation
because there are two areas that display intense QSP alteration zones. Abundant
quartz, illite and pyrite are characteristic in these “gray clay” zones of intense QSP
77

alteration. Propylitic alteration zones are characterized by chlorite, with significantly
lesser amounts of quartz and illite. The feldspars decrease in the intensely altered QSP
zones and increase in the QSP overprinting propylitic zones. Pyrite decreases towards
the top, while gypsum and Fe-oxides generally increase towards the top.
Figure 23. Mineralogical changes of identified minerals vs. sample locations in the Upper Southwest Hansen weathering profile. Shaded gray area represents QSP overprinting propylitic alteration, white area represents intense QSP alteration, and brown area represents ferricrete material. Note: not all plots have same scale
78

Figure 24. Mineralogical changes of identified minerals vs. sample locations in the Lower Southwest Hansen weathering profile. Shaded gray area represents QSP overprinting propylitic alteration and white area represents intense QSP alteration. Note: not all plots have same scale for weight percents. 4.6 Stable Isotopes 4.6.1 Sulfides and sulfates
The overall reproducibility of δ18OSO4 values from this study range from 0.1 to
0.5‰, with the average difference in duplicates of ±0.18‰. Reproducibility of δ34S
isotopic values measured in this study differs by 0 to 0.5 ‰, with an average value of
±0.3‰. The δ34S (pyrite and gypsum) and δ18OSO4 values and errors from the stable
79

isotopic analyses are presented in Table 13. The final values are plotted on a δ34S vs.
δ18OSO4 diagram (Figure 25). The range of measured δ34S values for sulfate is -1.1 to
-5.7 ‰ and the range of δ18OSO4 of sulfate is -7.0 to 0.9 ‰. The range in measured
δ34S for pyrite is -6.6 to -1.0 ‰.
Figure 25. δ34S and δ18OSO4 diagram of sulfates and sulfides analyzed. Red squares and black X’s are from this study and the remaining data is from Campbell and Lueth (2008) (Appendix C).
4.6.2 Clays
The overall (sample preparation plus analysis) reproducibility of δ18O values
from this study range from 0.1 to 0.5‰, with the average difference in duplicates of
±0.13‰. Reproducibility of δD isotopic values of individual samples measured in this
study vary from 0 to 3 ‰, with an average value of ±1‰. The range of measured
values for clay δ18O is -0.3 to 4.6 ‰ and the range for δD is -65 to -95 ‰. The δ18O
80

and δD values and errors from the stable isotopic analyses are presented in Table 14.
The final values are plotted on a δ18O vs. δD diagram (figure 26).
Table 13. δ34S and δ18OSO4 results of sulfides and sulfates
81

Table 14. δ18O and δD isotopic values of clay minerals
Several global meteoric features are plotted on Figure 26 for reference and are
described below. The meteoric water line depicts the interdependence of H- and O-
isotope ratios in meteoric waters on a global scale (Hoefs, 2004), which was first
described by Craig (1961). Local meteoric waters may vary locally, but generally fall
on or near the meteoric water line.
The kaolinite line describes the isotopic composition of kaolinite forming at
20ºC in equilibrium with meteoric waters. This line is plotted using the fractionation
factors from equation 8 and 9 (below) (Sheppard and Gilg, 1996).
82

Hydrogen 1000 ln α kaolinite-water = -2.2 x 10⁻⁶ x T-2 – 7.7 (8)
Oxygen 1000 ln α kaolinite-water = 2.76 x 10⁻⁶ x T-2 – 6.75 (9)
The supergene/hypogene line describes the isotopic composition of kaolinite
forming in equilibrium with meteoric water at 35ºC. This line is termed the
supergene/hypogene line because 35ºC is the maximum temperature for kaolinite
forming at the earth’s surface. Samples plotting to the left of this line are termed
hypogene because these temperatures are representative of hydrothermal alteration
temperatures and not supergene weathering temperatures. The lines showing T=70°C,
100°C and 200°C describe the isotopic composition of a kaolinite forming at these
temperatures in equilibrium with meteoric waters.
Figure 26. δ18O vs. δD diagram of Questa clays. Sample points are larger than measured error.
83

5. DISSCUSION 5.1 Weathering profiles
A weathering profile consists of differentiated identifiable horizons that have
been chemically changed, with assistance from the physical disintegration of the
bedrock (Summerfield, 1991). There are typically four distinct zones recognized in a
classic weathering profile and include fresh bedrock, weathered material with
unweathered bedrock, a clay-rich horizon, and capped by soil (Summerfield, 1991).
These classic weathering profiles essentially consist of one original lithology and are
best developed in wet and humid climates with low erosional rates.
Weathering profiles collected within the alteration scars at Questa are more
complex than classic weathering profiles. They may represent multiple lithologies
overprinted by hydrothermal alteration, suggesting the mineralogy of each sample in
the weathering profile could have had different original mineral abundances. The area
is also rich in mineralization with abundant dikes and stocks that have intruded the
volcanic rocks. In addition, the rocks are pyrite rich, which when oxidized, create an
acidic environment. This acid environment can enhance the rates at which the rocks
chemically weather. However, the climate of the area is presently semi-arid and the
low annual precipitation would tend to inhibit chemical weathering. The mountainous
terrain allows for high erosion rates, which may quickly remove much of the chemical
weathering product.
The changes that are expected to occur upward as a consequence of weathering
within the alteration scar profiles included a particle size decrease, decreasing pyrite
concentrations, increasing sulfate concentrations, decreasing feldspar concentrations,
and increasing clay concentrations. These main features are seen within the alteration
84

scar profiles. However, the reasons for these changes are more complex than the
classic weathering model. The primary purpose of this study was to document any
mineralogical and geochemical changes in alteration scar profiles due to the effects of
physical and chemical weathering. The results can be used by the Questa Weathering
and Rock Pile Stability Project to predict future mineralogical changes in mined rock
piles.
5.2 Physical Weathering
Physical weathering appears active in the alteration scars with particle size
generally decreasing upward in each profile. Exceptions of particle size increases are
attributed to secondary Fe-oxide mineral formation (ferricrete). Mid-profile particle
size decreases appear related to the presence of hydrothermal “gray clay” layers. The
general decrease in particle size upwards would be expected from the physical
weathering of the material. However, particle size decrease could also be a function
of hydrothermal alteration, based on the presence of hydrothermal clay layers in the
profiles.
Figure 12 provides an example of how particle size decreases upwards in the
Hansen alteration scar profile. In this figure, the bottom three samples (HAS-GJG-
0006, HAS-GJG-0007, & HAS-GJG-0008) have a similar particle size and color. The
sample HAS-GJG-0007 has a larger particle size than the other two samples because it
has been recemented by gypsum filling fractures (Figure 27). The two samples at the
top (HAS-GJG-0009 & HAS-GJG-0010) are a finer particle size and grayish-white
color. This grain size decrease can be attributed to the present of an intense QSP
85

altered vein, which originally consisted of finer particle sizes because of the
hydrothermal alteration of various silicate minerals to clay minerals (Figure 20A).
Gyp
Gyp
G yp
Figure 27. Photomicrograph of HAS-GJG-0007 illustrating gypsum and Fe-oxide filled fractures at the base of the Hansen Profile. (Gyp = gypsum, Red Staining = Fe-oxides)
Figure 11 illustrates a similar trend of decreasing particle size, however, the
lower Southwest Hansen alteration scar profile is more complex. In this figure there
are “gray clay” layers located near the bottom (SWH-GJG-0010) and top of the profile
(SWH-GJG-0013). The samples that occur above and beneath SWH-GJG-0013 are
stained a whitish-gray color, indicating these samples have experienced partial QSP
alteration of the “gray clays”, also noted in thin section. This characteristic color
above and below SWH-GJG-0010 is not as apparent, possibly because this sample is a
86

vein in the bedrock. However, the decrease in particle size can readily be seen. This
is an indication that the particle size decrease in these portions of the alteration scar
profile may be due to the hydrothermal alteration of feldspar to clay minerals.
Figure 13 illustrates the upper Southwest Hansen alteration scar profile with a
more subtle particle size decrease. SWH-GJG-0022 is another sample that has
experienced the influence of QSP alteration; however, it appears that the intensity of
alteration may have been less because of the remnant brownish color and a larger
particle size compared to other “gray clay” layers. There is an accumulation of
gypsum at the top of the profile and veinlets of quartz (noted in petrography, Figure
20A), which could act as cements to hold the rock fragments together. The top sample
of this profile (SWH-GJG-0023) is a ferricrete, leading to the large particle sizes
associated with this sample. This profile appears to follow the expected simplified
weathering profile model of decreasing particle size towards the top (Figure 18A),
without much influence from hydrothermal alteration.
There are three possible causes of particle size decrease within the alteration
scar profiles: 1) As hydrothermal solutions were circulating through the rocks (~ 25
Ma), primary fracturing occurred and silicate minerals in the intense QSP altered
zones were altered to clay minerals, decreasing the particle size; 2) Fracturing in the
alteration scars is pervasive down to the microscopic level (Caine, 2003; Ludington et
al. 2004), allowing for fluids to be introduced and oxidize pyrite. The fluids entering
these fractures can create freeze thaw action and further disintegrate the rocks,
therefore, allowing more fluids to be introduced and oxidize pyrite; and 3) The
oxidation of pyrite, and subsequent reaction with calcite or Ca-bearing clays, can
87

cause the precipitation of gypsum in fractures, creating an accompanying volume
increase, resulting in further fragmentation. These different processes appear to have
worked together in the alteration scars to physically decrease grain size.
5.3 Chemical Weathering
Mineralogical analysis of the three alteration profiles has documented
variations in the concentrations of silicate minerals, pyrite, sulfates and clay minerals
(Figures 28-34). In general, pyrite decreases, while gypsum and jarosite increase
towards the top of each profile. Changes in the silicate mineralogy in the profiles
include, illite and total clay abundances increasing in and near the intense QSP
alteration, while chlorite, orthoclase and albite abundances decrease in and near the
zones of intense QSP alteration (Figures 32, 33, 34). Chlorite is found in higher
concentrations in the QSP overprinting propylitic alteration, while illite is more
dominant in the intense QSP altered zones. No systematic variation with other clays
minerals (kaolinite, smectite, and mixed-layer) is apparent upwards in the profiles. All
clay minerals present within the fine-grained fractions are also noted in the coarse
grained fractions (Figure 21). Feldspars and pyrite are more concentrated within the
coarse-grained fraction and sulfates and Fe-oxides are more abundant within the fine-
grained fraction.
5.3.1 Sulfide weathering
The oxidation of pyrite and precipitation of sulfate minerals appears to be the
predominant chemical weathering process active within the alteration scars. Figure 28
88

illustrates the mineralogical and geochemical changes, with respect to sulfide
mineralogy for the Hansen alteration scar profile. From the base to the top of the
profile, pyrite decreases, with increasing gypsum and jarosite. Gypsum concentrations
vary and are attributed to the potential open nature of the system, which allows sulfate
rich waters to percolate down through the profile and precipitate gypsum at the bottom
of the profile. This was documented in the field from abundant gypsum filled
fractures near the base of the profile (Figure 27).
Figure 28. Geochemical and mineralogical changes associated with sulfide weathering in the Hansen alteration scar profile. Gray shades = QSP overprinting propylitic, White shades = intense QSP
Fe-oxides have no systematic variation within the profile, but indicate that
oxidation of pyrite is occurring in or near the Hansen alteration scar profile. Paste pH
range from 2 to 3 upward in the profile, and documents the extremely low pH of the
environment. Acid Base Accounting from the profile indicates all samples in the
89

profile are net acid producing. The samples at the base of the profile have more acid
producing potential because they have seen less sulfide oxidation. This is reflected by
higher sulfide-sulfate ratios and more abundant sulfide at the base of the profile
(Figure 28).
Figure 29 illustrates the changes related to sulfide weathering within the lower
Southwest Hansen alteration scar profile. Pyrite generally decreases upwards in the
profile, however, the high pyrite concentration zones correspond with “gray clay”
layers. These layers are the finest grained of the samples in the profiles, so the lower
permeability of these zones may inhibit the oxidation of pyrite. Gypsum slowly
Figure 29. Geochemical and mineralogical changes associated with sulfide weathering in the lower Southwest Hansen alteration scar profile. Gray shades = QSP overprinting propylitic, White shades = intense QSP
90

decreases upwards in the profile, except near the base and at the top of the profile.
The base of the profile consists of a ferricrete like material, where the precipitation of
gypsum probably occurred from mixing of acidic runoff with Ca-bearing neutral
meteoric waters. Sulfide-sulfate ratios provide less convincing evidence of sulfide
oxidation upwards, but indicate that “gray clay” layers have abundant pyrite (Figure
29).
Acid Base Accounting provides documentation that most samples are acid
producing, however samples 4 (SWH-GJG-0011) and 7 (SWH-GJG-0014) contain
enough acid consuming minerals to buffer the acid created from pyrite oxidation.
Petrographic analysis of these samples indicates calcite in these samples, but they are
the only two samples noted from the entire study containing calcite. The paste pH of
these samples is low (2.17 & 2.46) indicating the calcite is not available for buffering
because of calcite occurring inside the rock fragments. These samples occur above the
“gray clay” layers in the profile. There is generally no change within the paste pH
upwards in the profile, but all samples document the low pH environment.
The geochemical and mineralogical changes associated with sulfide
weathering in the upper Southwest Hansen alteration scar profile are illustrated in
Figure 30. This profile represents the closest case to the expected mineralogical
changes of a classic weathering profile. Pyrite decreases, while gypsum and Fe-oxides
increases toward the top of the profile. The top sample of the profile is a ferricrete,
with high concentrations of Fe-oxides. Perhaps this ferricrete acts as a barrier for fluid
percolation through the profile, apparently preserving the gypsum near the top.
Sulfide-sulfate ratios agree with the mineralogical observations that there is more
91

abundant pyrite within the base of this profile (Figure 30). Acid Base Accounting
documents all samples are acid producing, with the bottom samples having the largest
Figure 30. Geochemical and mineralogical changes associated with sulfide weathering in the upper Southwest Hansen alteration scar profile. Gray shades = QSP overprinting propylitic, White shades = intense QSP, Brown Shades = ferricrete
potential to create acid. This also correlates with the mineralogical observations of
abundant pyrite in the base of the profile (Figure 30). Paste pH is essentially constant
upwards in the profile and is similar to other profiles reflecting the low pH
environment.
Variations in pyrite abundance through the profiles may be attributed to the
intensity of hydrothermal alteration or the oxidation of pyrite. However, the
abundance of pyrite appears less important than the weathering of pyrite from
oxidation. Based on petrographic analysis, pyrites near the base of the profiles appear
92

less weathered (i.e. euhedral, no oxide rims), while pyrite near the tops of the profiles
has experienced weathering (i.e. anhedral, oxide rims and trails, and gypsum rims).
5.3.2 δ34S & δ18OSO4 isotopes of sulfide weathering
The oxidation of pyrite to sulfate at low temperature seems to be a
unidirectional process with little to no fractionation. This often results in δ34SSO4
values being indistinguishable from those of the parent sulfide (Gavelin et al., 1960;
Field, 1966; Rye et al., 1992; and Seal et al., 2000). Stable isotope analysis (δ34S &
δ18OSO4) of pyrite and gypsum document sulfates formed within the alteration scars
under conditions consistent with a supergene environment (Figure 31).
On Figure 31, samples plotting in the upper right formed during a
hydrothermal event (Campbell and Lueth, 2008), probably in equilibrium with
magmatic water. The δ34S of sulfate minerals in equilibrium with magmatic sulfide
(ore sulfide box), at high temperatures, are heavier than that of the precipitating
sulfide. δ18OSO4 values in this quadrant are consistent with magmatic values of
oxygen-forming minerals (6-9‰).
The yellow squares represent modern values for sulfate from groundwater
from the Questa area. Samples plotting to the left of δ34S = 0 and δ18OSO4 <0, also
form in the supergene environment. The δ18OSO4 of these samples are closer in value
to modern sulfate oxygen values, so they are interpreted to have formed in the modern
weathering environment.
The analyses that plot to the left of δ34S = 0 and δ18OSO4 >0 are ancient
supergene in origin. These values reflect δ34S of related hydrothermal pyrites and
93

δ18OSO4 values reflect ancient climatic and environmental conditions during the time
of mineral formation.
Figure 31. δ34S and δ18OSO4 diagram of sulfates and sulfides analyzed. Red squares and black X’s are from this study and the remaining data is from Campbell and Lueth (2008) (Appendix C).
Alternatively, the variation in oxygen values may also represent the nature of
the supergene environment where the sulfates precipitated, either the vadose zone or
the saturated zone. Gypsum precipitating in the vadose zone would have a higher
contribution from atmospheric oxygen (δ18O = 23.5 ± 0.3 ‰) (Seal et al., 2000), and
water (δ18O = -12.4 ‰, Questa average), while samples precipitating in the saturated
zone, the oxygen isotope value would be directly from water. The resulting
94

environment of sulfate precipitation could also account for the variation seen within
the δ18OSO4.
Either of the explanations for the δ18OSO4 variations are plausible, however,
the results from the δ34S and δ18OSO4 analyses still indicate that all gypsums analyzed
from the alteration scars formed in the weathering environment, not in the hypogene
environment. This provides supporting evidence, along with mineralogical and
petrographic observations (Figure 28, 29, 30, & Appendix B), that the sulfide
weathering system has been active in the past and continues within the alteration scars.
5.3.3 Silicate weathering
The effects of silicate weathering are more difficult to determine. The changes
within silicate mineralogy (i.e. decreasing feldspar, increasing clay) are expected
changes resulting from the incongruent dissolution of feldspars, followed by the
precipitation of secondary clay minerals. However, the dominant clay types that have
been documented in the weathering profiles (chlorite and illite) appear to correspond
to the hydrothermal alteration types of each individual sample. Other clay minerals in
the profiles include kaolinite, smectite, and mixed layer clays, which are relatively
unchanged within each profile (Figures 32, 33, & 34) and between clast and matrix
fractions (Table 10 & Figure 21). These features suggest that no authigenic clay
formation has occurred in the profiles.
The silicate mineralogical changes in the Hansen alteration scar profile are
shown in Figure 32. Feldspars (albite and orthoclase) decrease and clays increase
95

upwards in the profile. Chlorite and feldspar are abundant in the QSP overprinting
propylitic alteration with little to no chlorite and feldspar in the intense QSP alteration
Figure 32. Silicate mineralogical changes in the Hansen alteration scar profile. Gray shades = QSP overprinting propylitic, White shades = intense QSP alteration
zones. Total clay abundances do not change in the QSP overprinting propylitic
alteration, but increase substantially in the intense QSP alteration. Illite increases
from the base into the intense QSP altered zone. This suggests the base of the profile
has seen the effects of QSP alteration, however, the intensity of the alteration was not
as great. There are no changes among other clay minerals upward in the profile
(Figure 22). The presence of large amounts of orthoclase in the andesite bedrock may
also represent an influence of potassic alteration near the base of the profile.
Figure 33 illustrates the changes in silicate mineralogy from the upper
Southwest Hansen profile. Total feldspars decrease from the base to the top of the
profile. The increase in feldspars at the top of the profile may be due to preservation
by cementation of unweathered fragments into a ferricrete. Petrographic analysis has
indicated both sub-angular to angular fragments in the matrix, suggesting the source
was near to the place of ferricrete formation. The increased feldspar, with no chlorite,
suggests that these rocks have either been QSP or advanced argillic altered.
96

Figure 33. Silicate mineralogical changes in the upper Southwest Hansen alteration scar profile. Gray shades = QSP overprinting propylitic, White shades = intense QSP, Brown Shades = ferricrete
Total clays increase upwards in the profile, with the greatest abundance located
in the QSP altered zone. The dominant clay type in this zone is illite, with little to no
change in the other clay minerals (Figure 23).
The changes within silicate mineralogy from the lower Southwest Hansen
profile are illustrated in Figure 34. In this profile there are two zones of intense QSP
alteration. Feldspar and chlorite are less abundant in the QSP alteration and more
abundant in the QSP overprinting propylitic alteration. Total clay abundances
increase upwards into each individual zone of intense QSP alteration. The dominant
clay mineral in these intense QSP altered zones is illite, with no systematic variation
with other clay minerals upwards in the profile (Figure 24). These two distinct zones
of intense QSP alteration provide convincing evidence that in these intense QSP
zones, the feldspars have been altered to clay minerals through hydrothermal
processes.
97

Figure 34. Silicate mineralogical changes in the lower Southwest Hansen alteration scar profile. Gray shades = QSP overprinting propylitic, White shades = intense QSP
The silicate mineralogy changes seen in the alteration scar profile are the
expected chemical weathering changes through a classic weathering profile.
However, because of hydrothermal alteration in the scars, the interpreted decrease in
the feldspars and increase clay abundances are best reconciled as being derived from
hypogene minerals during the hydrothermal alteration event.
5.3.4 Isocon Calculations
Using the isocon method (Grant, 1986), chemical changes between coarse and
fine portions of a sample were examined. Using the coarse sample as the basis for
comparison, chemical changes can be seen as the particle size decreases, keeping an
oxide constant (Figure 35). Constant TiO2 was used, as there is little change in the
XRF geochemistry between the coarse to fine particle fractions with respect to this
oxide. All three samples analyzed for the particle size splits show similar trends.
Relative to the coarse size fraction, there is an increase of Al2O3, FeO, CaO and P2O5
in the fine-grained fraction. Elemental oxides that decrease from the coarse to fine
98

Elemental Oxide Changes from Coarse to Fine Particles (HAS-GJG-0006)
-100
-50
0
50
100
150
200
SiO
2
TiO2
Al2O
3
FeO*
MnO
MgO
CaO
Na2
O
K2O
P2O
5
SO4
Per
cent
Gai
n (+
) or L
oss
(-)
Figure 35. Chemical variation diagrams using the isocon method for coarse to fine particle. Method uses constant TiO2 and percent gains and/or losses relative to the least weathered sample (coarse grained). Sample HAS-GJG-0006.
particles include Na2O, K2O, and perhaps SiO2. Using these changes in the elemental
oxides, in conjunction with mineralogy, chemical weathering can be documented
during the physical break up of the rock.
The sulfide weathering system appears is apparent, as there is an increase in
FeO CaO and SO4 between the coarse and fine fractions. Even though pyrite (FeO)
would be expected to decrease in the fines because of oxidation, there is an increase in
FeO due to the precipitation of Fe-oxides and jarosite. P2O5 has been documented in
microprobe analysis of goethite (N. Dunbar, personal comm.), possibly from the
dissolution of apatite. Increasing P2O5 is attributed to higher abundances of goethite,
which is consistent with increasing FeO. The increase in CaO and SO4 is attributed
99
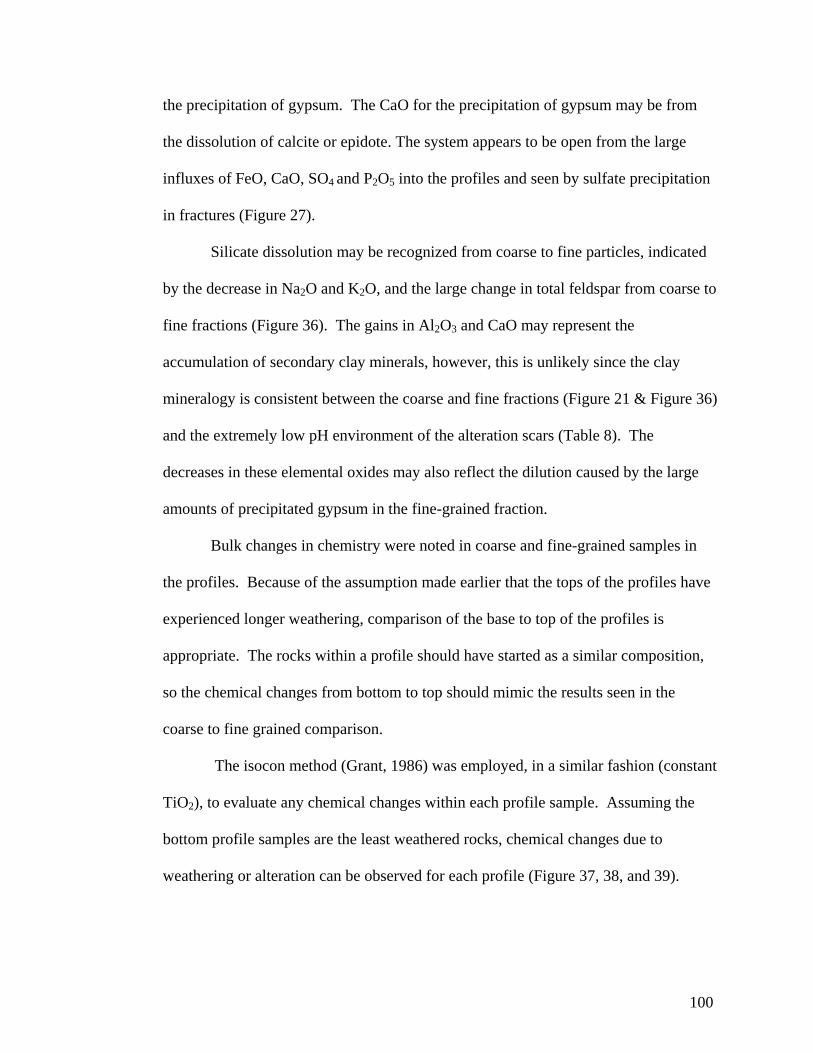
the precipitation of gypsum. The CaO for the precipitation of gypsum may be from
the dissolution of calcite or epidote. The system appears to be open from the large
influxes of FeO, CaO, SO4 and P2O5 into the profiles and seen by sulfate precipitation
in fractures (Figure 27).
Silicate dissolution may be recognized from coarse to fine particles, indicated
by the decrease in Na2O and K2O, and the large change in total feldspar from coarse to
fine fractions (Figure 36). The gains in Al2O3 and CaO may represent the
accumulation of secondary clay minerals, however, this is unlikely since the clay
mineralogy is consistent between the coarse and fine fractions (Figure 21 & Figure 36)
and the extremely low pH environment of the alteration scars (Table 8). The
decreases in these elemental oxides may also reflect the dilution caused by the large
amounts of precipitated gypsum in the fine-grained fraction.
Bulk changes in chemistry were noted in coarse and fine-grained samples in
the profiles. Because of the assumption made earlier that the tops of the profiles have
experienced longer weathering, comparison of the base to top of the profiles is
appropriate. The rocks within a profile should have started as a similar composition,
so the chemical changes from bottom to top should mimic the results seen in the
coarse to fine grained comparison.
The isocon method (Grant, 1986) was employed, in a similar fashion (constant
TiO2), to evaluate any chemical changes within each profile sample. Assuming the
bottom profile samples are the least weathered rocks, chemical changes due to
weathering or alteration can be observed for each profile (Figure 37, 38, and 39).
100

Mineralogical Changes from Coarse to Fine (HAS-GJG-0006)
0
5
10
15
20
25
30
35
Total Feldspar Total Phyllosilicates
Wei
ght %
from
QX
RD
Fines Coarse
Figure 36. Histogram of QXRD mineralogy for total feldspar and total phyllosilicates between coarse and fine fractions (HAS-GJG-0006). Total feldspars have large decrease between particle sizes, while phylliosilcates have a slight to no change.
Isocon calculations for the upper Southwest Hansen alteration scar profile are
illustrated in Figure 37. The two elemental oxides that show the least amount of
change are Al2O3, and SiO2. This indicates that there is little to no change in clay or
quartz abundances through the profile. The high losses in FeO, MnO, and MgO could
correspond to weathering or dissolution of epidote, chlorite and pyrite. The large
decrease in Na2O may represent the dissolution of albite upwards in the profile. The
large increase in CaO correlates to the precipitation of gypsum upwards in the profile
(Figure 30), while the increase in K2O could either represent the precipitation of
jarosite near the top, or an increase in illite near the QSP alteration zone. The changes
within the geochemistry of this profile can readily be correlated to the changes in the
101

Elemental Oxide Changes - Upper Southwest Hansen Profile
-100
-80
-60
-40
-20
0
20
40
60
80
100
SiO
2
TiO
2
Al2
O3
FeO
*
MnO
MgO
CaO
Na2
O
K2O
P2O
5
LOI
Per
cent
Gai
n (+
) or L
oss
(-)
SWH-GJG-0021 SWH-GJG-0022
Figure 37. Chemical variation diagrams of the upper Southwest Hansen alteration scar profile using the isocon method. This method uses constant TiO2 and percent gains and/or losses are relative to the least weathered sample (bottom of profile).
mineralogy (Figure 23). This profile is the best representative of the classic
weathering model, probably because the profile appears to represent one lithology
with less internal variation from hydrothermal alteration.
Figure 38 represents the geochemical changes in the Hansen alteration profile
using constant TiO2 isocon calculations. Two distinct groups of isocon variations can
be recognized and appear to best correlate to hydrothermal alteration type. To
illustrate, samples shaded with green represent quartz-sericite-pyrite (QSP) alteration
102

overprinting propylitic alteration and samples shaded in gray represent intense quartz-
sericite-pyrite (QSP) alteration. Increases in SiO2 and Al2O3 correlate to the intense
QSP alteration within the profile (HAS-GJG-0009 and HAS-GJG-0010). The bottom
of the profile has little to no change in Al2O3, indicating no change in clays
abundances. The intense QSP alteration has large increases in both K2O and Al2O3
correlating to increases in the abundance of illite.
Elemental Oxide Changes - Hansen Profile
-100
-80
-60
-40
-20
0
20
40
60
80
100
SiO
2
TiO
2
Al2
O3
FeO
*
MnO
MgO
CaO
Na2
O
K2O
P2O
5
LOI (
%)
Per
cent
Gai
n (+
) or L
oss
(-)
HAS-GJG-0007 HAS-GJG-0008 HAS-GJG-0009 HAS-GJG-0010
Figure 38. Chemical variation diagrams of the Hansen alteration scar profile using the isocon method. This method uses constant TiO2 and percent gains and/or losses are relative to the least weathered sample (bottom of profile).
The increase in FeO near the base of the profile is consistent with the presence
of chlorite or Fe-oxides (Figure 22). The top of the profile has a large decrease in
FeO, which is attributed to the absence of chlorite or the oxidation of pyrite. Constant
103

MnO and MgO at the base of the profile indicates chlorite and epidote (if present) are
not being dissolved, however, at the top of the profile, there are large changes in the
MnO and MgO suggesting chlorite and epidote have dissolved or altered during
intense QSP alteration.
The large CaO decrease at the top of the profile is attributed to sulfate being
transported away from these areas (Figure 28) and precipitating in the fractures near
the base (Figure 27). The decrease in Na2O may represent the dissolution of albite.
This profile provides excellent evidence for two distinct hydrothermal alteration types
within one lithology and has limited application to weathering.
The isocon calculations for changes in elemental oxides from the lower
Southwest Hansen profile are located in Figure 39. The elemental oxide changes
within this profile are difficult to differentiate. The only elemental oxides that have
identical direction changes for the QSP overprinting propylitic alteration and intense
QSP alteration are Al2O3, and SiO2. This would suggest there is a decrease in clays
upwards in the profile, however mineralogical analysis has shown that clays do
increase upwards in the profiles (Figure 24).
The isocon calculations for this profile do not reflect the changes in elemental
oxides related to alteration or features noted for weathering. An explanation for this
discrepancy is that this large profile has a greater variation in original lithology.
Mapping of the lower Southwest Hansen alteration scar has indicated xenoliths of
andesite located within the intrusive quartz latite porphyry (Figure 40). This
observation suggests proximity to the roof of this sill where abundant andesite
xenoliths were trapped in the magma as it cooled.
104

Elemental Oxide Changes - Lower Southwest Hansen Profile
-100
-80
-60
-40
-20
0
20
40
60
80
100
SiO
2
TiO
2
Al2
O3
FeO
*
MnO
MgO
CaO
Na2
O
K2O
P2O
5
LOI (
%)
Per
cent
Gai
n (+
) or L
oss
(-)
SWH-GJG-0009 SWH-GJG-0010 SWH-GJG-0011 SWH-GJG-0012SWH-GJG-0013 SWH-GJG-0014
Figure 39. Chemical variation diagrams of the lower Southwest Hansen alteration scar profile using the isocon method. This method uses constant TiO2 and percent gains and/or losses are relative to the least weathered sample (bottom of profile).
Figure 40. Observation of andesite xenolith located with the quartz latite porphyry from the lower Southwest Hansen alteration scar.
105

Isocon calculations provide insight into the different hydrothermal alteration
assemblages and the mineralogy changes associated with elemental oxide changes in
each profile. In documenting the different types of alteration within a profile,
mineralogical changes associated with supergene weathering or hydrothermal
alteration can be distinguished. The upper Southwest Hansen profile documents
weathering features with subtle hydrothermal alterations, the Hansen profile indicates
hydrothermal alteration types with subtle weathering features, and the lower
Southwest Hansen profile provides alteration types and multi-lithology, with subtle
weathering features.
5.3.5 Clay Isotopes
The origin of the clay minerals is crucial to identifying the extent of
incongruent silicate weathering. The results from the stable isotope analysis of clay
minerals analyzed in this study plot well within the hydrothermal field, indicating that
they did not form from supergene weathering (Figure 26). The isotopic analysis
results were plotted on a compilation diagram modified from Sheppard and Gilg
(1996) (Figure 41). Questa clays plot firmly within the values of hydrothermal clay
minerals defined by previous studies of clays from various environments.
Although the alteration scar clay samples plot firmly in the hydrothermal field,
there is some minor scatted in the data, mostly in δ18O, with slight to no change in δD
(Figure 26). This scatter could be caused by a mixture of hydrothermal and
weathering clays by variable contamination with other oxygen bearing minerals and or
clays formed at slightly different temperatures in the scars.
106

Figure 41. Compilation δ18O vs. δD diagram of this study and previous clay studies. The clays from this study include kaolinite, illite, chlorite, and smectite (modified from Sheppard and Gilg, 1996).
5.3.5.1 Quartz Contamination
A possible cause for the weak positive variation in δ18O values in the Questa
clay samples is by variable contamination with quartz. Quartz was not removed from
the samples by the various chemical treatments. Quartz in the sample should either be
igneous magmatic values (6 to 9 ‰), or local hydrothermal quartz (7-8 ‰ for Questa
mineralization (A. Rowe, personal communication).
The mineralogically most pure illite sample (HAS-GJG-0009) has the lightest
δ18O of the clays. Because igneous or local hydrothermal quartz is isotopically
107

heavier than the clays, contamination by quartz would increase the δ18O of the
samples, moving its composition towards the kaolinite line (Figure 26).
Using the post-chemical treatment XRD patterns, it is possible to determine the
relative amount of quartz contained within each sample. Quartz X-Ray diffraction
intensities (2θ = 20.8) were divided by the illite intensities (2θ = 17.87) to provide a
ratio that is comparable between samples. These samples were plotted against the
δ18O values of the samples to determine the effect of quartz contamination (Figure 42).
Figure 42. X-ray diffraction quartz intensity/illite intensity vs. δ18O of Questa clays. Notice a slight positive correlation.
Figure 42 suggests some effect of quartz with the shift in heavier δ18O (≥ 0 ‰
values) of the clays. The variation in the δ18O of the clay samples appears more
complex than just quartz contamination and may also be affected by the hydrothermal
alteration history of each sample, discussed below.
108

5.3.5.2 Propylitic vs. Quartz-Sericite-Pyrite (QSP) Alteration
The two predominant alteration types present in the Questa mining district
alteration scars that result in hypogene clay formation are propylitic and QSP. These
different alteration types are thought to have formed at different temperatures and will
precipitate clay minerals of differing type and isotopic composition. Although we do
not have a direct geothermometer for the two types of alteration, it is likely the QSP
alteration occurs at higher temperatures than propylitic because it is an interior
alteration shell at Questa (Ludington et al., 2004) and at other deposits (Lowell and
Gilbert, 1970; Stefanini and Williams-Jones, 1996).
Scar samples were plotted using the different alteration suites to determine any
correlation between QSP (quartz contamination) and propylitic (quartz and/or chlorite
contamination) alteration. Because of the different formation temperatures of these
alteration suites, it may be possible that heavier δ18O values are a function of the
alteration type and lower temperature (greater fractionation).
5.3.5.3 Effect of alteration type on δ18O
One of the geologic factors critical to the formation of an alteration scar is the
pyrite content of the rock (> 1%) (Meyer and Leonardson, 1990). Pyrite present in the
Questa mining district is hydrothermal in origin, commonly associated with quartz-
sericite-pyrite (QSP) alteration (Campbell and Lueth, 2008). Petrographic analysis of
the rocks within the Southwest Hansen and Hansen alteration scars indicate the
samples have either been intensely QSP altered or a QSP overprint on older propylitic
alteration.
109

Carefully considering the two types of alterations present, it is possible to
separate oxygen-bearing contamination minerals that would affect δ18O values present
in the alteration suites. Quartz is the major oxygen-bearing mineral that could affect
the δ18O values of the intensely QSP altered rocks, while quartz and/or chlorite may
affect the δ18O values of the QSP overprint on propylitic alteration.
Scatter plots of alteration minerals vs. δ18O diagrams (Figure 43 & 44) indicate
that when quartz and/or chlorite are present, as seen by the larger quartz and chlorite
intensities, the more positive the δ18O value of the sample. The contamination from
quartz and chlorite shifts the δ18O values of the samples to the right, closer towards the
kaolinite line (Figure 26).
Figure 43. X-ray diffraction intensities vs. δ18O of Questa clays to determine quartz contamination in intensely QSP altered scar rocks.
110

Figure 44. X-ray diffraction intensities (Chlorite & Quartz) vs. δ18O of Questa clays to determine quartz and chlorite contamination in QSP>Prop altered scar rocks
Samples from the Goat Hill North rock pile were also examined in the study to
determine any similarities or differences between the scars and rock piles. Half of the
analyzed Goat Hill North rock pile samples correlate with the observation that quartz
and chlorite contaminate the clay samples resulting in heavier δ18O values (Figure 45).
The other half of the Goat Hill North samples, show enrichment, with quartz and
chlorite apparently having little to no affect on the δ18O of the clay.
Rocks dumped in the Goat Hill North rock pile were mined from high above
the ore body and could contain more variable QSP, propylitic and/or advanced argillic
alteration. The alteration of the scar samples, within a single sample, is more
homogeneous, where as the rock pile may potentially represent a heterogeneous
mechanical mix of different alteration types. A possible explanation for the half of the
rock pile samples that do show enrichment without contamination, is these samples
111

Figure 45. X-ray diffraction intensities (Chlorite & Quartz) vs. δ18O of Questa clays to determine quartz and chlorite contamination in all samples.
may contain rhyolite, which was more affected by advanced argillic alteration. This
alteration occurs at lower temperatures and is more distal from the magmatic
hydrothermal source. An alternative explanation is that another mineral (not
identified) may be contaminating the sample, causing a slightly heavier δ18O.
Detailed analysis of the post-chemical treatment XRD diffraction patterns
resulted in the observation that the Goat Hill North rock piles have greater amounts of
smectite, minimal amounts of quartz, little to no chlorite, suggesting a preponderance
of a different alteration type, possibly advanced argillic alteration. On an X-Y scatter
112

plot of smectite intensity divided by illite intensity vs. δ18O of the samples, there was
no correlation between the amount of smectite and heavier δ18O. Therefore, it appears
as though smectite is not a contaminating mineral like quartz and chlorite, but it is
noted to be present in significant abundance in the rock piles.
The rock pile outliers, half of the samples without evidence of contamination,
show a variation in δ18O of approximately 1.3‰. The heavier δ18O does not correlate
with the quartz and chlorite contamination, so an alternative explanation other than
contamination by isotopically heavy minerals needs to be addressed.
The samples from the Goat Hill North rock pile were located above the ore
body and may contain different alteration types (propylitic, advanced argillic). The
outliers have the heaviest δ18O of all the samples analyzed, and based on geologic
context, may have formed at the lowest temperatures, farther above the heat source.
However, it may be possible for minimal amounts of weathering clay to be present,
causing the shift in δ18O.
It is possible that these outliers have heavier δ18O values based on two
possible factors: 1) the temperature of clay formation, or 2) the presence of minimal
weathering clays causing the δ18O shift. If the cause for this variation is due to the
latter hypothesis, a relative amount of weathered material can be estimated by using a
lever rule with the lightest (and highest temperature) illite as one end member and a
clay on the kaolinite line as the other (Figure 46).
Employing this methodology, approximately 30% of the clay in the heaviest
samples could be due to weathering. The inability to recognize a discrete authigenic
113

clay by petrographic or XRD analysis diminishes the potential for the latter hypothesis
to apply.
Figure 46. δ18O vs. δD diagram of Questa clays showing estimation of possible amount of clay in heavy δ18O samples
5.4 Relative Role of Physical and Chemical weathering
The results from this study have documented that both physical and chemical
weathering of material is active in the alteration scars. The majority of the
mineralogical evidence for chemical weathering is noted in the sulfide weathering
system (pyrite-calcite-gypsum). However, review of surface and ground water data
collected by the USGS (Nordstrom et al., 2005) shows abundant dissolved aluminum
and silicon, suggesting significant dissolution of silicate minerals. This surface and
114

groundwater data is consistent with silicate mineralogical and geochemical changes
seen within the alteration scar profiles. Thus the chemical dissolution of silicate
minerals is active, but based on isotopic data, there is no supporting evidence for the
formation of secondary clay minerals. The low paste pH values of soils in the profiles
(< 3), coupled with groundwater data, indicate the active congruent dissolution of
silicates, which precludes the precipitation of clay (Figure 47) (Krauskopf and Bird,
1995). These low pH values are independent of rock type or alteration type because
the rocks in the Questa area are sulfide-rich, which will cause the drop in pH
regardless of rock type.
Figure 47. Phase diagram for the solubility of kaolinite. Gold bar illustrates measured paste pHs from samples in alteration scar profiles. Black circle represents calculated log m al total from Hansen water chemistry from Nordstrom et al., 2005. At pH’s <3, kaolinite (and many other clays) dissolves (from Krauskopf and Bird, 1995).
115

The major implication for the dissolution of silicate minerals is the potential
for a volume reduction. The resulting volume decrease could affect the overall
structure of the rocks and/or rock piles. This volume change has not been quantified
in this study, but could have an impact on the potential stability of the rock piles, at
least on geological time scales. The active sulfide weathering system has the potential
to precipitate gypsum, jarosite, and/or Fe-oxides that could potential balance the
volume changes suggested by the dissolution of silicates. These minerals precipitating
from the sulfide weathering system could also act as cementing agent to strengthen the
rocks in the area.
Ground preparation for physical weathering of materials in the alteration scar
began with hydrothermal alteration. Initial hydrothermal alteration of the rocks
caused intense fracturing of the rocks at Questa. This fracturing allows for physical
weathering to occur by freeze-thaw action. As the rock becomes fractured, water and
air are introduced and begin the oxidation of pyrite, which creates acid and abundant
sulfate in solution.
The precipitation of gypsum creates a potential volume increase and causes the
rock to become even more fractured, allowing for the oxidation of more pyrite.
Gypsum filled fractures has been documented in the field and are abundant in the base
of the Hansen profile (Figure 26). As the pyrite becomes oxidized, Fe and O can bond
to form oxides on the surfaces of mineral grains. Oxides forming on mineral grains
can also inhibit the dissolution of silicate minerals as the oxides act as a barrier from
water and oxygen. The formation of ferricrete material at the base and/or the tops of
profiles can also inhibit the dissolution of silicate minerals.
116

The accumulation of gypsum at the top or bottom of the profiles gives insight
into whether the system is open or closed. The upper Southwest Hansen alteration
profile has an accumulation of sulfates near the top of the profile. This profile is
capped by a ferricrete, which may prevent the infiltration of water at the top of the
profile, inhibiting gypsum dissolution and transport of sulfate in solution. The other
two profiles have an accumulation of sulfates at the bottom because waters can
transport the sulfate in solution. The decrease in gypsum upwards in the profile
suggests that sulfates rich solutions are percolating through the profile allowing for
precipitation near the base of the profile. Precipitation of these sulfates and oxides
occurs as the acid waters encounter neural pH waters from rain events and infiltrating
ground waters.
Physical weathering, coupled with chemical weathering of the sulfide
weathering system, are the dominant active weathering processes within the alteration
scars. As the rocks are physical broken apart, water and air are introduced into the
material to allow for the oxidation of pyrite, followed by the precipitation of gypsum
and jarosite. With the low amounts of acid consuming minerals remaining in the
alterations scars, these weathering processes will continue to work together until the
remaining pyrite has been oxidized from the alteration scar material.
A weathering index was created by the Questa Weathering and Rock Pile
Stability team to determine the intensity of weathering that has occurred, or will occur,
in the rocks within the rock piles and the alteration scars. This weathering index has
been developed largely impart due to this study, with the entire weathering index
117

118
based solely on the sulfide weathering system because there are no secondary mineral
products to document the extent of weathering in the silicate weathering system.
The system uses the factors of sulfide and calcite abundance, along with
sulfide to sulfate ratios to assign a weathering number between 1 and 7 (1 -
unweathered & 7 - most weathered) (V. McLemore, written communication). The
alteration scars have been assigned weathering index numbers, based on the criteria,
between five and seven. These values indicate alteration scar rocks are near the most
weathered end of the spectrum, which correlates well with the documented time the
alteration scars have been weathering in place.

6. CONCLUSIONS 6.1 Conclusions
Determination of quantitative mineralogy of rocks with these extreme
hydrothermal alteration assemblages can be difficult. The application of quantitative
X-Ray diffraction, petrography, and the ModAn mineralogical modeling program
allowed for the accurate determination of mineralogical changes. The three combined
methods provided the most accurate percentage of mineralogical abundances to aid in
the determination of the true mineralogical changes within the alteration scar profiles.
Isocon calculations have proven useful in this study to determine geochemical
trends seen within the alteration scars profiles. The method was useful in determining
weathering affects, hydrothermal alterations and lithologic variation signatures in the
profiles.
Physical and chemical weathering has occurred in the natural alteration scars
studied for at least the last 300,000 years (Lueth et al, 2006). For this time period,
there is documented evidence for both physical and chemical weathering. The
dominant chemical weathering system is the oxidation of pyrite, dissolution of calcite,
leading to the precipitation of both sulfates and Fe-oxides.
The isotopic compositions of sulfates and sulfides indicate that all sulfate
minerals formed in the alteration scars by weathering. The lack of calcite remaining in
the alteration scars indicates that there is not enough acid consuming mineral capacity
to buffer the oxidizing pyrite. The oxidation of pyrite will continue in the alteration
scars until the remaining pyrite has been depleted.
In terms of silicate mineral changes, the sampled “weathering profiles” could
better represent “alteration profiles.” Intense QSP alteration zones are associated with
119

little to no feldspars, indicating that hydrothermal solutions altered feldspars into clay
minerals. These clay types, along with stable isotope analysis, show no evidence of
new clays being formed in the alterations scars. Weathering of silicate minerals in this
environment (acidic) was anticipated to precipitate clay minerals, however, no
evidence was documented for the formation of secondary clay minerals. However,
congruent dissolution of silicates is indicated in the scars based on low soil pH and
drainage water geochemistry. No significant evidence for chemical weathering of
silicate minerals is present in these alterations scars other than mineral dissolution
under low pH conditions
Physical weathering appears active in the alteration scars. Possible
mechanisms for physical weathering include: 1) initial grain size reduction by
hydrothermal alteration, 2) freeze-thaw action, and 3) precipitation of gypsum. These
processes can enhance the physical break and liberation of minerals from the rock;
however, hydrothermal alteration is the only process that will not contribute in the
future. As these processes occur, the alteration scars become finer grained and allow
for the introduction of fluids to further chemically weather the sulfide weathering
system.
The conclusions from this study provide important insights in to the future
mineralogical changes expected in the rock pile over geological time scales. In
particular, the dissolution of silicate minerals will have to be considered for particular
zones or over the entire volume of the rock pile. This decrease in volume potential
could be offset due to the volume increase from the precipitation of sulfates and Fe-
oxides. These minerals have the potential to act as cementing agents (noted in the
120

scars as ferricrete or gypsum veins), which could potentially make the rock piles
stronger as weathering progresses. The volume change has not been quantified in this
study, but could have an impact on the geotechnical evaluation of the stability of the
rock piles over the next 1,000 years.
6.2 Recommendations
This study has provided an excellent basis for predicting the possible
mineralogical changes that are expected to occur within the Chevron Mining
Incorporated (CMI) rock piles at the Questa mine. There is potential for future work
of these alteration scars to document other mineralogical and geochemical changes not
noted within this study. Potential future work includes quantifying the potential
volume decrease due to weathering, documenting the dissolution of silicate minerals
in these samples and QXRD of all alteration scar samples.
Density measurements within the alteration scars could provide a data set that
would help to quantify the geochemical changes associated with the volume decrease
using the isocon method. Using SEM (Scanning Electron Microprobe) images,
documentation of silicate dissolution may be possible by looking for etch pits,
dissolution along grain boundaries and dissolution along cleavage planes. These
images would help verify the mineralogical and groundwater data evidence for the
dissolution of silicate minerals. Completing QXRD on all the profile samples would
better constrain mineralogy from the ModAn modeling for all profiles within this
study.
121

REFERENCES
Blum, A.E. and Stillings, L.L., (1995); Feldspar dissolution rates: in Reviews in Mineralogy, v. 31, Chemical Weathering Rates of Silicate Minerals, eds. White and Brantley, p. 291-351
Borthwick, J., and Harmon, R.S., (1982); A note regarding ClF3 as an alternative to BrF5 for oxygen isotope analysis: Geochimica et Cosmochimica Acta, v. 46, p. 1665-1668
Caine, J.S., (2003); Questa baseline and pre-mining groundwater quality investigation
6: Preliminary brittle structural geologic data, Questa Mining District, southern Sangre de Cristo Mountains, New Mexico: USGS open-file report 03-280, 7 p.
Campbell, A.R. and Lueth, V.W., (2008); Isotopic and textural discrimination between
hypogene, ancient supergene, and modern sulfates at the Questa Mine, New Mexico: Applied Geochemistry, v. 23, p. 308-319.
Chapin, C.E., (1979); Evolution of the Rio Grande Rift: A summary, in Riecker, R.E.,
ed, Rio Grande rift Tectonics and magmatism, Washington D.C., American Geophysical Union, p. 1-5
Clark, K.F., and Read, C.B., (1972); Geology and ore deposits of Eagle Nest area:
New Mexico Bureau of Mines and Mineral Resources, Bulletin 94, 152 p. Craig, H., (1961); Isotopic Variations in Meteoric Waters; Science, v. 133, p. 1702-
1703 Donahue, K. M., Dunbar, N. W., and McLemore, V. T., (2007); Origins of clay
minerals in the Molycorp Mine Goathill North Rock pile, Questa NM, Society of Mining, Metallurgy and Exploration Annual Convention, Denver, Feb 2007.
Donahue, K. M., Dunbar, N.W, Heizler, L.L and McLemore, V.T., (submitted, 2008);
Origins of clay minerals in the Goathill North Rock Pile, Questa Mine, Taos County, New Mexico: Applied Clay Science, 13 p.
Field, Cyrus W., (1966); Sulfur isotopic method for discriminating between sulfates of
hypogene and supergene origin: Economic Geology and the Bulletin of the Society of Economic Geologists 61, no. 8, p. 1428-1435
Gavelin, S., Parwel, A., Ryhage, R., (1960); Sulfur isotope fractionation in sulfide
mineralization: Economic Geology and the Bulletin of the Society of Economic Geologists 55, no. 3, p. 510-530
Garrels, R.M. and Thompson, M.E., (1960); Oxidation of pyrite by iron sulfate
solutions: American Journal of Science, 258-A, p. 57-67
122

Gilg, H.A., Girard, J.P., and Sheppard, S.M.F., (2004); Handbook of Stable Isotope Techniques, Volume 1; P.A. de Groot (editor), Elsevier B.V., New York, New York, 1248 p.
Grant, J.A., (1986); The isocon diagram---A simple solution to Gresens’ equation for
metasomatic alteration: Economic Geology, v. 81, n. 8, p. 1976-1982 Hall, J. S., (2004); “New Mexico Bureau of Mines and Mineral Resource’s
Clay Laboratory Manual”. Unpublished New Mexico Bureau of Geology and Mineral Resources report.
Hashimoto, I. and Jackson, M.L., (1960); Rapid Dissolution of Allophane and Kaolinite-Halloysite after Dehydration; 7th National Conference on Clays and Clay Minerals, p. 102-113
Hoefs, J.H., (2004); Stable Isotope Geochemistry; Fifth and Updated Version, p.36,
Springer, New York, New York, 206 p. Ishihara, S., (1967); Molybdenum mineralization at the Questa mine, New Mexico,
U.S.A.: Geological Survey of Japan, Report 218, 68 p. Krauskopf, K. B. and Bird, D. K., (1995); Introduction to Geochemistry (3rd ed.),
McGraw-Hill, Inc., New York, 647 p. Lawson, R.T., Josick Comarmond, M.-C., Geetha Rajaratnam, and Brown, P.L.,
(2005); The kinetics of the dissolution of chlorite as a function of pH and at 25° C: Geochimica et Cosmochimica Acta, v. 69, p. 1687-1699.
Lipman, P.W., (1983); The Miocene Questa caldera, northern New Mexico; relation to
batholith emplacement and association of molybdenum mineralization: Wheat Ridge, Colo., Proceedings of the Denver Region Exploration Geologists Society Symposium: The genesis of Rocky Mountain Ore deposits; changes with time and tectonics, p. 133-147
Lipman, P.W. and Reed, J.C., Jr., (1989); Geologic map of the Latir volcanic field and
adjacent areas, Northern New Mexico: U.S. Geological Survey, Miscellaneous Investigations Map I-1907, 1:48,000
Livo, E.K and Clark, R.N, (2002); Mapped minerals at Questa, New Mexico, using
Airborne Visible-Infrared Imaging Spectrometer (AVIRIS) data – Preliminary report: First quarterly report of the U.S. Geological Survey investigation of the Red River valley basin, New Mexico, November 13, 2001, Open-File report 02-0026, 13 p.
Loucks, T.A., Phillips, J.S., and Newell, R.A., (1977); Exploration potential of the
Questa East area: unpublished report for the Kennecott Copper Corporation
123

Lowell J.D. and Gilbert, J.M., (1970); Lateral and vertical alteration mineral zoning in
porphyry ore deposits; Economic Geology, v. 65, p. 373-408 Ludington, S., Plumlee, G.S., Caine, J.S., Bove, D., Halloway, J., amd Livo, E.K.,
(2004); Questa baseline and pre-mining groundwater quality investigation. 10. Geologic influences on ground and surface waters in the lower Red River watershed, New Mexico: U.S. Geological Survey Scientific Investigations Report 2004-5245, 45 p.
Lueth, V.W., Campbell, A.R., and Peters, L.M., (2006); Final report (Phase I) on the
geochronological (40Ar/39Ar) dating of jarosite and alunite samples from the Red River area alteration scars and the Questa Mine: The timing of alteration scar formation and weathering: Questa Rock Pile Weathering and Stability Project, Unpublished report, 18 p.
Martineau, M.P., Heinemeyer, G.R., Craig, S.D. and McAndrews, K.P., (1977);
Geological Report, Questa Project, 1975-1977, Questa Molybdenum Company, unpublished report, 161 p.
McKibben, M.A. and Barnes, H.L., (1986); Oxidation of pyrite in low temperature
acidic solutions; rate laws and surface textures: Geochimica et Cosmochimica Acta 50, no. 7, p. 1509-1520
McLemore, V.T., Lueth, V.W. and Walker, B.M., (2004); Alteration scars in the Red
River valley, Taos County, New Mexico: New Mexico Geological Society Guidebook, v. 55, p. 19
Mehra, O.P. and Jackson, M.L., (1960); Iron oxide Removal from Soils and Clays by
a Dithionite-Citrate System Buffered with Sodium Bicarbonate; 7th National Conference on Clays and Clay Minerals, p. 317-337
Meyer, J.W., and Foland, K.A., (1991); Magmatic-tectonic interaction during early
Rio Grande rift extension at Questa, New Mexico: Geological Society of America Bulletin, v. 103, p. 993-100
Meyer, J.W., (1990); Volcanic, plutonic, tectonic and hydrothermal history of the
southern Questa caldera, New Mexico: University of California at Santa Barbara, unpub. Ph.D. dissertation, 287p.
Meyer, J. and Leonardson, R., (1990); Tectonic, Hydrothermal, and Geomorphic
controls on Alteration Scar Formation near Questa, New Mexico: New Mexico Geological Society Guide Book, 41st Field Conference, Southern Sangre de Cristo Mountains, New Mexico, p. 417-422
124

Morgan, P., Seager, W.R., and Golombek, M.P., (1986); Cenezoic thermal, mechanical and tectonic evolution of the Rio Grande rift: Journal of Geophysical Research, v. 91, p. 6263-6276
Nordstrom, D.K., (1982); Aqueous pyrite oxidation and the consequent formation of
secondary iron minerals: Acid sulfate weathering; proceedings of a symposium SSSA Special Publication 10, p. 37-56
Nordstrom, D.K., McClesky, R.B., Hunt, A.G., and Naus, C.A., (2005); Questa
baseline and pre-mining groundwater quality investigation, 14. Interpretation of ground-water geochemistry in catchments other that the straight creek catchment, Red River Valley, Taos County, New Mexico, 2002-2003, USGS Scientific Investiagtions Report 2005-5050, 84 p.
Paktunc, D.A., (2001); MODAN—a computer program for estimating mineral quantities based on bulk composition: windows version: Computers & Geosciences, Vol. 27, Issue 7, p. 883-88
Robertson Geoconsultants Inc., (2000); Interim Background Characterization Study,
Questa Mine, New Mexico: Questa Mine Closeout Plan Program Task A7- Subtask 1.1, 1.2 and Phase 2, Report No. 052008/6, 33 p.
Ross, P., Jebrak, M. and Walker, B.M., (2002); Discharge of hydrothermal fluids from
a magma chamber and concomitant formation of a stratified breccia zone at the Questa porphyry molybdenum deposit, New Mexico: Economic Geology, v. 97, p. 1679-1700
Rye, R.O., Bethke, P.M., Wasserman, M.D., (1992); The stable isotope geochemistry
of acid sulfate alteration: Economic Geology and the Bulletin of the Society of Economic Geologists 87, no. 2, p. 225-262
Schilling, J.H., (1956); Geology of the Questa molybdenum (Moly) mine area, Taos
County, New Mexico: New Mexico Bureau of Mines and Mineral Resources, Bulletin 51, 87 p.
Seal, R. R., II, Alpers, C.N., Rye, R.O., (2000); Stable isotope systematics of sulfate
minerals: Sulfate minerals; crystallography, geochemistry, and environmental significance, Reviews in Mineralogy and Geochemistry 40, p. 541-602
Shaw, S., Wels, C., Roberston, A., Fortin, S. and Walker, B., (2003); Background
characterization study of naturally occurring acid rock drainage in the Sangre de Cristo mountains, Taos County, New Mexico: in 6th ICARD: Cairns, Queensland, Australia, July 12-18, p. 605-616
Sheppard, S.M.F. and Gilg, H.A., (1996); Stable Isotope Geochemistry of Clay
Minerals; Clay Minerals, v. 31, p. 1-24
125

126
Singer, P.C. and Stumm, W., (1968); Kinetics of the oxidation of ferrous iron: in
Proceedings Second Symposium on Coal Mine Drainage Research; Bituminous Coal Research Inc., Monroeville, Pennsylvania (12-34)
Singer, P.C. and Stumm, W., (1970); Acid mine drainage: the rate determining step:
Science, vol. 167, p. 1121-1123 Sobek, A.A., Schuller, W.A. Freeman, J.R. and Smith, R.M., (1978); Field and
laboratory methods applicable to overburden and minesoils, EPA 600/2-78-054, 203 p.
Standard Operating Procedure No. 11 (SOP 11); Paste pH and paste conductivity:
Questa Rock pile weathering and stability project, unpublished report, 4 p. Standard Operating Procedure No. 62 (SOP 62); Acid Base Accounting: Questa Rock
pile weathering and stability project, unpublished report, 11 p. Stefanini, B. and Williams-Jones, A.E., (1996); Hydrothermal evolution in the
Calabona porphyry cooper system (Sardinia, Italy): The path to an uneconomic deposit; Economic Geology, v. 91, p. 774-791
Summerfield, M.A., (1991); Global Geomorphology: An introduction to the study of
landforms; First Edition, Longman Group Ltd, England, p. 137-146
Taylor, H.P., Jr. and Epstein, S., (1982); Relationship between 18O/16O ratios in coexisting minerals of igneous and metamorphic rocks, Part 1: Principles and experimental results: Geological Society of America Bulletin, v. 73, p. 461-480
Tweto, O., (1979); The Rio Grande Rift system in Colorado: A summary, in Riecker,
R.E., ed, Rio Grande rift Tectonics and magmatism, Washington D.C., American Geophysical Union, p. 35-36
Wasserman, M.D., Rye, R.O., Bethke, P.M., and Arribas, A., (1992); Methods for
separation and total stable isotope analysis of alunite: US. Geological Survey, Open-file Report 92-9, 20 p.
White, A.F and Brantley, S.L., (1995); Chemical weathering rates of silicate minerals:
an overview: in Reviews in Mineralogy, v. 31, Chemical Weathering Rates of Silicate Minerals, eds. White and Brantley, p. 1-22
White, A.F., (1995); Chemical weathering rates of silicate minerals in soil: in Reviews
in Mineralogy, v. 31, Chemical Weathering Rates of Silicate Minerals, eds. White and Brantley, p. 407-46

128
Appendix A. Individual and Profile Particle Size Results

129
HAS-GJG-0006 Particle Size Distribution
0102030405060708090
100
0.0010.0100.1001.00010.000100.0001000.000GRAIN SIZE MILLIMETERS
PE
RC
EN
T FI
NE
R B
Y W
EIG
HT
COBBLES GRAVEL SAND SILT CLAY
BOULDERS
Coarse Fine Coarse Medium Fine
HYDROMETER3/83 41-1/2 1 103/4 16 30 40 50 60 200100
U.S. STANDARD SIEVE NUMBERS2

130
HAS-GJG-0007 Particle Size Distribution
0102030405060708090
100
0.0010.0100.1001.00010.000100.0001000.000Grain Size (mm)
Per
cent
Fin
er b
y W
eigh
t
COBBLES GRAVEL SAND SILT CLAY
BOULDER
Coarse Fine Coarse Medium Fine
HYDROMETER3/83 41-1/2 1 103/4 16 30 40 50 60 200100
U.S. STANDARD SIEVE NUMBERS
2

131
HAS-GJG-0008 - Particle Size Distribution
0102030405060708090
100
0.00100.01000.10001.000010.0000100.00001000.0000Grain Size (mm)
Per
cent
Fin
er b
y W
eigh
t
COBBLES GRAVEL SAND SILT CLAY
BOULDER
Coarse Fine Coarse Medium Fine
HYDROMETER3/83 41-1/2 1 103/4 16 30 40 50 60 200100
U.S. STANDARD SIEVE NUMBERS
2

132
HAS-GJG-0009 - Particle Size Distribution
0102030405060708090
100
0.0010.0100.1001.00010.000100.0001000.000Grain Size (mm)
Per
cent
Fin
er b
y W
eigh
t
COBBLES GRAVEL SAND SILT CLAY
BOULDER
Coarse Fine Coarse Medium Fine
HYDROMETER3/83 41-1/2 1 103/4 16 30 40 50 60 200100
U.S. STANDARD SIEVE NUMBERS
2

133
HAS-GJG-0010 - Particle Size Distribution
0102030405060708090
100
0.0010.0100.1001.00010.000100.0001000.000Grain Size (mm)
Per
cent
Fin
er b
y W
eigh
t
COBBLES GRAVEL SAND SILT CLAY
BOULDERS
Coarse Fine Coarse Medium Fine
HYDROMETER3/83 41-1/2 1 103/4 16 30 40 50 60 200100
U.S. STANDARD SIEVE NUMBERS
2

134
Hansen Profile (HAS) - Particle Size Distribution
0
10
20
30
40
50
60
70
80
90
100
0.0010.0100.1001.00010.000100.0001000.000Grain Size (mm)
Per
cent
Fin
er b
y W
eigh
t
HAS-GJG-0006 HAS-GJG-0007 HAS-GJG-0008 HAS-GJG-0009 HAS-GJG-0010

135
SWH-GJG-0008 - Particle Size Distribution
0102030405060708090
100
0.0010.0100.1001.00010.000100.0001000.000Grain Size (mm)
Per
cent
Fin
er b
y W
eigh
t
COBBLES GRAVEL SAND
SILT CLAY CLAY
BOULDERS
Coarse Fine Coarse Medium Fine
HYDROMETER3/83 41-1/21 103/4 16 30 40 50 60 200100
U.S. STANDARD SIEVE NUMBERS
2

136
SWH-GJG-0009 - Particle Size Distribution
0102030405060708090
100
0.0010.0100.1001.00010.000100.0001000.000Grain Size (mm)
Per
cent
Fin
er b
y W
eigh
t
COBBLES GRAVEL SAND SILT CLAY
BOULDERS
Coarse Fine Coarse Medium Fine
HYDROMETER3/83 41-1/2
1 103/4 16 30 40 50 60 200100
U.S. STANDARD SIEVE NUMBERS
2

137
SWH-GJG-0010 - Particle Size Distribution
0102030405060708090
100
0.0010.0100.1001.00010.000100.0001000.000Grain Size (mm)
Per
cent
Fin
er b
y W
eigh
t
COBBLES GRAVEL SAND SILT CLAY
BOULDERS
Coarse Fine Coarse Medium Fine
HYDROMETER3/83 41-1/2 1 103/4 16 30 40 50 60 200100
U.S. STANDARD SIEVE NUMBERS
2

138
SWH-GJG-0011 - Particle Size Distribution
0102030405060708090
100
0.0010.0100.1001.00010.000100.0001000.000Grain Size (mm)
Per
cent
Fin
er b
y W
eigh
t
COBBLES GRAVEL SAND SILT CLAY
BOULDERS
Coarse Fine Coarse Medium Fine
HYDROMETER3/83 41-1/2 1 103/4 16 30 40 50 60 200100
U.S. STANDARD SIEVE NUMBERS
2

139
SWH-GJG-0012 - Particle Size Distribution
0102030405060708090
100
0.0010.0100.1001.00010.000100.0001000.000Grain Size (mm)
Per
cent
FIn
er b
y W
eigh
t
COBBLES GRAVEL SAND SILT CLAY
BOULDERS
Coarse Fine Coarse Medium Fine
HYDROMETER3/83 41-1/2 1 103/4 16 30 40 50 60 200100
U.S. STANDARD SIEVE NUMBERS
2

140
SWH-GJG-0013 - Particle Size Distribution
0102030405060708090
100
0.0010.0100.1001.00010.000100.0001000.000Grain Size (mm)
Per
cent
Fin
er b
y W
eigh
t
COBBLES GRAVEL SAND SILT CLAY
BOULDERS
Coarse Fine Coarse Medium Fine
HYDROMETER3/83 41-1/2 1 103/4 16 30 40 50 60 200100
U.S. STANDARD SIEVE NUMBERS
2

141
SWH-GJG-0014 - Particle Size Distribution
0102030405060708090
100
0.0010.0100.1001.00010.000100.0001000.000Grain Size (mm)
Per
cent
Fin
er b
y W
eigh
t
COBBLES GRAVEL SAND
SILT CLAYBOULDERS
Coarse Fine Coarse Medium Fine
HYDROMETER3/83 41-1/2 1 103/4 16 30 40 50 60 200100
U.S. STANDARD SIEVE NUMBERS
2

142
SWH-GJG-0015 - Particle Size Distribution
0102030405060708090
100
0.0010.0100.1001.00010.000100.0001000.000Grain Size (mm)
Per
cent
Fin
er b
y W
eigh
t
COBBLES GRAVEL SAND SILT CLAY
BOULDERS
Coarse Fine Coarse Medium Fine
HYDROMETER3/83 41-1/2 1 103/4 16 30 40 50 60 200100
U.S. STANDARD SIEVE NUMBERS
2

143
Lower Southwest Hansen Profile (SWH) - Particle Size Distribution
0
10
20
30
40
50
60
70
80
90
100
0.0010.0100.1001.00010.000100.0001000.000Grain Size (mm)
Per
cent
Fin
er b
y W
eigh
t
SWH-GJG-0008 SWH-GJG-0009 SWH-GJG-0011 SWH-GJG-0012 SWH-GJG-0014
SWH-GJG-0015 SWH-GJG-0010 SWH-GJG-0013
COBBLES GRAVEL SAND SILT CLAY
BOULDERS
Coarse Fine Coarse Medium Fine
HYDROMETER3/8341-1/21 103/4 16 30 40 50 60 200100
U.S. STANDARD SIEVE NUMBERS
2

144
SWH-GJG-0020 - Particle Size Distribution
0102030405060708090
100
0.0010.0100.1001.00010.000100.0001000.000Grain Size (mm)
Per
cent
Fin
er b
y W
eigh
t
COBBLES GRAVEL SAND SILT CLAY
BOULDERS
Coarse Fine Coarse Medium Fine
HYDROMETER3/83 41-1/2 1 103/4 16 30 40 50 60 200100
U.S. STANDARD SIEVE NUMBERS
2

145
SWH-GJG-0021 - Particle Size Distribution
0102030405060708090
100
0.0010.0100.1001.00010.000100.0001000.000Grain Size (mm)
Per
cent
Fin
er b
y W
eigh
t
COBBLES GRAVEL SAND SILT CLAY
BOULDERS
Coarse Fine Coarse Medium Fine
HYDROMETER3/83 41-1/2 1 103/4 16 30 40 50 60 200100
U.S. STANDARD SIEVE NUMBERS
2

146
SWH-GJG-0022 - Particle Size Distribution
0102030405060708090
100
0.0010.0100.1001.00010.000100.0001000.000Grain Size (mm)
Per
cent
Fin
er b
y W
eigh
t
COBBLES GRAVEL SAND SILT CLAY
BOULDERS
Coarse Fine Coarse Medium Fine
HYDROMETER3/83 41-1/2 1 103/4 16 30 40 50 60 200100
U.S. STANDARD SIEVE NUMBERS
2

147
SWH-GJG-0023 - Particle Size Distribution
0102030405060708090
100
0.00100.01000.10001.000010.0000100.00001000.0000Grain Size (mm)
Per
cent
Fin
er b
y W
eigh
t
COBBLES GRAVEL SAND SILT CLAY
BOULDERS
Coarse Fine Coarse Medium Fine
HYDROMETER3/83 41-1/2 1 103/4 16 30 40 50 60 200100
U.S. STANDARD SIEVE NUMBERS
2

148
Upper Southwest Hansen Profile (SWH) - Particle Size Distribution
0102030405060708090
100
0.0010.0100.1001.00010.000100.0001000.000Grain Size (mm)
Perc
ent F
iner
by
Wei
ght
SWH-GJG-0020 SWH-GJG-0021 SWH-GJG-0022 SWH-GJG-0023
COBBLES GRAVEL SAND
SILT CLAYBOULDERS
Coars Fine Coarse Medium Fine
HYDROMETER3/3 41-/
1 103/4
16 30 40 5 6 200100
U.S. STANDARD SIEVE NUMBERS
2

149
Appendix B. Petrographic Results

150
Hansen Profile

151

152
Lower Southwest Hansen Profile

153

154
Upper Southwest Hansen Profile
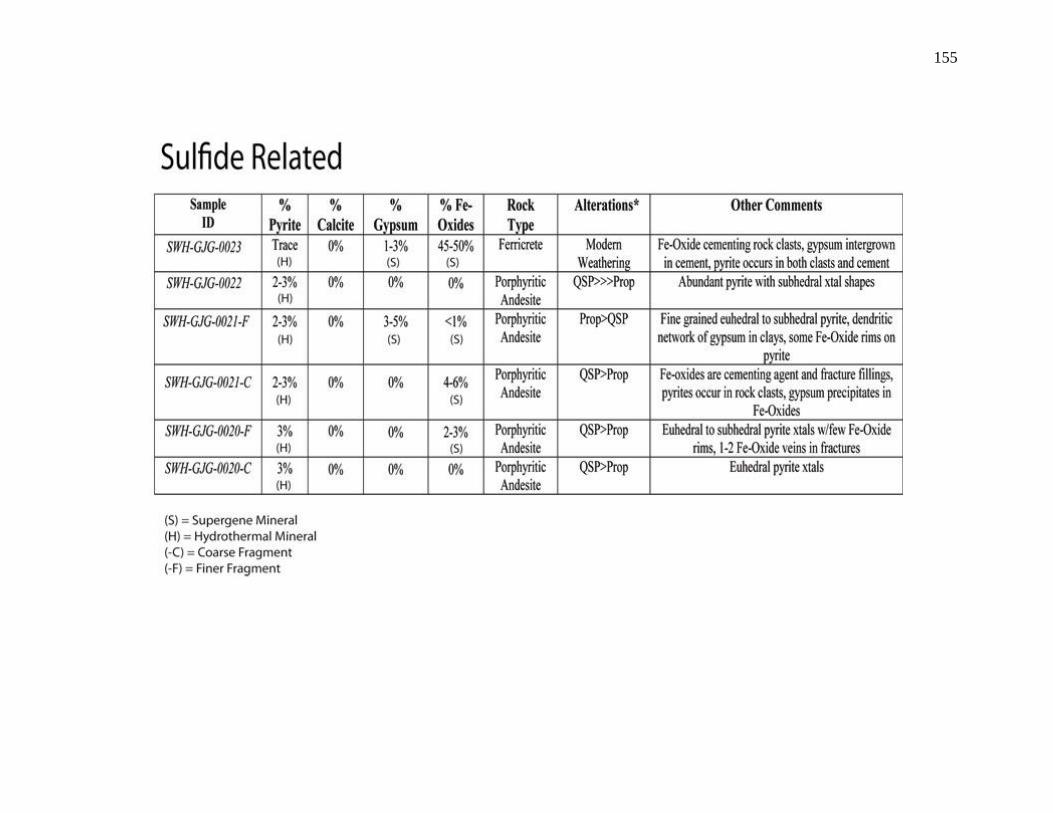
155

156
Appendix C. Isotopic Data from Campbell and Lueth (2008)

157

158
Appendix D. Clay X-Ray Diffraction Scans

159
Table of 2θ peak locations for identified clay minerals
I
1W Dismectite
2θ
2W Dismectite
2θ
Clinochlore
2θ
Chamosite
2θ
Kaolinite
2θ
Illite (Dimica)
2θ
(001)
7.06
5.83
6.21
6.14
12.42
8.74
(002)
14.34
17.64
12.5
12.42
24.95
17.87
(003)
29.06
23.77
18.86
18.71
___
26.91

160
Hansen Profile HAS-GJG-0006

161
HAS-GJG-0006-20

162
HAS-GJG-0008

163
HAS-GJG-0009

164
HAS-GJG-0010
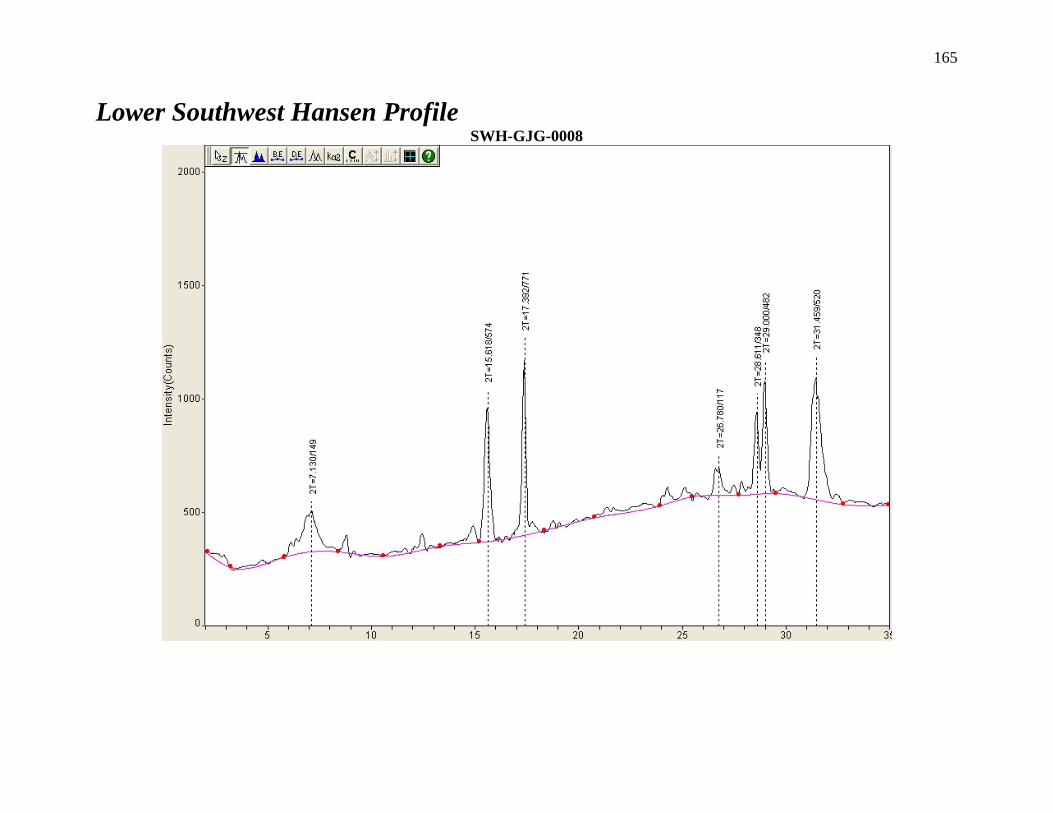
165
Lower Southwest Hansen Profile SWH-GJG-0008

166
SWH-GJG-0009

167
SWH-GJG-0010

168
SWH-GJG-0011

169
SWH-GJG-0012

170
SWH-GJG-0013

171
SWH-GJG-0014

172
SWH-GJG-0015

173
Upper Southwest Hansen Profile
SWH-GJG-0020

174
SWH-GJG-0020-20

175
SWH-GJG-0021

176
SWH-GJG-0022

177
SWH-GJG-0023

178
APPENDIX E. In-situ profile sample pictures

179
Lower Southwest Hansen Profile
C
B
A
A) (SWH-GJG-0008-11) quartz latite porphyry bedrock at base of profile, notice
gray clay vein near hammer. B) (SWH-GJG-0012) Mid profile sample location; note grayish color and large rock fragments. C) (SWH-GJG-0013) “gray clay” layer near the top of profile; note large gypsum crystal near right corner. D) (SWH-GJG-0014) another “gray clay” layer near top of profile. No picture available for top of profile (SWH-GJG-0015

180
Upper Southwest Hansen Profile
D
C
B
A
A) (SWH-GJG-0020) Highly fractured andesite bedrock at base of profile; B) (SWH-GJG-0021) fractured in-situ bedrock near base of profile; notice large clasts still in place; C) (SWH-GJG-0023) fine-grained “gray clay” layer near top of profile; D) (SWH-GJG-0023) ferricrete capping the top of profile

181
Hansen Profile
C
B
A
A) (HAS-GJG-0006-7) andesite bedrock at and near the base of profile; notice the intense fracturing; B) (HAS-GJG-0008) mid-profile weathered andesite bedrock, notice the intense fracturing and fe-oxide staining of sample location; C) (HAS-GJG-0009-10) “gray clay” layers near top of profile; notice the whitish-gray color change from three sample near the base.