Embed Size (px)
Citation preview
©2012 Society of Economic Geologists, Inc.Economic Geology, v. 107, pp. 1387–1402
Mineral Potential Mapping for Orogenic Gold Deposits in the Rio Maria Granite Greenstone Terrane, Southeastern Pará State, Brazil
EzEquiEl Costa E silva,1,† adalEnE M. silva,2 Catarina l. BEMfiCa tolEdo,2 augusto g. Mol,3 david W. ottErMan,3 and sEBastião rodrigo CortEz dE souza4
1 Reinarda Mineração Ltda. (Troy Brasil), Avenida Nove, n° 452, Rio Maria, PA, Brazil 68530-0002 Laboratory of Applied Geophysics, Institute of Geosciences, University of Brasília, DF, Brazil 70910-900
3 Troy Resources Limited, Unit 12, First Floor, 11 Ventnor Avenue, West Perth, Western Australia 6005, Australia4 Reinarda Mineração Ltda. (Troy Brasil), Avenida Nove, n° 452, Rio Maria, PA, Brazil 68530-000
AbstractThe Rio Maria granite-greenstone terrain is characterized by extensive surficial cover and a lack of outcrop.
Therefore, airborne geophysical measurements play a major role in mineral exploration in this region. A high-resolution airborne survey was used to build a prospectivity model for gold targeting employing a fuzzy logic technique. Within the Rio Maria granite-greenstone terrain, a total of 57 new potential orogenic gold targets were identified. The ability of this processing technique to identify favorable targets with potential for economic gold mineralization was verified by comparing the new predicted targets with known gold occurrences (e.g., Mamão Mine and Lagoa Seca deposits). Geographic Information System (GIS)-based automated processing methods employing fuzzy logic techniques were used to derive spatial models for generating orogenic gold exploration targets.
Two metallogenic approaches were used. The first approach considers orogenic gold deposits hosted at the contact between mafic and felsic rocks. The second approach considers shear zone-hosted veins associated with mafic rocks and iron formations in the greenstone terrain. Detailed models were constructed for different blocks of the study area. A subset of these targets, i.e., Marcinho, Resende, and Votuporanga, were subsequently assessed using field evaluations that consisted of geological mapping and geochemical sampling. A follow-up drilling program is currently in progress and will be used to assess the main target areas where grid soil and rock sampling have indicated anomalous trends. The remaining predicted targets warrant further investigation.
Data integration using GIS modeling and interpretation resulted in the following main conclusions with respect to the orogenic gold exploration potential of the Rio Maria Province: (1) as shown using GIS-based prospectivity analysis, there is considerable potential for orogenic gold deposits along the Andorinhas green-stone belt, and several prospective areas are associated with mafic and iron formation units; (2) several deposits within the Rio Maria and Identidade greenstone belt are associated with felsic units, as demonstrated by the fuzzy logic models; (3) many of the previously known targets that have been re-identified should be reevalu-ated to identify those the most promising targets for the discovery of a gold deposit; (4) the final prospectivity model shows that many of the most important gold deposits known are located within areas of high favorability, and several other new potential gold-bearing targets were selected; and (5) the proposed method identifies 57 geologically consistent targets and led to the discovery of the Marcinho deposit.
IntroductionsignifiCant progress has been made in the integration and spatial modeling of exploration geochemical and geophysical data, thereby providing better tools to assist the discovery of new gold deposits (Robert et al., 2007). The applications of these new methodologies are particularly useful in the search for new gold discoveries in greenstone belt terranes (Jaques et al., 1997). Current exploration protocols are focused on defin-ing a blueprint based on known gold deposits, which is then applied in a search of available data sets to identify similar anomalies.
The approach outlined here is an integrated geographic information system (GIS)-based exploration method for tar-geting orogenic gold deposits within the Rio Maria granite-greenstone terrane using spatial analytical techniques. These can be divided into two general categories: data- and knowl-edge-driven techniques, for which reviews can be found in
Bonham-Carter (1994) and Wright and Bonham-Carter (1996).
Data-driven approaches require a priori knowledge (ex-pressed in terms of previously determined probabilities) in the form of known mineral deposits or occurrences (e.g., prospects) for the study area. Spatial relationships between the input data (e.g., evidence maps) and the spatial locations of the mineral prospects are used to establish the importance (i.e., weight) of each evidence map. In other data-driven approaches, training areas can be established for each mineral deposit from which diagnostic signatures of mineralization can be calculated based on the various data (e.g., geochemical and geophysical information) used in the modeling process (Har-ris et al., 2001). Statistical methods use techniques such as regression, discriminant analysis, data-driven evidential belief functions (Carranza and Hale, 2003), cluster analysis, canoni-cal favorability analysis (Pan, 1993), weights of evidence mod-eling (Bonham-Carter et al., 1989; Bonham-Carter, 1994), neural networks (see Brown et al., 2000, 2003), and data min-ing (see Salleb and Vrain, 2000).
0361-0128/12/4060/1387-16 1387Submitted: August 23, 2011Accepted: January 29, 2012
† Corresponding author: e-mail, [email protected]

1388 COSTA E SILVA ET AL.
Knowledge-driven approaches rely on the geologist’s input to weigh the importance of each data layer (evidence map) as it relates to the particular exploration model being used. This approach is more subjective, but it has the advantage of incor-porating the knowledge and expertise of the geologist to build models and generate prospectivity maps. Examples of knowl-edge-driven approaches include Boolean logic, index overlay (Harris, 1989), analytical hierarchy process (AHP; Harris et al., 1995), and fuzzy logic (An et al., 1992) methods.
The objective of this paper is to evaluate gold potential area, using mineral favorability maps to define areas for fur-ther exploration using a fuzzy logic approach (Fig. 1). The Rio Maria granite-greenstone terrane is an ideal area for the development of this type of modeling due to the lack of out-crops and numerous gold occurrences. A large number of datasets were provided by Troy Resources Limited/Reinarda Mineração Ltda., including geologic mapping and airborne geophysical and geochemical data.
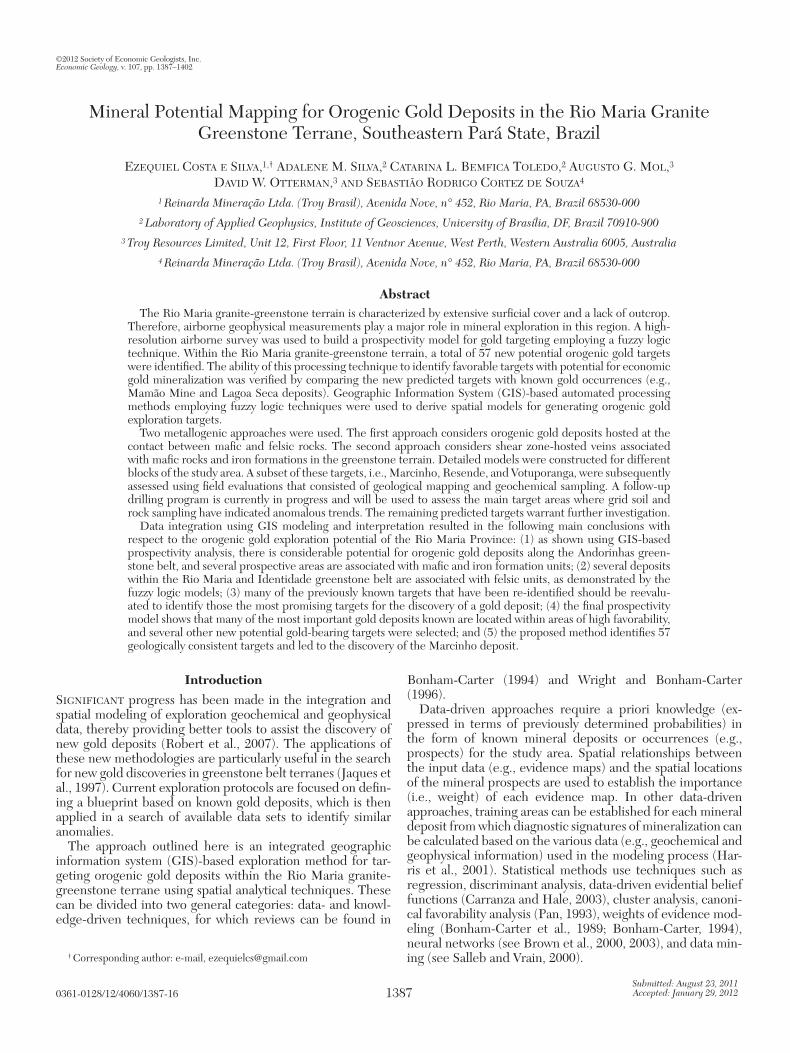
Geologic SettingThe Rio granite-greenstone terrane (Fig. 2) is located in
the southeastern part of Carajás Mineral Province, which in
turn lies at the southeastern margin of the southern Amazon Craton of Brazil and consists of granite-greenstone terranes, intracratonic basins, and high-grade metamorphic complexes (Tassinari and Macambira, 2004). This area is one of the most important mineral provinces in Brazil with a diversity of rich mineral resources (Dall´Agnol et al., 2006). The Carajás Prov-ince comprises two Archean tectonic blocks: the northern Ita-caiúnas Belt (Araújo et al., 1988), which is a tectonic block that hosts the Carajás Basin, and the southern Rio Maria gran-ite-greenstone terrane.
The Rio Maria granite-greenstone terrane consists of green-stone belts and a variety of Archean granitoids. The green-stone sequence of the Andorinhas Supergroup is composed of ultramafic and mafic metavolcanic rocks intercalated with iron formations and intermediate to felsic rocks at the base (Babaçu Group) and chemical and clastic metasedimentary rocks at the top (Lagoa Seca Group). U/Pb dates range from 2.97 to 2.90 Ga (Macambira, 1992; Pimentel and Machado, 1994; Dall’Agnol et al., 1999; Almeida et al., 2011). Within the study area, these units are located in three greenstone sequences called the Andorinhas, Rio Maria, and Identidade sequences (Fig. 3). These volcano-sedimentary successions
Gold occurrence
Geology- structures- alteration- lithologies
AirboneGeophysics- radiometrics- magnetics
MapInfo
ArcGisReclassificationRaster calculationInterpolation
Geological interpretationData integration
Oasis MontajGeophysical interpretationData processingAirbone data sets
Fuzzy Logic
eTh F Parameter K/eTh LitologyStrucutures
FuzzySmall
FuzzyLarge
operatorE fuzzy
operatorfuzzy gamma 0.9 Modelling steps
Prospectivity Map
EXPLORATION MODEL
Dat
aP
rep
roce
ssin
gM
od
ellin
gE
xplo
rati
on
1 - Select relevantdata based one x p l o r a t i o nmodel
2 - Input patterngeneration
3 - Spatial analysis
4 - Evaluation
ArcSDM
Profile Analyst Data processingVisualization
SpatialAnalyst
Drilling programRock and soil samplingDetailed geological mappingGeological reconnaissance
Target testing
fig. 1. Flowchart describing the components involved in mineral potential modeling. This diagram is based on the meth-odologies of Pan and Harris (2000), Harris et al. (2006), and modified after Nykänen (2008).
MINERAL POTENTIAL MAPPING, OROGENIC Au DEPOSITS, RIO MARIA GRANITE-GREENSTONE TERRANE, BRAZIL 1389
overlie high-grade granitic and gneissic rocks of the Xingu and Pium Complexes. These rocks represent the basement, and they show different grades of deformation and greenschist-facies metamorphism (Souza et al., 2001).
The Andorinhas Supergroup is intruded by a variety of Archean granitoids that date between 2.98 and 2.86 Ga. Four groups of granitoids have been distinguished (Dall’Agnol et al., 2006): (1) an older TTG series (2.98−2.92 Ga) is repre-sented by the Arco Verde tonalite and the Caracol tonalite complex; (2) the Rio Maria sanukitoid suite (~2.87 Ga; Oliveira et al., 2009) is predominantly composed of granodiorites with associated mafic and intermediate rocks forming enclaves or, locally, small bodies—these rocks intrude into the greenstone belts and the older TTG series and are intruded by the Água Fria trondhjemite (Leite et al., 2004); (3) a younger TTG series (~2.87−2.86 Ga) is exposed only in the Rio Maria and Xinguara areas of the Rio Maria granite-greenstone terrane and is represented by the Mogno trondhjemite and the Água Fria trondhjemite; and (4) potassic leucogranites of calcalka-line affinity (~2.87−2.86 Ga) are represented by the Xinguara
and Mata Surrão granite plutons (Docegeo, 1988; Althoff et al., 2000; Souza et al., 2001; Leite et al., 2004; Dall’Agnol et al., 2006).
Several ductile shear zones are responsible for the promi-nent deformation observed in these rocks. The main shear zones trend east-west, northwest-southeast, and northeast-southwest with dextral strike-slip faults that have mainly affected the supracrustal rocks (Holdsworth and Pinheiro, 2000). Synformal structures along the shear directions, which were previously interpreted as synclines, are considered to be transpressive duplexes. The larger duplexes are related to E-W shear zones that have cores consisting of sedimentary rocks and borders defined by thrust faults (Holdsworth and Pinheiro, 2000).
Paleoproterozoic anorogenic alkaline to subalkaline A-type granitoid stocks and batholiths cut the greenstone belt rocks, dikes, and sills (Gastal, 1987). Similar greenstone sequences (Tucumã, Gradaus, and Sapucaia Groups) occur elsewhere within the craton (Oliveira, 1987; Souza, 1994). Small orogenic gold deposits, such as the Mamão, Babaçu,
N
62°W68°W 56°W
4°N
50°W
0°
8°S
12°S
4°S
PortoVelho
Manaus
Purus
Iquitos
MonteAlegre
GurupáBelém
Itacoatiara
Rouraima
Amazonas Basin
Atlantic Ocean
Carajás Mineral Province
Itacaiunas BeltCarajás Domain
Rio Maria granite-greenstone
terrane
Central Amazonian - CA> 2.3 Ga
Maroni - Itacaiunas - MI2.25 Ga - 1.95 Ga
Ventauri - Tapajos - VT1.95 Ga - 1.80 Ga
Rio Negro - Juruena - RNJ1.75 Ga - 1.55 Ga
Rondonian - San Ignacio - RO1.45 Ga - 1.25 Ga
Sunsas - Ss1.25 Ga - 0.90 Ga
Phanerozoic Sediments
Geochronological Provinces Geological units
Granites
Precambrian Sediments
Felsic - Intermediate Volcanics
Mafic Volcanics
Greenstone Belts
Granulite Metamorphic Rocks
NeoProterozoic Mobile Belts
unas Beltás Domain
tone
Tocantins
Ara
Fres
Ma
Itacai
Ri
Ri Ri
Ri
guai
a
co
ria
unas
ver
ver
ver
verPará
50.5 ° 49.5 ° 48.5 °51.5 °
-5.5
°- 6
. 5°
- 7. 5
°
Road River
City
Legend
Study area
N
50 Km
SAD 69 - Zone 22 S
Carajás Mineral Province
Carajásbasin
Iricoume
fig. 2. Simplified map of the Amazonian Craton, showing the geochronological provinces according to Tassinari and Macambira (2004). The Carajás mineral province and the study area location are highlighted.
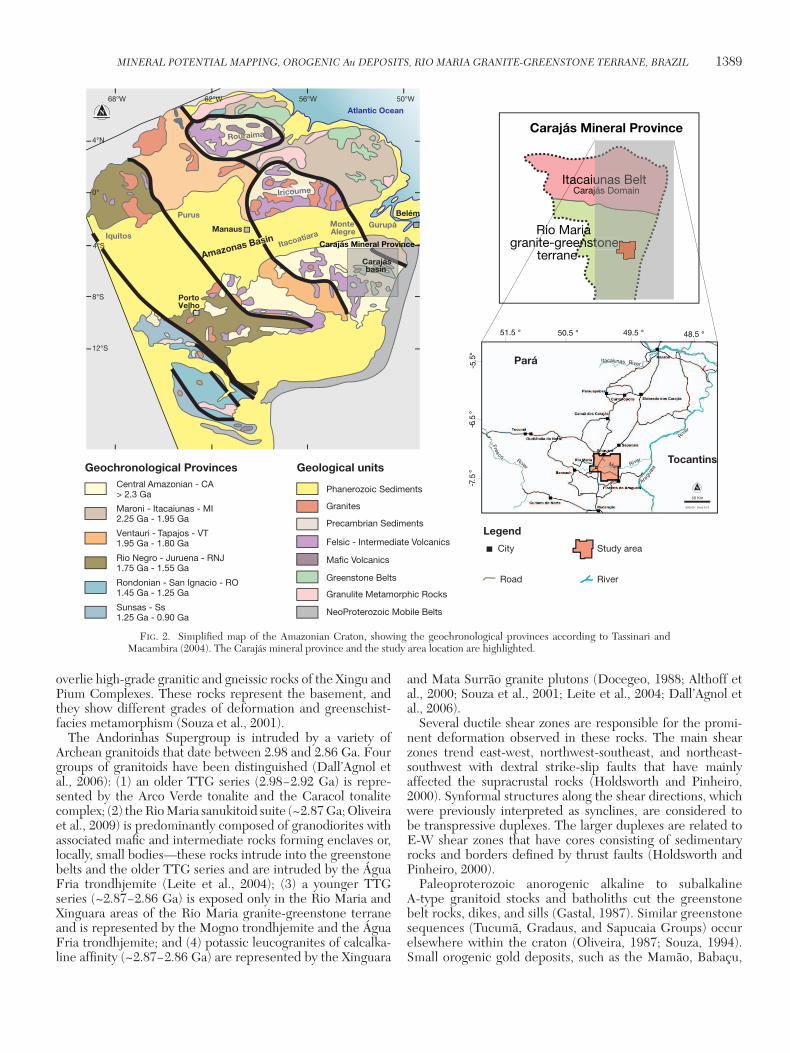
1390 COSTA E SILVA ET AL.
fig
. 3.
Inte
grat
ed g
eolo
gic
map
of t
he R
io M
aria
gra
nite
-gre
enst
one
terr
ane,
sho
win
g th
e lo
catio
n of
the
stud
y ar
ea.
MINERAL POTENTIAL MAPPING, OROGENIC Au DEPOSITS, RIO MARIA GRANITE-GREENSTONE TERRANE, BRAZIL 1391
Lagoa Seca, Diadema, and Serrinha deposits, are located in these greenstone sequences (Huhn, 1992). Currently, the only operating gold mine is the Mamão mine, which is oper-ated by Troy Resources Limited and Reinarda Mineração Ltda. (RML).
Gold Mineralization in the Andorinhas Greenstone Belt
Archean orogenic lode gold deposits are the result of large complex mineralization systems (Goldfarb et al., 2005) and are thought to be related to the final stages of terrane accretion in a subduction setting (Groves et al., 1998) or late orogenic extension (Goldfarb et al., 1997). Orogenic gold mineraliza-tion in the Andorinhas Supergroup is generally associated with quartz veins in shear zones with hydrothermal alteration and variable amounts of sulfide. In general, the lode gold deposits have formed in dilational zones within the shear zones (Hunh, 1992).
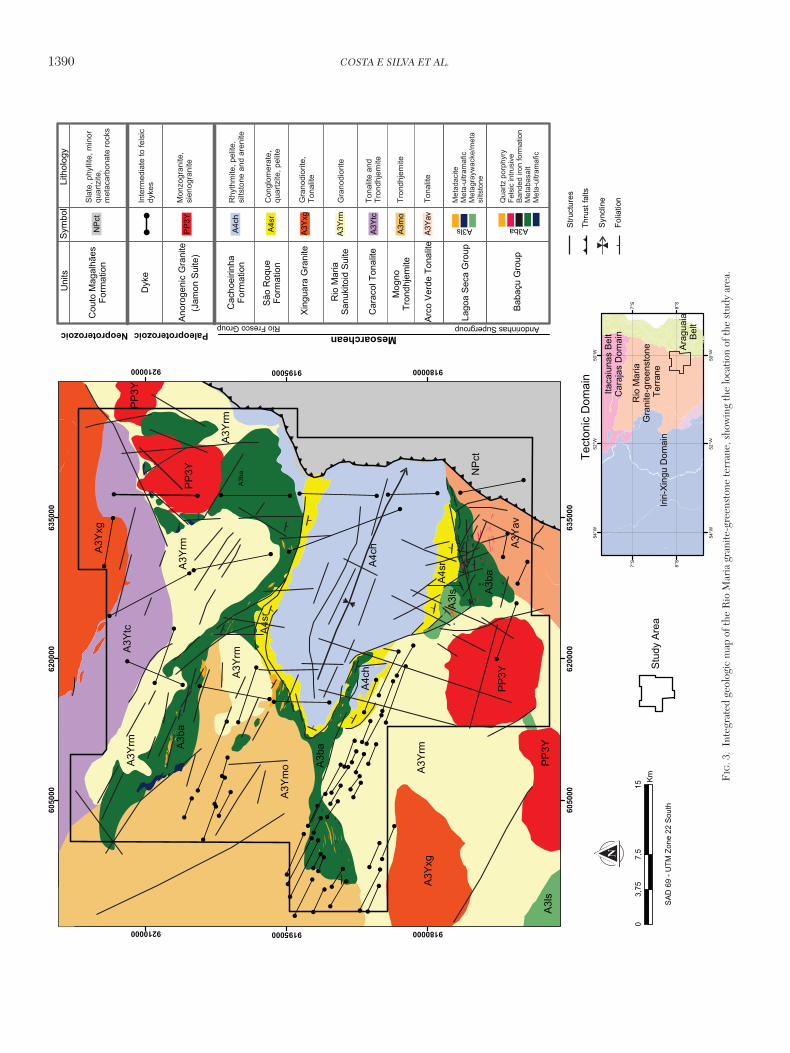
Three main types of orogenic deposits have been dis-tinguished within the study area based on their host-rock environment: greenstone-hosted (e.g., the Mamão mine), tur-bidite-hosted (e.g., the Lagoa Seca deposit), and BIF-hosted (e.g., the Marcinho target) deposits (Fig. 4). In the latter two types, the gold is associated with disseminate sulfides.
Lithologic and structural controls
Lithologic boundaries were interpreted using geophysical data and geologic field mapping. The main lithologies include ultramafic, mafic, and felsic rocks, BIFs, sedimentary rocks, and granites. The main deposits of the study area are hosted in metabasalts (e.g., the Mamão mine), BIFs (e.g., the Mar-cinho target), felsic rocks of the Babaçu Group (e.g., Resende target), and the turbidite sequences of the Lagoa Seca Group (e.g., Lagoa Seca deposit).
The Mamão gold deposit is a shear-hosted deposit located in the dilational jogs of a high-strained zone branch within the early foliation present in the metavolcanic rocks of the Andorinhas greenstone keel (Huhn, 1992). There are approxi-mately 74 gold occurrences within the study area. Some of these deposits occur in the main ENE-WSW−trending cor-ridor that hosts the Mamão mine, which contains more than 20 smaller pits and surface workings previously mined by prospectors. The lode gold is hosted in E-W dilatational jogs,
which represent secondary structures. Figure 5 shows the distribution of host rocks of the orogenic deposits within the study area and their respective percentile values.
In the Lagoa Seca deposit, the mineralization appears as disseminated sulfides within a turbidite sequence associated with a broad shear zone. This mineralization is best developed along contrasting rheological contacts with intrusive dacites and ultramafic units (Souza, 1999). The remaining gold occur-rences in the Rio Maria and Identidade Greenstone Belts are associated with quartz veins in contact between felsic and mafic rocks. These felsic units are related to the Babaçu Group and are represented by dacite, rhyolite, quartz-porphyry, and minor metasediments.
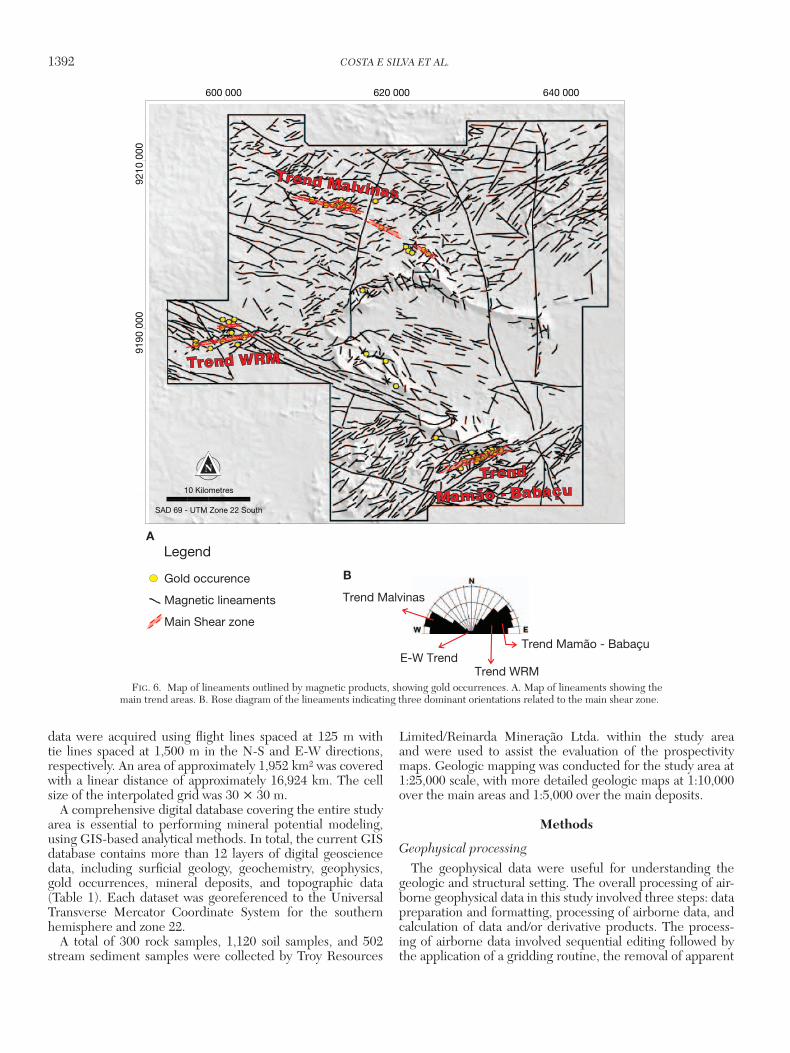
Magnetic lineaments have three dominant orientations: NW-SE (Trend Malvinas), NE-SW (Trend WRM and Mamão/Babaçu), and E-W (Fig. 6A, B). The NW-, NE-, and E-W−trending lineaments were extracted as separate maps. Accord-ing to the field mapping, the E-W−trending high strain zones, represented by splays and jogs along the NE–SW corridor, have a greater number of gold-bearing mineral occurrences in the three greenstone belts within the study area, including the Andorinhas, Identidade, and Rio Maria greenstone belts.
Hydrothermal alteration zones
The deposits in the Rio Maria Province exhibit varying distinct mineralogical zonation around the lode structures, based on the wall-rock type and crustal level. In the mafic host rocks, the distal alteration consists of chloritization, car-bonatization, and sericitization. Inner assemblages are biotiti-zation and sulfidization. In the proximal zones, the total or partial replacement of chlorite by biotite suggests a potassium metasomatism related to hydrothermal alteration. The widths of the alteration zones vary markedly, although the inner alteration zone is generally <10 m wide. A broader (10−100 m) outer alteration zone of chlorite and carbonate alteration surrounds the inner zone (Huhn, 1992). The extent of sul-fidization is extreme in the BIF and Fe-rich mafic host rocks, and the predominant sulfides consist of pyrite and pyrrhotite. However, gold concentrations are restricted to sites that expe-rienced the percolation of fluids rich in CO2 and SiO2, thereby forming mineralized quartz carbonate veins. This lode usually ranges in width from 5 cm to a few meters.
Airborne Geophysical Data and Other Multisource Data
The study area was covered by a high-resolution airborne geophysical magnetic gradiometer and radiometric survey flown at a constant ground clearance of 100 m. The airborne
BRITTLEDUCTILEZONE
VOLCANIC
IRON FORMATION GRANITOID SHEAR ZONE
HOMESTAKE- TYPESULPHIDE BODY
WACKE-SHALE
2
1
3
TURBIDITE-hostedVEIN
GREENSTONE-hostedVEIN
fig. 4. Schematic diagram proposed by Poulsen et al. (2000), illustrat-ing the types of orogenic deposits according to the host-rock environment: (1) greenstone-hosted deposits, (2) turbidite-hosted deposits, and (3) depos-its related to BIFs.
fig. 5. Diagram showing the host rocks of the orogenic deposits in the study area and their respective percentile values in terms of the number of individual deposits.
Mafic Metavolcanic
Felsic Metavolcanic
Banded Iron Formation
Turbitide
1392 COSTA E SILVA ET AL.
data were acquired using flight lines spaced at 125 m with tie lines spaced at 1,500 m in the N-S and E-W directions, respectively. An area of approximately 1,952 km2 was covered with a linear distance of approximately 16,924 km. The cell size of the interpolated grid was 30 × 30 m.
A comprehensive digital database covering the entire study area is essential to performing mineral potential modeling, using GIS-based analytical methods. In total, the current GIS database contains more than 12 layers of digital geoscience data, including surficial geology, geochemistry, geophysics, gold occurrences, mineral deposits, and topographic data (Table 1). Each dataset was georeferenced to the Universal Transverse Mercator Coordinate System for the southern hemisphere and zone 22.
A total of 300 rock samples, 1,120 soil samples, and 502 stream sediment samples were collected by Troy Resources
Limited/Reinarda Mineração Ltda. within the study area and were used to assist the evaluation of the prospectivity maps. Geologic mapping was conducted for the study area at 1:25,000 scale, with more detailed geologic maps at 1:10,000 over the main areas and 1:5,000 over the main deposits.
Methods
Geophysical processing
The geophysical data were useful for understanding the geologic and structural setting. The overall processing of air-borne geophysical data in this study involved three steps: data preparation and formatting, processing of airborne data, and calculation of data and/or derivative products. The process-ing of airborne data involved sequential editing followed by the application of a gridding routine, the removal of apparent
9190
000
9210
000
Trend Malvinas
Trend WRM
Trend
Mamão - Babaçu10 Kilometres
N
SAD 69 - UTM Zone 22 South
A
B
Legend
Gold occurence
Magnetic lineaments
Main Shear zone
Trend WRM
Trend Mamão - Babaçu
Trend Malvinas
E-W Trend
640 000600 000 620 000
fig. 6. Map of lineaments outlined by magnetic products, showing gold occurrences. A. Map of lineaments showing the main trend areas. B. Rose diagram of the lineaments indicating three dominant orientations related to the main shear zone.

MINERAL POTENTIAL MAPPING, OROGENIC Au DEPOSITS, RIO MARIA GRANITE-GREENSTONE TERRANE, BRAZIL 1393
residual errors and the microleveling of all data to a common base. The main derivative magnetic products calculated from the total magnetic field data were the analytic signal ampli-tude and phase, first vertical derivative, and horizontal gradi-ent. These products and the measured gradients (Gx and Gy) were also used (Fig. 7).
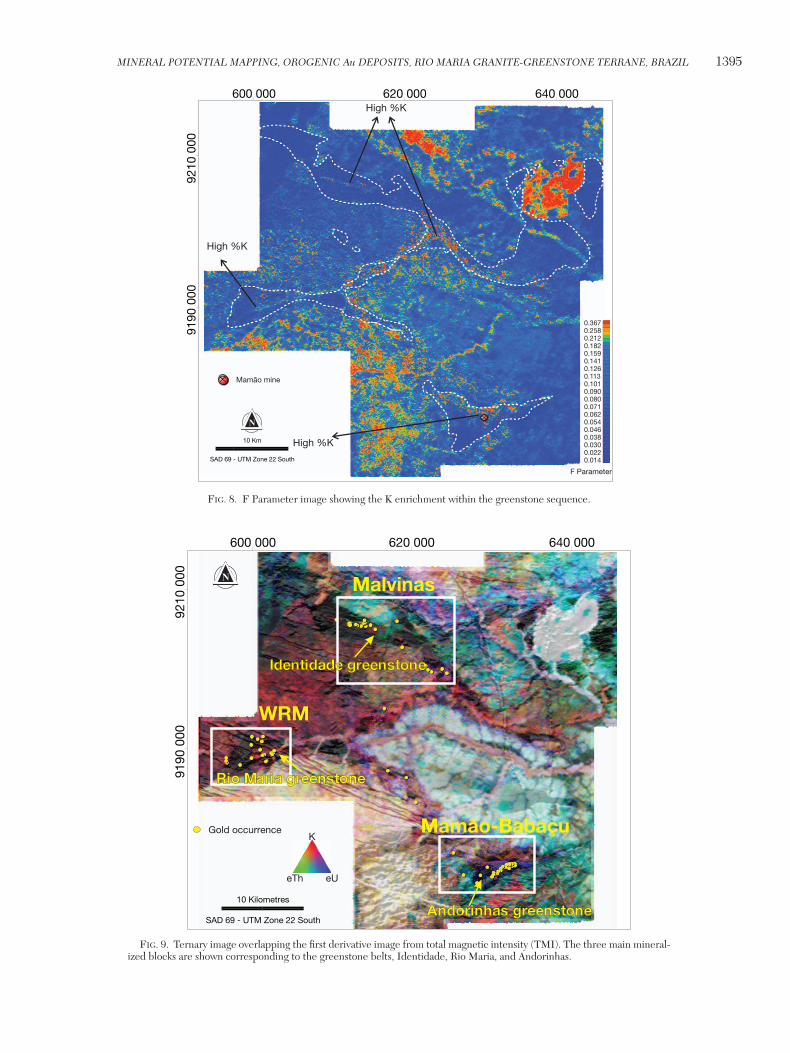
The industry standard processing of airborne gamma-ray surveys requires a minimum of four maps (i.e., total count, potassium, uranium, and thorium) to present the four mea-sured variables. Important information is also obtained from four additional derivative product maps that involve ratios between the various radioelements: eU/eTh, eU/K, eTh/K, and K/eU/eTh. In this approach, K/eTh, F Parameter, and K anomalous (Pires, 1995) images were mainly used to highlight the K enrichment. The F Parameter (Efimov, 1978) shows the potassium distribution related to the uranium and thorium radioelements and has been used for the discrimination of hydrothermal alteration zones. The F Parameter is expressed by the following formula: F = (K*eU)/eTh (Fig. 8).
Analysis of geophysical features provides new insights into structural history and can help geologists target new areas for mineral exploration (Silva, 1999). Gradiometer magnetic survey data associated with high-resolution gamma ray spec-trometric data show the advance of available geophysical technology for low magnetic gradient structures of interest in mineral exploration. The measured gradients (Gx and Gy) show better definition of the low magnetic features compar-ing the gradients calculated from total magnetic intensity (TMI) products. Therefore, the combination of Gx and Gy images with products derived by combining the K, Th, and U channels has been shown to be effective in selecting targets for follow-up in tropical terranes.
Spatial data analysis
Empirical methods, i.e., data-driven techniques, use sta-tistics to select the evidential layers that show the strongest relationship with the known mineralization, and they subse-quently use statistically derived weights for combining these layers to generate the prospectivity maps. Conceptual meth-ods, such as fuzzy logic, allow the geologist to select the evi-dential layers that they believe are the most critical for the particular style of mineralization being targeted. The fuzzy membership values range from 0 to 1 for each of these layers
based on their expert opinion, thereby taking into account the statistics of each element and the geologic background values within each area of interest.
After defining the fuzzy membership functions for each evidential map, a variety of operators can be used to combine the membership values. Several operations are available, and the union and intersection operations are commonly used in GIS. An et al. (1991), Bonham-Carter (1994), and Carranza and Hale (2001) described five operators that are used in mineral exploration-related datasets: Fuzzy AND, Fuzzy OR, Fuzzy algebraic product, Fuzzy algebraic sum, and Fuzzy Gamma (γ) operator. In this paper, we used the operators listed in Table 2.
A knowledge-driven approach was used in this study because only one producing mine (the Mamão mine) is pres-ent in the study area. Data from only one mine did not pro-vide a sufficient training set to enable a data-driven approach.
The data were processed in a variety of formats, includ-ing Oasis Montaj 7.0 from Geosoft™, MapInfo 9.5 (Pitney Bowes; Mapinfo, 2008), Profile Analyst 10.0 (Encom; Profile Analyst, 2010), and Surpac (Gemcom; Surpac Minex Group, 2009) Software. The majority of derivative products were cal-culated in Geosoft before being imported to the ArcGis 9.3.1 GIS, where statistical approaches were applied and data were converted to raster form to obtain derivative products that could be used to generate predictive maps. The commercial GIS package ArcGIS 9.3 from the Environmental Research Institute (ESRI), enhanced with advanced public domain extensions and the Spatial Data Modeler for ArcGIS (Arc-SDM) add-on (Kemp et al. 2001; Sawatzky et al. 2004), was employed in this study to create an assessment of the mineral potential within a greenstone belt terrane that is known to be permissive for gold.
Data Integration into the Prospectivity MapPrevious exploration and underground development in the
Andorinhas greenstone belt by Troy Resources Limited/Rein-arda Mineração Ltda. have provided a large database that can be used for spatial analysis with the objective of targeting high-priority exploration sites in the mine area and regional prospects. Specific exploration criteria were used to define
taBlE 1. Summary of Data Used in the GIS Modeling
Data type Format Source1
Airborne magnetics gradiometric Raster RML/TROYAirborne gamma-ray Raster RML/TROYGeochemistry—stream sediment samples Points RML/TROYGeochemistry—soil samples Points RML/TROYGeochemistry—rock samples Points RML/TROYGeology (lithology) Polygons CPRM (2008)Geology (lithology and structure) Polygons and vectors RML/TROYRemotely sensed data (SRTM) Raster NASA/NGAMineral prospects Points CPRM (2008) RML/TROY
1 RML = Reinarda Mineração Ltda., TROY = Troy Resources Limited, CPRM = Brazilian Geological Survey
taBlE 2. Description of the Fuzzy Operators Used in This Study (Bonham-Carter, 1994).
Operator Description
Fuzzy AND Minimum operator; the output is controlled by the smallest fuzzy membership values at each location; Fuzzy AND results in a conserva-tive estimate of the set membership and has a tendency to produce small values
Fuzzy Algebraic Product The combined fuzzy membership values tend to be small due to the effect of multiplying several numbers less than 1. The output is always smaller than, or equal to, the smallest contributing membership value.
Fuzzy Gamma This operator is defined in terms of the fuzzy algebraic product and the fuzzy algebraic sum, which is a combination of these two operations

1394 COSTA E SILVA ET AL.
the model for the three main block areas, as described in Table 1.
The conceptual model for this region of the Rio Maria Prov-ince is the association of mineralization with high values of K and structural conditioning, based on the descriptions of field-work and studies performed by Huhn (1992), Souza (1994), and Souza et al. (2001). Based on the patterns defined in the descriptive model, it was possible to direct the processing of geological, geophysical, and geochemical datasets to extract
useful information for knowledge-driven spatial analyses. Fig-ure 9 introduces the three main blocks and Table 3 shows the summary of gold exploration criteria for the three main blocks in the descriptive model.
Fuzzification of the evidence layers
After the conceptual model was proposed, fuzzy member-ship values based on expert knowledge were applied to the three main blocks. The fuzzy membership datasets use a
9190
000
9210
000
640 000600 000 620 000
9190
000
9210
000
640 000600 000 620 000
C) D)
0.5560.3080.1810.1310.1020.0830.0690.0500.0430.0320.0270.0220.0180.0120.0090.006
nT/mAS
0.2580.1190.0710.0480.0340.0250.0180.0120.0070.002-0.003-0.014-0.031-0.060-0.112-0.290
DZnT/m
9190
000
9210
000
640 000600 000 620 000
GYnT/m
9190
000
9210
000
640 000600 000 620 000
GXnT/m
0.2450.1460.1000.0720.0540.0320.0180.0100.004-0.002-0.009-0.019-0.041-0.062-0.111-0.189
0.1420.0800.0580.0360.0250.0150.0100.003-0.000-0.005-0.010-0.025-0.037-0.059-0.083-0.147
A)
Mamão Mine
B)
10 Kilometres
N
SAD 69 - UTM Zone 22 South
fig. 7. The main magnetic products used in this approach. A. Gy gradient. B. Gx gradient. C. First derivative from TMI. D. Analytic signal image from TMI.
MINERAL POTENTIAL MAPPING, OROGENIC Au DEPOSITS, RIO MARIA GRANITE-GREENSTONE TERRANE, BRAZIL 1395
9190
000
High %K
High %K
F Parameter
0.3670.2580.2120.1820.1590.1410.1260.1130.1010.0900.0800.0710.0620.0540.0460.0380.0300.0220.014
9210
000
640 000600 000 620 000
High %K
Mamão mine
10 Km
N
SAD 69 - UTM Zone 22 South
9190
000
9210
000
640 000600 000 620 000
Malvinas
WRM
Mamão-Babaçu
Andorinhas greenstone
Rio Maria greenstone
Identidade greenstone
10 Kilometres
N
SAD 69 - UTM Zone 22 South
Gold occurrenceK
eTh eU
fig. 8. F Parameter image showing the K enrichment within the greenstone sequence.
fig. 9. Ternary image overlapping the first derivative image from total magnetic intensity (TMI). The three main mineral-ized blocks are shown corresponding to the greenstone belts, Identidade, Rio Maria, and Andorinhas.

1396 COSTA E SILVA ET AL.
common scale from 0 to 1 (0 = full nonmembership, 1 = full membership of the statement “favorable location for an oro-genic deposit”). Values between 0 and 1 denote the extent of certainty that a given pattern in a cell contains a gold occur-rence. The next step is to integrate all of this information into a single-output fuzzy set, that is, a prospectivity map (also known as a favorability or endowment map), using a variety of fuzzy operators. As in classical set theory, set-theory operations can
be applied to fuzzy sets (Nykänen et al. 2008). In this paper, the Fuzzy algebraic product, Fuzzy AND, Fuzzy categorical, and Fuzzy Gamma operator, which is a combination of Fuzzy algebraic sum and Fuzzy algebraic product, were used. The γ parameter in the Fuzzy Gamma function has values rang-ing from 0 to 1. When the γ parameter is 1, the combination equals the Fuzzy algebraic sum; when the γ parameter is 0, the combination equals the Fuzzy algebraic product.
The fuzzification of the lithology and structures was per-formed using fuzzy categorical membership. Higher mem-bership values were assigned to lithologic formations that were reported to host the gold-bearing deposits (Table 4). In the study area, two different host-rock types associated with mineralization were reported. The first type consists of felsic and mafic units, and the second type includes mafic and iron formation units. A 0.95 fuzzy membership (definitely anoma-lous) value was assigned to the felsic and BIF units followed by metamafic rocks. The newly selected targets are related to both host-rock types.
The lithologic units, such as ultramafic, quartzite, granitoid, and anorogenic granite, were assigned lower values because they were not believed to be significant for gold-bearing deposits. All thematic layers in the GIS database were con-verted to the raster format prior to further processing.
Vector data, such as magnetic lineaments and faults (mapped and interpreted), were transformed to continuous surface maps by dilating (i.e., buffering) around each line in suc-cessive zones from 0 to 200 m (Table 5). In this manner, the spatial association between gold prospects and selected struc-tural features can be analyzed using fuzzy logic to determine whether gold prospects are preferentially located closer to geologic structures. Therefore, higher membership values of 0.95 and 0.5 were respectively assigned to the 0- to 100- and 100- to 200-m structural E-W lineament corridors.
The following structural data were used in the knowledge-driven modeling analysis: (1) deformation zones (NE and NW corridors) interpreted from field observations and airborne
taBlE 3. Summary of Gold Exploration Criteria for the Mamão/Babaçu, West Rio Maria, and Malvinas Blocks
Mamão/Babaçu block
Host rock Mafic rocks (basalts and dolerite)Main structure Thrust shear zoneTrend N70E; E-W conduits for Au-bearing fluidsMagnetics Intermediate magnetic gradientRadiometrics High K in the F Parameter imageTectonic environment Greenstone belt terraneMetamorphic grade Green schist to low amphiboliteInfill Gold in quartz vein + pyrite narrow and
proximalHydrothermal alteration Biotite + silicification + pyrite; minor pirrhotiteHeat activities No evidence; late, small diorite intrusions
unrelated to mineralizationBrittle structures Ore zone displaced by late normal faults
West Rio Maria block
Host rock Mafic rocks (basalts) and felsic rocksMain structure NE shear zone corridorTrend N70E; E-W secondary structuresMagnetics Low magnetic gradientsRadiometrics High K in the F Parameter imageTectonic environment Greenstone belt terraneMetamorphic grade Greenschist to low amphiboliteInfill Quartz vein + chlorite (pyrite low); narrow and
proximalHydrothermal alteration Chlorite + Sericite + Biotite + Pyrite +
SilicificationHeat activities No evidence; rare late small diorite intrusions
unrelated to mineralizationLithologic contacts In contact with felsic rocks; conduits for Au-
bearing fluids
Malvinas block
Host rock Mafic rocks and quartz porphyryMain structure Strike slip shear zone / dipping steeply Trend WNW-ESE; E-W secondary structuresMagnetics Low magnetic gradientsRadiometrics High K in the F Parameter imageTectonic environment Greenstone belt terraneMetamorphic grade Greenschist to low amphiboliteInfill Gold in quartz vein in the contact with mafic
rocks and quartz porphyryHydrothermal alteration Chlorite + biotite + silicification + pyriteBrittle structures Postfault mineralizationLithologic contacts Very important / close to felsic intrusions;
conduits for Au-bearing fluids
taBlE 4. Summary of the Two Lithologic Approaches Used in the Modeling
Model A: Felsic and/or mafic Model B: BIF and/or mafic
Fuzzy FuzzyLithology membership Lithology membership
Felsic 0.95 Felsic 0.4Mafic 0.8 Mafic 0.7Iron formation 0.6 Iron formation 0.95Ultramafic 0.2 Ultramafic 0.5Granite, granitoid, 0.05 Granite, granitoid, 0.05quartzite, phyllite, quartzite, phyllite, siltstone, and graywacke siltstone, and graywacke
taBlE 5. Fuzzy Membership of the Structures
Structures
Distance in meters Fuzzy membership
0–100 0.95 100–200 0.5

MINERAL POTENTIAL MAPPING, OROGENIC Au DEPOSITS, RIO MARIA GRANITE-GREENSTONE TERRANE, BRAZIL 1397
magnetic lineaments, and (2) zones trending to the E-W, ENE-WSW, and ESE-WNW (mapped in the field and inter-preted from the horizontal measured gradients Gx and Gy). After generating dozens of predictive models, the best mod-els, when compared with the known deposits, proved to be those that used only the proximal E-W trends.
Integration of the F Parameter and the measured horizon-tal gradients (Gx and Gy) has shown that known mineralized zones are mapped by high F Parameter values and low mag-netic gradient features. The input layers of the geologic maps, F parameter, K/Th ratio, anomalous K (Kd), eTh channel, Gx and Gy images, and the E-W low gradient zones were used in the fuzzy logic modeling. Each of the desired evidential layers was then combined using one fuzzy operator or a combination of fuzzy operators.
The F Parameter was used to highlight the areas of K enrich-ment, which were assigned a large membership value—Fuzzy large. The K/Th ratio and Kd were similarly used, and a small membership value was assigned to the eTh channel—Fuzzy small. In addition, a small value was used to highlight the low values of the Gx and Gy gradients.
For the magnetic evidence layers, the fuzzy algebraic prod-uct was used to combine the individual element groups. There-fore, the resulting combination of the radiometric elements was achieved using the minimum operator, Fuzzy AND, as an indicator of favorable K enrichment environments. The final combination was performed using the fuzzy Gamma operator with a γ parameter value of 0.90, thereby adding the lithology and main structures.
The integration of parameters into a single prospectivity map was completed using the fuzzy logic overlay method described by Bonham-Carter (1994). The inference networks shown in the models are a concise statement of the exploration model for orogenic gold deposits and clearly define the combination procedure (Fig. 10A-C). The integration was done in steps, and the intermediate maps, together with specific original maps and the final prospectivity map, are shown in Figure 11.
The fuzzification and data integration using the fuzzy operators described above (Table 6), as well as the valida-tion calculations, were carried out using the ArcGIS exten-sion Arc-SDM, as described by Raines et al. (2000), Raines and Bonham-Carter (2006) and, more recently, by Nykänen et al. (2008). The Arc-SDM code is freely downloadable from <http://www.ige.unicamp.br/sdm/default_e.htm>.
To validate the usefulness of the prospectivity maps for identifying potential zones of gold mineralization, we deter-mined the number of known occurrences within zones of
medium to high potential. Several other new targets were also selected over the medium to high favorability area.
The final prospectivity map outlined approximately 57 tar-gets (Fig. 11) in the study area. Two metallogenic approaches were used. The first approach considers orogenic gold deposits hosted with mafic and felsic volcanics. The second approach considers shear zone-hosted veins associated with mafic rocks and iron formations in the greenstone belt terrane. Details of the spatial modeling in the three main mineralized blocks (shown in Fig. 10) are presented below.
Mamão/Babaçu block
An analysis of the results shows that the highest favor-ability of the Mamão-Babaçu area is associated with meta-mafic rocks and, secondarily, lenses of iron formation (Fig. 10A). The majority of prospects, such as the Coruja NE, Luiza, and Piauí deposits, along the northeast corridor are represented by medium and/or high favorability. The model shows that the Mamão mine is situated within a medium favorability domain in the orogenic gold prospectivity map, this classification occurred because the mine area is only asso-ciated with mafic metavolcanics and not iron formations. In addition, the highest fuzzy membership used in the lithology analysis corresponded with iron formations followed by mafic metavolcanics. Approximately 18 targets were selected as medium and/or high favorability areas.
West Rio Maria block
As noted by Raines et al. (2010), after completing the model or models, it is important to validate the results. If there are known examples of the data being modeled (i.e., known deposits), these can be used to test how well the model classifies known examples. Therefore, the model was vali-dated using important historically mined regions, such as the Manoel, Anastácio, Bezerro and Resende targets (Fig. 10B). The area of high favorability in the West Rio Maria block is associated with sheared felsic units hosted in mafic rocks, and the Resende target is associated with sheared granitoids in contact with metamafic units. The model showed ten new areas, three of which are in the granite-greenstone contact. The model also showed several lithologic effects to the west of the Manoel prospect due to the highest potassium values from sediment units.
Malvinas block
Similar to the West Rio Maria block, the modeling analy-sis shows that the highest favorability in the Malvinas block
taBlE 6. Summary of the Evidence Maps Used in the (knowledge-driven) Modeling
Type of evidence Characteristics Fuzzification
Airborne magnetics—Gx and Gy Low gradient features Fuzzy small—small inputs have large membershipAirborne magnetics—analytic signal amplitude Magnetic anomalies Fuzzy large—large inputs have large membershipAirborne gamma-ray-K/eTh; Kd; F Parameter Highlights the K enrichment Fuzzy large—large inputs have large membershipAirborne gamma-ray—eTh Highlights the greenstone belt area Fuzzy small—small inputs have large membershipLithology Different fuzzy membership to host rock units Fuzzy categorical—highest membership (0.95) to iron formations and felsic units, followed by mafic rocksStructure Interpreted from magnetic data; proximal Fuzzy categorical—0−100 m (membership of 0.95) E-W lineaments and NE, NW corridor 100−200 (membership of 0.50)

1398 COSTA E SILVA ET AL.
0.05
0.80
0.60
0.95
0.20
eTh
Lithology
FuzzySmall
Gx
FuzzySmall
GyF Parameter K/eTh
FuzzyLarge
operatorfuzzy AND
operatorProduct
Categoricfuzzy
Kd
operatorfuzzy gamma 0.9
ProspectivityMap
Structures (fuzzy memb.)0 -100 m (0.95)100 - 200 m (0.50)
Manoel
Anastácio
Bezerro
Resende Gilmar
Serrinha
598 000 600 000 602 000 604 000
9192
000
91
90 0
00
02 Kilometres
N
SAD 69 - UTM Zone 22 South
Gerson
Combi
Pirita
Américo
Pampeana
Votuporanga
0.05
0.80
0.60
0.95
0.20
eTh Litology
FuzzySmall
Gx
FuzzySmall
GyF Parameter
FuzzyLarge
operatorfuzzy AND
operatorProduct
Categoricfuzzy
Kd
operatorfuzzy gamma 0.9
ProspectivityMap
Structures (fuzzy memb.)0 -100 m (0.95)100 - 200 m (0.50)
612 000 616 000 620 000 624 000
9204
000
92
00 0
00
02 Kilometres
N
SAD 69 - UTM Zone 22 South
Pirita
LithologyGx
FuzzySmall
GyF Parameter K/eTh
FuzzyLarge
0.05
0.70
0.95
0.40
0.50
ASA
FuzzyLarge
operatorfuzzy AND
operatorfuzzy gamma 0.9
operatorProduct
fuzzyCategoric
Prospectivity Map
Structures (fuzzy memb.)0 -100 m (0.95)100 - 200 m (0.50)eTh
FuzzySmall
624 000 630 000 627 000 633 000
9177
000
91
74 0
00
03 Kilometres
N
SAD 69 - UTM Zone 22 South
South Mamão
Mamão Mine
Lagoa Seca
Marcinho
Junior
Babaçu
C
A
B
0.55 - 0.65
0.0 - 0.45
0.45 - 0.55
0.75 - 0.85
0.65 - 0.75
Operator Fuzzy gamma 0.9Favourability fuzzy
Legend:
fig. 10. The inference network and prospectivity map. Evidence layers and fuzzification type are the same for all blocks, except the inputs highlighted in red. A. Mamão/Babaçu block—the majority of prospects are located within medium and/or high favorability areas. The prospectivity results also identified the known gold occurrences, which are highlighted in black. B. West Rio Maria block—the model highlights previously mined prospects and discovered new targets such as the Resende target. C. Malvinas block—the model highlights important known prospects, such as the Gerson, Combi, Américo, and Pam-peana targets. The model identifies the Votuporanga target, which has been evaluated using field studies and will be subjected to a future drilling test program.

MINERAL POTENTIAL MAPPING, OROGENIC Au DEPOSITS, RIO MARIA GRANITE-GREENSTONE TERRANE, BRAZIL 1399
is associated with felsic intrusive-quartz porphyry. Historic prospects, such as the Gerson, Américo, and Pampeana deposits, are situated within a favorability zone of >0.75. Votu-poranga, which is one of the most important targets that was generated, was also located within an area of high favorability (Fig. 10C). Eight small, new targets were identified in this block as medium and/or high favorability areas.
Validation and Evaluation of the Best Gold Predictors—Drilling Program
The ultimate test of this fuzzy logic model for orogenic gold deposits is the predictive ability of the favorability map. The optimal and most difficult test is whether this prediction leads to new discoveries. According to Raines (1999), practical tests address the following questions: does the fuzzy membership make sense, and are the known orogenic gold deposits located in areas of high favorability?
The geochemical data were used to rank all targets, and the three best ranked targets identified on the basis of the fuzzy logic model were the Marcinho (Mamão/Babaçu block), Resende (WRM block), and Votuporanga (Malvinas block) targets. The Marcinho target is located to the east of the old Marcinho Pit along a WNW-striking corridor approximately 700 m from the Mamão processing plant. The target is con-trolled by NW-SE and NE-SW structures outlined with Gx, Gy, and ISA. The target is associated with low gradient fea-tures in the Gy image.
Field testing was performed using detailed geologic map-ping, sampling of outcrops, soil sampling and, later, drilling. The grid soil sampling (620 samples) over the main targets selected in the Mamão block area highlighted 400 m of an anomalous E-W trend with high grades of up to 2,300 ppm Au. Subsequently, a drilling program, consisting of 15 reverse circulation (RC) holes at a spacing of 50 m along the shear
Mamão Mine
Babaçu
Marcinho
Lagoa SecaEast
Rufino
Manoel
North Serrinha
Resende
Votuporanga
Beroni
Malvinas
0.55 - 0.65
0.0 - 0.45
0.45 - 0.55
0.75 - 0.85
0.65 - 0.75
Operator - Fuzzy gamma 0.9
Favourability fuzzy
Selected targets - high favourability
Greenstone belts
N
10 Km
SAD 69 - UTM Zone 22 South
fig. 11. Final prospectivity map including all individual blocks within the study area.

1400 COSTA E SILVA ET AL.
were planned over the Marcinho target (Fig. 12A). To date, only seven holes have been completed totaling 476.6 m. The holes intersected mafic rocks intercalated with BIFs (Fig. 12B). The shear zones crosscut the host units. Thin lenses of quartz veins and minor to major amounts of sulfides are
associated with gold in an iron formation. Most holes revealed two mineralized intervals at shallow depths. Figure 12B shows the MAC118 cross section. The hole revealed an interval of mineralization from 32 to 38 m downhole with an average of 3.18 g/t Au. This interval is associated with mafic rock and iron
9176
000
91
75 5
00
629 000 628 500 630 000629 500
250 Metres
N
SAD 69 - UTM Zone 22 South
BIF contournLegend
A
Selected target RC drilling holes
Soil - Au PPB
> 250 ppb100 - 250 ppb50 - 100 ppb25 - 50 ppb
< 25 ppb
Rock - Au PPM
> 5 ppm1 - 5 ppm0.5 - 1 ppm0.25 - 0.5 ppm< 0.25 ppm
250 100 50 05 2575150
Soil grid Au ppb
250mRL
200mRL
4.77ppm
8.61ppm
S N
80m
6m @ 3.18 g/t Au from 32m(inc. 1m @ 7.20 g/t Au from 33m)2m @ 7.03 g/t Au from 41m
(inc. 1m @ 12.25 g/t Au from 42m)
Saprolitic metabasalt
Quartz vein
Iron formation
Metabasalt
Legend
MARCINHOCross Section
MARCINHOGeochemical Grid
??
BIF/Qz/Py
B
25 Metres
Drill hole with intercept (Reverse Circulation)
Rock sample (Au ppm)
Interpreted Orebody
fig. 12. A. Surface geochemistry and drilling program over the Marcinho target. B. MAC118 cross section, showing rock units and mineralization. The ore is associated with sulfide in the BIF and quartz veinlets.
MINERAL POTENTIAL MAPPING, OROGENIC Au DEPOSITS, RIO MARIA GRANITE-GREENSTONE TERRANE, BRAZIL 1401
formations and contains 5 to 10% pyrite. Additional promising results included hole MAC116, with narrow lenses of 5.19 g/t Au at shallow levels from 17 to 18 m, and hole MAC117, with 4.02 g/t Au at 23 to 24 m.
Other targets within the Malvinas and West Rio Maria blocks have shown gold potential according to field evalua-tions using rock and soil sampling. The discovery of the most important target area (Resende) within the West Rio Maria block confirmed that the employed methodology was effec-tive in generating targets for follow-up mineral prospecting. In the Resende area, field validation, consisting of geologic reconnaissance, identified two previously mined pits. Three quartz vein float samples taken within the pits and along the strike to the east, returned assay results of 74.32, 29.64, and 1.64 g/t of gold. The best assay received was derived from a sample with visible gold.
Within the Malvinas block, the Votuporanga area was evalu-ated in the field and is considered to be the most important target generated using the fuzzy logic modeling approach. Quartz vein samples collected along the contact of the quartz porphyry and mafic units returned assay results of 18.98, 10.51, 5.48, and 4.25 g/t of gold. Some of the samples had visible gold. Grid soil sampling was carried out and 500 m anomalous trends were delineated. A follow-up RC drilling program has been planned to assess the main target areas for which surface geochemistry has delineated anomalous trends.
Discussion and ConclusionsThis case study demonstrates the practical aspects of a fuzzy
mineral favorability index in identifying exploration targets for orogenic gold deposits in a portion of the Rio Maria granite-greenstone terrane in Brazil. The proposed method identified 57 geologically consistent targets for further detailed explo-ration. According to the final prospectivity maps, many of the most important known gold deposits were located within areas of high favorability, and several other new potential gold targets were identified.
Prior to conducting follow-up work, it is important to evalu-ate the gold prospectivity maps based on how well each map has predicted the known gold prospects. The potential of this map was demonstrated using follow-up evaluations, which led to newly discovered targets, such as the Marcinho, Votu-poranga, and Resende. A follow-up RC drilling program is currently being implemented at the Marcinho target, which exhibits promising grades, and similar programs are proposed for other targets.
Data integration using the GIS and subsequent interpre-tation resulted in the following primary conclusions with respect to the orogenic gold exploration potential in the Rio Maria Province.
1. According to the GIS-based prospectivity analysis, there is considerable potential for orogenic gold deposits along the Andorinhas greenstone belt, and several prospective areas are associated with mafic and iron formation units.
2. Several deposits within the Rio Maria and Identidade greenstone belts are associated with felsic units, as demon-strated by the fuzzy logic models.
3. Many of the previously known targets that were reiden-tified should be reevaluated with a focused research effort to
identify those targets that show the most promise for the dis-covery of a gold deposit.
4. The proposed method identified 57 geologically consis-tent targets and led to the discovery of the Marcinho deposit. RC drilling is planned for other selected targets.
AcknowlegmentsWe gratefully acknowledge the staff of Troy Resources
Limited/Reinarda Mineração Ltda. for their support of this research. We also thank the present and former JV partners, Talon Metals Corp. and Horizonte Minerals, for granting per-mission to publish this paper. In particular, we would like to thank Peter J. Doyle, VP of Troy’s Exploration and Business Development, for his continued support, comments, and use-ful discussions of exploration targeting. The authors wish to thank Paul Benson, Troy’s CEO, for his support. We acknowl-edge the CNPq for a research grant to A. Silva.
REFERENCESAlmeida, J.A.C., Dall’Agnol, R., Oliveira, M.A., Macambira, M.J.B., Pimen-
tel, M.M., Rämö, O.T., Guimarães, F.V., and Leite, A.A.S., 2011, Zircon geochronology, geochemistry and origin of the TTG suites of the Rio Maria granite-greenstone terrane: Implications for the growth of the Archean crust of the Carajás province, Brazil: Precambriam Research, v. 187, p. 201−221.
Althoff, F.J., Barbey, P., and Boullier, A.M., 2000, 2.8–3.0 Ga plutonism and deformation in the SE Amazonian craton: the Archean granitoids of Mara-joara (Carajás mineral province, Brazil): Precambrian Research, v. 104, p. 187–206.
An, P., Moon W.M., and Rencz A., 1991, Application of fuzzy set theory to integrated mineral exploration: Canadian Journal of Exploration Geophys-ics, v. 27, p. 1–11.
An, P., Moon, W.M., and Bonham-Carter, G.F., 1992, On a knowledge-based approach of integrating remote sensing, geophysical and geological infor-mation: International Geoscience and Remote Sensing Symposium ’92, Houston, Texas, Proceedings, p. 34–38.
Araújo, O.J.B., Maia, R.G.N., João, X.S.J., and Costa, J.B.S., 1988, A mega-estruturacao arqueana da Folha Carajás: Inc Simp. Latinoamericano Geol 7, Belém, Sociedade Brasileira de Geologia, Proceedings, v.1, p. 324−333.
Bonham-Carter, G.F., 1994, Geographic information systems for Geoscien-tists: Modelling with GIS: Oxford, Pergamon, 398 p.
Bonham-Carter, G.F., Agterberg, F.P., and Wright, D.F., 1989, Weights of evidence modeling: A new approach to mapping mineral potential: Geo-logical Survey of Canada Paper 89-9, p. 171–183.
Brown, W.M., Gedeon, T.D., Groves, D.I., and Barnes, R.G., 2000, Artificial neural networks: A new method for mineral prospectivity mapping: Austra-lian Journal of Earth Sciences, v. 47, p. 757–770.
Brown, W.M., Gedeon, T.D., and Groves, D.I., 2003, Use of noise to augment training data: A neural network method of mineral-potential mapping in regions of limited known deposits examples: Natural Resources Research, v. 12, p. 141−152.
Carranza, E.J.M., and Hale, M., 2001, Geologically constrained fuzzy map-ping of gold mineralization potential, Baguio district, Philippines: Natural Resources Research, v. 10, p. 125–136.
——2003, Evidential belief functions for geologically constrained mapping of gold potential, Baguio district, Philippines: Ore Geology Reviews, v. 22, p. 117−132.
Dall’Agnol, R., Scaillet, B., and Pichavant, M., 1999, An experimental study of a lower Proterozoic A-type granite from the eastern Amazonian craton, Brazil: Journal of Petrology, v. 40, p. 1673−1698.
Dall’Agnol, R., Oliveira, M.A., Almeida, J.A.C., Althoff, F.J., Leite A.A.S., Oliveira D.C., and Barros C.E.M., 2006, Archean and Paleoproterozoic granitoids of the Carajás metallogenetic province, eastern Amazonian cra-ton: Magmatism, Crustal Evolution and Metallogenesis of the Amazonian Craton Symposium, PRONEX-UFPA/SBG-NO, Abstracts Volume and Field Trips Guide, Belém, Brazil, 150 p.
Docegeo (Rio Doce Geologia e Mineração-Distrito Amazônia), 1988, Revisão litoestratigráfica da província mineral de Carajás, Pará: Sociedade Brasileira de Geologia, Congresso Brasileiro de Geologia, 35, Belém, Brazil, Volume

1402 COSTA E SILVA ET AL.
Província Mineral de Carajás-Litoestratigrafia e Principais Depósitos Mine-rais, Anexos, p. 11−54.
Efimov, A.V., 1978, Multiplikativniyi pokazatel dlja vydelenija endogennych rud aerogamma-spectrometriceskim dannym: Metody rudnoj geofiziki, Leningrado, Naucnoproizvodstvennojc objedinenie geofizica Ed., p. 59−68.
Environmental Systems Research Institute (ESRI), 2009, ArcGIS. Professio-nal GIS for the desktop, versão 9.3.1 CA.
Gastal, M.C.P., 1987, Petrologia do Maçiço Granítico Musa. Sudeste do Pará. Belém: Unpublished M.Sc. thesis, Centro de Geociências, Universidade federal do Pará. 316 p.
Goldfarb, R.J., Miller, L.D., Leach, D.L., and Snee, L.W., 1997, Gold depos-its in metamorphic rocks in Alaska: EConoMiC gEology Monograph 9, p. 151–190.
Goldfarb, R.J., Baker T., Dubé, B., Groves, D.I., Hart, C.J.R., and Gosse-lin, P., 2005, Distribution, character, and genesis of gold deposits in meta-morphic terranes: EConoMiC gEology 100th annivErsary voluME, p. 407−450.
Groves, D.I., Goldfarb, R.J., Gebre-Mariam, M., Hagemann, S.G., and Rob-ert, F., 1998, Orogenic gold deposits: A proposed classification in the con-text of their crustal distribution and relationship to other gold deposit types: Ore Geology Reviews, v. 13, p. 7–27.
Harris, J.R., 1989, Data integration for gold exploration in eastern Nova Sco-tia using a GIS: Thematic Conferences on Remote Sensing for Exploration Geology, 7th, Calgary, Alberta, October 2–6, 1989, Proceedings, p. 233–249.
Harris, J.R., Wilkinson, L., and Broome, J., 1995, Mineral exploration using GIS-based favourability analysis, Swayze greenstone belt, northern Ontario: Canadian Geomatics Conference, National Defense, Proceedings, CD-ROM.
Harris, J.R., Wilkison, L., Heather, K., Fumerton, S., Bernier, M.A., Ayer, J., and Dahn, R., 2001, Application of GIS processing techniques for pro-ducing mineral prospectivity maps—a case study: Mesothermal Au in the Swayze greenstone belt, Ontário, Canada: Natural Resources Research, June 2001, v. 10, p. 91−124.
Harris, J.R., Sanborn-Barrie, M., Panagapko, D., Skulski, T., and Parker, J.R., 2006, Gold prospectivity maps of the Red Lake greenstone belt: Applica-tion of GIS technology: Canadian Journal of Earth Sciences, v. 43, p. 865–893. doi:10.1139/E06−020.
Holdsworth, R.E., and Pinheiro, R.V.L., 2000, The anatomy of shallow-crustal transpressional structurès: Insights from the Archaean Carajás fault zone, Amazon, Brazil: Journal of Structural Geology, v. 22, p. 1105−1124.
Huhn, S.R.B., 1992, Geologia, controle estrutural e gênese do depósito aurí-fero Babaçu, região de Rio Maria, sul do Pará: Unpublished M.Sc. thesis, Brasília, Universidade de Brasília, 169 p.
Jaques, A.L., Wellman, P., Whitaker, A. and Wyborn, D., 1997, High-resolu-tion geophysics in modern geological mapping, Commonwealth of Austra-lia: AGSO Journal of Australian Geology and Geophysics, v. 17, p. 159−173.
Kemp, L.D., Bonham-Carter G.F., Raines G.L., and Looney, C.G, 2001, Arc-SDM and DataXplore-spatial data modeler for Arcview and Spatial Analyst, accessed 30/10/2011, http://gis.nrcan.gc.ca/software/arcview/wofe.
Leite, A.A.S., Dall’Agnol, R., Macambira, M.J.B., and Althoff, F.J., 2004, Geologia e Geocronologia dos granitóides arqueanos da região de Xin-guara–PA e suas implicações na evolução do Terreno Granito-Greenstone de Rio Maria, Cráton Amazônico: Revista Brasileira de Geociências, v. 34, p. 447−458.
Macambira, M.J.B., 1992, Chronologie U/Pb, Rb/Sr, K/Ar et crois-sance de la croûte continentale dans L’Amazonie du sud-est: Exemple de la région de Rio Maria, Province de Carajas, Brésil: Tese de Doutoramento, Mon-tpellier, Université Mont-pellier II-France, 212 p.
Mapinfo, 2008, MapInfo Professional, version 9.5: Pitney Bowes Software Inc., User Guide.
Nascimento, J.S., and Biagini, D.O., 1988, Conhecimento atual da jazida de ouro de Lagoa Seca, sul do Pará: Sociedade Brasileira de Geologia, Congresso Brasileiro de Geologia, 35, Belém, Brazil, Anexo aos Anais, p.143−155.
Nykänen, V., 2008, Spatial data analysis as a tool for mineral prospectivity mapping: Espoo, Geological Survey of Finland, 27 p., 4 figs., table, original articles (I-VI).
Nykänen, V., Groves, D. I., Ojala, V.J., Eilu, P., and Gardolli, S.J., 2008, Reconnaissance-scale conceptual fuzzy-logic prospectivity modelling for iron oxide copper-gold deposits in the northern Fennoscandian Shield, Fin-land: Australian Journal of Earth Sciences, v. 55, p. 25–38.
Oliveira, C.G. 1987, Mineralizações auríferas de Diadema, Pará: Unpubli-shed M.Sc. thesis, Brasília, Universidade de Brasília, 93 p.
Oliveira, M.A., Dall’Agnol, R., Althoff, F.J., and Leite, A.A.S., 2009, Mesoar-chean sanukitoid rocks of the Rio Maria granite-greenstone terrane, Ama-zonian Craton, Brazil: Journal of South American Earth Sciences, v. 27, p. 146−160.
Pan, G.C., 1993, Canonical favorability model for data integration and min-eral potential mapping: Computers and Geoscience, v. 19, p. 1077–1100.
Pan, G., and Harris, D.P., 2000, Information synthesis for mineral explora-tion: New York, Oxford University Press, 461 p.
Pimentel, M.M., and Machado, N., 1994, Geocronologia U-Pb dos terrenos granito-greenstone de Rio Maria, Pará: Boletim de Resumos Expandidos, Camboriú, SBG, v. 1, p. 390−391.
Pires, A.C.B., 1995, Identificação geofísica de áreas de alteração hidrotermal, Crixás-Guarinos, Goiás: Revista Brasileira de Geociências, v. 25, p. 61−68.
Poulsen, K.H., Robert, F., and Dubé, B., 2000, Geological classification of Canadian gold deposits: Geological Survey of Canada Bulletin 540, 106 p.
Profile Analyst, 2010, Profile Analyst Professional, version 11.0., Encom: Pit-ney Bowes Software Inc., User Guide.
Raines, G.L., 1999, Evaluation of weights of evidence to predict epithermal-gold deposits in the Great Basin of the United States: Natural Resources Research, v. 8, p. 257–276.
Raines, G.L., and Bonham-Carter, G.F., 2006, Exploratory spatial modelling demonstration for Carlin-type deposits, Central Nevada, USA, using Arc-SDM: Geological Association of Canada Special Publication 44, p. 23–52.
Raines, G.L., Bonham-Carter, G.F., and Kemp, L.D., 2000, Weights of evi-dence: An arcview extension for predictive probabilistic modeling: ArcUser, ESRI.
Raines, G.L, Sawatzky, D.L, and Bonham-Carter, G.F., 2010, New fuzzy logic tools in ArcGis 10: ArcUser, ESRI, 13 p.
Robert, F., Brommecker, R., Bourne, B. T., Dobak, P. J., Mcewan, C. J., Rowe, R. R., and Zhou, X., 2007, Models and exploration methods for major gold deposit types, in Milkereit, B., ed., Proceedings of Exploration 07: Fifth Decennial International Conference on Mineral Exploration, Toronto, Canada: p. 691−711.
Salleb, A., and Vrain, C., 2000, An application of association rule discovery to geographic information systems: European Conference on Principles and Practice of Knowledge Discovery in Databases, 4th, PKDD 2000, Proceed-ings, p. 613−618.
Sawatzky, D.L., Raines, G.L., Bonham-Carter, G.F., Looney, C.G., and Souza Filho, C.R., 2004, ARCSDM 3.1: ArcMAP extension for spatial data mod-elling using weights of evidence, logistic regression, fuzzy logic and neural network analysis: http://www.ige.unicamp.br/sdm/ArcSDM31/.
Silva, A.M., 1999, Integração de dados geológicos e geofísicos utilizando-se uma nova técnica para seleção de alvos para exploração mineral, aplicada ao greenstone belt Rio das Velhas, Quadrilátero Ferrífero: Unpublished PhD. thesis 29, Instituto de Geociências, Universidade de Brasília, 195 p.
Souza, C.S., 1999, Gênese e controle do depósito aurífero de Lagoa Seca, greenstone belt de Andorinhas, Rio Maria, PA: Unpublished M.Sc. thesis 146, Instituto de Geociências, Universidade de Brasília, 195 p.
Souza, Z.S., 1994, Geologia e petrogênese do “greenstone belt” Identidade: implicações sobre a evolução geodinâmica do terreno granito-“greenstone” de Rio Maria, SE do Pará: Unpublished Ph.D. thesis, Centro de Geociên-cias, Universidade Federal do Pará, 624 p.
Souza, Z.S., Potrel, A., Lafon, J.M., Althoff, F.J., Pimentel, M.M., Dall’Agnol, R., and Oliveira, C.G., 2001, Nd, Pb and isotopes in the Identidade Belt, an Archaean greenstone belt of the Rio Maria region (Carajás Province, Bra-zil): Implications for the Archaean geodynamic evolution of the Amazonian Craton: Precambrian Research, v. 109, p. 293−315.
Surpac Minex Group, 2009, Surpac 6.1.4, Pty. Ltd.: Gemcom Company, Perth, Western Australia, User Manual.
Tassinari, C.C.G., and Macambira, M., 2004, A evolução tectônica do Crá-ton Amazônico, in Mantessi-Neto, V., Bartorelli, A., Carneiro, C.D.R., and Brito Neves, B.B., orgs., Geologia do Continente Sul Americano: Evolução da obra de Fernando Flávio Marques de Almeida. São Paulo: BECA, p. 471−486.
Wright, D.F., and Bonham-Carter, G.F., 1996, VHMS favourability mapping with GIS-based integration models, Chisel Lake-Anderson Lake area: Geo-logical Survey of Canada Bulletin 426, p. 339−376, 387−401.