Embed Size (px)
Citation preview

MINERAL COMMODITY SUMMARIES OF THE CZECH REPUBLIC
2014
STATISTICAL DATA TO 2013
(Data deadline: August 31, 2014)
Czech Geological Survey
October 2014

Compiled by:Jaromír StarýIvo Sitenský
Dalibor MašekTereza Hodková Mirko VaněčekJaroslav NovákAnna HorákováPavel Kavina
Typesetting:Oleg Man
Graphic design:Oleg Man
Ludmila RichterováBudoš Volák
Renata Kachlíková

CONTENTS
EXPLANATORY NOTES . . . . . . . . . . . . . . . . . . . . . . . . . . . . . . . . . . . . . . . . . . . . . . . . 15
List of abbreviations, symbols and technical units . . . . . . . . . . . . . . . . . . . . . . . . . . . . . . . 15
Exchange and inflation rates of currencies in which minerals are priced . . . . . . . . . . . . . . 18 Annual inflation rates (%) in the USA (US), the United Kingdom (UK),
the Euro Area (EUR) and the Czech Republic (CZ) . . . . . . . . . . . . . . . . . . . . . . . . . . . 18 Average yearly exchange rates of CZK against EUR, USD and GBP . . . . . . . . . . . . . . 19
Mineral reserve and resource classification in the Czech Republic and its evolutional comparison with international classifications . . . . . . . . . . . . . . . . . . . . 20 Czech classification . . . . . . . . . . . . . . . . . . . . . . . . . . . . . . . . . . . . . . . . . . . . . . . . . . . . 20 International classifications . . . . . . . . . . . . . . . . . . . . . . . . . . . . . . . . . . . . . . . . . . . . . . 23 Comparison of Czech and international systems of classification . . . . . . . . . . . . . . . . . 26 Conclusions . . . . . . . . . . . . . . . . . . . . . . . . . . . . . . . . . . . . . . . . . . . . . . . . . . . . . . . . . . . 27
INTRODUCTION. . . . . . . . . . . . . . . . . . . . . . . . . . . . . . . . . . . . . . . . . . . . . . . . . . . . . . . 28
MINERAL BASE OF THE CZECH REPUBLIC AND ITS DEVELOPMENT IN 2013 . . . . . . . . . . . . . . . . . . . . . . . . . . . . . . . . . . . . . . . 31
1. Legal framework for mineral resource use . . . . . . . . . . . . . . . . . . . . . . . . . . . . . . . . . 31 1.1. Reserved and non-reserved minerals and their deposits . . . . . . . . . . . . . . . . . . . 31 1.2. Planning, approval and carrying out of mineral prospecting and
exploration . . . . . . . . . . . . . . . . . . . . . . . . . . . . . . . . . . . . . . . . . . . . . . . . . . . . . . 31 1.2.1. Reserved minerals . . . . . . . . . . . . . . . . . . . . . . . . . . . . . . . . . . . . . . . . . . . . . 31 1.2.2. Non-reserved minerals (and their mining) . . . . . . . . . . . . . . . . . . . . . . . . . . 32 1.3. Permit to mine a prospected and explored deposit . . . . . . . . . . . . . . . . . . . . . . . 32 1.4. Royalties on reserved minerals mined . . . . . . . . . . . . . . . . . . . . . . . . . . . . . . . . . 33 1.5. Reserves for mining damages and remediation during the mining
of reserved minerals. . . . . . . . . . . . . . . . . . . . . . . . . . . . . . . . . . . . . . . . . . . . . . . 34 2. Selected statistical data on exploration and mining on the territory
of the Czech Republic . . . . . . . . . . . . . . . . . . . . . . . . . . . . . . . . . . . . . . . . . . . . . . . . . 34 3. Significance of mining in the Czech economy . . . . . . . . . . . . . . . . . . . . . . . . . . . . . . 35 4. Trends of reserves of minerals (economic explored disposable reserves) . . . . . . . . . 35 5. Summary of exploration licences valid in 2012 and newly issued in 2012
(listed according to minerals) – prospecting and exploration works financed by companies . . . . . . . . . . . . . . . . . . . . . . . . . . . . . . . . . . . . . . . . . . . . . . . . . . . . . . . 36
6. State-funded geological projects . . . . . . . . . . . . . . . . . . . . . . . . . . . . . . . . . . . . . . . . . 36 6.1. Economic geology projects . . . . . . . . . . . . . . . . . . . . . . . . . . . . . . . . . . . . . . . . . 36

4
6.2. Other geological projects . . . . . . . . . . . . . . . . . . . . . . . . . . . . . . . . . . . . . . . . . . . 37 7. Summary of selected legal regulations on mineral prospecting
and exploration in force as of June 30, 2014 . . . . . . . . . . . . . . . . . . . . . . . . . . . . . . . 38 7.1. Acts . . . . . . . . . . . . . . . . . . . . . . . . . . . . . . . . . . . . . . . . . . . . . . . . . . . . . . . . . . . 38 7.2. Other legal regulations. . . . . . . . . . . . . . . . . . . . . . . . . . . . . . . . . . . . . . . . . . . . . 38 7.2.1. Mineral deposits exploitation . . . . . . . . . . . . . . . . . . . . . . . . . . . . . . . . . . . . 38 7.2.2. Geological work . . . . . . . . . . . . . . . . . . . . . . . . . . . . . . . . . . . . . . . . . . . . . . 39 7.2.3. Regulations on licensing of mining operations and verification
of qualification . . . . . . . . . . . . . . . . . . . . . . . . . . . . . . . . . . . . . . . . . . . . . . . 39
ECONOMY AND MINERALS . . . . . . . . . . . . . . . . . . . . . . . . . . . . . . . . . . . . . . . . . . . . 40
Development of the Czech and global economies and the importance of minerals . . . . . . . . . . . . . . . . . . . . . . . . . . . . . . . . . . . . . . . . . . . . . . . . . . . . . . . . . . . . . 40 1. Recession in the Czech economy . . . . . . . . . . . . . . . . . . . . . . . . . . . . . . . . . . . . . . . . 40 2. Changes on the demand side . . . . . . . . . . . . . . . . . . . . . . . . . . . . . . . . . . . . . . . . . . . 44 3. Structural changes in the Czech economy . . . . . . . . . . . . . . . . . . . . . . . . . . . . . . . . . 47 The importance of minerals . . . . . . . . . . . . . . . . . . . . . . . . . . . . . . . . . . . . . . . . . . . . 48 4. Global economic development . . . . . . . . . . . . . . . . . . . . . . . . . . . . . . . . . . . . . . . . . . 49 5. Foreign trade and external economic balance . . . . . . . . . . . . . . . . . . . . . . . . . . . . . . 55 Structure of trade . . . . . . . . . . . . . . . . . . . . . . . . . . . . . . . . . . . . . . . . . . . . . . . . . . . . 60 External economic balance . . . . . . . . . . . . . . . . . . . . . . . . . . . . . . . . . . . . . . . . . . . . . 66 Foreign investment and the Czech economy . . . . . . . . . . . . . . . . . . . . . . . . . . . . . . . 69 The importance of foreign capital in the mining and quarrying industry . . . . . . . . . . 72
Glossary of selected economic terms . . . . . . . . . . . . . . . . . . . . . . . . . . . . . . . . . . . . . . . . . 74
Mineral facts . . . . . . . . . . . . . . . . . . . . . . . . . . . . . . . . . . . . . . . . . . . . . . . . . . . . . . . . . . . . 77 Europe’s mineral supplies and EU mineral policy . . . . . . . . . . . . . . . . . . . . . . . . . . . . . . . 77 1. Supply situation . . . . . . . . . . . . . . . . . . . . . . . . . . . . . . . . . . . . . . . . . . . . . . . . . . . . . 77 2. Mineral policy . . . . . . . . . . . . . . . . . . . . . . . . . . . . . . . . . . . . . . . . . . . . . . . . . . . . . . . 79 2.1. Principles – indifference and emphasis on environment . . . . . . . . . . . . . . . . . . . 79 2.2. Supply crises and the rise in China’s importance . . . . . . . . . . . . . . . . . . . . . . . . 80 2.2.1. Lack of concern during the 1980s and 1990s . . . . . . . . . . . . . . . . . . . . . . . . 80 2.2.2. Market forces after 2000 . . . . . . . . . . . . . . . . . . . . . . . . . . . . . . . . . . . . . . . . 80 2.3. EU’s raw material initiative . . . . . . . . . . . . . . . . . . . . . . . . . . . . . . . . . . . . . . . . . 81 2.3.1. The importance of market prices . . . . . . . . . . . . . . . . . . . . . . . . . . . . . . . . . 81 2.3.2. European mineral policy limits . . . . . . . . . . . . . . . . . . . . . . . . . . . . . . . . . . . 82 2.4. The best Mineral Policy may be no specific policy . . . . . . . . . . . . . . . . . . . . . . . 83
Recent trends in the global mining and metals industry . . . . . . . . . . . . . . . . . . . . . . . . . . . 84 The growing importance of China . . . . . . . . . . . . . . . . . . . . . . . . . . . . . . . . . . . . . . . . . 84 The influence of economic activity . . . . . . . . . . . . . . . . . . . . . . . . . . . . . . . . . . . . . . . . . 86 Trends in individual products . . . . . . . . . . . . . . . . . . . . . . . . . . . . . . . . . . . . . . . . . . . . . 88 Changes in London Metal Exchange inventories . . . . . . . . . . . . . . . . . . . . . . . . . . . . . . 91
Contents

5
Prices . . . . . . . . . . . . . . . . . . . . . . . . . . . . . . . . . . . . . . . . . . . . . . . . . . . . . . . . . . . . . . . 91 Profitability . . . . . . . . . . . . . . . . . . . . . . . . . . . . . . . . . . . . . . . . . . . . . . . . . . . . . . . . . . . 93 Exploration spending . . . . . . . . . . . . . . . . . . . . . . . . . . . . . . . . . . . . . . . . . . . . . . . . . . . 95 Regional patterns of minerals output . . . . . . . . . . . . . . . . . . . . . . . . . . . . . . . . . . . . . . . 95 Concluding comment . . . . . . . . . . . . . . . . . . . . . . . . . . . . . . . . . . . . . . . . . . . . . . . . . . . 97
The economic situation of domestic mining companies . . . . . . . . . . . . . . . . . . . . . . . . . . . 98 Mining total . . . . . . . . . . . . . . . . . . . . . . . . . . . . . . . . . . . . . . . . . . . . . . . . . . . . . . . . . . 98 Number of companies . . . . . . . . . . . . . . . . . . . . . . . . . . . . . . . . . . . . . . . . . . . . . . . . . . . 99 Number of employees . . . . . . . . . . . . . . . . . . . . . . . . . . . . . . . . . . . . . . . . . . . . . . . . . . 100 Average number of employees . . . . . . . . . . . . . . . . . . . . . . . . . . . . . . . . . . . . . . . . . . . 101 Sales (CZK million) . . . . . . . . . . . . . . . . . . . . . . . . . . . . . . . . . . . . . . . . . . . . . . . . . . . 102 Average sales (CZK million) . . . . . . . . . . . . . . . . . . . . . . . . . . . . . . . . . . . . . . . . . . . . 102 Book value added (CZK million) . . . . . . . . . . . . . . . . . . . . . . . . . . . . . . . . . . . . . . . . . 103 Labour productivity based on value added (CZK/employee) . . . . . . . . . . . . . . . . . . . . 104 Hourly labour productivity (CZK/working hour) . . . . . . . . . . . . . . . . . . . . . . . . . . . . . 105 Sales per employee (CZK thousand/employee) . . . . . . . . . . . . . . . . . . . . . . . . . . . . . . 105 Average salary (CZK/employee) . . . . . . . . . . . . . . . . . . . . . . . . . . . . . . . . . . . . . . . . . 106 (Value added – salaries) per employee (CZK/employee) . . . . . . . . . . . . . . . . . . . . . . . 106 Index 2013/2009 (book value added – salaries) per employee . . . . . . . . . . . . . . . . . . 108 Bituminous coal . . . . . . . . . . . . . . . . . . . . . . . . . . . . . . . . . . . . . . . . . . . . . . . . . . . . . . 109 Brown coal and lignite . . . . . . . . . . . . . . . . . . . . . . . . . . . . . . . . . . . . . . . . . . . . . . . . . 109 Kaolin . . . . . . . . . . . . . . . . . . . . . . . . . . . . . . . . . . . . . . . . . . . . . . . . . . . . . . . . . . . . . . .110 Clays and bentonite . . . . . . . . . . . . . . . . . . . . . . . . . . . . . . . . . . . . . . . . . . . . . . . . . . . . .111 Feldspar . . . . . . . . . . . . . . . . . . . . . . . . . . . . . . . . . . . . . . . . . . . . . . . . . . . . . . . . . . . . . .112 Glass sand . . . . . . . . . . . . . . . . . . . . . . . . . . . . . . . . . . . . . . . . . . . . . . . . . . . . . . . . . . . .112 Foundry sand . . . . . . . . . . . . . . . . . . . . . . . . . . . . . . . . . . . . . . . . . . . . . . . . . . . . . . . . .113 Limestone and corrective additives for cement production and dolomite . . . . . . . . . . .114 Dimension stone . . . . . . . . . . . . . . . . . . . . . . . . . . . . . . . . . . . . . . . . . . . . . . . . . . . . . . .115 Crushed stone . . . . . . . . . . . . . . . . . . . . . . . . . . . . . . . . . . . . . . . . . . . . . . . . . . . . . . . . .115 Sand and gravel . . . . . . . . . . . . . . . . . . . . . . . . . . . . . . . . . . . . . . . . . . . . . . . . . . . . . . .116 Brick clays and related minerals . . . . . . . . . . . . . . . . . . . . . . . . . . . . . . . . . . . . . . . . . . .117 Other minerals (uranium + crude oil + graphite + gemstones + silica
minerals + gypsum) . . . . . . . . . . . . . . . . . . . . . . . . . . . . . . . . . . . . . . . . . . . . . . . . . . . .117
Outline of domestic mine production . . . . . . . . . . . . . . . . . . . . . . . . . . . . . . . . . . . . . . . . .119
Domestic share in the world mine production . . . . . . . . . . . . . . . . . . . . . . . . . . . . . . . . . 120
ENVIRONMENT AND MINERALS . . . . . . . . . . . . . . . . . . . . . . . . . . . . . . . . . . . . . . 121 Mining and nature protection . . . . . . . . . . . . . . . . . . . . . . . . . . . . . . . . . . . . . . . . . . . . . . 121 Specially protected areas (ZCHÚ) in the Czech Republic . . . . . . . . . . . . . . . . . . . . . . 121 Structure of ZCHÚ in 2013 . . . . . . . . . . . . . . . . . . . . . . . . . . . . . . . . . . . . . . . . . . . . . 122 Mining of reserved and non-reserved mineral deposits in CHKO, kt . . . . . . . . . . . . . 122 Mining of reserved and non-reserved mineral deposits in individual CHKO, kt . . . . . 123
Contents

6
Impact of mining of reserved deposits in CHKO, t/km2 in a year . . . . . . . . . . . . . . . . 124 Development of reclamations after mining . . . . . . . . . . . . . . . . . . . . . . . . . . . . . . . . . 126 Reclamation after mining of reserved minerals in 2013 . . . . . . . . . . . . . . . . . . . . . . . . 126 Share of specially Protected Areas of the Czech Republic nature
(zvláště chráněná území přírody České republiky (ZCHÚs)) established in localities with former mining (“after mining”) in all the ZCHÚs . . . . . . . . . . . . . . 131
Eliminating negative consequences of mining in the Czech Republic – main methods and financial resources . . . . . . . . . . . . . . . . . . . . . . . . . . . . . . . . . . . . . . . 132 Introduction . . . . . . . . . . . . . . . . . . . . . . . . . . . . . . . . . . . . . . . . . . . . . . . . . . . . . . . . . . 132 1. Use of funds from a financial reserve generated by mining companies
for remediation, reclamation and mining damages . . . . . . . . . . . . . . . . . . . . . . . . . . 132 Financial reserve for remediation and reclamation. . . . . . . . . . . . . . . . . . . . . . . . 132 Generated and drawn reserves for remediation and reclamation (in CZK thousand) . . . . . . . . . . . . . . . . . . . . . . . . . . . . . . . . . . . . . . . . . . . . . . . . 133 Financial reserve for mining damages . . . . . . . . . . . . . . . . . . . . . . . . . . . . . . . . . 134 Generated and drawn reserves for mining damages (in CZK thousand) . . . . . . . 134 2. Use of funds from annual royalties paid by mining companies on mining
leases and on extracted reserved minerals pursuant to the Mining Act . . . . . . . . . . 135 Royalties on mining leases . . . . . . . . . . . . . . . . . . . . . . . . . . . . . . . . . . . . . . . . . . 135 Royalties from mining lease areas paid out to municipalities pursuant
to article 32a) sect. 1 of the Mining Act (in CZK thousand) . . . . . . . . . . . . . . . . 135 Royalties on extracted reserved minerals . . . . . . . . . . . . . . . . . . . . . . . . . . . . . . . 136 Distribution of royalties on extracted reserved minerals pursuant
to sect. 32a) par. 4 of the Mining Act (in CZK thousand) . . . . . . . . . . . . . . . . . . 137 3. Phase-out programme of mining activities and erasing consequences
of coal, ore and uranium mining funded by the national sources . . . . . . . . . . . . . . . 137 Use of national sources subsidies for the phase-out of mining and to erase
consequences of mining and mandatory social health expenses (in CZK million) . . . . . . . . . . . . . . . . . . . . . . . . . . . . . . . . . . . . . . . . . . . . . . . . . . 139
4. Use of proceeds from privatisation of state assets in eliminating old ecological burdens originated prior to privatisation of mining companies . . . . . . . 140
Overview of entities with which “ecological contracts” were entered into, including guaranteed financial sums and their actual amount drawn (in CZK) – as of 31. 8. 2014 . . . . . . . . . . . . . . . . . . . . . . . . . . . . . . . . . . . . . . . . . 140
5. A programme dealing with ecological damage caused prior to privatisation of brown coal mining companies in the Ústí nad Labem Region and the Karlovy Vary Region, with ecological revitalisation upon termination of mining in the Moravian-Silesian Region, with eliminating ecological burdens caused by the exploration for and extraction of crude oil and natural gas in designated areas of the South Moravian Region . . . . . . . . . . . . . . . . . . . . . . 141
Dealing with ecological damage created prior to privatisation of brown coal mining companies in the Ústí nad Labem Region and the Karlovy Vary Region . . . . . . . . . . . . . . . . . . . . . . . . . . . . . . . . . . . . . . . . 142 List of companies included in the programme plan . . . . . . . . . . . . . . . . . . . . . 142
Contents

7
List of regions (projects of cities and municipalities) included in the programme plan: . . . . . . . . . . . . . . . . . . . . . . . . . . . . . . . . . . . . . . . . . . . 142
Projects concluded and projects in progress (in CZK) . . . . . . . . . . . . . . . . . . . 143 Revitalisation of the Moravian-Silesian and South Moravian Region . . . . . . . . . 143 Categories of priority projects, approved by the Government,
which deal with eliminating environmental damage caused by mineral mining in the Moravian-Silesian and South Moravian Region . . . . . . . . . . . . 143
Projects concluded (in CZK) – as 31 . 12 . 2013 . . . . . . . . . . . . . . . . . . . . . . . . 144 Projects in progress (in CZK) . . . . . . . . . . . . . . . . . . . . . . . . . . . . . . . . . . . . . 146 Reducing impacts caused by the termination of coal mining in the Kladno Region . . . . . . . . . . . . . . . . . . . . . . . . . . . . . . . . . . . . . . . . . . . . 149 Projects concluded (in CZK) . . . . . . . . . . . . . . . . . . . . . . . . . . . . . . . . . . . . . . 150 Projects in progress (in CZK) . . . . . . . . . . . . . . . . . . . . . . . . . . . . . . . . . . . . . . 150 6 . Sources of European Union – Operational Programme Environment
(administered by the Ministry of Industry and Trade) . . . . . . . . . . . . . . . . . . . . . . . 150
GEOLOGY AND MINERALS . . . . . . . . . . . . . . . . . . . . . . . . . . . . . . . . . . . . . . . . . . . 152
Geological evolution of the area of the Czech Republic . . . . . . . . . . . . . . . . . . . . . . . . . 152 Geological position of the Czech Republic in Europe . . . . . . . . . . . . . . . . . . . . . . . . . 153 Geology of the Czech Republic . . . . . . . . . . . . . . . . . . . . . . . . . . . . . . . . . . . . . . . . . . 155 Regional basement division of the Bohemian Massif on the territory
of the Czech Republic . . . . . . . . . . . . . . . . . . . . . . . . . . . . . . . . . . . . . . . . . . . . . . . . . . 155 Carboniferous and Permian in the Bohemian Massif and in the basement
of the Western Carpathia on the territory of the Czech Republic . . . . . . . . . . . . . . . . . 158 Upper Cretaceous in the Bohemian Massif on the territory of the Czech Republic . . . . . . . . . . . . . . . . . . . . . . . . . . . . . . . . . . . . . . . . . . . . . . . . . . . . . . . . . . . . 160 Tertiary in the Bohemian Massif and Western Carpathians on the territory
of the Czech Republic . . . . . . . . . . . . . . . . . . . . . . . . . . . . . . . . . . . . . . . . . . . . . . . . . . 161 Quaternary division on the territory of the Czech Republic . . . . . . . . . . . . . . . . . . . . . 162
Regional geological units and minerals associated with them . . . . . . . . . . . . . . . . . . . . . 164
Geodynamics of the origin of the Bohemian Massif covering the territory of the Czech Republic . . . . . . . . . . . . . . . . . . . . . . . . . . . . . . . . . . . . . . . . . . . . . . . . . . . . 169 Present day architecture of the Bohemian Massif and location of Palaeozoic sutures . . . . . . . . . . . . . . . . . . . . . . . . . . . . . . . . . . . . . . . . . . . . . . . . . . . . . . . . . . . . . 169 Geodynamic evolution of the Bohemian Massif . . . . . . . . . . . . . . . . . . . . . . . . . . . . . 174
MINERALS CURRENTLY MINED IN THE CZECH REPUBLIC . . . . . . . . . . . . 180 ENERGY MINERALS . . . . . . . . . . . . . . . . . . . . . . . . . . . . . . . . . . . . . . . . . . . . . . . . . 180
Bituminous coal . . . . . . . . . . . . . . . . . . . . . . . . . . . . . . . . . . . . . . . . . . . . . . . . . . . . . . . . 180 1 . Registered deposits and other resources of the Czech Republic . . . . . . . . . . . . . . . 180 2 . Basic statistical data of the Czech Republic as of December 31 . . . . . . . . . . . . . . . 181
Contents

8
3. Foreign trade . . . . . . . . . . . . . . . . . . . . . . . . . . . . . . . . . . . . . . . . . . . . . . . . . . . . . . . 181 4. Prices of domestic market . . . . . . . . . . . . . . . . . . . . . . . . . . . . . . . . . . . . . . . . . . . . . 182 5. Mining companies in the Czech Republic as of December 31, 2013 . . . . . . . . . . . . 183 6. World production and world market prices . . . . . . . . . . . . . . . . . . . . . . . . . . . . . . . 183Brown coal . . . . . . . . . . . . . . . . . . . . . . . . . . . . . . . . . . . . . . . . . . . . . . . . . . . . . . . . . . . . 186 1. Registered deposits and other resources of the Czech Republic . . . . . . . . . . . . . . . 186 2. Basic statistical data of the Czech Republic as of December 31 . . . . . . . . . . . . . . . 188 3. Foreign trade . . . . . . . . . . . . . . . . . . . . . . . . . . . . . . . . . . . . . . . . . . . . . . . . . . . . . . . 188 4. Prices of domestic market . . . . . . . . . . . . . . . . . . . . . . . . . . . . . . . . . . . . . . . . . . . . . 189 5. Mining companies in the Czech Republic as of December 31, 2013 . . . . . . . . . . . . 190 6. World production and world market prices . . . . . . . . . . . . . . . . . . . . . . . . . . . . . . . 190Crude oil . . . . . . . . . . . . . . . . . . . . . . . . . . . . . . . . . . . . . . . . . . . . . . . . . . . . . . . . . . . . . . 192 1. Registered deposits and other resources of the Czech Republic . . . . . . . . . . . . . . . 192 2. Basic statistical data of the Czech Republic as of December 31 . . . . . . . . . . . . . . . 193 3. Foreign trade . . . . . . . . . . . . . . . . . . . . . . . . . . . . . . . . . . . . . . . . . . . . . . . . . . . . . . . 193 4. Prices of domestic market . . . . . . . . . . . . . . . . . . . . . . . . . . . . . . . . . . . . . . . . . . . . . 194 5. Mining companies in the Czech Republic as of December 31, 2013 . . . . . . . . . . . . 194 6. World production and world market prices . . . . . . . . . . . . . . . . . . . . . . . . . . . . . . . 195Natural gas . . . . . . . . . . . . . . . . . . . . . . . . . . . . . . . . . . . . . . . . . . . . . . . . . . . . . . . . . . . . 197 1. Registered deposits and other resources of the Czech Republic . . . . . . . . . . . . . . . 197 2. Basic statistical data of the Czech Republic as of December 31 . . . . . . . . . . . . . . . 198 3. Foreign trade . . . . . . . . . . . . . . . . . . . . . . . . . . . . . . . . . . . . . . . . . . . . . . . . . . . . . . . 198 4. Prices of domestic market . . . . . . . . . . . . . . . . . . . . . . . . . . . . . . . . . . . . . . . . . . . . . 199 5. Mining companies in the Czech Republic as of December 31, 2013 . . . . . . . . . . . . 200 6. World production and world market prices . . . . . . . . . . . . . . . . . . . . . . . . . . . . . . . 200Uranium . . . . . . . . . . . . . . . . . . . . . . . . . . . . . . . . . . . . . . . . . . . . . . . . . . . . . . . . . . . . . . 202 1. Registered deposits and other resources of the Czech Republic . . . . . . . . . . . . . . . 202 2. Basic statistical data of the Czech Republic as of December 31 . . . . . . . . . . . . . . . 203 3. Foreign trade . . . . . . . . . . . . . . . . . . . . . . . . . . . . . . . . . . . . . . . . . . . . . . . . . . . . . . . 204 4. Prices of domestic market . . . . . . . . . . . . . . . . . . . . . . . . . . . . . . . . . . . . . . . . . . . . . 204 5. Mining companies in the Czech Republic as of December 31, 2013 . . . . . . . . . . . . 204 6. World production and world market prices . . . . . . . . . . . . . . . . . . . . . . . . . . . . . . . 204
INDUSTRIAL MINERALS . . . . . . . . . . . . . . . . . . . . . . . . . . . . . . . . . . . . . . . . . . . . . . 207
Bentonite . . . . . . . . . . . . . . . . . . . . . . . . . . . . . . . . . . . . . . . . . . . . . . . . . . . . . . . . . . . . . . 207 1. Registered deposits and other resources of the Czech Republic . . . . . . . . . . . . . . . 207 2. Basic statistical data of the Czech Republic as of December 31 . . . . . . . . . . . . . . . 208 3. Foreign trade . . . . . . . . . . . . . . . . . . . . . . . . . . . . . . . . . . . . . . . . . . . . . . . . . . . . . . . 208 4. Prices of domestic market . . . . . . . . . . . . . . . . . . . . . . . . . . . . . . . . . . . . . . . . . . . . . 209 5. Mining companies in the Czech Republic as of December 31, 2013 . . . . . . . . . . . . 209 6. World production and world market prices . . . . . . . . . . . . . . . . . . . . . . . . . . . . . . . 209Clays . . . . . . . . . . . . . . . . . . . . . . . . . . . . . . . . . . . . . . . . . . . . . . . . . . . . . . . . . . . . . . .211 1. Registered deposits and other resources of the Czech Republic . . . . . . . . . . . . . . . .211 2. Basic statistical data of the Czech Republic as of December 31 . . . . . . . . . . . . . . . 212 3. Foreign trade . . . . . . . . . . . . . . . . . . . . . . . . . . . . . . . . . . . . . . . . . . . . . . . . . . . . . . . 212
Contents

9
4. Prices of domestic market . . . . . . . . . . . . . . . . . . . . . . . . . . . . . . . . . . . . . . . . . . . . . 214 5. Mining companies in the Czech Republic as of December 31, 2013 . . . . . . . . . . . . 214 6. World production and world market prices . . . . . . . . . . . . . . . . . . . . . . . . . . . . . . . 214Diatomite . . . . . . . . . . . . . . . . . . . . . . . . . . . . . . . . . . . . . . . . . . . . . . . . . . . . . . . . . . . . . . 217 1. Registered deposits and other resources of the Czech Republic . . . . . . . . . . . . . . . 217 2. Basic statistical data of the Czech Republic as of December 31 . . . . . . . . . . . . . . . 217 3. Foreign trade . . . . . . . . . . . . . . . . . . . . . . . . . . . . . . . . . . . . . . . . . . . . . . . . . . . . . . . 218 4. Prices of domestic market . . . . . . . . . . . . . . . . . . . . . . . . . . . . . . . . . . . . . . . . . . . . . 218 5. Mining companies in the Czech Republic as of December 31, 2013 . . . . . . . . . . . . 218 6. World production and world market prices . . . . . . . . . . . . . . . . . . . . . . . . . . . . . . . 219Dolomite . . . . . . . . . . . . . . . . . . . . . . . . . . . . . . . . . . . . . . . . . . . . . . . . . . . . . . . . . . . . . . 220 1. Registered deposits and other resources of the Czech Republic . . . . . . . . . . . . . . . 220 2. Basic statistical data of the Czech Republic as of December 31 . . . . . . . . . . . . . . . 221 3. Foreign trade . . . . . . . . . . . . . . . . . . . . . . . . . . . . . . . . . . . . . . . . . . . . . . . . . . . . . . . 221 4. Prices of domestic market . . . . . . . . . . . . . . . . . . . . . . . . . . . . . . . . . . . . . . . . . . . . . 222 5. Mining companies in the Czech Republic as of December 31, 2013 . . . . . . . . . . . . 222 6. World production and world market prices . . . . . . . . . . . . . . . . . . . . . . . . . . . . . . . 222Feldspar . . . . . . . . . . . . . . . . . . . . . . . . . . . . . . . . . . . . . . . . . . . . . . . . . . . . . . . . . . . . . . 223 1. Registered deposits and other resources of the Czech Republic . . . . . . . . . . . . . . . 223 2. Basic statistical data of the Czech Republic as of December 31 . . . . . . . . . . . . . . . 224 3. Foreign trade . . . . . . . . . . . . . . . . . . . . . . . . . . . . . . . . . . . . . . . . . . . . . . . . . . . . . . . 225 4. Prices of domestic market . . . . . . . . . . . . . . . . . . . . . . . . . . . . . . . . . . . . . . . . . . . . . 226 5. Mining companies in the Czech Republic as of December 31, 2013 . . . . . . . . . . . . 226 6. World production and world market prices . . . . . . . . . . . . . . . . . . . . . . . . . . . . . . . 226Gemstones . . . . . . . . . . . . . . . . . . . . . . . . . . . . . . . . . . . . . . . . . . . . . . . . . . . . . . . . . . . . . 228 1. Registered deposits and other resources of the Czech Republic . . . . . . . . . . . . . . . 228 2. Basic statistical data of the Czech Republic as of December 31 . . . . . . . . . . . . . . . 229 3. Foreign trade . . . . . . . . . . . . . . . . . . . . . . . . . . . . . . . . . . . . . . . . . . . . . . . . . . . . . . . 230 4. Prices of domestic market . . . . . . . . . . . . . . . . . . . . . . . . . . . . . . . . . . . . . . . . . . . . . 231 5. Mining companies in the Czech Republic as of December 31, 2013 . . . . . . . . . . . . 232 6. World production and world market prices . . . . . . . . . . . . . . . . . . . . . . . . . . . . . . . 232Gypsum . . . . . . . . . . . . . . . . . . . . . . . . . . . . . . . . . . . . . . . . . . . . . . . . . . . . . . . . . . . . . . 235 1. Registered deposits and other resources of the Czech Republic . . . . . . . . . . . . . . . 235 2. Basic statistical data of the Czech Republic as of December 31 . . . . . . . . . . . . . . . 236 3. Foreign trade . . . . . . . . . . . . . . . . . . . . . . . . . . . . . . . . . . . . . . . . . . . . . . . . . . . . . . . 236 4. Prices of domestic market . . . . . . . . . . . . . . . . . . . . . . . . . . . . . . . . . . . . . . . . . . . . . 237 5. Mining companies in the Czech Republic as of December 31, 2013 . . . . . . . . . . . . 237 6. World production and world market prices . . . . . . . . . . . . . . . . . . . . . . . . . . . . . . . 237Industrial sands . . . . . . . . . . . . . . . . . . . . . . . . . . . . . . . . . . . . . . . . . . . . . . . . . . . . . . . . . 238 1. Registered deposits and other resources of the Czech Republic . . . . . . . . . . . . . . . 238 2. Basic statistical data of the Czech Republic as of December 31 . . . . . . . . . . . . . . . 239 3. Foreign trade . . . . . . . . . . . . . . . . . . . . . . . . . . . . . . . . . . . . . . . . . . . . . . . . . . . . . . . 240 4. Prices of domestic market . . . . . . . . . . . . . . . . . . . . . . . . . . . . . . . . . . . . . . . . . . . . . 240 5. Mining companies in the Czech Republic as of December 31, 2013 . . . . . . . . . . . . 241 6. World production and world market prices . . . . . . . . . . . . . . . . . . . . . . . . . . . . . . . 241Kaolin . . . . . . . . . . . . . . . . . . . . . . . . . . . . . . . . . . . . . . . . . . . . . . . . . . . . . . . . . . . . . . 242
Contents

10
1. Registered deposits and other resources of the Czech Republic . . . . . . . . . . . . . . . 242 2. Basic statistical data of the Czech Republic as of December 31 . . . . . . . . . . . . . . . 243 3. Foreign trade . . . . . . . . . . . . . . . . . . . . . . . . . . . . . . . . . . . . . . . . . . . . . . . . . . . . . . . 245 4. Prices of domestic market . . . . . . . . . . . . . . . . . . . . . . . . . . . . . . . . . . . . . . . . . . . . . 246 5. Mining companies in the Czech Republic as of December 31, 2013 . . . . . . . . . . . . 246 6. World production and world market prices . . . . . . . . . . . . . . . . . . . . . . . . . . . . . . . 247Limestones and corrective additives for cement production . . . . . . . . . . . . . . . . . . . . . . 248 1. Registered deposits and other resources of the Czech Republic . . . . . . . . . . . . . . . 248 2. Basic statistical data of the Czech Republic as of December 31 . . . . . . . . . . . . . . . 249 3. Foreign trade . . . . . . . . . . . . . . . . . . . . . . . . . . . . . . . . . . . . . . . . . . . . . . . . . . . . . . . 252 4. Prices of domestic market . . . . . . . . . . . . . . . . . . . . . . . . . . . . . . . . . . . . . . . . . . . . . 253 5. Mining companies in the Czech Republic as of December 31, 2013 . . . . . . . . . . . . 253 6. World production and world market prices . . . . . . . . . . . . . . . . . . . . . . . . . . . . . . . 254Silica minerals . . . . . . . . . . . . . . . . . . . . . . . . . . . . . . . . . . . . . . . . . . . . . . . . . . . . . . . . . . 256 1. Registered deposits and other resources of the Czech Republic . . . . . . . . . . . . . . . 256 2. Basic statistical data of the Czech Republic as of December 31 . . . . . . . . . . . . . . . 257 3. Foreign trade . . . . . . . . . . . . . . . . . . . . . . . . . . . . . . . . . . . . . . . . . . . . . . . . . . . . . . . 257 4. Prices of domestic market . . . . . . . . . . . . . . . . . . . . . . . . . . . . . . . . . . . . . . . . . . . . . 258 5. Mining companies in the Czech Republic as of December 31, 2013 . . . . . . . . . . . . 258 6. World production and world market prices . . . . . . . . . . . . . . . . . . . . . . . . . . . . . . . 258
CONSTRUCTION MINERALS . . . . . . . . . . . . . . . . . . . . . . . . . . . . . . . . . . . . . . . . . . 260
Aggregates . . . . . . . . . . . . . . . . . . . . . . . . . . . . . . . . . . . . . . . . . . . . . . . . . . . . . . . . . . . . 260 Aggregates market analysis of selected countries in Central Europe . . . . . . . . . . . . . . 260 1. Introduction & market description . . . . . . . . . . . . . . . . . . . . . . . . . . . . . . . . . . . . 260 1.1 Gravel & sand, crushed stone: general market dynamics . . . . . . . . . . . . . . . 260 1.2 Market research: applied methodology . . . . . . . . . . . . . . . . . . . . . . . . . . . . . 261 2. Market analysis . . . . . . . . . . . . . . . . . . . . . . . . . . . . . . . . . . . . . . . . . . . . . . . . . . 261 2.1 Countrywise market research and analysis: EU . . . . . . . . . . . . . . . . . . . . . . . 261 2.1.1 Sand and gravel . . . . . . . . . . . . . . . . . . . . . . . . . . . . . . . . . . . . . . . . . . . . 261 2.1.2 Crushed stones . . . . . . . . . . . . . . . . . . . . . . . . . . . . . . . . . . . . . . . . . . . . 265Crushed stone . . . . . . . . . . . . . . . . . . . . . . . . . . . . . . . . . . . . . . . . . . . . . . . . . . . . . . . . . . 270 1. Registered deposits and other resources of the Czech Republic . . . . . . . . . . . . . . . 270 2. Basic statistical data of the Czech Republic as of December 31 . . . . . . . . . . . . . . . 271 3. Foreign trade . . . . . . . . . . . . . . . . . . . . . . . . . . . . . . . . . . . . . . . . . . . . . . . . . . . . . . . 272 4. Prices of domestic market . . . . . . . . . . . . . . . . . . . . . . . . . . . . . . . . . . . . . . . . . . . . . 272 5. Mining companies in the Czech Republic as of December 31, 2013 . . . . . . . . . . . . 275 6. World production and world market prices . . . . . . . . . . . . . . . . . . . . . . . . . . . . . . . 276Sand and gravel . . . . . . . . . . . . . . . . . . . . . . . . . . . . . . . . . . . . . . . . . . . . . . . . . . . . . . . . . 277 1. Registered deposits and other resources of the Czech Republic . . . . . . . . . . . . . . . 277 2. Basic statistical data of the Czech Republic as of December 31 . . . . . . . . . . . . . . . 278 3. Foreign trade . . . . . . . . . . . . . . . . . . . . . . . . . . . . . . . . . . . . . . . . . . . . . . . . . . . . . . . 279 4. Prices of domestic market . . . . . . . . . . . . . . . . . . . . . . . . . . . . . . . . . . . . . . . . . . . . . 279 5. Mining companies in the Czech Republic as of December 31, 2013 . . . . . . . . . . . . 279 6. World production and world market prices . . . . . . . . . . . . . . . . . . . . . . . . . . . . . . . 281
Contents

11Contents
Brick clays and related minerals . . . . . . . . . . . . . . . . . . . . . . . . . . . . . . . . . . . . . . . . . . . . 282 1. Registered deposits and other resources of the Czech Republic . . . . . . . . . . . . . . . 282 2. Basic statistical data of the Czech Republic as of December 31 . . . . . . . . . . . . . . . 283 3. Foreign trade . . . . . . . . . . . . . . . . . . . . . . . . . . . . . . . . . . . . . . . . . . . . . . . . . . . . . . . 284 4. Prices of domestic market . . . . . . . . . . . . . . . . . . . . . . . . . . . . . . . . . . . . . . . . . . . . . 284 5. Mining companies in the Czech Republic as of December 31, 2013 . . . . . . . . . . . . 285 6. World production and world market prices . . . . . . . . . . . . . . . . . . . . . . . . . . . . . . . 285Dimension stone . . . . . . . . . . . . . . . . . . . . . . . . . . . . . . . . . . . . . . . . . . . . . . . . . . . . . . . . 286 1. Registered deposits and other resources of the Czech Republic . . . . . . . . . . . . . . . 286 2. Basic statistical data of the Czech Republic as of December 31 . . . . . . . . . . . . . . . 287 3. Foreign trade . . . . . . . . . . . . . . . . . . . . . . . . . . . . . . . . . . . . . . . . . . . . . . . . . . . . . . . 288 4. Prices of domestic market . . . . . . . . . . . . . . . . . . . . . . . . . . . . . . . . . . . . . . . . . . . . . 290 5. Mining companies in the Czech Republic as of December 31, 2013 . . . . . . . . . . . . 290 6. World production and world market prices . . . . . . . . . . . . . . . . . . . . . . . . . . . . . . . 291
MINERALS CURRENTLY UNMINED IN THE CZECH REPUBLIC . . . . . . . . . . 294
MINERALS MINED IN THE PAST WITH RESOURCES AND RESERVES . . . . . . . . . . . . . . . . . . . . . . . . . . . . . . . . . . . . . . . . . . . . . . . . . . . . . . 294 ENERGY MINERALS . . . . . . . . . . . . . . . . . . . . . . . . . . . . . . . . . . . . . . . . . . . . . . . . . 294
Lignite . . . . . . . . . . . . . . . . . . . . . . . . . . . . . . . . . . . . . . . . . . . . . . . . . . . . . . . . . . . . . . 294 1. Registered deposits and other resources of the Czech Republic . . . . . . . . . . . . . . . 294 2. Basic statistical data of the Czech Republic as of December 31 . . . . . . . . . . . . . . . 295 3. Foreign trade . . . . . . . . . . . . . . . . . . . . . . . . . . . . . . . . . . . . . . . . . . . . . . . . . . . . . . . 295 4. World production and world market prices . . . . . . . . . . . . . . . . . . . . . . . . . . . . . . . 295
INDUSTRIAL MINERALS . . . . . . . . . . . . . . . . . . . . . . . . . . . . . . . . . . . . . . . . . . . . . . 296
Barite . . . . . . . . . . . . . . . . . . . . . . . . . . . . . . . . . . . . . . . . . . . . . . . . . . . . . . . . . . . . . . 296 1. Registered deposits and other resources of the Czech Republic . . . . . . . . . . . . . . . 296 2. Basic statistical data of the Czech Republic as of December 31 . . . . . . . . . . . . . . . 297 3. Foreign trade . . . . . . . . . . . . . . . . . . . . . . . . . . . . . . . . . . . . . . . . . . . . . . . . . . . . . . . 297 4. World production and world market prices . . . . . . . . . . . . . . . . . . . . . . . . . . . . . . . 298Fluorspar . . . . . . . . . . . . . . . . . . . . . . . . . . . . . . . . . . . . . . . . . . . . . . . . . . . . . . . . . . . . . . 300 1. Registered deposits and other resources of the Czech Republic . . . . . . . . . . . . . . . 300 2. Basic statistical data of the Czech Republic as of December 31 . . . . . . . . . . . . . . . 301 3. Foreign trade . . . . . . . . . . . . . . . . . . . . . . . . . . . . . . . . . . . . . . . . . . . . . . . . . . . . . . . 301 4. World production and world market prices . . . . . . . . . . . . . . . . . . . . . . . . . . . . . . . 302Graphite . . . . . . . . . . . . . . . . . . . . . . . . . . . . . . . . . . . . . . . . . . . . . . . . . . . . . . . . . . . . . . 304 1. Registered deposits and other resources of the Czech Republic . . . . . . . . . . . . . . . 304 2. Basic statistical data of the Czech Republic as of December 31 . . . . . . . . . . . . . . . 305 3. Foreign trade . . . . . . . . . . . . . . . . . . . . . . . . . . . . . . . . . . . . . . . . . . . . . . . . . . . . . . . 305 4. World production and world market prices . . . . . . . . . . . . . . . . . . . . . . . . . . . . . . . 307

12Contents
METALLIC ORES . . . . . . . . . . . . . . . . . . . . . . . . . . . . . . . . . . . . . . . . . . . . . . . . . . . . . 309
Copper . . . . . . . . . . . . . . . . . . . . . . . . . . . . . . . . . . . . . . . . . . . . . . . . . . . . . . . . . . . . . . 309 1. Registered deposits and other resources of the Czech Republic . . . . . . . . . . . . . . . 309 2. Basic statistical data of the Czech Republic as of December 31 . . . . . . . . . . . . . . . 310 3. Foreign trade . . . . . . . . . . . . . . . . . . . . . . . . . . . . . . . . . . . . . . . . . . . . . . . . . . . . . . . 310 4. World production and world market prices . . . . . . . . . . . . . . . . . . . . . . . . . . . . . . . 313Germanium . . . . . . . . . . . . . . . . . . . . . . . . . . . . . . . . . . . . . . . . . . . . . . . . . . . . . . . . . . . . 315 1. Registered deposits and other resources of the Czech Republic . . . . . . . . . . . . . . . 315 2. Basic statistical data of the Czech Republic as of December 31 . . . . . . . . . . . . . . . 316 3. Foreign trade . . . . . . . . . . . . . . . . . . . . . . . . . . . . . . . . . . . . . . . . . . . . . . . . . . . . . . . 316 4. World production and world market prices . . . . . . . . . . . . . . . . . . . . . . . . . . . . . . . 317Gold . . . . . . . . . . . . . . . . . . . . . . . . . . . . . . . . . . . . . . . . . . . . . . . . . . . . . . . . . . . . . . 318 1. Registered deposits and other resources of the Czech Republic . . . . . . . . . . . . . . . 318 2. Basic statistical data of the Czech Republic as of December 31 . . . . . . . . . . . . . . . 319 3. Foreign trade . . . . . . . . . . . . . . . . . . . . . . . . . . . . . . . . . . . . . . . . . . . . . . . . . . . . . . . 319 4. World production and world market prices . . . . . . . . . . . . . . . . . . . . . . . . . . . . . . . 320Lead . . . . . . . . . . . . . . . . . . . . . . . . . . . . . . . . . . . . . . . . . . . . . . . . . . . . . . . . . . . . . . 321 1. Registered deposits and other resources of the Czech Republic . . . . . . . . . . . . . . . 321 2. Basic statistical data of the Czech Republic as of December 31 . . . . . . . . . . . . . . . 322 3. Foreign trade . . . . . . . . . . . . . . . . . . . . . . . . . . . . . . . . . . . . . . . . . . . . . . . . . . . . . . . 322 4. World production and world market prices . . . . . . . . . . . . . . . . . . . . . . . . . . . . . . . 324Manganese . . . . . . . . . . . . . . . . . . . . . . . . . . . . . . . . . . . . . . . . . . . . . . . . . . . . . . . . . . . . 325 1. Registered deposits and other resources of the Czech Republic . . . . . . . . . . . . . . . 325 2. Basic statistical data of the Czech Republic as of December 31 . . . . . . . . . . . . . . . 326 3. Foreign trade . . . . . . . . . . . . . . . . . . . . . . . . . . . . . . . . . . . . . . . . . . . . . . . . . . . . . . . 326 4. World production and world market prices . . . . . . . . . . . . . . . . . . . . . . . . . . . . . . . 328Silver . . . . . . . . . . . . . . . . . . . . . . . . . . . . . . . . . . . . . . . . . . . . . . . . . . . . . . . . . . . . . . 329 1. Registered deposits and other resources of the Czech Republic . . . . . . . . . . . . . . . 329 2. Basic statistical data of the Czech Republic as of December 31 . . . . . . . . . . . . . . . 330 3. Foreign trade . . . . . . . . . . . . . . . . . . . . . . . . . . . . . . . . . . . . . . . . . . . . . . . . . . . . . . . 330 4. World production and world market prices . . . . . . . . . . . . . . . . . . . . . . . . . . . . . . . 331Tin . . . . . . . . . . . . . . . . . . . . . . . . . . . . . . . . . . . . . . . . . . . . . . . . . . . . . . . . . . . . . . 332 1. Registered deposits and other resources of the Czech Republic . . . . . . . . . . . . . . . 332 2. Basic statistical data of the Czech Republic as of December 31 . . . . . . . . . . . . . . . 333 3. Foreign trade . . . . . . . . . . . . . . . . . . . . . . . . . . . . . . . . . . . . . . . . . . . . . . . . . . . . . . . 333 4. World production and world market prices . . . . . . . . . . . . . . . . . . . . . . . . . . . . . . . 335Tungsten . . . . . . . . . . . . . . . . . . . . . . . . . . . . . . . . . . . . . . . . . . . . . . . . . . . . . . . . . . . . . . 336 1. Registered deposits and other resources of the Czech Republic . . . . . . . . . . . . . . . 336 2. Basic statistical data of the Czech Republic as of December 31 . . . . . . . . . . . . . . . 337 3. Foreign trade . . . . . . . . . . . . . . . . . . . . . . . . . . . . . . . . . . . . . . . . . . . . . . . . . . . . . . . 337 4. World production and world market prices . . . . . . . . . . . . . . . . . . . . . . . . . . . . . . . 339Zinc . . . . . . . . . . . . . . . . . . . . . . . . . . . . . . . . . . . . . . . . . . . . . . . . . . . . . . . . . . . . . . 340 1. Registered deposits and other resources of the Czech Republic . . . . . . . . . . . . . . . 340 2. Basic statistical data of the Czech Republic as of December 31 . . . . . . . . . . . . . . . 341 3. Foreign trade . . . . . . . . . . . . . . . . . . . . . . . . . . . . . . . . . . . . . . . . . . . . . . . . . . . . . . . 341

13Contents
4. World production and world market prices . . . . . . . . . . . . . . . . . . . . . . . . . . . . . . . 342
MINERALS MINED IN THE PAST WITHOUT RESOURCES AND RESERVES . . . . . . . . . . . . . . . . . . . . . . . . . . . . . . . . . . . . . . . . . . . . . . . . . . . . . . 344
Antimony . . . . . . . . . . . . . . . . . . . . . . . . . . . . . . . . . . . . . . . . . . . . . . . . . . . . . . . . . . . . . 344 Foreign trade . . . . . . . . . . . . . . . . . . . . . . . . . . . . . . . . . . . . . . . . . . . . . . . . . . . . . . . . . 344 World production and world market prices . . . . . . . . . . . . . . . . . . . . . . . . . . . . . . . . . 345Arsenic . . . . . . . . . . . . . . . . . . . . . . . . . . . . . . . . . . . . . . . . . . . . . . . . . . . . . . . . . . . . . . 346 Foreign trade . . . . . . . . . . . . . . . . . . . . . . . . . . . . . . . . . . . . . . . . . . . . . . . . . . . . . . . . . 346 World production and world market prices . . . . . . . . . . . . . . . . . . . . . . . . . . . . . . . . . 346Cobalt . . . . . . . . . . . . . . . . . . . . . . . . . . . . . . . . . . . . . . . . . . . . . . . . . . . . . . . . . . . . . . 348 Foreign trade . . . . . . . . . . . . . . . . . . . . . . . . . . . . . . . . . . . . . . . . . . . . . . . . . . . . . . . . . 348 World production and world market prices . . . . . . . . . . . . . . . . . . . . . . . . . . . . . . . . . 349Iron . . . . . . . . . . . . . . . . . . . . . . . . . . . . . . . . . . . . . . . . . . . . . . . . . . . . . . . . . . . . . . 350 Foreign trade . . . . . . . . . . . . . . . . . . . . . . . . . . . . . . . . . . . . . . . . . . . . . . . . . . . . . . . . . 350 World production and world market prices . . . . . . . . . . . . . . . . . . . . . . . . . . . . . . . . . 351Mercury . . . . . . . . . . . . . . . . . . . . . . . . . . . . . . . . . . . . . . . . . . . . . . . . . . . . . . . . . . . . . . 353 Foreign trade . . . . . . . . . . . . . . . . . . . . . . . . . . . . . . . . . . . . . . . . . . . . . . . . . . . . . . . . . 353 World production and world market prices . . . . . . . . . . . . . . . . . . . . . . . . . . . . . . . . . 353Sulphur . . . . . . . . . . . . . . . . . . . . . . . . . . . . . . . . . . . . . . . . . . . . . . . . . . . . . . . . . . . . . . 354 Foreign trade . . . . . . . . . . . . . . . . . . . . . . . . . . . . . . . . . . . . . . . . . . . . . . . . . . . . . . . . . 354 World production and world market prices . . . . . . . . . . . . . . . . . . . . . . . . . . . . . . . . . 355
MINERALS UNMINED IN THE PAST WITH RESOURCES AND RESERVES . . . . . . . . . . . . . . . . . . . . . . . . . . . . . . . . . . . . . . . . . . . . . . . . . . . . . . 357
Lithium, rubidium and cesium . . . . . . . . . . . . . . . . . . . . . . . . . . . . . . . . . . . . . . . . . . . . . 357 Registered deposits and other resources of the Czech Republic . . . . . . . . . . . . . . . . . 357 Basic statistical data of the Czech Republic as of December 31 . . . . . . . . . . . . . . . . . 358 Foreign trade . . . . . . . . . . . . . . . . . . . . . . . . . . . . . . . . . . . . . . . . . . . . . . . . . . . . . . . . . 358 World production and world market prices . . . . . . . . . . . . . . . . . . . . . . . . . . . . . . . . . 359Molybdenum . . . . . . . . . . . . . . . . . . . . . . . . . . . . . . . . . . . . . . . . . . . . . . . . . . . . . . . . . . . 361 Registered deposits and other resources in the Czech Republic; basic statistical data of the Czech Republic as of December 31 . . . . . . . . . . . . . . . . . . 361 Foreign trade . . . . . . . . . . . . . . . . . . . . . . . . . . . . . . . . . . . . . . . . . . . . . . . . . . . . . . . . . 361 World production and world market prices . . . . . . . . . . . . . . . . . . . . . . . . . . . . . . . . . 361Rare earths . . . . . . . . . . . . . . . . . . . . . . . . . . . . . . . . . . . . . . . . . . . . . . . . . . . . . . . . . . . . 363 Registered deposits and other resources in the Czech Republic;
basic statistical data of the Czech Republic as of December 31 . . . . . . . . . . . . . . . . . . 363 Foreign trade . . . . . . . . . . . . . . . . . . . . . . . . . . . . . . . . . . . . . . . . . . . . . . . . . . . . . . . . . 363 World production and world market prices . . . . . . . . . . . . . . . . . . . . . . . . . . . . . . . . . 364Selenium, tellurium . . . . . . . . . . . . . . . . . . . . . . . . . . . . . . . . . . . . . . . . . . . . . . . . . . . . . . 366 Registered deposits and other resources in the Czech Republic;
basic statistical data of the Czech Republic as of December 31 . . . . . . . . . . . . . . . . . . 366 Foreign trade . . . . . . . . . . . . . . . . . . . . . . . . . . . . . . . . . . . . . . . . . . . . . . . . . . . . . . . . . 366

14Contents
World production and world market prices . . . . . . . . . . . . . . . . . . . . . . . . . . . . . . . . . 367Tantalum, niobium . . . . . . . . . . . . . . . . . . . . . . . . . . . . . . . . . . . . . . . . . . . . . . . . . . . . . . 368 Registered deposits and other resources in the Czech Republic;
basic statistical data of the Czech Republic as of December 31 . . . . . . . . . . . . . . . . . . 368 Foreign trade . . . . . . . . . . . . . . . . . . . . . . . . . . . . . . . . . . . . . . . . . . . . . . . . . . . . . . . . . 368 World production and world market prices . . . . . . . . . . . . . . . . . . . . . . . . . . . . . . . . . 369Zirconium, hafnium . . . . . . . . . . . . . . . . . . . . . . . . . . . . . . . . . . . . . . . . . . . . . . . . . . . . . 370 Registered deposits and other resources in the Czech Republic;
basic statistical data of the Czech Republic as of December 31 . . . . . . . . . . . . . . . . . . 370 Foreign trade . . . . . . . . . . . . . . . . . . . . . . . . . . . . . . . . . . . . . . . . . . . . . . . . . . . . . . . . . 370 World production and world market prices . . . . . . . . . . . . . . . . . . . . . . . . . . . . . . . . . 371
MINERALS UNMINED IN THE PAST WITHOUT RESOURCES AND RESERVES . . . . . . . . . . . . . . . . . . . . . . . . . . . . . . . . . . . . . . . . . . . . . . . . . . . . . . 373
INDUSTRIAL MINERALS . . . . . . . . . . . . . . . . . . . . . . . . . . . . . . . . . . . . . . . . . . . . . . 373
Andalusite, kyanite, sillimanite, mullite . . . . . . . . . . . . . . . . . . . . . . . . . . . . . . . . . . . . . . 373Asbestos . . . . . . . . . . . . . . . . . . . . . . . . . . . . . . . . . . . . . . . . . . . . . . . . . . . . . . . . . . . . . . 374Magnesite . . . . . . . . . . . . . . . . . . . . . . . . . . . . . . . . . . . . . . . . . . . . . . . . . . . . . . . . . . . . . 375Perlite . . . . . . . . . . . . . . . . . . . . . . . . . . . . . . . . . . . . . . . . . . . . . . . . . . . . . . . . . . . . . . 376Rock salt . . . . . . . . . . . . . . . . . . . . . . . . . . . . . . . . . . . . . . . . . . . . . . . . . . . . . . . . . . . . . . 377Talc . . . . . . . . . . . . . . . . . . . . . . . . . . . . . . . . . . . . . . . . . . . . . . . . . . . . . . . . . . . . . . 378Other raw materials used in industrial fertilizers production . . . . . . . . . . . . . . . . . . . . . . 379
METALLIC ORES . . . . . . . . . . . . . . . . . . . . . . . . . . . . . . . . . . . . . . . . . . . . . . . . . . . . 381
Aluminium . . . . . . . . . . . . . . . . . . . . . . . . . . . . . . . . . . . . . . . . . . . . . . . . . . . . . . . . . . . . 381Beryllium . . . . . . . . . . . . . . . . . . . . . . . . . . . . . . . . . . . . . . . . . . . . . . . . . . . . . . . . . . . . . 383Bismuth . . . . . . . . . . . . . . . . . . . . . . . . . . . . . . . . . . . . . . . . . . . . . . . . . . . . . . . . . . . . . . 384Cadmium . . . . . . . . . . . . . . . . . . . . . . . . . . . . . . . . . . . . . . . . . . . . . . . . . . . . . . . . . . . . . . 385Chromium . . . . . . . . . . . . . . . . . . . . . . . . . . . . . . . . . . . . . . . . . . . . . . . . . . . . . . . . . . . . . 386Gallium . . . . . . . . . . . . . . . . . . . . . . . . . . . . . . . . . . . . . . . . . . . . . . . . . . . . . . . . . . . . . . 387Indium . . . . . . . . . . . . . . . . . . . . . . . . . . . . . . . . . . . . . . . . . . . . . . . . . . . . . . . . . . . . . . 388Magnesium . . . . . . . . . . . . . . . . . . . . . . . . . . . . . . . . . . . . . . . . . . . . . . . . . . . . . . . . . . . . 389Nickel . . . . . . . . . . . . . . . . . . . . . . . . . . . . . . . . . . . . . . . . . . . . . . . . . . . . . . . . . . . . . . 390Thallium . . . . . . . . . . . . . . . . . . . . . . . . . . . . . . . . . . . . . . . . . . . . . . . . . . . . . . . . . . . . . . 391Thorium . . . . . . . . . . . . . . . . . . . . . . . . . . . . . . . . . . . . . . . . . . . . . . . . . . . . . . . . . . . . . . 392Titanium . . . . . . . . . . . . . . . . . . . . . . . . . . . . . . . . . . . . . . . . . . . . . . . . . . . . . . . . . . . . . . 394Vanadium . . . . . . . . . . . . . . . . . . . . . . . . . . . . . . . . . . . . . . . . . . . . . . . . . . . . . . . . . . . . . 395

15
EXPLANATORY NOTES
List of abbreviations, symbols and technical units
AOPK ČR Nature Conservation Agency of the Czech Republic (Agentura ochrany přírody a krajiny České republiky)
a. s. initials after a Czech company name indicate that it is a joint stock company (akciová společnost)
bbl barrel of crude petroleum, 158.99 dm3; 1 tonne of crude petroleum is approximately 7 bbl (6.76-7.75 bbl for crude petroleum extracted in the Czech Republic)
BP British Petroleum, British multinational oil and petrochemical companyBRICS acronym for economic group of Brazil, Russsia, India, China, South AfricaCFR Cost and Freight (named port of destination)CHKO protected landscape area (Chráněná krajinná oblast)CHOPAV Natural water accumulation protected area (chráněná oblast přirozené aku-
mulace vod)CIF Cost, Insurance and Freight (named port of destination)CIS Commonwealth of Independent States, in Russian: Содружество Независи-
мых ГосударствCMMI Council of Mining and Metallurgical InstitutionsColl. Collection of laws (Sbírka zákonů České republiky) of the Czech RepublicCPPP constant prices of previous periodCZK Czech crown (česká koruna)CZ NACE Czech adoption of the General Industrial Classification of Economic Activities
within the European Communities (Nomenclature générale des Activités économiques dans les Communautés Européennes)
ČBÚ Czech Mining Authority (Český báňský úřad)ČGÚ Czech Geological Office (Český geologický úřad)ČNB Czech National Bank (Česká národní banka)ČNR Czech National Council (Česká národní rada) – former parliament of the
Czech (Socialist) Republic ČR Czech Republic (Česká republika)ČSÚ Czech Statistical Office (Český statistický úřad)DP mining lease (dobývací prostor)EIA 1) Environmental Impact Assessment 2) Energy Information Administration, section of the Department of Energy
of the USA providing energy statistics, data, analysisEU European UnionEURATOM (ESA) – Euratom Supply Agency, European agency for common supply

16Explanatory notes – List of abbreviations, symbols and technical units
policy on the principle of regular and equitable supply of nuclear fuels for European Community users
EUROSTAT Statistical Office of the European Communities, organisational branch of the European Commission
FDI foreign direct investmentFMPE Federal Ministry of Fuels and Power (Federální ministersvo paliv a energetiky)FNM National property Fund (Fond národního majetku)FOB Free on Board (port) – seller pays for transportation of the goods to the port
of shipment, plus loading costsGDP Gross domestic productGVA Gross value added (GVA) is a widely used indicator of the total economic
performance of each branch. It is an indicator corresponding to the GDP in the whole national economy. It is calculated by subtraction of the intermediate consumption (consumption of the raw materials, energy, materials) from the total value of the production (in terms of accounting, this is the difference between the sales and other services of companies and their consumption of materials, energy and services, this is therefore the sum of their book values added)
IEA International Energy AgencyIM Industrial Minerals (journal)IMF International Monetary FundJORC Joint Ore Reserves CommitteeKKZ Commission for Classification of Mineral Reserves (Komise pro klasifikaci
zásob)k. s. initials after a Czech company name indicate that it is a limited partnership
company (komanditní společnost)kt kilotonne, 1,000 tMa Million of yearsMB Metal Bulletin (journal)MCS Mineral Commodity Summaries, mineral yearbook of the US Geological
SurveyMHPR Ministry of Economic Policy and Development (Ministerstvo pro hospo-
dářskou politiku a rozvoj)mill million, 106
MUS Mostecká uhelná společnost, a.s.MŽP ČR Ministry of the Environment of the Czech Republic (Ministerstvo životního
prostředí České republiky)N not available or not reliable dataNP natural park (Národní park)OBÚ Regional Mining Authority (Obvodní báňský úřad)OPEC Organization of Petroleum Exporting Countriespcs piecesPKÚ Palivový kombinát Ústí, s.p.POPD plan of mine development work of reserved mineral deposits (plán otvírky,
přípravy a dobý vání výhradních ložisek)PÚ exploration area (průzkumné území)ROPO Recognised Overseas Professional Organizations

17Explanatory notes – List of abbreviations, symbols and technical units
Sb. Collection of Laws (abbreviated as Coll.) of the Czech RepublicSD Severočeské doly, a.s.SITC Standard International Trade Classifications. p. initials after a Czech company name indicate that it is a state public enterprise
(státní podnik)spol. s r. o. initials after a Czech company name indicate that it is a limited liability
company (společnost s ručením omezeným), ditto initials s. r. o.s. r. o. initials after a Czech company name indicate that it is a limited liability
company (společnost s ručením omezeným), ditto initials spol. s r.o.SU Sokolovská uhelná, právní nástupce, a.s.t metric tonne, 1,000 kg, 1,000,000 gths thousand, 103
UNCTAD United Nations Conference on Trade and DevelopmentUNECE United Nations Economic Commission for EuropeUNFC United Nations Framework ClassificationUNSTAT United Nations Statistics Division (http://unstats.un.org/unsd/default.htm) USGS United States Geological Survey – Geological survey of the USAv. o. s. initials after a Czech company name indicate that it is an unlimited company
(general partnership) (veřejná obchodní společnost)VAT Value Added TaxWBD Welt Bergbau Daten (World Mining Data), mineral yearbook of Austrian
Federal Ministry for Economy, Family and Youth WNA World Nuclear AssociationZCHÚ specially protected area (zvláště chráněné území)

18Explanatory notes – Exchange and inflation rates of currencies in which minerals are pr iced
Exchange and inflation rates of currencies in which minerals are priced
Annual inflation rates (%) in the USA (US), the United Kingdom (UK), the Euro Area (EUR) and the Czech Republic (CZ)
US UK EUR CZ
1991 4.2 7.4 – 56.6
1992 3.0 4.3 – 11.1
1993 3.0 2.5 – 20.8
1994 2.6 2.1 – 10.0
1995 2.8 2.6 – 9.2
1996 2.9 2.4 – 8.8
1997 2.3 1.8 – 8.4
1998 1.5 1.6 – 10.6
1999 2.2 1.3 1.1 2.3
2000 3.4 0.9 2.1 3.8
2001 2.8 1.2 2.4 4.7
2002 1.6 1.3 2.3 1.8
2003 2.3 1.4 2.1 0.1
2004 2.7 1.3 2.1 2.8
2005 3.4 2.0 2.2 1.8
2006 3.2 2.3 2.2 2.5
2007 2.9 2.3 2.1 2.8
2008 3.8 3.6 3.3 6.3
2009 –0.3 2.1 0.3 1.0
2010 1.6 3.3 1.6 1.5
2011 3.1 4.5 2.7 1.9
2012 2.1 2.8 2.5 3.3
2013 1.5 2.6 1.3 1.4
Notes:• source – IMF. World Economic Outlook Database. October 2013• inflation rates based on average annual changes of consumer price indices (index, 2000 = 100)

19Explanatory notes – Exchange and inflation rates of currencies in which minerals are pr iced
Average yearly exchange rates of CZK against EUR, USD and GBP
EUR USD GBP
1991 – 29.5 52.0
1992 – 28.3 49.9
1993 – 29.2 43.8
1994 – 28.8 44.0
1995 – 26.5 41.9
1996 – 27.1 42.3
1997 – 31.7 51.9
1998 – 32.3 53.4
1999 36.9 34.6 56.0
2000 35.6 38.6 58.4
2001 34.1 38.0 54.8
2002 30.8 32.7 49.0
2003 31.8 28.2 46.0
2004 31.9 25.7 47.1
2005 29.8 23.9 43.6
2006 28.3 22.6 41.6
2007 27.8 20.3 40.6
2008 24.9 17.0 31.4
2009 26.4 19.1 29.7
2010 25.3 19.1 29.5
2011 24.6 17.7 28.3
2012 25.1 19.6 31.0
2013 26.0 19.6 30.6
Source: Czech National Bank

20Explanatory notes – Mineral reserve and resource classif ication in the Czech Republic
Mineral reserve and resource classification in the Czech Republic and its evolutional comparison with international classifications
Czech classificationAfter 1948 the reserve classification of the USSR was progressively adopted in Czechoslovakia, of which the Czech Republic formed part. A Commission for Classification of Mineral Reserves (Komise pro klasifikaci zásob – KKZ) was established in 1952, as a state agency to review the categorisation and estimation of reserves of all types of minerals, except radioactive ores.
Initially geological reserves (all reserves in their original state in the deposit without subtracting losses from mining, beneficiation and processing) were classified into subdivisions of groups and categories (slightly simplified).
Groups of geological reserves according to industrial utilisation:nebilanční potentially economic – currently unminable due to a low grade, small deposit
thickness, particularly complicated mining conditions, or due to the unfamiliarity with economic processing methods for the given mineral type, yet which may be considered as exploitable in the future
bilanční economic – minable, suitable for industrial utilisation and for the technical mining conditions for extraction
Categories of geological reserves according to the degree of deposit exploration:A – explored in detail and delimited by mining works or boreholes, or by a combination
of these. Geological setting, distribution of quality mineral types in the deposit and the technological properties of the mineral are known to such a degree that allow for the development of a method for beneficiation and processing of the mineral. Natural and industrial types of minerals are given. Reserves A include those parts of the deposit, where the geological setting, hydrogeological conditions and mining conditions are known to such a degree that a deposit development method can be developed.
B – explored and delimited by mining works or boreholes, or by a combination of these in a sparser network than in category A. It further includes reserves of deposits adjoining blocks of category A, verified by exploration works. The manner of geological setting, natural and industrial types of minerals are determined without knowing their detailed distribution in the deposit. The quality and technological characteristics of the minerals are given within a range allowing for a basic choice of a processing method. Hydrogeological conditions and general principles of deposit development are sufficiently clarified.
C1 – determined by a sparse network of boreholes or mining works, or by a combination of these, as well as reserves which adjoin the reserves of categories A and B, if they are justified from a geological perspective. They also include the reserves of relatively complex deposits with a very irregular distribution of the mineral, even though these deposits were explored in detail. Included here are the deposit reserves partially mined-out with low recovery methods. The setting conditions, quality, industrial types and processing technology of the mineral are defined based on analyses or laboratory tests of samples, or based on analogy with explored deposits

21Explanatory notes – Mineral reserve and resource classif ication in the Czech Republic
of a similar type. The hydrogeological conditions and the principles of deposit development are defined quite in general.
C2 – are assumed based on geological and geophysical data, confirmed by sampling of the mineral deposit from outcrops, isolated boreholes or mining works. Also, reserves adjoining the reserves of A, B, C1 categories, where geological conditions for this exist.
It is further defined that project development and investment amounts for the construction of mining facilities are permitted on the basis of the economic mineral reserves in categories A + B + C1, which are therefore reserves eligible for industrial utilisation. That is why, in practice, the economic reserves of categories A, B, C1, or their total A+B+C1 were designated by the term industrial reserves.
Further improvement of the classification introduced Order of the CSSR Government no.80 in 1988 [7].
In 1963, KKZ established the prognostic reserves (prognózní zásoby) category in an amendment of its Principles for the Classification of Solid Minerals (hereinafter Principles) (Zásady pro klasifikaci zásob pevných nerostných surovin). They were defined as unexplored mineral reserves, assumed on the basis of the formation patterns and the distribution of mineral deposits, and investigations, dealing with the geological structure and the history of geological evolution of the evaluated locality. The parameters for the evaluation of prognostic reserves (strike, length, thickness, average grade and the like) are determined according to geological assumptions or they are derived. According to the Principles, prognostic reserves are not listed in the national Register of Reserves (bilance zásob). They serve only as a basis for future planning of geological exploration.
In 1968, KKZ innovated the definition of prognostic reserves. In the amended Principles for reserve classification, it established the division of reserves into proved (by exploration or mining) and assumed, or prognostic. Prognostic geological reserves are unverified reserves, however they are assumed based on geological, geophysical and other scientific knowledge and material. They are predominantly the reserves of larger localities and formations, and, in isolated cases, the reserves of unexplored parts of large structures or deposits.
Due to the establishment of the prognostic reserve category, geological reserves (geologické zásoby) can, with regard to contents, be translated into English as total resources. However up to 1989, the term resources did not appear in Czech or Czechoslovak classifications. But up to now, reserves also represent mineral accumulations, which meet the reserves criteria due to being explored, but which do not meet them due to technical and economic reasons (potentially economic reserves nebilanční zásoby). They are therefore mineral resources.
In 1981, the Czech Geological Office issued Directive No. 3 [3], where the present prognostic reserves (prognózní zásoby) were divided into categories D1, D2, D3. They are defined as follows:
D1 – relate to verified mineral deposit reserves, with which they form one whole deposit. Determined in delimited areas and quantifiable based on positive detection of an existing mineral and its basic quality characteristics.
D2 – territorially independent. They are determined in a delimited area based on positive detection of an existing mineral and its basic quality characteristic. Analogies are also used for their determination.
D3 – determined on the basis of regional investigation. So far, mineral existence has not been proven in such a way, in order to be able to delimit the area of their occurrence and to quantify the prognosis.
22Explanatory notes – Mineral reserve and resource classif ication in the Czech Republic
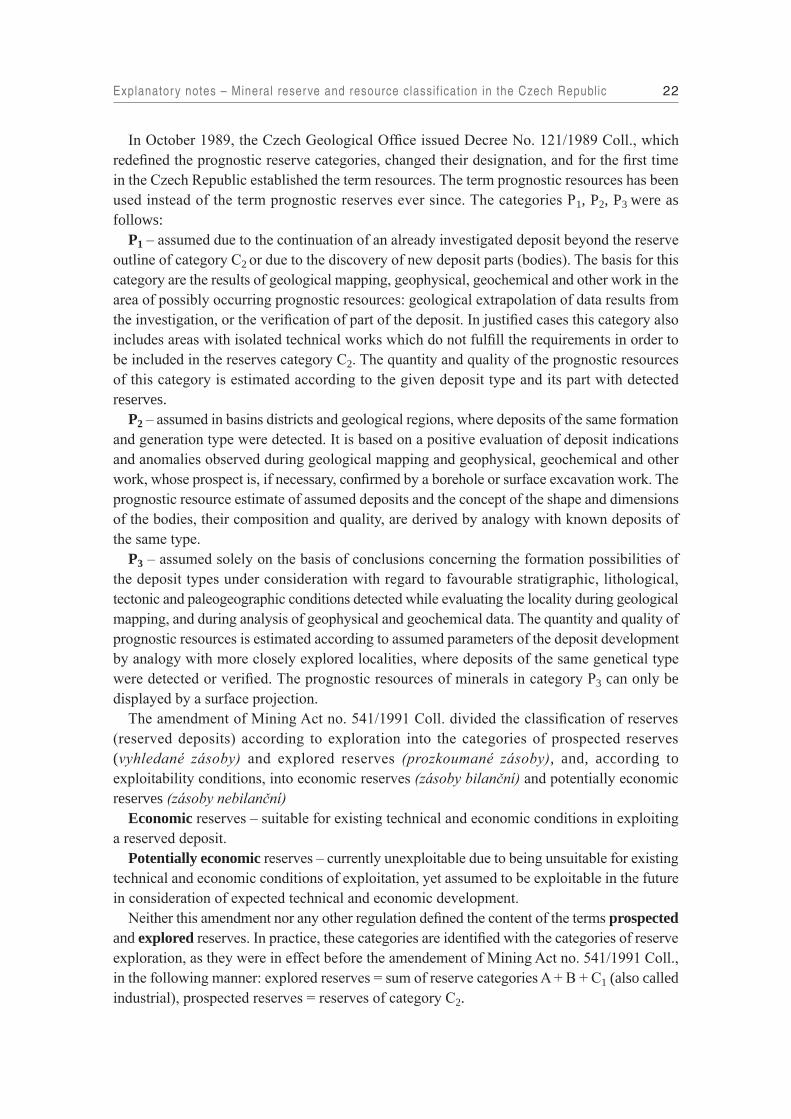
In October 1989, the Czech Geological Office issued Decree No. 121/1989 Coll., which redefined the prognostic reserve categories, changed their designation, and for the first time in the Czech Republic established the term resources. The term prognostic resources has been used instead of the term prognostic reserves ever since. The categories P1, P2, P3 were as follows:
P1 – assumed due to the continuation of an already investigated deposit beyond the reserve outline of category C2 or due to the discovery of new deposit parts (bodies). The basis for this category are the results of geological mapping, geophysical, geochemical and other work in the area of possibly occurring prognostic resources: geological extrapolation of data results from the investigation, or the verification of part of the deposit. In justified cases this category also includes areas with isolated technical works which do not fulfill the requirements in order to be included in the reserves category C2. The quantity and quality of the prognostic resources of this category is estimated according to the given deposit type and its part with detected reserves.
P2 – assumed in basins districts and geological regions, where deposits of the same formation and generation type were detected. It is based on a positive evaluation of deposit indications and anomalies observed during geological mapping and geophysical, geochemical and other work, whose prospect is, if necessary, confirmed by a borehole or surface excavation work. The prognostic resource estimate of assumed deposits and the concept of the shape and dimensions of the bodies, their composition and quality, are derived by analogy with known deposits of the same type.
P3 – assumed solely on the basis of conclusions concerning the formation possibilities of the deposit types under consideration with regard to favourable stratigraphic, lithological, tectonic and paleogeographic conditions detected while evaluating the locality during geological mapping, and during analysis of geophysical and geochemical data. The quantity and quality of prognostic resources is estimated according to assumed parameters of the deposit development by analogy with more closely explored localities, where deposits of the same genetical type were detected or verified. The prognostic resources of minerals in category P3 can only be displayed by a surface projection.
The amendment of Mining Act no. 541/1991 Coll. divided the classification of reserves (reserved deposits) according to exploration into the categories of prospected reserves (vyhledané zásoby) and explored reserves (prozkoumané zásoby), and, according to exploitability conditions, into economic reserves (zásoby bilanční) and potentially economic reserves (zásoby nebilanční)
Economic reserves – suitable for existing technical and economic conditions in exploiting a reserved deposit.
Potentially economic reserves – currently unexploitable due to being unsuitable for existing technical and economic conditions of exploitation, yet assumed to be exploitable in the future in consideration of expected technical and economic development.
Neither this amendment nor any other regulation defined the content of the terms prospected and explored reserves. In practice, these categories are identified with the categories of reserve exploration, as they were in effect before the amendement of Mining Act no. 541/1991 Coll., in the following manner: explored reserves = sum of reserve categories A + B + C1 (also called industrial), prospected reserves = reserves of category C2.

23
The given definitions are in accordance with the definitions of the UNFC (United Nations Framework Classification) classification of the UN, published by UN-ECE in 1997 [4]. This classification divides (just as, for example, the classification of the USA [5]) its categories according to economic feasibility (quantity and quality of the mineral in situ) in one direction into 3 groups. For the division according to the level of geological knowledge it does not use one direction, one criterion (verification according to the technical work carried out), as is common, but two directions, two criteria: 1) According to which of the 4 phases of exploration (from geological to mining) and 2) according to which study (from geological to mining) the given mineral accumulation was prospected or verified. Thus in the area between the axes E (economic), F (feasibility) and G (geological), a total of 36 categories can be established mechanically, out of which about 10 actually exist. The categories are marked with a three-digit code and a priori do not have designations (although recommended designations exist).
(Notice: In the course of discovery and verification of mineral deposits and their estimations of mineral resources and reserves two fundamental stages connect with each other: prospect‑ing and exploration.
Prospecting is a set of geological activities aiming at discovery of a mineral accumulation (mineral accumulations) which could be a mineral deposit (mineral deposits) and to express in numbers its (their) mineral resources.
Exploration is to decide if a mineral accumulation (prospective mineral deposit) is a mineral deposit or not and if it is, to estimate its mineral reserves.)
International classificationsInternational systems of classifying reserves and resources developed most rapidly in the last quarter of the twentieth century. In 2001, the Pan European Reserves and Resources Reporting Committee (PERC) published the Code for Reporting of Mineral Exploration Results, Mineral Resources and Mineral Reserves [1]. This corresponds to the reporting standards of the Australian, Canadian, South African and other organisations grouped in the Combined Reserves International Reporting Standards Committee (now called Committee for Mineral Reserves International Reporting Standards) – CRIRSCO which is a subcommittee of CMMI (Council of Mining and Metallurgical Industries). It is summarized as follows:
Relations between mineral reserves and resources, their definitionsChart of the relations [1]
Explanatory notes – Mineral reserve and resource classif ication in the Czech Republic

24Explanatory notes – Mineral reserve and resource classif ication in the Czech Republic
An important aspect of the European and similar reporting codes is the concept of the “competent person” . He/she is responsible for the calculation of reserves and its categories, is a member of an acknowledged professional society (which sees to the expertise and ethics of its members via sanctions), and has expert and moral qualities . His estimates are accepted as reliable by banks and securities exchanges . Competent persons are members of Recognized Overseas Professional Organizations (ROPO) . A list of organisations is compiled by the Aus-tralasian Joint Ore Reserves Committee (JORC) .
Although some national and international classifications are relatively complicated, the mining industry frequently still makes do with only the categories of proved and probable reserves . If it is seeking funds from banks or share issues (inirial public offering) on securities exchanges, it must respect the regulations for reporting its mineral reserves . The securities exchanges have reporting requirements which are particularly strict or even provided by law . In general they

25
Comparison of the mineral resource classification valid in the USA from 1980 [5] with the reserve and resource classifications valid in the territory of the Czech Republic from 1956
Explanatory notes – Mineral reserve and resource classif ication in the Czech Republic

26Explanatory notes – Mineral reserve and resource classif ication in the Czech Republic
require adherence to the reporting codes of the international organizations such as those that cooperate in framing the European Code [1] .
Comparison of Czech and international systems of classificationThe following scheme and table compare the reserve and resource classifications of the Czech Republic with the international classifications discussed above.
Is to be noted that reserves in the Czech classification still include potentially economic reserves, i .e . reserves which are currently not recoverable and which are, therefore, potentially economic resources . The term reserves as used, by contrast, in standard international classifications represents only the parts of explored resources which are available for immediate or developed extraction . All other registered parts are resources, not reserves, of a given mineral .
Comparison of UNFC with the reserve and resource classifications of the Council of Mining and Metallurgical Industries (CMMI) [4] and of the Czech Republic
Code of the UNFC category
Proposed designation of the UNFC
category
CMMI category
Czech categories up to
1981
Czech categories in 1981 – 1989
Czech categories in 1989 – 1991
Czech categories after 1991
111 Proved Mineral Reserve
Proved Mineral Reserve
economic reserves – part of exploitable part* A + B
economic reserves – part of exploitable part* A + B
economic reserves – part of exploitable part* A + B
part of exploitable part* of explored
economic reserves
121 + 122 Probable Mineral Reserve
Probable Mineral Reserve
economic reserves – part of exploitable
part* of A + B + C1
economic reserves – part of exploitable
part* of A + B + C1
economic reserves – part of exploitable
part* of A + B + C1
part of exploitable part* of explored
economic reserves
123 Inferred Mineral
Resource
economic reserves – C2
economic reserves – C2
economic reserves – C2
prospected economic reserves
211 Feasibility Mineral
Resource
Measured Mineral
Resource
potentially economic
reserves – A + B
potentially economic
reserves – A + B
potentially economic
reserves – A + B
part of explored potentially
economic reserves
221 + 222 Prefeasibility Mineral
Resource
Indicated Mineral
Resource
potentially economic
reserves – C1
potentially economic
reserves – C1
potentially economic
reserves – C1
part of explored potentially
economic reserves
223 Inferred Mineral
Resource
potentially economic
reserves – C2
potentially economic
reserves – C2
potentially economic
reserves – C2
prospected potentially
economic reserves
331 Measured Mineral
Resource
Measured Mineral
Resource
potentially economic
reserves – A + B
potentially economic
reserves – A + B
potentially economic
reserves – A + B
part of explored potentially
economic reserves
332 Indicated Mineral
Resource
Indicated Mineral
Resource
potentially economic
reserves – C1
potentially economic
reserves – C1
potentially economic
reserves – C1
part of explored potentially
economic reserves
333 Inferred Mineral Resource
Inferred Mineral
Resource
potentially economic
reserves – C2 + part of prognostic
reserves
potentially economic reserves + part of D1
potentially economic reserves + part of P1
prospected potentially economic
reserves + part of P1
334 Reconnais-sance Mineral
Resource
not available
part of prognostic reserves
D2 + D3 + part of D1
P2 + P3 + part of P1
P2 + P3 + part of P1
* geological reserves reduced by amount of prospective mining losses

27
ConclusionsIf they are to be of practical use national and international classifications have to respect the information base given by the reserve estimations of mining enterprises. It may be unsuitable to overly expand the classification requirements or expectations beyond the realistic means of this base. Combining a classification with a study (project), which classifies given resources or reserves, or with a prospecting and exploration phase, in which mineral resources and reserves were estimated, causes problems. For economic (acquiring financial means, taxes, market position) or political reasons, a prospector or a mining company developer may be led, for example, to move their exploration phase higher or lower in comparison with its actual position. In socialist (communist) Czechoslovakia with its completely nationalised industry, commerce and services, results of geological prospecting and exploration were judged not according to the mineral reserves prospected or verified by exploration, but according to the fulfillment of exploration work plans, whether planned investments in exploration were completely spent on “drilling and digging”, or not. The wage of the employees of exploration and mining organisations depended on the fullfilment of plans. That is why at all levels, there was also an interest, that prospecting and exploration constantly continue. Consequently, prospecting strictly speaking and general exploration were the most frequent type of prospecting, and verified reserves were possibly never categorised under A. They were commonly only inserted into categories C1 and C2. That enabled their permanent verification. On the other hand, many mining organisations mined the reserves of category C2 which however could have been ranked factually higher; they were over-explored.
References[1] Code for reporting of mineral exploration results, mineral resources and mineral reserves (The Reporting
Code). – http://geolsoc.org.uk/webdav/site/GSL/shared/pdfs/Fellowship/UK_Euro%20Reporting%20Code.pdf
[2]* Schejbal, C. (2003): Problematika výpočtu a klasifikace zásob a zdrojů pevných nerostných surovin. – Sborník vědeckých prací Vysoké školy báňské – Technické univerzity Ostrava, ročník XLIX, řada hornicko-geologická, monografie 9, s. 139–161 (Transactions of the VŠB – Technical University Ostrava, vol. XLIX, Mining and Geological Series, Monograph 9, pp. 139–161).
[3]** Směrnice č. 3/1981 Českého geologického úřadu pro hodnocení a evidenci geologických prognóz a prognózních zásob nerostných surovin. – Geologický průzkum, 23, 10:Zpravodaj ČGÚ, 5: 1–2.
[4] United Nations international framework classification for reserves/resources – solid fuels and mineral commodities. – United Nations Economic and Social Council, Economic Commission for Europe, Committee on Sustainable Energy, 1997. Geneva.
[5] U. S. Bureau of Mines and U. S. Geological Survey. Principles of a resource/reserve classification of minerals. – U. S. Geological Survey Circular 831, 1980.
[6]*** Lhotský, P. – Morávek, P. (2002): Ložiskový průzkum a hospodaření se zásobami výhradních ložisek (návrh k analýze třetí části horního zákona). – Uhlí, rudy, geologický průzkum, 5: 8–15.
[7]**** Nařízení vlády Československé socialistické republiky č.80/1988 Sb., o stanovení kondic, klasifikaci zásob výhradních ložisek a posuzování, schvalování a státní expertize jejich výpočtů.
Translations of Czech article (and legislation) titles: * Problems of evaluation and classification of reserves/resources of solid mineral raw materials ** Directive no. 3/1981 of the Czech Geological Office for evaluation and registration of geological prognoses and
prognostic reserves of minerals *** Mineral exploration and management of reserved deposit mineral reserves (proposal for analysis of the third part
of the Mining Act)**** Order of the Czechoslovak Socialist Republic Government, on setting of standards, classification of reserves of
reserved deposits and on assessing, approval and the State expertise of their estimates
Explanatory notes – Mineral reserve and resource classif ication in the Czech Republic
28
INTRODUCTION
This year, the yearbook Mineral Commodity Summaries of the Czech Republic is being published for the twenty-first time in its history. It was published and distributed on behalf of the Ministry of Economy until 1996, and on behalf of the Ministry of the Environment from 1997 to 2010. The year 2011 marked the first time that the Ministry of the Environment did not commission the Czech Geological Survey – Geofond to compile and distribute the yearbook, and the necessary financial resources for this work were therefore unavailable.
In order to meet the present as well as future needs of the interested public at home and abroad, the Czech Geological Survey – Geofond nonetheless decided to publish the publication albeit with a minimum content and extent in both language versions (Czech and English), however only in electronic format on the Internet on its website. Its Czech and English editions (including publications since 1993) are available to the public at http://www.geology.cz/extranet/publikace/online/surovinove-zdroje.
After the dissolution of the state-funded organization Czech Geological Survey – Geofond on 31 December 2011, the semi-budgetary organization Czech Geological Survey was charged with compiling the publication Mineral Commodity Summaries of the Czech Republic. Last and this year, the Ministry of the Environment again commissioned the compilation and distribution of the publication, by increasing the budget of the Czech Geological Survey, under which Geofond Department 600 continues to compile the yearbook. This enabled the continuation of the unique research (and its publication) regarding the geological evolution of the area of the Czech Republic and the development of the Cech and global economies relate to minerals, economic situation of domestic mining companies and regarding the expenses of rectifying negative impacts of mining in the Czech Republic. The research of price development of aggregates namely in Central European countries could prosecute and be published too.
The yearbook is published and distributed predominantly in electronic format.The publication continues to provide information for those interested in the research,
exploration and mining of mineral deposits in the Czech Republic and in the environmental impact of mining in the Czech Republic. It of course continues to cover the most important minerals of the Czech Republic that are or have recently been of industrial importance, but also those minerals, whose reserves or (approved and unapproved) resources have not been mined in the Czech Republic in the past. The listed minerals also include minerals unmined in the present and past, without existing resources and reserves, which are items of Czech foreign trade that can be monitored via tariff items. The publication includes basic data on the status and changes in the mineral reserves of the Czech Republic taken from the Register of Mineral Deposit Reserves of the Czech Republic (Bilance zásob výhradních ložisek nerostů České republiky) (hereinafter “the Register”), which is published for a limited number of state administration agencies.
Additional information on domestic prices of minerals, imports and exports, major mining companies, and the location of mineral deposits is intended to assist in understanding the mineral potential of the Czech Republic and to stimulate investment in the minerals

29Introduction
industry. This is also aided by the listed prognostic resources, both officially approved by the Commission for Projects and Final Reports of the Ministry of the Environment (Komise pro projekty a závěrečné zprávy – KPZ) in categories P1, P2, P3 and unapproved by KPZ (mentioned only in expert reports).
The mineral reserves presented are geological reserves, also called total reserves, i.e. original reserves (in situ) within individual deposits, estimated according to the given classification and technical-economic conditions of their exploitability. The initial data come from mineral reserve estimates, which were approved or verified in the past by the Commission for Classification of Mineral Reserves and/or by the Commission for Exploration and Mining of Reserved Minerals of the former MHPR ČR and MH ČR, or by former commissions for management of mineral reserves of individual mining and processing industries. Uranium reserves and reserve estimates were approved by the Commission for Classification of Radioactive Mineral Reserves of the former Federal Ministry of Fuels and Energy. Currently, an approval of a reserve estimation lies within authority of the subject financing the estimation. If the subject is a private company, the company itself approves its reserve estimation. If the subject is the state, the KPZ approves the estimation. In accordance with section 14, article 3) of the Mining Act no. 44/1988 Coll. as amended also the private company submits its reserved mineral reserve estimation to the KPZ via the Ministry of the Environment of the Czech Republic, so that the KPZ may review if the estimation report contents comply with the provisions of the Mining Act.
There are reserved and non-reserved minerals and deposits as defined by the Mining Act no. 44/1988 Coll., as amended. Reserved minerals always form reserved deposits which are owned by the Czech Republic. Non-reserved deposits are owned by landowners. Non-reserved minerals (construction minerals) can form both reserved and non-reserved deposits. Until 1991, reserved deposits of sufficient mineral quantity and quality were proclaimed “suitable for the needs and development of the national economy” as defined by the Mining Act at that time. Since 1991, the newly recognised and explored deposits of non-reserved minerals form non-reserved deposits.
In 1993–2001, the Ministry of the Environment along with the Ministry of Industry and Trade undertook a fundamental economic revaluation of the mineral wealth of the Czech Republic. In 2003–2006, the task has continued to a smaller extent. Therefore compared to past years, many considerable changes have occurred in the number of deposits and registered reserves of many minerals (especially metallic ores).
The Mineral Commodity Summaries of the Czech Republic includes selected minerals according to whether they are or were mined in the territory of the Czech Republic. Currently mined minerals also include approved prognostic resources, if existing. Currently unmined minerals are divided into those that were mined in the past and those that have never been mined. In both cases, it is distinguished whether their resources and reserves are known or not and, generally, also whether they are metallic ores or industrial minerals. Separate chapters are dedicated to each mineral, or mineral grouping common in its deposit. Each chapter is structured identically. The separate chapters of currently mined minerals listed – mineral fuels, industrial and construction minerals, and metallic ores, which are of economic importance and of substantial reserves in the territory of the Czech Republic – consist of six parts.
Part 1 – Registered deposits and other resources of the Czech Republic – is based on the inventory of mineral deposits of the Czech Republic and, for the majority of minerals, includes a list of deposits and their location. The names of exploited deposits are given in bold. As for energy minerals and some industrial minerals, only regions and basins rather than single

30Introduction
deposits are given. As for dimension stone and construction minerals, which are scattered in hundreds of deposits over the whole territory of the Czech Republic, their groupings are located in the subdivisions of reserved, non-reserved, exploited and unexploited deposits.
Part 2 – Basic statistical data of the Czech Republic as of December 31 – are extracted especially from the Register. There are 3 groups of minerals (ores, energy minerals, and reserved industrial and construction minerals) registered in the Czech Republic. Mine production of non-reserved deposits has been monitored since 1999. Approved prognostic resources are stated, too, if proved they exist.NOTE: The Register presents the reserves data in the categories on exploration (prospected, explored) and economic use (economic, potentially economic), as stipulated by relevant statutes starting with the Mining Act. Reserves include potentially economic reserves, i.e. reserves which are currently not recoverable and which are, therefore, potentially economic resources. Consequently, total mineral reserves are in reality total mineral resources. The term reserves as used, by contrast, in standard international classifications represents only the parts of explored resources which are available for immediate extraction. All other registered parts are resources, not reserves, of a given mineral. The relationship of domestic and foreign classifications of mineral reserves and resources is described in the separate chapter of this yearbook “Mineral reserve and resource classification in the Czech Republic and its evolutional comparison with international classifications”.
Part 3 – Foreign trade – provides information on import and export, and on average import and export prices of important tariff items of the given raw material (and cites international numeric codes of the tariff items). The foreign trade data are the latest (continuously reviewed) data of the Czech Statistical Office (ČSÚ) – without analyses of their reliability.
Part 4 – Prices of domestic market – provides indicative prices on domestic production, import and export prices. Domestic prices do not include VAT.
Part 5 – Mining companies in the Czech Republic as of December 31, 2013 – provides a list of companies mining the given mineral in the territory of the Czech Republic. The companies are listed according to the production level. Their addresses are available at the Czech Geological Survey.
Part 6 – World production and world market prices – provides data on mining and production of commercial products for the last 5 years, and lists sigificant world producers, i.e. the top 5–12 countries in world production. Data on resources and reserves of minerals is often used to be presented. Evolution of world prices is mentioned as current quoted or indicative prices in the last five years.
Numerous domestic and foreign data, used in compiling the present yearbook, came from journals, expert literature and the latest editions of various international statistical yearbooks.

31
MINERAL BASE OF THE CZECH REPUBLIC AND ITS DEVELOPMENT IN 2013
Tomáš Sobota, Jana Mentbergerová, Ministry of the Environment of the Czech Republic
1. Legal framework for mineral resource use1.1. Reserved and non-reserved minerals and their depositsThe minerals defined in Act No. 44/1988 Coll., on the Protection and Use of Mineral Resources (the Mining Act) as amended, are classified as being reserved and non-reserved. Natural accumulations of reserved minerals form reserved mineral deposits which constitute the mineral wealth of the country and are owned by the Czech Republic. Deposits of non-reserved minerals (especially sand and gravel, crushed stone and brick clay) are a constituent part of the land as stipulated in section 7 of the Mining Act. The possibility to declare significant non-reserved mineral deposits as reserved deposits, was cancelled by the amendment of the Mining Act in 1991. Decisions of administrative agencies in this matter, which had been issued before the amendment went into effect, remain valid based on transitional provisions (section 43 and 43a of the Mining Act). The deposits specified by these decisions are still reserved deposits, i.e. owned by the state, separated from the land itself.
1.2. Planning, approval and carrying out of mineral prospecting and exploration
1.2.1. Reserved mineralsProspecting and exploration of reserved mineral deposits, by virtue of the ČNR Act No. 62/1988 Coll., on Geological Work (the Geological Act) as amended, may be conducted by an individual or organisation, providing that the work is managed and guaranteed by a qualified and certified person (certified responsible manager for the geological work). An organisation seeking to prospect for and explore these mineral deposits, to verify their reserves, and to process geological documents for their exploitation and protection, must make a request to the Ministry of the Environment to establish an exploration area. The proceedings, subject to administrative rules, are concluded by the establishment or non-establishment of an ‘exploration area’ (exploration permit). In the former case, the following must be determined: the survey area, the mineral to be prospected and explored for which the exploration area is being established, the conditions for the execution of the work, and the period of validity of the exploration area. The exploration area is not a territorial decision, but provides the entrepreneur or organisation (hereinafter “entrepreneur”) with the exclusive privilege to prospect for the mineral in a given exploration area. In the first year, the entrepreneur is obliged by law to pay a tax of CZK 2,000 per km² or km² piece of exploration area, which increases annually by CZK 1,000 per km² and its piece (to CZK 3,000 in the second year, to CZK 4,000 in the third year, etc.). These taxes represent an income for the municipalities, in whose cadastral areas the exploration area is established.
Within the scope of planning and conducting the prospecting for and exploration of reserved mineral deposits, the organisation must consider the conditions and interests protected by

32Mineral base of the Czech Republic and its development in 2013
special regulations (section 22 of the Act on Geological Work). These primarily refer to the laws for the protection of landscape and nature, agricultural and forest land; to the Water and Mining Acts etc. The Ministry of the Environment can cancel the established exploration area, if the organisation repeatedly or severely violates the obligations set by the Geological Act.
1.2.2. Non-reserved minerals (and their mining)The above-mentioned enactments apply to prospecting and exploration for non-reserved mineral deposits, only, if they were previously declared as reserved deposits according to the transitional provisions of the Mining Act. In other cases, an organisation can prospect and explore for non-reserved minerals only upon agreement with the landowner. The provision under section 22 of the Act on Geological Work is also valid in these cases. The mining of reserved deposits is considered a mining operation under section 2 of the Mining Act and the mining of non-reserved deposits, which constitutes a part of the land, an operation conducted according to the mining methods set by Act No. 61/1988 Coll., on Mining Operations, Explosives and the State Mining Administration, as amended.
1.3. Permit to mine a prospected and explored depositIf, during prospecting and exploration, a reserved mineral is found to be of quality and quantity indicative of its accumulation (supported by a partial deposit reserve estimate given in the category of prospected reserves), the organisation must report it to the Ministry of the Environment, which issues a certificate for the reserved deposit owned by the state. At the same time, this certificate ensures the deposit against actions rendering its mining difficult or impossible by the establishment of a protected deposit area (CHLÚ) according to section 17 of the Mining Act.
The entrepreneur’s right to mine the reserved deposit is provided by the grant of a mining lease. The submittal of a proposal for the grant of a mining lease must be preceded by an approval from the Ministry of the Environment, which may depend on the fulfilment of limiting conditions accounting for the interests of the state mineral policy, and on covering expenses of geological work already funded by the state. The organisation, on whose behalf the exploration was carried out, has priority in receiving the approval for the grant of the mining lease. If it fails to assert its mining lease, precedence is then given to the organisation which participated financially in the exploration. Somewhat different rules apply to cases concerning crude oil and natural gas based on a transposed EU directive.
The mining lease is only granted to an entrepreneur possessing a Certificate of Mining Operations issued by an authorised Regional Mining Office. This grant procedure takes place in cooperation with relevant administrative agencies, mainly in agreement with environmental, land use planning and building authorities. The entrepreneur‘s proposal for the grant of a mining lease must be furnished with documentation as stipulated by law. The procedure deals with landowner relations and settlement of conflicts of interests, which are protected by special regulations. The environmental impact assessment (EIA) represents a part of the documentation, too. The grant of a mining lease represents a mining as well as land use authorisation.
The entrepreneur, who has been granted a mining lease, may start mining operations only after obtaining a mining permit from the authorised Regional Mining Office. The issue of this permit is subject to an administrative procedure assessing the plans of the opening, the preparation and the mining of the deposit, and the plans for rehabilitation and reclamation after

33Mineral base of the Czech Republic and its development in 2013
termination of the mining. In justified cases, the Regional Mining Authority may combine the grant of a mining lease and of a mining permit into one administrative procedure.
1.4. Royalties on reserved minerals minedThe entrepreneur is obliged to pay royalties on the mining lease and the extracted reserved minerals. An annual lease payment of CZK 100–1,000 is assessed on every hectare opened within the mining lease area, which is marked off on the surface. The payment is graded with respect to the degree of environmental protection of the affected area, the type of activity conducted in the mining lease, and its environmental impact. The Regional Mining Authority fully transfers this payment to the municipalities, in whose territories the mining lease is located, according to the lease proportions in each municipal territory.
An annual royalties on minerals extracted in mining leases is given by the MPO Decrees No. 426/2001 Coll., and 63/2005 Coll., which amend the Decree No. 617/1992 Coll., detailing the payment of royalties on mining leases and extracted minerals.
Royalty rates by kind of extracted reserved mineral(Annex no.1 to Decree no. 617/1992 Coll., as amended)
Kind of extracted mineral Rate %
1 Radioactive minerals 0.3
2Crude oil in deposits, residual reserves of which are exploited to end by the help of secondary recovery methods
0.5
3 Crude oil and natural gas 5
4 Metallic ores 10
5 Graphite 1
6 Diatomite 2
7 Glass and foundry sand 6
8 Bentonite 2
9 Minerals used for stone-cutting manufacturing inclusive fissile shales 8
10 Technically usable mineral crystals and gemstones 10
11 Gypsum 5
12 Ceramic clays and claystones from underground mining 0.5
13 Ceramic clays and claystones from surface mining 4
14 Kaolin for production of porcelain 8
15 Kaolin for paper industry 6
16 Other kinds of kaolin 2
17 Feldspar pegmatites 1
18 Other feldspar raw materials 8
19Quartz, quartzite, dolomite, marl, basalt, trachyte provided that these minerals are suitable for technochemical processing or melt treatment
4
20 High percentage limestone 10
21 Other limestones and corrective aditives for cement production 4
22 Coal from underground mining 0.5
23 Coal from surface mining 1.5
24 Other reserved minerals 5
25 Crushed stone 2
26 Sand and gravel 3
27 Brick clays and related minerals 1
28 Other non-reserved minerals 2“

34Mineral base of the Czech Republic and its development in 2013
2. Selected statistical data on exploration and mining on the territory of the Czech Republic
Statistical data/Year 2009 2010 2011 2012 2013
registered geological works – number 3248 2 902 2 900 3 000 3 340
protected deposit areas – number 1069 1 077 1 075 1 087 1 098
mining leases – total number 971 967 964 967 969
number of exploited reserved deposits 507 505 496 495 502
number of exploited non-reserved deposits 227 211 220 209 203
mine production of reserved deposits, mill t a) 125 118 124 114 107
mine production of non-reserved deposits, mill t a) 15 12 13 11 11
organizations managing reserved deposits 319 315 321 320 321
organizations mining reserved deposits 200 188 185 183 179
organizations mining non-reserved deposits 172 153 166 151 170
Note: a) conversions: natural gas 1 mill m3 = 1 kt, dimension and crushed stones 1,000 m3 = 2.7 kt, sand and gravel and brick clays and related minerals 1,000 m3 = 1.8 kt.
The royalties on extracted minerals are calculated as Nd SU = ––– · T · ––– , Nc 100where byNd = costs of mineral extraction (ths CZK)Nc = total costs of the enterprise for manufacture of products (ths CZK)T = sales (ths CZK)S = royalty rate (%)U = royalties total (ths CZK)
The Regional Mining Authority transfers 25 % of the yielded royalties to the state budget of the Czech Republic to be purposefully used in remediation of environmental damage caused by the mining of reserved and non-reserved deposits, and the remaining 75 % to the budget of the relevant municipalities.
1.5. Reserves for mining damages and remediation during the mining of reserved minerals
During the course of mining, the entrepreneur is required to generate sufficient financial reserves for mining damages and for reclamation of areas affected by the deposit exploitation. Generating of the financial reserves is approved by the Regional Mining Authority during the mining permit procedure regarding the opening and extraction of the deposit. Drawing on the reserves is permitted by the Regional Mining Authority upon agreement with the Ministry of the Environment and upon notification by the relevant municipality. In the case of (partially) state-owned enterprises, the Regional Mining Authority decides in agreement with the Ministry of Industry and Trade.

35
3. Significance of mining in the Czech economy
Ratio/Year 2009 2010 2011 2012 2013
Annual GDP * growth –4.5 2.5 1.9 –0.9 –0.9
Share of mining and quarrying in GDP, %
of current prices 1.3 1.3 1.3 1.0VSP 1.0VSP
Share of mining and quarrying GVA in GVA of
industrial production**, % of current prices4.4 4.4 4.5 3.9 3.1
Source: Czech Statistical Office, VSP – Professor Vojtěch Spěváček’s informationNote:* GDP determined by production approach, volume indices, stable period of previous year = 100** Industrial production = mining and quarrying + manufacturing + electricity, gas, steam and air conditioning
supply
Mineral base of the Czech Republic and its development in 2013
4. Trends of reserves of minerals (economic explored disposable reserves)
Totals in mill t (if not otherwise stated)
Statistical data/Year 2009 2010 2011 2012 2013
Metallic ores a) 26 26 26 26 26
Energy minerals b) 2 879 2 724 2 939 2 891 2 847
of which: uranium (U) (kt) 1 1 1 1 1
crude oil 15 15 20 20 21
natural gas b) 3 4 6 6 6
Industrial minerals 2 669 2 732 2 718 2 718 2 684
Construction minerals c) 5 200 5 200 5 200 5170 5 153
Note:a) metals in ores total, since 2004 only Au ores (25 642 kt)b) natural gas – conversion into kt: 1 mill m3 = 1 ktc) at reserved mineral deposits including dimension stone, conversion into kt – dimension and crushed stones
1,000 m3 = 2.7 kt, sand and gravel and brick clays and related minerals 1,000 m3 = 1.8 kt

36Mineral base of the Czech Republic and its development in 2013
6. State-funded geological projects6.1. Economic geology projectsThe Central Geological Authority of the state administration fulfils the duty involving the state register of reserved deposits – state property (section 29 of the Mining Act). Accordingly, it issues the register as one of the main sources for•land use planning•the raw material policy•the energy policy•the environmental policy •the structural policy•the employment policy
The register lists the latest status of the deposits as documented in the reserves estimate. The reserves estimate is prepared with respect to the conditions of exploitability expressing•the state of the market, prices, business economy,•the mining and technical conditions of exploitation,•the conflicts of interests arising from the deposit exploitation (primarily environmental protection and other conflicts)
5. Summary of exploration licences valid in 2012 and newly issued in 2012 (listed according to minerals) – prospecting and exploration works financed by companies
Minerals and underground placement sites
Number of valid EA (min. 1)
Number of valid EA (min. 2)
Number of new issues
in 2013
Start of validity in
2013
Bituminous coal 2 0 1 1
Crude oil and natural gas 18 0 1 1
Sn-W and Li ores 5 0 2 0
Li ore 0 5 2 0
Cu ore 0 2 2 0
Graphite 2 0 2 2
Gemstones 2 0 1 1
Kaolin 4 0 0 0
Clays 2 0 0 0
Bentonite 6 3 2 1
Feldspar and feldspar substitutes 2 3 2 1
Silica raw materials 1 0 0 0
Corrective additives for cement production 1 0 0 0
Dimension stone 0 0 0 0
Crushed stone 0 0 0 0
Sand and gravel 6 0 1 1
Underground placement sites, underground reservoirs
16 0 0 0
Total 67 13 16 8
EA – exploration areaMineral 1 (min. 1) – in case that the raw material is the major oneMineral 2 (min. 2) – in case that the raw materials is a by-product

37Mineral base of the Czech Republic and its development in 2013
It is altogether entirely unstable factors reflecting political, economic and social change (in the largest sense).
The state funds spent in this area were dedicated to feldspathic raw materials of western Moravia, new possibilities of leucocratic granites, clays and feldspathic raw material utilisa-tion plus evaluation of mineral economic potential of Be, Ga, Ge and Y anomalies in the Cheb Basin sediments. Further studies of possible utilisation of graphite resources in the northern Moravia area and of Co and Ni resources in the Czech Republic were realized.
Expenditures for state-funded exploration work related to economic geology (rounded values)
1993 CZK 248.7 mill1994 CZK 249.8 mill1995 CZK 242.3 mill1996 CZK 163.0 mill1997 CZK 113.2 mill1998 CZK 114.2 mill1999 CZK 110.8 mill2000 CZK 26.3 mill2001 CZK 21.5 mill2002 CZK 17.0 mill2003 CZK 7.0 mill2004 CZK 26.2 mill2005 CZK 12.0 mill2006 CZK 1.7 mill2007 CZK 3.0 mill2008 CZK 9.9 mill2009 CZK 10.1 mill2010 CZK 4.2 mill2011 CZK 4.0 mill2012 CZK 1.0 mill2013 CZK 1.5 mill
6.2. Other geological projectsMainly geological work of a non-economic geology character was funded by the state. In-dividual projects were publicly commissioned in order to implement the following partial programmes:• rectify the consequences of past geological (non-economic geology) work financed by the
state (mine workings not yet liquidated, boreholes)•geological informatics•geological mapping•geohazards of the environment•hydrogeology•engineering geology•comprehensive geological studies

38Mineral base of the Czech Republic and its development in 2013
The following expenditures were spent on these geological projects since 2001:
2001 CZK 72.8 mill2002 CZK 61.0 mill2003 CZK 67.0 mill2004 CZK 52.1 mill2005 CZK 60.3 mill2006 CZK 55.4 mill2007 CZK 58.1 mill2008 CZK 41.0 mill2009 CZK 42.2 mill2010 CZK 35.0 mill2011 CZK 22.8 mill2012 CZK 12.6 mill2013 CZK 8,2 mill
7. Summary of selected legal regulations on mineral prospecting and exploration in force as of June 30, 2014
7.1. ActsAct No. 44/1988 Coll., on Mineral Protection and Use (the Mining Act) – as amended by the Acts No. 541/1991 Coll., No. 10/1993 Coll., No. 168/1993 Coll., No. 132/2000 Coll., No. 258/2000 Coll., No. 366/2000 Coll., No. 315/2001 Coll., No. 61/2002 Coll., No. 320/2002 Coll., No. 150/2003 Coll., 3/2005 Coll., No. 386/2005 Coll., No. 186/2006 Coll., No. 313/2006 Coll., No. 296/2007 Coll., No. 157/2009 Coll., No. 227/2009, Coll., No. 281/2009 Coll., No. 85/2012 Coll. , No. 350/2012 Coll., No. 498/2012 Coll., 257/2013 Coll.
Act No. 61/1988 Coll., on Mining Operations, Explosives and the State Mining Administration as amended by the Acts No. 425/1990 Coll., No. 542/1991 Coll., No. 169/1993 Coll., No. 128/1999 Coll., No. 71/2000 Coll., No. 124/2000 Coll., No. 315/2001 Coll., No. 206/2002 Coll., No. 320/2002 Coll., No. 226/2004 Coll., No. 3/2005 Coll., No. 386/2005 Coll., No.186/2006 Coll., No. 313/2006 Coll., No. 342/2006 Coll., No. 296/2007 Coll., No.376/2007 Coll., No.124/2008 Coll., No.274/2008 Coll., 223/2009 Coll., No. 227/2009 Coll., No. 281/2009 Coll., No. 155/2010 Coll., No 184/2011 Coll. , No. 18/2012 Coll., 64/2014 Coll., 250/2014 Coll.
Act No. 62/1988 Coll., on Geological Work, as amended by the Acts No. 543/1991 Coll., No. 366/2000 Coll., No. 320/2002 Coll., No. 18/2004 Coll., No. 3/2005 Coll., No. 444/2005 Coll., No. 186/2006 Coll., No.124/2008 Coll., No. 223/2009 Coll., No. 227/2009 Coll., No. 281/2009 Coll., No. 85/2012 Coll., 64/2014 Coll.
Act No. 157/2009 Coll., on Mining Waste Treatment and Amendment of Some Acts, as ammended by the Act No. 168/2013 Coll.
7.2. Other legal regulations7.2.1. Mineral deposits exploitationDecree of the ČBÚ No. 104/1988 Coll., on efficient use of reserved deposits, on permits and notification of mining operations and other activities employing mining methods, as amended by the Decree No. 242/1993 Coll., No. 434/2000 Coll., and No. 299/2005 Coll.

39Mineral base of the Czech Republic and its development in 2013
Decree of the ČBÚ No. 415/1991 Coll., on construction, the elaboration of documentation and the determination of safety pillars, rods and zones for the protection of underground and surface sites in the wording of the Decree of the ČBÚ No. 340/1992 Coll., and No. 331/2002 Coll.
Decree of the ČBÚ No. 172/1992 Coll., on mining leases in the wording of the Decree No. 351/2000 Coll.
Decree of the ČBÚ No. 175/1992 Coll., on the conditions of non-reserved mineral deposit exploitation in the wording of the Decree No. 298/2005 Coll.
Decree of the MŽP ČR No. 363/1992 Coll., on the survey and registry of old mine workings in the wording of the Decree of the MŽP No. 368/2004 Coll.
Decree of the MŽP ČR No. 364/1992 Coll., on protected deposit areasDecree of the ČBÚ No. 435/1992 Coll., on mine surveying documentation during mining
and during some operations employing mining methods in the wording of the Decree of the ČBÚ No. 158/1997 Coll. and the Decree No. 298/2005 Coll. and the Decree No. 382/2012 Coll.
Decree of the MH ČR No. 617/1992 Coll., detailing the payment of royalties on mining leases and extracted minerals, in the wording of the Decree of the MPO No. 426/2001 Coll. and No. 63/2005 Coll.
Decree of the MHPR ČR No. 497/1992 Coll., on the registration of reserves of reserved mineral deposits
7.2.2. Geological workDecree of the MŽP No. 282/2001 Coll., on the registration of geological work, in the wording of the Decree of the MŽP No. 368/2004 Coll.
Decree of the MŽP No. 368/2004 Coll., on geological documentationDecree of the MŽP No. 369/2004 Coll., on the planning, execution and evaluation of
geological work, on announcing geohazards, and on the procedure for estimating reserves of reserved deposits as amended by the Decree of the MŽP No.18/2009 Coll.
7.2.3. Regulations on licensing of mining operations and verification of qualificationDecree of the ČBÚ No. 298/2005 Coll., on the requirements for professional qualification and competence in mining or operations employing mining methods, and on some legal regulation changes, in the wording of the Decree No. 240/2006 Coll. and the Decree No. 378/2012 Coll.
Decree of the ČBÚ No. 15/1995 Coll., on the licensing of mining operations and operations employing mining methods as well as on the development of sites and installations, which constitute these operations, in the wording of the Decree No. 298/2005 Coll. and the Decree No. 380/2012 Coll.
Decree of the MŽP ČR No. 206/2001 Coll., on the certificate of qualification for planning, executing and evaluating geological work

40
ECONOMY AND MINERALS
Development of the Czech and global economies and the importance of minerals
Vojtěch Spěváček1, Václav Žďárek1,2
1 University of Economics and Management; 2 School of Economics and Management, ŠKODA AUTO University
1. Recession in the Czech economyIn the past five years, the Czech economy experienced two recessions, which were caused by an unfavourable trend in the global economy and by domestic factors as well. The recession in 2009 was deep and the gross domestic product (GDP) /1/ shrank by 4.4 % (see Figure 1). The main culprits were external factors connected with the crisis in western developed countries. The slowdown in economic activity was very strong in the eurozone countries, whose demand is critical for Czech exports. In Germany, the main trading partner of the Czech Republic, the quarter-on-quarter decline in GDP lasted for four quarters and the GDP declined by 5.1 % for the entire year of 2009. As a result of the recession in the global economy, foreign demand fell sharply and the Czech economy was hit by a strong external demand shock. The slump in foreign demand reflected a decline in the export of Czech products, which fell by 11.8 % in real terms in 2009. In the highly export-oriented Czech economy, the sharp decrease in foreign demand had to result in a decline in industrial production, primarily in the manufacturing industry. Industrial production, measured by the industrial production index, fell by 13.6 % for the entire year of 2009 and the decline in GDP on the supply side /2/ may be attributed primarily to industry.
After a slight revival in 2010 and 2011, a second recession occurred in 2012 and 2013, which was shallower but very long. The GDP fell by 0.9 % in both years. Another important difference lies in the fact that, while the 2009 recession was triggered by external factors, the prevailing effects in 2012 and 2013 were domestic factors, which sharply reduced domestic demand and, were it not for the positive influence of international trade in 2012, the GDP decline would have been considerably sharper (for more details, see section on the trend in demand). The impact of domestic factors prevailed in the combination of unfavourable internal and external circumstances and so did also the considerably restrictive fiscal policies of the government and concerns for the future, which, together with a decline in real wages, led households to lower consumption and businesses to reduce investments.
The GDP fell sharply at the beginning of 2013 (in the first quarter by 2.3 % year-on-year, see Figure 2). However, the economic performance gradually improved in 2013. The year-on-year declines eased in the second and third quarters and, in the last three months of the year, the GDP already grew by 1.1 % compared with the same period in 2012. However, the results for the first and last quarters were influenced by unusual factors connected with tax collection on the supply side of the economy. The revival of the Czech economy continued in 2014. In the first quarter of the year, the GDP rose 2.9 % year-on-year and 2.7 % in the second quarter.

41Economy and minerals – Development of the Czech and global economies
The relatively high growth resulted from growing foreign and domestic demand, and also from a low comparative basis, because the first quarter of 2013 was, in terms of economic performance, the weakest in the past four years. The noticeable economic recovery at the end of 2013 and at the beginning of 2014 is in all probabilty more lasting and connected with the improvement of external circumstances, the easing of fiscal policy, growing wages and with a positive change in the expectations of domestic economic units.1
The economic performance measured by quarter-on-quarter changes in GDP was affected by considerable fluctuations in past years. The sharp decline of 5.6 %, which lasted for three quarters at the end of 2008 and in 2009, was followed by a gradual two-year recovery. The second wave of recession, beginning in the third quarter of 2011, was very long because it lasted six quarters. However, it was milder and the overall decline did not exceed 2.7 %. Beginning with the second quarter of 2013, the economy again grew quarter-on-quarter with a tendency toward a gradual acceleration of GDP growth. A quarter-on-quarter growth of zero in the second quarter of 2014 deviated from this trend, because it was influenced by high growth in the first quarter (among other things due to favourable weather) and by a decline in revenue from excise taxes on tobacco products as a result of stocking up at the end of 2013.
The negative aspects of the long-lasting recession were not reflected only in the decline of GDP, but also in rising unemployment, in a decline in lending activity by banks, in increased government debt, and in a dramatic slackening of investment activity. Real wages and consumption decreased, and not only did the economy worsen, but the political and social situation in the country as well.
1 The given macroeconomic data were taken from the ČSÚ (Czech Statistical Office) national accounts, which were available at the end of September 2014. In this regard, it is necessary to point out that a new system of national accounts (so-called ESA 2010) will be implemented in October 2014, thus replacing the previous European System of National Accounts 1995. This change will not only affect the value of individual indices, but probably to a small extent also their dynamics.
Source: ČSÚ – quarterly national accounts (July 2014).
Figure 1: Real GDP growth in the years 2007-2013 (constant prices of previous year, in per cent)

42Economy and minerals – Development of the Czech and global economies
The process of convergence of the Czech economy (convergence to the average per capita income level in EU countries) in 2001–2007 was successful because the Czech GDP per capita in purchasing power parity /3/ increased in relation to the EU-27 from 71 % in 2000 to 83 % in 2007. On the other hand, in 2008–2013, the convergence process came to a halt and the Czech Republic fell behind the average EU level. According to EUROSTAT estimates from June 2014, the Czech GDP per capita in purchasing power parity in 2013 reached 80 % of the average level of EU countries, and the Czech Republic (CR) ranked 17th out of the 27 EU countries. Compared with the development of other Central European countries, the economic development of the CR measured according to this index was the second worst behind Slovenia. While the CR declined in 2013 compared to 2007 by 3 percentage points (p.p.) with regard to the EU average, Poland improved its economic status by 14 p.p., Slovakia by 8 p.p. and Hungary by 6 p.p.
The global financial crisis and ensuing economic crisis had a dramatic effect on the entire European region. The recession in 2009 was very deep (the GDP of the entire EU fell by 4.5 %) and only a slight recovery ensued in 2010. In 2011, a drop in growth dynamics was already evident in the majority of countries of the European Union, and many countries were hit by a new recession in 2012-2013. In the eurozone countries, the GDP declined by 0.7 % in 2012 and by 0.4 % in 2013 (see Table 1). However, there were considerable differences between countries. The deepest drop in economic activity occurred in the southern part of the EU. In 2013, the Greek GDP declined already for the sixth year and dropped overall by more than a quarter. A relatively strong recession in 2012 and 2013 occurred in Cyprus, Portugal, Croatia, Spain, Italy and Slovenia. The main reason for the double-dip recession in these countries were substantial imbalances (the debt crisis combined with austerity measures) and weakly competitive economies. The countries that registered negative GDP growth in 2012 and 2013 were also joined by the Czech Republic, which in contrast to the aforementioned countries did not have an excessive macroeconomic imbalance and whose GDP decline was primarily the result of a restrictive fiscal policy. On the other hand, there was a group of 12 countries that increased economic activity in both 2012 and 2013. A relatively high GDP
Source: ČSÚ – quarterly national accounts (July 2014).
Figure 2: Real GDP growth (percentage change compared with the same quarter of the previous year)

43Economy and minerals – Development of the Czech and global economies
growth was registered by the Baltic states, Poland and Slovakia. In the Baltic states, domestic demand revived considerably after a sharp drop in 2009 and 2010, and foreign trade became an important factor of growth in the case of Poland and Slovakia. The Czech economy did not grow during the entire six-year period (2008-2013), and the annual GDP practically averaged zero growth (0.1 %). From an international perspective, the performance of the Czech economy was not satisfactory because 10 countries recorded a higher average annual growth rate. On the other hand, 15 EU countries registered a decline in economic activity (GDP in constant prices was lower in 2013 than the GDP in 2007).
Table 1: Real GDP growth in the member states of EU in the years 2008-2013 (percentage annual change)
2008 2009 2010 2011 2012 2013 2008–2013
EU–28 0.4 –4.5 2 1.6 –0.4 0.1 –0.2
Euro area 0.4 –4.5 1.9 1.6 –0.7 –0.4 –0.3
Belgium 1 –2.8 2.3 1.8 –0.1 0.2 0.4
Bulgaria 6.2 –5.5 0.4 1.8 0.6 0.9 0.7
Czech Republic 3.1 –4.5 2.5 1.8 –1 –0.9 0.1
Denmark –0.8 –5.7 1.4 1.1 –0.4 0.4 –0.7
Germany 1.1 –5.1 4 3.3 0.7 0.4 0.7
Estonia –4.2 –14.1 2.6 9.6 3.9 0.8 –0.5
Ireland –2.2 –6.4 –1.1 2.2 0.2 –0.3 –1.3
Greece –0.2 –3.1 –4.9 –7.1 –7 –3.9 –4.4
Spain 0.9 –3.8 –0.2 0.1 –1.6 –1.2 –1.0
France –0.1 –3.1 1.7 2 0 0.2 0.1
Croatia 2.1 –6.9 –2.3 –0.2 –2.2 –0.9 –1.8
Italy –1.2 –5.5 1.7 0.4 –2.4 –1.9 –1.5
Cyprus 3.6 –1.9 1.3 0.4 –2.4 –5.4 –0.8
Latvia –2.8 –17.7 –1.3 5.3 5.2 4.1 –1.5
Lithuania 2.9 –14.8 1.6 6 3.7 3.3 0.2
Luxembourg –0.7 –5.6 3.1 1.9 –0.2 2.1 0.1
Hungary 0.9 –6.8 1.1 1.6 –1.7 1.1 –0.7
Malta 3.9 –2.8 4.2 1.5 0.8 2.6 1.7
Netherlands 1.8 –3.7 1.5 0.9 –1.2 –0.8 –0.2
Austria 1.4 –3.8 1.8 2.8 0.9 0.3 0.6
Poland 5.1 1,6 3,9 4,5 2 1,6 3,1
Portugal 0 –2.9 1.9 –1.3 –3.2 –1.4 –1.2
Romania 7.3 –6.6 –1.1 2.3 0.6 3.5 0.9
Slovenia 3.4 –7.9 1.3 0.7 –2.5 –1.1 –1.1
Slovakia 5.8 –4.9 4.4 3 1.8 0.9 1.8
Finland 0.3 –8.5 3.4 2.8 –1 –1.4 –0.8
Sweden –0.6 –5.0 6.6 2.9 0.9 1.6 1.0
United Kingdom –0.8 –5.2 1.7 1.1 0.3 1.7 –0.2
Source: EUROSTAT, National Accounts (August 2014).

44Economy and minerals – Development of the Czech and global economies
Development forecasts for the Czech economy for 2014 and 2015 are difficult and change quickly during periods of rapidly changing conditions and continuing uncertainties. New predictions based on the statistical data from the end of 2013 and from the beginning of 2014 are more optimistic in compared with previous forecasts. The prevailing assumption is that the Czech economy will grow in 2014 at a rate exceeding 2 %, which should accelerate slightly in 2015. According to an economic forecast from April 2014, the European Commission expects a Czech GDP growth of 2 % in 2014 and 2.4 % in 2015. The International Monetary Fund predicts a GDP growth of 2.5 % in 2014. In its macroeconomic forecast from July 2014, the Ministry of Finance expects a GDP growth of 2.7 % in 2014 and 2.5 % in 2015. A forecast from July 2014 by the Czech National Bank is very optimistic and anticipates the GDP to rise by 2.9 % in 2014 and by 3 % in 2015.
The strength of the recovery of the Czech economy will depend on many factors, primarily on those affecting domestic and foreign demand. Household final consumption expenditures (private consumption, which represents one half of the use of GDP) are beginning to be affected positively by the improving situation in the labour market, primarily by the growing household income, low inflation and by a weaker trend in household saving. Fiscal policy is looking for room to stimulate growth by increasing government investment and the wages of government employees. With a more favourable trend in the economy and growing confidence in future trends, investment is reviving and becoming an important factor of growth after declining sharply in past years. However, the economic situation of the CR will depend on the government’s ability to enforce a balanced economic policy, to introduce essential reforms, and to adapt to changing conditions. In this respect, the government’s economic policy is not always clear and coherent, changes often, and necessary reforms are difficult to promote.
The trend in the global economy will be an important factor, particularly the economic situation in the European Union because of the close financial and economic connection between the CR and the countries of the EU. Even though the European economy began to grow and the situation in the financial markets has improved, many countries are still in a difficult economic situation. The European Commission expects the GDP of the entire EU to grow in 2014 by 1.6 % and to stregthen to 2 % in 2015. The German economy, which is our main trading partner, should grow by 1.8 % in 2014 and by 2 % in 2015. In general, foreign trade is expected to make a positive contribution to GDP growth. However, the deteriorating international political situation will have a negative impact, particularly the conflict in Ukraine and the enforcement of mutual sanctions between the European Union and Russia. However, it is difficult to estimate their impact on the Czech economy. That is why risks for future development still exist.
2. Changes on the demand side /4/Fluctuations in supply and cyclical economic trends are usually determined by changes on the demand side. The growth or decline of individual demand components (private and public consumption, which represent final consumption /5/, investment and foreign trade) depend on many diverse factors (internal as well as external), whose variability affects GDP growth. Some demand segments (e.g. private consumption) are more stable, while reserves or investment in fixed capital are more variable and depend on how the economic cycle develops. Foreign trade, which plays an important part in the small open Czech economy, is heavily affected by global trends and by the demand of its main trading partners, primarily Germany.

45Economy and minerals – Development of the Czech and global economies
After a reasonable increase in domestic demand /6/ in previous years, the growth of all demand components (with the sole exception of public consumption) slowed down sharply in 2008. Total domestic demand increased only by 2.2 % in comparison with a 3.1 % growth of GDP, and the growth rate of foreign trade declined sharply as well (see Table 2).
In 2009, the Czech Republic was hit by a deep recession accompanied by a GDP decline of 4.5 % and by an even sharper drop in domestic demand (-5.1 %). Gross capital formation took the biggest hit as reserves dropped drastically and as investment in fixed capital fell by 11 %. Foreign trade registered a double-digit decline as well. Government final consumption expenditures (public consumption) were the only demand component to soften the GDP slump. A recovery occurred in 2010, which was important for foreign trade and reserves. These demand components became the workhorses of GDP growth, whereas the effect of final consumption and investment in fixed capital were insignificant. In 2011, domestic demand declined slightly as a result of a drop in public consumption, and GDP growth was driven solely by foreign trade. However during the course of the year, foreign demand declined and investment decreased, and growth dynamics slowed sharply. A new recession caused by a relatively strong slump (-2.8 %) in domestic demand occurred in 2012. Private consumption, which carries the most weight in the use of GDP (around 50 %), declined by 3.6 %, thus representing a negative contribution to GDP growth in the amount of 1.8 percentage points (p. p.). Such a sharp drop in household final consumption expenditures was not registered in the past twenty years. Public consumption and gross capital formation had a negative impact as well. The overall GDP declined only 1 % due to a strong positive impact of foreign trade (its contribution to GDP growth amounted to 1.5 p. p.). In 2013, the recession in the Czech economy continued and was caused, on the domestic demand side, by the continuing sharp decline in investment. Final consumption (primarily public consumption) began to rise slowly and foreign trade began to contribute negatively as imports outgained exports. During the entire six-year period (2008-2013) in which the Czech economy stagnated (the average annual GDP growth was practically zero), gross capital formation (fixed capital as well as reserves) fell sharply and final consumption rose only slightly (on average by 0.4 % annually). Foreign trade became an important source of growth for the
Table 2: Growth of final demand components in the Czech Republic (percentage annual change)
2008 2009 2010 2011 2012 2013 2008–2013
GDP 3.1 –4.5 2.5 1.8 –1.0 –0.9 0.1
Domestic demand 2.2 –5.1 1.9 –0.1 –2.8 –0.7 –0.8
Final consumption 2.3 1.3 0.7 –0.4 –2.1 0.6 0.4
Private consumption 3 0.2 1 0.5 –2.2 0.1 0.4
Public consumption 1.2 4 0.2 –2.7 –1.9 1.6 0.4
Gross capital formation 1.9 –20.2 5.4 0.8 –5 –4.4 –4.0
Gross fixed capital formation 4.1 –11 1 0.4 –4.5 –3.5 –2.4
Export 3.9 –10.9 15.5 9.5 4.5 0.2 3.4
Import 2.7 –12 15.5 7 2.3 0.6 2.3
Note: For the period 2008–2013 (6 years) is stated average annual rate of growth. Source: ČSÚ – quarterly national accounts (August 2014).

46Economy and minerals – Development of the Czech and global economies
Czech economy (the average annual contribution to GDP growth during this period was 0.9 %) because of its rising positive balance of exports and imports of goods and services.
Private consumption /7/ provided a relatively stable contribution to the growth of the Czech economy up until 2008. In 2009, it practically stagnated, which distinguished the course of the recession in the Czech Republic from the development in many EU countries, where precisely the decline in private consumption played a significant part in the slump in GDP. It was not until 2012 that private consumption, the main cause of the recession that year, fell sharply in the Czech Republic. But there are more factors involved in the drop in private consumption. They include growing unemployment, weak growth of wages and stagnation of disposable household income related to deteriorated labour market conditions, rising prices (primarily of energy and food), and also a growing tendency toward saving due to weak income growth and lower job security. A significant factor were fiscal restrictions, which led to lower wages in the government sector and to a cutback in social benefits. In 2013, household consumption stagnated completely (behaving differently during the course of the year, falling in the first half and rising in the second half of the year) and began to recover in 2014 due to an improved labour market (rising employment and wages) and a looser fiscal policy.
With the exception of 2009, the effect of public consumption /8/ was insignificant and negative in 2011 and 2012 as a result of austerity measures. Public consumption has been rising again since 2013. However, it is necessary to realize that public consumption represents only a part of public expenditures (government final consumption expenditures had a 20.7 % share of GDP in 2013, whereas the share of public expenditures amounted to 42.3 % of GDP that same year). Fiscal restrictions as well as a loosening of fiscal policy were reflected in this way not only in public consumption, but also in household consumption and investment.
Gross fixed capital formation /9/ had a positive effect on GDP growth in 2000-2008, particularly in 2007, but it left its mark primarily during the recession in 2009. During the recovery of the Czech economy (2010 a 2011), its contribution was negligible and, during the second recession in 2012-2013, its contribution was again negative. There were many causes for the drop in investment – from a decline in foreign and domestic demand to a decline in business profits and lower expectations regarding future trends. Government cost-saving measures, which led to a steep drop in public investment (primarily in infrastructure), had a negative impact as well. A revival in captital construction projects did not occur until 2014.
Of all the demand components, changes in reserves fluctuated the most. During the recession, poor demand and an uncertain outlook led producers and consumers to draw on reserves, and an increase in reserves, which became an important growth factor, did not occur until the recovery point set in. The drop in reserves decreased the GDP in 2009 by nearly 3 percentage points and, by contrast, increased the GDP by 1.4 percentage points in 2010. In 2012 and 2013, reserves decreased once again and contributed to a new recession in the Czech economy.
Because of the considerable openness of the Czech economy, foreign trade /10/ has an important impact on the development of the Czech economy. Since 2003 (with the exception of 2007 and 2013), changes in net exports have had a positive effect on GDP growth. A growing positive foreign trade balance contributed significantly in 2004-2006 in connection with the accession of the Czech Republic to the European Union. In 2011 and 2012, foreign trade was the only workhorse of the Czech economy because the influence of domestic demand was negligible in 2011 and even negative in 2012. The positive impact of foreign trade on GDP in 2012 was, however, not caused by a huge increase in exports of goods and services, which

47Economy and minerals – Development of the Czech and global economies
rose by only 4.5 %, but primarily by a small increase in imports (2.3 %), which were affected by a decline in domestic demand. A slowdown in export growth, which was outgained by import growth, occurred in 2013 and foreign trade contributed negatively to GDP growth. In general, however, foreign trade became an important growth factor in 2008-2012 and increased the Czech GDP on average by more than 1 percentage point annually. The future impact of foreign trade is difficult to predict because the anticipated rise in domestic demand will increase imports, wheras export growth will be influenced by the changing foreign demand. Therefore, foreign trade is expected to have only a weak positive impact on GDP growth.
3. Structural changes in the Czech economyIndustry plays a key role in the development of the Czech economy. Its share of gross value added (GVA) /11/ in the entire national economy is among the highest of all EU countries. This is due to the country’s historical development and position in the international division of labour. The development in industry was influenced by the changing foreign and domestic demand, as well as by a restructuring phase connected with changes of ownership and with a growing number of private companies under foreign control, which distinguish themselves by higher productivity and by the ability to penetrate demanding markets.
Industry experienced high dynamics in 2005-2008 (with an annual average of 11.7 %), which by far surpassed the growth of other sectors and the average of EU countries as well. The recession in 2009 changed the supply side of the economy significantly. The strong real growth of industry GVA/12/ from previous years was followed by a sharp decline of 13.4 % (see Table 3). This development was marked by a sharp drop in foreign demand, which was reflected immediately in a decrease in domestic production at a time characterized by considerable openness of the Czech economy and by an export-oriented manufacturing industry. Industrial production recovered in 2010 and 2011, but it declined again in 2012 and 2013, primarily in the automotive industry, in connection with the decline in domestic and foreign demand. Industrial production declined for 5 quarters (from the second quarter of 2012 until the second quarter of 2013) and its recovery, which also continued in 2014, did not occur until the second half of 2013. Agricultural production fluctuated considerably due not only to changes in demand but also due to the effects of weather. In 2009, it registered high growth rates and thus reduced the decline in GVA in the national economy. However, it fell sharply in 2010-2013. Construction has been in a crisis since 2008 as a result of a long-term decline in capital construction activities. Construction output did not begin to rise until 2014 as capital construction revived. Services as a whole registered a decline in GVA during the recession of the Czech economy (2009 and 2012-2013) and, thereby, together with industry, played a role in the lower output of the Czech economy. Nevertheless, the decline in GVA in the services sectors was significantly lower than the decline in industry, and this confirmed the fact that services are more resistant to cyclical economic fluctuations and less dependent on foreign demand. Trade and transportation accounted for the highest decrease in GVA, while considerable growth was maintained by banking and insurance.
In recent years, sectoral changes in the Czech economy drew closer to the structure prevalent in EU countries. Agriculture’s share of total GVA continued to decline from 2.6 % in 2005 to 2.4 % in 2013 (see Table 4), which is near the average of the EU-27 (1.7 %). By contrast, industry’s share grew and its share of total GVA in the national economy already surpassed 30 %. The nearly 32 % share in 2013 ranked behind Romania as one of the highest of the EU countries (the EU average in 2013 was only 19.1 %). The share of the mining and quarrying

48Economy and minerals – Development of the Czech and global economies
industry is very low and has in recent years been affected by the dramatic fall in GVA in 2008 and 2009, and by negative growth in subsequent years. The importance of construction has been declining as a result of the long-term crisis in this industry due to a strong decline in capital construction. The share of services in GVA hovers around 60 %, but it still remains low when compared internationally (the share of services in the EU-27 reached 73.5 % in 2013).
The importance of mineralsThe importance of minerals, measured by this sector’s share of gross value added and employment in the entire national economy of the CR, remains very small and has a declining trend. The mining and quarrying industry’s share of total GVA decreased from 1.3 % in 2005 to 1 % in 2013. Employment in mining and quarrying has also been falling over the long term and the industry’s share of total employment in the national economy fell to 0.7 % in 2013. Mining and quarrying’s lower share of total employment in the national economy than its share of total GVA shows that labour productivity in this industry is higher compared with the average productivity in the entire national economy.
According to the index of industrial production /13/ based on the production statistics for selected products, mining and quarrying underwent a complex development in 2008-2013 and production continued to decline with the exception of 2011. Compared to 2005, production in this industry fell by nearly 20 % (the fixed base index of industrial production 20013/2005
Table 3: Growth of gross value added by industries (percentage annual change)
2008 2009 2010 2011 2012 2013
Agriculture 7.3 26.4 –26.6 –2.0 –4.1 –9.8
Industry (total) 10.0 –13.4 6.2 5.5 –0.8 –0.7
Mining and quarrying –12.0 –11.2 –5.6 –7.1 –3.1 –10.3
Manufacturing 10.7 –15.4 12.2 8.6 0.0 –0.4
Electricity, gas and water 16.6 –9.5 –9.7 –4.8 –3.1 0.6
Construction –0.9 –1.5 5.3 –5.2 –5.8 –1.6
Services 1.3 –2.5 2.3 1.0 –0.4 –0.5
GVA total 4.1 –5.2 3.1 1.8 –1.0 –0.9
Note: GVA calculated at basic prices differs from GDP by taxes and subsidies on products. Source: ČSÚ – annual and quarterly national accounts (July 2014).
Table 4: Structure of gross value added (current prices) and employment (in per cent)
Gross value added Employment
2005 2010 2013 2005 2010 2013
Agriculture and forestry 2.6 1.7 2.4 3.8 3.2 3.2
Industry 31.3 29.7 31.8 29.5 26.5 27.2
Mining and quarrying 1.3 1.3 1.0 0.9 0.7 0.7
Construction 6.7 7.3 6.0 9.3 9.6 8.9
Services 59.5 61.3 59.8 57.4 60.7 60.7
Source: ČSÚ – annual and quarterly national accounts (August 2014), own calculations.

49Economy and minerals – Development of the Czech and global economies
equalled 81.0). The fall in the production of energy minerals was even sharper. Production and processing of bituminous and brown coal fell by one-fourth in 2006-20013. On the other hand, production of crude oil and natural gas rose, but it carries very little weight in the entire mining and quarrying industry. The future trend in the production and processing of bituminous and brown coal, which has the largest share of production in mining and quarrying (nearly 70 %), will depend on the trend in demand and on resolving the issues of ecological limits in North Bohemia.
The position of mining and quarrying in the entire national economy is shown in Table 5. Gross value added in current prices in mining and quarrying grew in 2005-2008 and, as a result of a sharp rise in prices, the industry registered strong growth in 2008. However, the situation worsened dramatically during the double-dip recession and general stagnation of the Czech economy in 2009–2013, when prices rose only slightly and GVA declined in real terms.
From a macroeconomic perspective /14/, the low and diminishing importance of mining and quarrying is due to the Czech Republic’s mineral scarcity (with the exception of coal and construction minerals) and dependence on imports of important energy minerals and other raw materials (primarily crude oil and natural gas). Other additional factors are the ongoing structural changes and the declining importance of a mineral-dependent industry. According to the tables of inter-industry relations for 2010 /15/, a decisive part of resources (domestic production and imports) of the mining and quarrying industry was used for intermediate products (nearly 70 %), and the largest consumers are two industries – production of coke and petroleum refining, and the supply of electricity, natural gas and water. In the case of other minerals, there are three main consumers – production of other non-metallic mineral products, production of basic metals, and construction. Minerals used primarily for the production of construction materials such as stone, sand, limestone, kaolin thus reflect the situation in construction output. That is why it is necessary to also assess the importance of domestic minerals based on the weight of the mineral-based manufacturing branches in the national economy. Environmental aspects are also an indispensable factor because the mining industry has a predominantly negative effect on the environment.
4. Global economic developmentThe development in the global economy deteriorated rapidly in recent years and, after years of strong expansion, the world entered a very difficult period marked by the global financial crisis and recession in most countries. The economic crisis in 2008 and 2009 was the deepest
Table 5: Gross value added in current prices (CZK billion)
2008 2009 2010 2011 2012 2013
Agriculture 80.3 65.1 56.7 79.8 81.4 82.6
Mining and quarrying 50.4 43.0 44.0 46.3 40.5 33.3
Manufacture 846.3 764.6 785.5 825.3 852.9 869.5
Elektricity, gas and water 188.8 211.0 186.0 178.6 176.4 199.2
Construction 235.7 242.2 250.8 233.9 216.8 206.2
Services 2078.4 2064.3 2097.3 2080.6 2083.7 2073.3
GVA total at basic prices 3479.9 3390.2 3420.3 3444.5 3451.7 3464.1
Source: ČSÚ – annual national accounts (August 2014).

50Economy and minerals – Development of the Czech and global economies
recession of the post-war era (the GDP in developed countries fell by 3.4 % in 2009). Only a weak recovery ensued in 2010 and 2011, and another recession (see Table 6) occurred in many European countries in 2012 and 2013. It is therefore possible to talk of a global economic crisis, which caused long-term economic stagnation with substantial losses in production, consumption, investment and foreign trade. It led to a rise in unemployment and to worsening public finances, and its consequences have yet to be overcome. The situation became critical in the European region, which became the weakest link in the global economy. The recovery that occurred in 2014 is optimistic, but it remains weak and considerably uneven. Positive aspects include greater financial sector stability, an improving labour market situation and a recovery in domestic demand. The situation of public finances remains complex. Economic policies therefore face difficult problems – stabilizing the financial system, stimulating economic growth, not worsening public finances, and reducing macroeconomic imbalances.
The recession in 2008 and 2009 was preceded by the global financial crisis, which was caused by many factors, such as prior sufficient liquidity, low interest rates, strong growth in credit and asset prices (primarily real estate) as well as grants of loans to clients incapable of making payments. Complex capital and high-risk transactions using sophisticated financial instruments and insufficient transparency in and regulation of the financial market had a negative effect as well. In a global and considerably liberalized financial system, the crisis spilled over into Europe and other countries from the USA. Even though there were signs of the unsustainability of existing trends (many overheating economies, financial market bubbles, growing macroeconomic imbalances), analysts were not able to recognize the looming dangers in time and even economic theory was not prepared for a collapse of financial markets and, as a result, appropriate economic policies were not available.
The world product declined in 2009 by 0.4 % after an average annual growth of nearly 4 % in 1999-2008, and developed countries registered the sharpest drop in economic activity in the entire post-war era. The depth of the recession measured by the year-on-year decline in GDP was strongest in the first half of 2009, when the GDP fell according to seasonally adjusted data by 5.5 % in the EU-27 countries, by 7.9 % in Japan, and by 3.8 % in the USA. The length of the recession varied by country, but it mostly lasted 4–5 quarters. The crisis created unfavourable conditions for future growth. The financial system was rocked, businesses and households did not obtain loans, which they needed to revive investment and consumption, and the situation of public finances became critical as their deficits became unbearable and as government debts rocketed. The combination of the global financial crisis and the deep recession produced a recession of unprecedented depth as well as length when compared with previous recessions.
In 2010 a recovery occurred, which was driven in the first half of the year by an increase in reserves and by continuing pro-growth macroeconomic policies, but the strong effect of reserves weakened in the second half and fiscal consolidation policies began to be put into effect. A decent growth rate was maintained because of confidence in a long-term recovery, which led to growth in investment, consumption and foreign trade. For the entire year, the GDP grew by 2 % in the EU and by 2.5 % in the USA. The recovery was expected to last longer and growth was expected to gradually increase.
The year of 2011 began promisingly because GDP growth was relatively high in the first quarter, but the growth rate declined during the course of the year. In September 2011, international organizations lowered their economic outlook for the majority of countries and regions around the world. The reason was not only a declining growth trend but also growing risks for future development. These included the instability in financial markets, the ongoing

51Economy and minerals – Development of the Czech and global economies
macroeconomic imbalance, the difficult labour market condition, and also the serious debt crisis in Greece, Portugal and Ireland, which began to spread to larger European economies (Spain and Italy) with a looming danger for banks holding bonds of vulnerable countries. Confidence declined and doubts rose among consumers and investors.
Economic growth weakened in 2012 and 2013, compared to 2010 and 2011, in both developed and emerging countries. However, the average numbers for the entire global economy or for its individual regions conceal considerable differences between countries, which have grown as a result of the crisis. The situation became serious in the EU countries, many of which experienced a new recession in 2012 and 2013. In 2012, the GDP declined by 0.4 % in the entire EU and by 0.7 % in eurozone countries. In 2013, the European Union stagnated and a weak GDP decline continued in eurozone countries, which was influenced by a recession in Greece, Cyprus, Italy, Portugal, Slovenia and Spain. On the other hand, economic growth was relatively strong (2.8 %) in the USA primarily in 2012. Emerging and developing countries grew fastest even though their growth rates declined.
Forecasts of global economic trends for 2014 and 2015 made by international organizations predict accelerating growth in developed countries (1.8 and 2.4 %) and, by contrats to past years, weaker growth in emerging countries. The latest analyses indicate a three-speed global economic growth. Emerging economies are still experiencing relatively fast GDP growth nearing 5%, growth in the USA is expected to surpass the growth dynamics of European countries, and the European Union is expecting only a weak recovery.
An economic recovery occurred in developed countries in 2014 due to the stabilization of the financial sector, the revival in domestic demand and due to structural reforms. Economic activity grew in the USA in the second half of 2013, but the growth became negative in the first quarter of 2014 as a result of a harsh winter and other factors such as completion of stock replenishment, tightening of fiscal policy, and lacklustre foreign demand. A relatively strong growth is expected in subsequent quarters, but the GDP growth for the entire year will not be very high (1.7 %). It may not be until 2015 that the growth rate will have reached its highest values since 2005 (3 %) as a result of fast growth in household consumption, a rise in housing
Table 6: IMF projection of real GDP growth (annual percentage change)
2008 2009 2010 2011 2012 2013 2014 2015
GDP – world 2.7 –0.4 5.2 3.9 3.5 3.2 3.4 4.0
United States –0.3 –2.8 2.5 1.8 2.8 1.9 1.7 3.0
Euro area 0.4 –4.4 2.0 1.6 –0.7 –0.4 1.1 1.5
Japan –1.0 –5.5 4.7 –0.5 1.4 1.5 1.6 1.1
China 9.6 9.2 10.4 9.3 7.7 7.7 7.4 7.1
India 3.9 8.5 10.3 6.6 4.7 5.0 5.4 6.4
Russia 5.2 –7.8 4.5 4.3 3.4 1.3 0.2 1.0
Developed countries 0.1 –3.4 3.0 1.7 1.4 1.3 1.8 2.4
Emerging and developing
countries5.9 3.1 7.5 6.3 5.1 4.7 4.6 5.2
Volume of world trade 2.8 –10.6 12.8 6.2 2.8 3.1 4.0 5.3
Note: The years 2014 and 2015 are projection of IMF. Source: IMF – World Economic Outlook, April 2014, p.2 and World Economic Outlook Update, August 2014.

52Economy and minerals – Development of the Czech and global economies
construction and other investments, and due to greater credit availability. The European Union, which was hit by a debt crisis, became a problem and some countries of the eurozone (primarily its southern part) found themselves in a very serious economic situation. In its forecast from May 20142, the European Commission anticipates a recovery in 2014 and 2015 (GDP growth of 1.6 % and 2 %), which should be driven by a growth in domestic demand (household consumption and investment). The majority of countries registered positive growth in the first half of 2014. A relatively high GDP growth rate was registered in Poland, Hungary, Slovenia, Great Britain, Lithuania, Latvia, the Czech Republic and Germany. On the other hand, negative growth continued in Greece, Croatia, Italy and Cyprus. Following the earthquake in March 2011, the Japanese economy experienced a weak recovery, which should also continue in 2014 and 2015. It should be aided by a loose monetary policy and structural reforms, primarily in the labour market. The necessity of achieving fiscal stability as a result of a high government debt remains an obstacle to faster growth.
In recent years, the workhorse of the global economy were emerging and developing countries, accounting for half of the world’s GDP. In 2008-2013, their average annual growth reached 5.4 %, while developed countries grew only by 0.7 %. Because of their growth in 2009 (2.7 %), the drop in global economic activity was not sharper that year. These countries were also the locomotive for the global economy in subsequent years. However, the growth dynamics are declining even in these countries. The fastest growing region became emerging Asia dominated by China, which became the world’s second largest economy behind the USA and whose contribution to global growth was roughly one-fourth. However, the Chinese economy, which is heavily oriented on investments and export, is feeling the cooldown in the global economy, and its growth rates are declining and its economic policies need to shift towards stronger domestic consumption. In 2013, the GDP growth amounted to 7.7 % and a growth of 7.5 % is expected in 2014.
Public finances deteriorated considerably due to the worst post-war recession, and the development in public finances combined with a sharp increase in government deficit and debt became a risk factor for the development of the majority of developed countries. The financial crisis and recession led, on one hand, to a decrease in tax revenues and, on the other, to increased budget expenditures connected with growing unemployment, bank rehabilitation and
2 ECFIN: European Economic Forecast. Spring 2014. European Economy 3/2014.
Table 7: General government deficit in selected advanced economies (as a percentage of GDP)
2008 2009 2010 2011 2012 2013 2014
Big advanced economies –5.1 –10.8 –9.6 –8.2 –7.3 –5.9 –5.1
USA –7.8 –14.7 –12.5 –11.0 –9.7 –7.3 –6.4
Japan –4.1 –10.4 –9.3 –9.8 –8.7 –8.4 –7.2
Euro area –2.1 –6.4 –6.2 –4.2 –3.7 –3.0 –2.6
Germany –0.1 –3.1 –4.2 –0.8 0.1 0.0 0.0
United Kingdom –5.0 –11.3 –10.0 –7.8 –8.0 –5.8 –5.3
Note: the year 2014 is projection of IMF. Source: IMF World Economic Outlook, April 2014, p. 192.

53Economy and minerals – Development of the Czech and global economies
fiscal stimulation of demand. The deteriorated fiscal situation was reflected in financial markets, in the private sector’s willingness to finance huge government deficits, and in the growing costs of this financing. The rising deficits in public finances surpassed the limit for sustaining long-term fiscal stability and, after the crisis in 2009, the majority of countries began implementing austerity measures, which weakened growth but, on the other hand, helped reduce the high government deficits (see Table 7).
The rise in government debt, which has reached its highest level in developed countries since the end of World War II, became perilous. Government debt, which basically reflects accumulated government deficits, grew in 2013 compared to 2008 by nearly 32 percentage points in the USA and by 25 percentage points in the eurozone (see Table 8). The trend of another increase in government debts became dangerous. Of the largest developed countries, Japan had the highest debt in 2013 (243.2 %), followed by the USA (104.5 %). As government debt grows so does the debt service (payment of interest and principal), which puts a considerable strain on public budgets. That is why some countries got into a situation where obtaining financial resources became difficult and at a cost of high interest. The debt crisis mainly affected the southern part of the European Union. The most serious situation existed in Greece (government debt in 2013 reached 175.1 % of GDP), which was saved from bankruptcy by loans from the European Union, the European Central Bank and IMF. However, the financial help is tied to reduction of government deficits, to reforms promoting competitiveness, and to measures strengthening financial sector stability.
Table 8: General government gross debt in selected advanced economies (as a percentage of GDP)
2008 2009 2010 2011 2012 2013 2014
USA 72.8 86.1 94.8 99.0 102.4 104.5 105.7
Japan 191.8 210.2 216.0 229.8 237.3 243.2 243.5
Euro area 70.3 80.1 85.7 88.1 92.8 95.2 95.6
Germany 66.8 74.5 82.5 80.5 82.0 80.4 78.3
United Kingdom 51.9 67.1 78.5 84.3 88.6 90.1 91.5
Note: the year 2014 is projection of IMF. Source: IMF World Economic Outlook, April 2014, p. 192.
Employment declined and unemployment, which represents a serious economic and social problem, grew as a result of the recession. The loss of jobs and household income during the recession led to lower household consumption and contributed to the decline in GDP, the repayment of loans declined and, thus, bank losses grew and the situation in the real estate market worsened. Growing unemployment had a negative effect on public budgets (higher expenditures and lower tax revenues). Long-term unemployment, which lowers the potential output, grew. Unemployment has a profound impact on young people, which threatens a country’s social cohesion. Even though the situation in the labour market is different in various countries, growth in unemployment has, in recent years, been enormous and experience from past recessions shows that the labour market recovers slowly and that the unemployment rate will also remain high in 2014.
The long-term unemployment rate was lower in the USA than in Europe (except for a sharp rise during the recession in 2009). In July 2014, the unemployment rate in the EU was 10.2 %,

54Economy and minerals – Development of the Czech and global economies
but only 6.2 % in the USA (see Table 9). Among the countries of the European Union, Spain (24.5 %) and Greece (27 %) had the highest unemployment rate in July 2014. The lowest unemployment rate was recorded in Austria and Germany (4.9 % in both countries). A drop in Germany’s unemployment rate (from 7.8 % in 2009 to 4.9 % in July 2014) was brought about not only by a revival of economic avtivity, but also by the fact that the majority of businesses did not lay off their employees and tried to retain them at reduced hours. The Czech Republic was one of the countries with a relatively low unemployment rate. In July 2014, it reached only 6 % and decreased by nearly 1 percentage point compared to the same period last year.
Table 9: Unemployment rate in selected countries (in per cent)
2008 2009 2010 2011 2012 2013 2014
USA 5.8 9.3 9.6 8.9 8.1 7.4 6.2
Japan 4.0 5.1 5.1 4.6 4.3 4.0 3.8
EU-28 7.1 9.0 9.6 9.6 10.4 10.8 10.2
Germany 7.5 7.8 7.1 5.9 5.5 5.3 4.9
Greece 7.7 9.5 12.6 17.7 24.3 27.3 27.2
Spain 11.3 18.0 20.1 21.7 25.0 26.4 24.5
Note: the figures for the year 2014 are related to July 2014. Source: ECFIN European Economic Forecast, Spring 2014, p. 143 and EUROSTAT, newsrelease 129/2014, 29 August 2014.
The trend in inflation was affected by substantial fluctuations in demand. The sharp rise in commodity prices in 2007 and in the first half of 2008 was followed by their strong decline connected with dampened demand in the second half of 2008 and during the course of 2009, when the inflation rate fell sharply in developed countries. A revival of economic activity and demand in 2010 and 2011 led to a renewed rise in inflation, primarily due to a sharp increase in energy and commodity prices. The trend in 2012–2014 was marked by idle capacities, stagnating demand and moderate inflation expectations. As a result of this, the inflation rate fell to a historical low level (in developed countries, the average inflation rate measured by the consumer price index was only 1.5 % in 2013 and, according to a forecast by the European Commission, the inflation rate in the EU should hover around 1 % in 2014 and rise to 1.5 % in 2015). In some countries, there were even concerns of deflation. That is why central banks proceeded to lower interest rates. In November 2013, the Czech Central Bank even decided to weaken the exchange rate of the Czech crown as an additional instrument for loosening monetary conditions.
However, the situation is more serious in emerging countries, most of which did not enter a recession and which maintain high growth. The inflation rate in these countries is significantly higher. In 2013, consumer prices rose by 4.5 % in emerging Asia. China is experiencing a moderate rise in consumer prices at 3 %. On the other hand, India has a high inflation rate hovering around 9 %. The countries of the Commonwealth of Independent States are also facing a high inflation rate, which amounted to 6.4 % in 2013. Belarus had an extremely high inflation rate (18.3 %).
The globalization and intensification of business and capital flows between countries helped produce considerable external imbalances/16/ as reflected by high current account deficits in one group of countries and large surpluses in other countries. It was possible to cover the

55Economy and minerals – Development of the Czech and global economies
current account deficits of one group of countries with the savings of the second group of countries during the expansion of the global economy, which occurred as a result of considerable expansion in the financial sector, liberalized capital flows and sufficient disposable financial resources. Ironically, capital did not flow from developed countries to developing ones, as may be expected, but the largest recipient of foreign savings was the US economy. The highest current account surpluses were reported by China, Japan and countries exporting crude oil. The financial crisis demonstrated the considerable danger resulting from high current account deficits because countries with high deficits had difficulties in financing them and were forced to adopt drastic austerity measures, which deepened the recession. Although the imbalances declined in recent years due to the recession and only weak economic growth, IMF still stresses the need for specific restructuring of economic growth and recommends that countries with sizeable current account surpluses strengthen domestic demand and the exchange rate, whereas deficit-plagued countries promote exports by reinforcing structural reforms.
5. Foreign trade and external economic balance3 In 2008-2012, the Czech economy faced some major external impacts, which were initially related to the global financial (economic) crisis or, more precisely, the European debt crisis. Although the Czech economy was not directly affected by the financial crisis (due to limited involvement of domestic financial institutions in international markets, particularly the US market), negative impacts were felt by its main trading partners and indirectly by the CR as well. The reason was that foreign demand and changes in foreign trade strongly influenced the development of the Czech economy, which may be characterized as a small open economy.4 As the Czech economy became increasingly involved in multinational supply chains at the beginning of the new century due to an inflow of foreign investment, the share of imports and exports in GDP (and import intensity) grew. Nevertheless, domestic suppliers continue to play a different role in individual types of production cooperatives (only minimal in many cases of technically demanding production).5 Thus, economic growth depends to a certain extent on the behavior of foreign capital because the number of foreign-controlled companies (tied to foreign direct investment, FDI) in some industries exceeds 50 % (see below). This was influenced to a large extent by a system of investment incentives, which was adopted after 2000, and an additional impulse was the accession of the CR to the EU in 2004, which translated to expansion and easier penetration of European markets (although the majority of barriers
3 This section also contains data published in the ESA 1995 methodology, specifically according to the fifth edition of the Balance of Payments Manual (BPM5). New data in accordance with the sixth edition of the manual (BPM6) will be published by the Czech National Bank (CNB) in October 2014, specifically in connection with the transition to ESA 2010.4 In current prices, the share of imports and exports in GDP increased from about 125 % during the accession to the EU to 151 % in 2013, which is one of the highest values in the entire EU. (However, this comparison is not entirely correct because foreign and domestic prices are compared, and prices in domestic economies are usually undervalued in the case of transition economies. However, the openness of the Czech economy is relatively high even when comparative price levels (so-called parities) are used.5 The latest MPO CR estimate shows that in 2011–2012, on average, up to 50 % of imports were destined for manufacture, about 29 % for investment, and the rest for private consumption (breakdown according to anticipated use), see MPO: Analýza vývoje ekonomiky ČR za rok 2013/Survey of the Czech Economy in 2013. MPO, Prague, May 2014, p. 83.

56Economy and minerals – Development of the Czech and global economies
were eliminated already prior to the actual accession) and also to a stimulus for non-European companies to branch out in the Czech Republic.6
Production and trade cooperation was also reflected very clearly in foreign trade data – exports grew rapidly, their structure, technical level as well as prices changed, and substantial changes in the terms of trade /17/ occurred. On the other hand, this strong pro-export orientation represents a problem, which was reflected in an external demand shock accompanying the financial and debt crisis. The relatively long-lasting crisis, comparable to the crisis in the 1930s, and the need to resolve problems in many European economies also affected the main economic engine of the EU and eurozone – Germany, which is the main long-term trading partner of the CR and whose share of Czech imports and exports amounts to more than one-third. The renewed growth in exports was lower in 2010 than that of imports, and the year-on-year growth rates of imports and exports declined overall, and data for 2013 indicate year-on-year growth dynamics of only around 1 % (see Figure 3). The impacts of the crisis were also clearly evident in the average growth rate of imports and exports of goods, which reached about 12 % and 10 % in pre-crisis years, and only 4.3 % and 3.3 % after 2008.
The fundamental importance of foreign trade for the CR may be exemplified by the high GDP share of exports of goods and services, which has gradually been rising since 2004 and which approached 60 % for exports and imports of goods (at current prices) before the outbreak of the financial crisis in 2007. The crisis had an impact here as well, specifically in the form of an unusual year-on-year decline in 2009 of more than 5 and 7 p.p. in total exports and imports, respectively. However, the previous growth trend already revived the following year, and exports and imports of goods exceeded 78 % and 72 %, respectively, in relation to GDP in 2013.
In the decade after 2004, the development was characterized by strong growth dynamics in 2006 and 2007, as two-digit growth rates of exports and imports were registered, which were
6 The mentioned problem is tied in with the FDI structure, which was not very favourable because the dominant forms of cooperation were based on cost advantage, or connected with low value added. At the present time, it will be interesting to observe the behaviour of foreign investors, whose negotiated subsidies are slowly ending.
Note: av. = average of growth rates over a period. Source: ČSÚ, Quarterly GDP time series (September 2014), own calculation.
Figure 3: Growth rates of export and import, 2004–2013 (goods only, y-on-y changes, in %, current prices)
export import

57Economy and minerals – Development of the Czech and global economies
followed by year-on-year declines in the growth rates of imports and exports in 2008 to 2009 (accelerating in 2009 with a faster decline in imports, see Figure 3). However, the recovery that ensued in 2010, also partially due to a statistical effect, gradually slackened.7 The comparison of long-term (ten-year) growth rates of both magnitudes (in 2004–2013) shows that, in the case of Czech export of goods, the average growth rate was 6.7 % and that it exceeded the average growth rate of imports (5.6 %) by more than 1 p.p. However, the effect of the crisis was also reflected very clearly in the pre- and post-crisis growth rates of the past six years.
Despite a temporary stagger during the first years of the crisis, which was exceptional on a global scale,8 the impressive results of Czech foreign trade in recent years point to the growing competitive strength of domestic production, which is gaining ground in challenging markets (faster growth in exports than imports). This is also supported by the fact that the foreign trade balance has improved considerably (the overall balance entered the positive zone in 2004, see Figure 4) in spite of a slowdown in economic activity in 2008–2009 in the old EU countries, and primarily in Germany. From a macroeconomic perspective, it is also important that foreign trade has become an important factor of GDP growth on the demand side, specifically its positive contribution partially compensated the decline in domestic demand and, thus, softened the impacts on the overall economic performance in the past few years.
The trade balance surplus in 2013 surpassed the record level from 2012 and, thus, represents a new record high in the history of the Czech Republic (CZK 247.1 billion). The positive year-on-year foreign trade balance grew by one-seventh and, during the ongoing European debt crisis, surpassed the highest ever surplus generated in 2012 (about CZK 215 billion), or in 2009 (about CZK 152 billion), i.e. a period of relatively very weak global prosperity. This
7 Although a more detailed breakdown or econometric analysis was not conducted, it seems that the given data clearly illustrate the import intensity of the Czech economy when time delays exist, as declining sales led to a faster decline in imports (2009) and, subsequently, to their growth during a revival in production (2010); other important factors were the effects of the crown’s exchange rate and commodity prices.8 The largest worldwide decline in the post-war era occurred in 2009, as trade fell by 10.3 % accompanied by a slight fall in GDP and a one-third decline in FDI flow (see UNCTAD: World Investment Report 2013. UN, Geneva & New York, 2013).
Note: values reflect the national accounts methodology. Source: ČSÚ, Quarterly GDP time series (September 2014), own calculation.
Figure 4: Balance of external trade, 2001–2013 (constant prices, billion CZK)
total goods services

58Economy and minerals – Development of the Czech and global economies
result may be regarded as proof of the competitive strength of Czech exports even in a turbulent and highly unfavourable economic environment. The growth in the trade surplus in goods, which compensated the year-on-year lower services trade surplus, was reflected more strongly in the overall surplus. This result was also partially aided by the exchange rate of the Czech crown, which temporarily returned to the values in 2006 and 2007 and which remained in a relatively narrow range since mid-2010 (at an average of 25.1 CZK/euro) until the exchange rate intervention of the CNB at the beginning of November 2013 (introduction of an exchange rate “floor” of 27 CZK/Euro), after having appreciated considerably (overshooting long-run equilibrium paths) in 2000-2002 and primarily from mid-2007 to mid-2008. This artificial intervention into the exchange rate movement was reflected in a further weakening to 27.50. This temporary depreciation of the Czech crown was not immediately apparent in the behaviour of exporters vying for customers (due to existing contracts), but it created room to react to fluctuations in demand via price adjustments .9 10
From a long-term perspective, it is possible to consider not only Czech Republic’s accession to the EU as one of the factors leading to favourable results of Czech foreign trade, but primarily also the strong inflow of foreign direct investment directed at industries with a high share of exports (e.g. manufacture of transport equipment, telecommunication equipment, consumer electronics and computer technology),11 and the process of gradually diversifying trading partners (and export markets), which allows for the weakening prosperity of the main Czech trading partner (Germany) to be compensated for by exporting to other markets in EU countries or the world.
In terms of commodities, the highest deficit in foreign trade is traditionally generated by group SITC 3 (mineral fuels, lubricants and related materials – see Figure 5). The surpluses from group SITC 7 (machinery and transport equipment) are still capable of compensating for the deficit without major problems.12 Figure 5 shows the trend in the balance of group 3 and
9 However, this is a matter for future analysis of this intervention to see what the actual effects were. The initial information from exporters indicates that rather losses were generated from unsecured monetary standing, from the need to purchase more expensive raw materials abroad, or from being forced to provide discounts on products sold abroad. However, the so-called J-curve effect should occur in the long term, as exporters adapt to (and change because of) the new exchange rate conditions. This “textbook” behaviour will, however, be influenced by the fact that this is an artificial and temporary intervention in the exchange rate, partially increasing the already relatively high uncertainty, thus restricting potential positive effects (e.g. as a result of various considerations such as how long will the exchange rate be artificially “depressed”, what will happen after the “floor” is eliminated, etc.).10 In connection with this, it cannot be overlooked that, in past years, Czech exports also profited partially from measures implemented to strengthen prosperity in some countries (“scrappage scheme“). See MPO: Analýza vývoje ekonomiky ČR a odvětví v působnosti MPO za rok 2009/Survey of the Czech Economy and MIT Sectors in 2009. Prague, MPO, April 2010, p. 53.11 To a certain extent, a factor may also be a change in the structure of investments, such as FDI, which were directed at more technologically demanding industries that withstand demand shocks more easily than “run-of-the-mill” companies belonging to the manufacturing industry. This is also reflected in the structure of imports and exports according to the degree of processing – the latest data for 2012 show that products with a higher degree of processing had a share of about 85 % of exports and 72 % of imports, see MPO: Analýza vývoje ekonomiky ČR za rok 2012/Survey of the Czech Economy in 2012. MPO, Prague, April 2013, p. 81. 12 This surplus must also compensate the deficit in foods and live animals (SITC 0), hovering on average around CZK 30 billion (CZK 32 billion in 2013) since 2005, and primarily the sizeable deficit in chemicals (SITC 5), which has been hovering above CZK 100 billion annually (CZK 127.4 billion in 2013) since 2011.

59Economy and minerals – Development of the Czech and global economies
of all other groups since 2005, specifically based on the so-called national concept.13 Based on this concept, it is clear that both the effect of the crisis as well as the improvement in Czech exports are by far not as clear-cut as it seems to be above in Figure 4.
The foreign trade balance (surplus) based on the national concept increased year-on-year in 2013 by CZK 42.1 billion and, for the first time since being monitored, exceeded CZK 100 billion. However, the trend in individual commodity groups varied considerably. This was still influenced by factors connected with the ongoing financial crisis (uncertainty, heightened volatility), by many non-standard monetary policy measures aimed at strengthening economies, and also by the above-mentioned trend in the exchange rate of the Czech crown. In recent years, the relatively stronger exchange rate of the crown limited the rise in commodity prices at least to a partial extent – its artificial weakening led to an increase in imported commodity prices, which was compensated for by continued stability, specifically by the decline in the global prices of some commodities such as crude oil (for more details see below). In spite of that, the deficit level in the case of mineral fuel and lubricant imports was the highest since 2005 (about CZK 195.5 billion, a year-on-year increase of CZK 6.6 billion). The deficit in chemicals grew slightly as well (from CZK 123.2 billion to CZK 127.4 billion). The deficit in food and live animals grew slightly year-on-year (from CZK 30 billion to CZK 32 billion). Group 1 (beverages and tobacco) reached a surplus again in 2013 (rising from CZK 1 billion in 2012 to CZK 2.3 billion). The higher deficit in mineral fuel imports was compensated for by continued surplus growth in manufactured goods classified chiefly by material (group 6, rising year-on-year by CZK 5.3 billion to about CZK 32 billion) and in consumer goods (group 8) that grew by about CZK 15.5 billion. However, the main group consistently yielding surpluses in Czech foreign trade is group 7 (machinery and transport equipment), which registered a year-on-year increase of CZK 33.8 billion in its surplus, reaching a new record level of CZK 378.9 billion.
The trend in the foreign trade balance according to the two main groups is shown clearly in
13 The national concept of foreign trade is based on the change of ownership between residents and non-residents and not only on the movement of goods across borders (customs statistics), which is traditionally used in foreign trade statistics. The national concept is compatible with the method of national accounts and balance of payments.
Note: according to SITC Rev. 4, section 3 includes mineral fuels, lubricants and related products. Values for 2013 are preliminary. Values for export (FOB) and import (CIF) include estimates of the CZSO. Source: ČSÚ, Main external trade statistics indicators based on the national concept (the principle of change of ownership) (September 2014), own calculation.
Figure 5: Balance of external trade (national concept), 2005–2013 (billion CZK)
total SITC 3

60Economy and minerals – Development of the Czech and global economies
Figure 6 (quarterly and cumulative quarterly balances). While group SITC 3 had a relatively stable deficit value during the entire period monitored, which changed mostly due to imported raw material prices and exchange rate fluctuations (gradually growing to about 5 % of GDP, see line showing the cumulative balance according to quarterly data), a gradual improvement in the export performance of the Czech economy is apparent in the balance that includes other groups (data from the latest quarter already exceeded 8 % of GDP), but the cumulative trend already indicates that the surplus has leveled off.14 A striking fact is the influence of energy mineral price changes, reflected in the rise in the balance deficit of group 3 in 2005–2006 (from nearly 3 % to 4.5 % of GDP), or since 2009 (from 2 % to nearly 5 % of GDP in the last quarters), which greatly influenced the total foreign trade balance. This was caused by two conflicting factors that changed over time – a continuing rise in raw material prices or their stagnation, and also a slight decline and gradual weakening of the Czech crown.
Structure of tradeIn terms of the territorial structure of foreign trade, only small changes occurred after the accession of the CR to the EU (major changes occurred already during the transformation of
14 The balance of other groups is included in one aggregate and does not show the trend of its individual components. The dominant item thus far has clearly been the trend in group SITC 7 (about 84 % of the total balance), which allows us to use this simplification.
Note: according to SITC Rev. 4, Section 3 includes mineral fuels, lubricants and related products. Ratio is calculated as a fraction of total balance (without Section 3) and balance of Section 3; k_SITC3 is cumulative 12M balance of Section SITC3 (a simple (non-centered) four-quarter moving average), k_rest is cumulative 12M balance of all remaining sections (calculated in the same way). Values for 2013 and 2014 are preliminary. Source: ČSÚ, Main external trade statistics indicators based on the national concept (the principle of change of ownership) (September 2014); ČSÚ, GDP quarterly time series (September 2014), own calculation.
Figure 6: External trade, 2005:Q1–2014:Q2 (in % of GDP, moving annual average)

61Economy and minerals – Development of the Czech and global economies
the economy in the 1990s), and even the course of the financial and debt crisis did not have a more profound impact, which is evidence of the stable orientation of the Czech economy towards longer-term trade relations and also indirectly towards the structure of imports and exports (see Table 10). The dominant more than 80 % share of exports are destined for EU-28 countries, or for eurozone countries (EU-18), and that has practically not changed for more than ten years (a decline of about 4 and 5 p.p. occurred between 2005 and 2013, respectively). Correspondingly, EU countries accounted for about a two-third share of Czech imports in 2013 and eurozone countries for a share of nearly 52 %. Even in this case, the share of both main trading partners declined during the period monitored (by 5 and 8 p.p., respectively). This decline was compensated for by an increase in the share of countries outside the EU, specifically that of China, while Russia’s share was roughly stable. The gradual decline in the share of EU countries in Czech exports may be regarded as positive because it indicates that export is gradually diversifying and that Czech exporters are capable of penetrating other markets.15 As for the main trading partners, Germany and Slovakia maintain a priviledged position in terms of volume of exports and imports for the entire period with an average share of 33% and 9%, respectively. China’s share remains substantially imbalanced because its average share of Czech exports is nearly 1 %, but it accounts for 9 % of Czech imports. The latest available data show that imports to China and Russia grew, while Russian imports stagnated and China’s share declined slightly. The trade sanctions imposed by the EU and the Russian countermeasures will have a negative impact on trade with Russia. With regard to China, trade will depend on the economy’s ability to react to the changing environment and to a change in the sources of growth (elimination of considerable regional and structural imbalances, which have developed in recent years).
Table 10: External trade in goods by group of countries, selected years (shares in %)
Export Import
2005 2007 2009 2011 2013 Average1) 2005 2007 2009 2011 2013 Average1)
EU-28 87.4 86.6 86.2 84.7 81.7 85.3 71.9 71.1 67.3 66.2 66.8 68.7
EA-18 70.6 67.8 69.1 67.2 63.6 67.7 59.4 57.0 53.8 51.9 51.7 54.8
Germany 35.1 32.0 33.8 32.5 31.4 33.0 31.5 29.0 27.8 26.6 26.3 28.3
Slovakia 9.0 9.1 9.2 10.0 9.9 9.4 5.7 5.5 5.7 6.4 6.0 5.9
Outside EU 12.5 13.4 13.7 15.2 18.2 14.6 28.0 28.8 32.4 33.5 32.7 31.1
Russia 1.6 2.3 2.2 2.9 3.7 2.6 5.2 4.4 4.6 5.6 5.7 5.1
China 0.3 0.6 0.7 0.9 1.1 0.7 5.8 8.4 10.8 11.0 9.1 9.0
Note: 1) simple average of yearly values for the period 2005–2013. Source: ČSÚ, External trade in goods by group of countries (the principle of change in ownership), (September 2014), own adaptation.
With regard to commodity structure, two groups have dominated Czech exports in recent years according to the SITC classification – manufactured goods classified chiefly by material
15 This cannot be taken for granted because of the substantial number of small and medium-sized businesses in the Czech economy, for which the costs associated with penetrating non-European markets may represent a very sidnificant budget item. To a certain extent, the renewed pro-export policies of Czech governments may have had an effect, as priority countries (12) and countries of interest (25) for the CR were defined; see Exportní strategie ČR pro období 2012–2020/Export Strategy of the Czech Republic for 2012–2020. MPO, Prague, March 2012. URL: http://databaze-strategie.cz/cz/mpo/strategie/exportni-strategie-cr-2012-2020?typ=struktura.

62
(group 6) and then primarily machinery and transport equipment (group 7). Group 7 increased its share of total exports from 50.9 % in 2004 to 53.8 % in 2013 (see Table 11), and its share stagnated in recent years. The share of other groups did not change very much during this period. Group 6 was the sole exception. The share of groups 2 and 3, which are closely linked to the mining and quarrying industry, remained practically unchanged – increasing from 5.6 % in 2004 to 5.9 % in 2013. In the case of imports, the share of mineral fuels, lubricants and related materials increased gradually in the past three years, reaching the existing maximum of 11.1 % of total imports in 2012. A slight decline to 10.7 % occurred in 2013. The share of chemicals and related products is relatively stable (on average about 11 %). The fluctuation in the share of group 3 was primarily caused by substantial changes in crude oil and natural gas prices and by the long-term strengthening of the Czech crown in 2004–2008, and also partially by the exchange rate change at the end of 2013 (this will, however, not show itself until 2014 and in subsequent years, and it will probably be suppressed by stagnating commodity prices). Group 3 had a considerably higher share of imports than exports (11.1 % vs. 6.2 %), which also resulted in a very high and growing negative balance (see Figure 5 and Figure 6 above). Other structural changes included an increase in the share of food commodities (groups 0 and 1 in exports and imports), which reflect changes, specifically the specialization of Czech agriculture within the EU.
Table 11: External trade – commodity structure, selected years (SITC, Rev. 4, shares in %)
SITC Rev.4 Section Export Import
(Code) 2004 2007 2010 2013 Average1) 2004 2007 2010 2013 Average1)
0, 1 – Food 3.3 3.5 3.7 4.3 3.8 4.7 5.0 5.3 5.8 5.3
2 – Crude materials,
inedible, except fuels2.7 2.6 3.0 2.7 2.7 3.0 2.4 2.7 2.8 2.7
3 – Mineral fuels, lubricants
and related
products
2.9 2.7 3.7 3.2 3.3 7.0 8.0 9.6 10.7 9.5
4 – Animal and vegetable
oils, fats and waxes0.1 0.1 0.2 0.3 0.2 0.2 0.1 0.2 0.2 0.2
5 – Chemicals and related
products6.0 5.8 6.5 6.4 6.2 11.1 10.4 10.7 11.4 10.9
6 – Manufactured goods
classified chiefly by material22.6 20.2 17.2 17.4 19.2 20.6 20.9 17.8 17.9 19.1
7 – Machinery and
transport equipment50.9 54.2 54.6 53.8 53.4 42.3 43.0 43.4 40.8 41.7
8,9 – Miscellaneous
manufactured articles11.6 10.9 11.2 12.0 11.3 10.9 10.2 10.4 10.4 10.6
Note: 1) simple average of yearly values over the period 2004–2013. Values for 2013 are preliminary after end of June 2014 revision. Source: ČSÚ, Indicators of Social and Economic Development of the Czech Republic from the year 1990 to the end of first quarter 2014 (September 2014), own calculation.
A more detailed look at the trend in the trade of selected import and export commodities of the CR since 2004 is given in Table 12. The influence of the financial and debt crisis and of the structural changes, which were reflected in both imports and exports (e.g. in 2008 for passenger
Economy and minerals – Development of the Czech and global economies

63Economy and minerals – Development of the Czech and global economies
cars and, during the “crisis” year 2009, primarily in import items), is clearly unveiled in this example as well. Looking at the long-term trend of the six main export and the four main import commodities, the sharp rise in exports of passenger cars (by 174 % exceeding 1 million units) or beer (31 % increase) is, in the case of exports, not as surprising as the relatively sharp decline and subsequent increase in hops exports, which potentially indicates both the export of higher value added products and changes in consumer preferences (return to traditional beer brewing methods) as well as the effects of weather.16 The numbers for selected primary commodities indicate a different trend (exports of kaolin grew by 6 % and that of limestone by 28 %). In the case of imports, the structural changes in the economy were also reflected in the commodity structure, where, for example, the imports of cotton nearly ceased (falling by 90 %), iron ore imports declined (by 18 %) in connection with restructuring, but crude oil imports, on the other hand, grew slightly. However, raw material imports are subject to cyclical development, and it is possible that the iron ore imports were primarily connected to both less capital construction and to the decline in production because of poor demand due to weak global prosperity. On the other hand, the effects of climate and other changes, and not just the impact of changes in agricultural production structure, may have played a role in the case of agricultural commodities such as cereals.
Table 12: External trade – export and import of selected commodities, 2004–2013
Export Import
Cement1 Caolin1 Cement1 Caolin1 Cement1 Caolin1 Cement1 Caolin1 Cement1 Caolin1
2004 747 484 140 373 397 5 158 285 6 406 7 639 125 52
2005 559 271 124 522 364 4 895 314 7 730 6 807 102 45
2006 496 261 162 763 744 4 096 366 7 752 7 987 308 36
2007 646 249 98 853 956 3 428 372 7 147 6 592 345 32
2008 663 239 107 824 075 4 336 381 8 142 7 711 232 19
2009 676 380 100 860 247 4 145 346 7 452 4 810 160 10
2010 683 526 93 971 168 4 405 329 7 770 5 938 177 10
2011 862 542 176 1 059 296 4 100 323 6 969 7 366 197 7
2012 699 513 205 1 050 368 4 276 349 7 024 5 867 358 5
2013 620 515 179 1 022 811 3 533 372 6 631 6 273 329 5
Index5 0.82 1.06 1.28 2.74 0.68 1.31 1.04 0.82 2.63 0.10
Note: values for 2013 are preliminary. 1 Ths. tons, 2 pcs, 3 tons, 4 mil. l.; 5 Index 2004 = 100. Source: ČSÚ, Indicators of Social and Economic Development of the Czech Republic 1st quarter 2014 (September 2014), own calculation.
The trend in global prices of selected commodities and its impact on the Czech economy is illustrated in Table 13, which summarizes the trend in the prices of crude oil, natural gas and of three other selected commodities – wheat, copper and uranium in 2004–2013. The price fluctuations in 2007–2009 and the sharp price rise in 2010–2011 to pre-crisis levels (with a slight correction in 2012–2013 when comparing the price index with 2005) are clearly
16 Czech agriculture is a traditional and important world producer of hops (ranked fifth in the world behind Germany, the USA, Ethiopia and China according to the latest available data for 2012; see FAOSTAT: Food and Agricultural commodities production. FAO, Rome, 2014, URL: http://faostat.fao.org/site/339/default.aspx.

64Economy and minerals – Development of the Czech and global economies
evident. The impact on the trade balance and, indirectly, on businesses can be estimated based on the trend in the global price index in CZK, which not only reflects changes in crude oil prices but also the trend in the exchange rate of the Czech crown against the USD. The unfavourable trend in prices was thus compensated for by the strengthening crown in individual years (e.g. this trend is clearly noticeable in 2004–2005 by comparing the year-on-year indices in USD and CZK). The price indices for wheat or copper were influenced by a sharp rise in production costs due to growth in demand, which reflects rising consumption in many economies worldwide or the fact that non-energy commodities and food became investment instruments (underlying instruments for various financial instruments, so-called derivatives such as futures or options) for international investors in a low-yield environment. The end result was that this led to stronger price fluctuations in both directions, higher price volatility but also to growth in market liquidity (decreasing costs), thereby also increasing availability for those needing to hedge against unexpected events.
Table 13: Price indices of selected world commodities, 2004–2013
2004 2005 2006 2007 2008 2009 2010 2011 2012 2013
Oil Brent USD/barrel 38.3 54.4 65.4 72.7 93.6 61.9 79.6 111.0 112.0 108.8
CPPR = 100 132.7 142.1 120.1 111.2 128.7 66.1 128.7 139.3 100.9 97.2
Index in CZK 2005 = 100 75.5 100.0 113.4 113.3 122.3 90.4 116.7 150.6 168.2 163.4
CPPP = 100 120.9 132.4 113.4 99.9 108.0 73.9 129.1 129.0 111.7 97.1
Wheat USD/t 156.9 152.4 191.7 255.2 319.3 223.4 223.7 316.2 313.3 312.2
CPPP = 100 107.3 97.2 125.8 133.1 125.1 70.0 100.1 141.4 99.1 99.7
Index in CZK 2005 = 100 110.5 100.0 118.7 142.0 149.0 116.6 117.1 153.2 168.0 167.3
CPPP = 100 97.7 90.5 118.7 119.6 104.9 78.3 100.4 130.8 109.7 99.6
Natural Gas USD/ mil, BTU 3.8 5.9 8.2 8.1 13.4 8.9 8.2 10.6 12.0 11.2
CPPP = 100 107.7 157.5 138.8 99.1 164.1 66.3 92.9 128.9 113.1 93.4
Index in CZK 2005 = 100 68.1 100.0 131.1 116.7 160.7 119.1 110.9 132.3 165.6 154.6
CPPP = 100 98.1 146.8 131.1 89.1 137.6 74.2 93.1 119.3 125.2 93.3
Uranium USD/pound 18.0 27.9 47.7 99.2 63.2 46.7 46.0 56.2 48.9 38.5
CPPP = 100 160.6 154.8 170.7 208.1 63.7 73.8 98.5 122.4 87.0 78.8
Index in CZK 2005 = 100 69.3 100.0 161.2 301.3 161.0 133.0 131.3 148.7 143.2 112.7
CPPP = 100 146.2 144.2 161.2 186.9 53.4 82.6 98.8 113.2 96.3 78.7
Copper USD/t 2863.5 3676.5 6731.4 7131.6 6678.6 5165.3 7538.4 8823.5 7958.9 7331.5
CPPP = 100 160.9 128.4 183.1 105.9 93.6 77.3 145.9 117.0 90.2 92.1
Index in CZK 2005 = 100 83.6 100.0 172.9 164.5 129.2 111.8 163.6 177.3 177.0 162.9
CPPP = 100 146.5 119.6 172.9 95.2 78.6 86.5 146.4 108.3 99.9 92.0
Note: values are monthly averages of spot prices and annual averages of CZK/USD exchange rate. CPPP – constant prices of previous period = 100. Source: ČSÚ (2014); MMF (2014), own calculation.
As mentioned and illustrated above, the trend in the trade balance is, to a certain extent, influenced by the trend in the prices of raw materials, which are imported into the Czech Republic. The sharp rise in global prices of industrial commodities and food in the past few years (see Figure 7) resembles the situation at the beginning of the 1970s and the period of the

65Economy and minerals – Development of the Czech and global economies
second oil shock.17 A new aspect is that, so far, a sharp drop in prices across the spectrum of commodities has not occurred except for their stabilization at more or less “corrected” levels. A significant decrease cannot be expected due to higher demand in emerging (African, Asian, Near Eastern or Latin American) countries. The negative impact on foreign trade results was suppressed by movement in the exchange rate (appreciation /18/ of the Czech crown against the dollar).18 The continuously rising commodity prices began to fall in the second half of 2008, specifically in connection with the spread of the global financial crisis. However, even this decline was temporary due to strong demand in some economies (so-called BRICS), and the growth trend gradually resumed in the second half of 2009 (see Figure 7). Current prices reflect the levels at the start of 2008, thus a period when the global economy experienced the height of a prosperity phase. However, the figure shows the ongoing stagnation of indices, which has continued since the beginning of 2011 (except for the metals price index), as is illustrated in the lower panel with year-on-year changes in index values during the period monitored.19
The trend in raw material prices is, of course, also reflected in the trend in the terms of trade of the CR. The share of raw materials is higher in import than in export prices, and that is why a rise in raw material prices leads to a negative impact on the terms of trade and vice versa. In 2009 for example, the trend in the terms of trade (annual index 102.8) was very positive compared to
17 If the highest price per barrel of Brent Crude (quoted on the New York Mercantile Exchange) during the second oil crisis in the amount of USD 39.50 from April 1980 is taken into account, then a barrel of crude oil would cost approximately USD 103.76, recalculated to reflect the present value of money (today, 1 USD from 1980 has a value of USD 2.61 – based on the consumer price index). During the first oil crisis, the price did increase from about USD 3 to USD 12 per barrel (1974), however at today’s prices that amounts to only USD 52.29. The record from 1990, caused by the Persian Gulf War (USD 40.42 per barrel), amounts to only USD 66.44 per barrel after being recalculated at today’s prices. The present record value was reached in June 2008 – USD 139.89 per barrel (the monthly price average for June and July was USD 133.05 and USD 133.90 per barrel, respectively). Since then, the price of crude oil has fallen sharply to values ranging between USD 40–50 per barrel (December 2008). The price remained in this range until May 2009, when it again began to rise gradually as renewed growth in the global economy and continued growth in emerging economies occurred as expected. In January 2011, it again exceeded the limit of USD 100 per barrel and gradually stabilized at around USD 120; at the time of writing, it hovered in a relatively narrow range of around USD 100. However in recent years, the price of crude oil became more volatile and its behaviour can no longer be defined by tapping global reserves or by geopolitical impacts such as regional conflicts. The reason for this is the use of alternative fuel resources (ethanol) as well as new methods of crude oil production such as hydraulic fracturing (fracking) and horizontal drilling (primarily in the USA and Canada). The expansion of production in Europe is blocked by environmental protests concerned about environmental impacts due to high water intensity (e.g. in the UK and Poland). As a result, the US economy became the largest energy producer (ahead of Saudi Arabia and Russia) and the production of 8.6 million barrels per day is the highest amount in the past 28 years (eclipsed only in 1985 – 9 million barrels per day). Side effects include impacts on the stability of the market for energy minerals (and pushing peak production) and achieving greater energy independence. On the other hand, these modern technologies are very capital intensive, leaving them more vulnerable to price fluctuations, and leading drillers to pile up debts; see Gold, R.: U.S. Energy Boom Retains Vigor. Wall Street Journal Europe, Business & Finance, Tuesday, September 16, 2014, p. 19; Ivry, B., Serrill, M., Roche, G., Neumann, J.: Drillers Piling Up More Debt Than Oil Hunting Fortunes in Shale. Bloomberg, (online), September 8, 2014. URL: http://www.bloomberg.com/news/2014-09-08/halcon-s-wilson-drills-more-debt-than-oil-in-shale-bet.html.18 However, the persisting high energy intensity of the Czech economy, also reflected in increased raw material imports, is problematic. 19 A reason may be the fact that, for many investors, commodities are a very attractive investment instrument, which in many cases yields positive returns (cleansed of the rate of inflation) and is therefore preferred to traditional investment instruments such as bonds or stocks. This may have been the reason for the reduction of traditional commodity price fluctuations, which reflected global prosperity in the past.

66Economy and minerals – Development of the Czech and global economies
2008 (index 98.9), and it was not until the end of the year that the trend changed and the terms worsened considerably, with a correction occurring in 2010 (approximately to the 2005 level) and a gradual return occurring since the first quarter of 2011 to values nearing the neutral level, i.e. an index value of 100. (The trend in both years, including the worsening at the end of 2009, was nearly identical (slightly positive) when using the terms of trade without raw material prices.)
External economic balanceThe external economic balance based on the current account balance, which indicates flows of goods, services, primary and secondary income between residents and non-residents, registered substantial changes in 2004–2013. Prior to the accession to the EU, strong net capital inflow (> 5 % GDP) occurred, which was reflected in the balance of the financial account and of the current account as well (due to double entries and many import-intensive activities such
Note: Indices 2005 = 100. Oil – Crude Oil (petroleum, price index), simple average of three spot prices; Dated Brent, West Texas Intermediate, and the Dubai Fateh. CN-F – Non-Fuel Price Index, includes Food and Beverages and Industrial Inputs Price Indices, metals – Metals Price Index, 2005 = 100, includes Copper, Aluminium, Iron Ore, Tin, Nickel, Zinc, Lead, and Uranium Price Indices. MO1 – January of the given year. Y-on-y changes of indices (d_CN-F, d_oil, d_metals) are calculated from yearly averages of monthly values. Source: IMF, IMF database (September 2014), own calculation.
Figure 7: IMF Primary Commodity Prices Indices and their y-on-y changes, January 1990–July 2014

67Economy and minerals – Development of the Czech and global economies
as direct investment, see Figure 9). While net capital inflow did not change much in 2005-2010, it fell sharply to 2 % of GDP in 2011 and 2012. Preliminary data for 2013 indicate a change in the trend and a resurgance of strong capital inflow. Changes in the financial account were accompanied by temporary declines in the negative balances of the current account, which allowed for a positive balance of payments and accumulation of reserves amounting to a temporary record level of 4 % of GDP, to be registered in 2013.
From a perspective of current account structure, the income balance replaced the trade balance (in deficit until 2004) as the main source of the deficit in 2004–2013, specifically due
Note: export and import indices are in current prices. Source: ČSÚ, Statistical Yearbook of Czech Republic 2009; ČSÚ, Statistical Yearbook of Czech Republic 2013, own adaptation.
Figure 8: Export and import indices and terms of trade for the Czech Republic, 2004:1.Q.–2012:4.Q.
export indices import indices terms of trade (right axis)
Note.: BÚ – current account, FÚ – financial account, KÚ – capital account, OIN – errors and omissions, PB – balance of payments (= change in foreign reserves of the ČNB). Source: ČNB, database ARAD (September 2014); ČSÚ, Quarterly GDP time series (September 2014), own calculation.
Figure 9: Components of current account, 2004–2013 (values in % of GDP)

68Economy and minerals – Development of the Czech and global economies
to net outflow of primary income in the form of salaries, repatriated and reinvested earnings, and interest amounting to as much as 7 % of GDP (see Table 14).20 The income balance deficit was not even compensated for by the gradually increasing trade balance surplus in goods and services (reaching 4.8 % of GDP in 2013, a year-on-year improvement from 3.9 % of GDP in 2012). The services balance (around 1.5 % in recent years) registered a relatively stable surplus as well (despite having declined slightly in the past three years) and partially helped to compensate for the rise in the income balance deficit. However, individual trends resulted in a decline in the size of the current account deficit, which was consequently easily financed by a surplus in the financial account (except in 2011). The surpluses in the financial account fluctuated from year to year as privatization and FDI inflow into the Czech economy gradually declined. By contrast, the capital account gained in importance in 2008 to 2009 and primarily in 2012 and 2013 (1.4 % and 1.9 % in relation to GDP), specifically in connection with EU funding (drawing down funds within a seven-year programme, 2007–2013), which began to play a more significant role in the financing of investment activities in the CR. 21
Table 14: Current account, 2001–2012 (in % of GDP)
Current account
Trade balanceBalance of
services
Income
balance
Current
transfers
2004 –5.0 –0.5 0.6 –5.3 0.2
2005 –1.0 1.6 1.2 –4.1 0.4
2006 –2.0 1.8 1.5 –4.9 –0.3
2007 –4.3 1.3 1.6 –7.0 –0.2
2008 –2.1 0.7 1.9 –4.5 –0.2
2009 –2.4 2.3 2.0 –6.6 0.0
2010 –3.9 1.4 2.0 –7.5 0.2
2011 –2.7 2.4 1.5 –6.7 0.1
2012 –1.3 3.9 1.6 –6.8 –0.1
2013 –1.4 4.8 1.4 –8.0 0.4
Av. 2004–2007 1) –3.1 1.0 1.2 –5.3 0.0
Av. 2007–2013 1) –2.6 2.4 1.7 –6.7 0.0
Av. 2004–2013 1) –2.6 2.0 1.5 –6.2 0.0
Note: 1) simple averages of yearly values over the given period. Sources: ČNB, database ARAD (September 2014), ČSÚ, quarterly time series of GDP (September 2014), own calculation.
The current account deficit in the amount of 1.4 % of GDP was influenced in 2013 by a year-on-year rise in the trade balance surplus to 4.8 % of GDP and also by a year-on-year deepening
20 The income balance also affects performance indicators, when traditional indicators such as GDP (“domestic perspective”) lose their explanatory power and alternative indicators such as gross national income (“ownership perspective”) have to be used. The implication for the countries of the Visegrád Group are briefly mentioned, for example, by Žďárský, V.: Vliv globalizace na zvýšení odchylek mezi HDP a HNP ve vybraných zemích v posledních dvou dekádách/ The effect of globalisation on deviations between GDP and GNP in selected countries over the last two decades. GEV, CNB, August 2013, p. 12–20.21 A record surplus reaching nearly CZK 75 billion was registered in 2013. MPO stated that net income from the EU budget represented about 60 % of the surplus; see MPO: Analýza vývoje ekonomiky ČR za rok 2013/Survey of the Czech Economy in 2013. MPO, Prague, May 2014.

69Economy and minerals – Development of the Czech and global economies
of the income balance deficit to -8.0 % of GDP (this was still an estimate at the time of writing this report). The balance on services worsened slightly (1.4 % of GDP) and the current transfers balance was slightly positive. As mentioned already above, the net outflow of primary income to foreign countries in 2013 in the form of salaries, reinvested or repatriated earnings and interest represented 8.0 % of GDP (the previous maximum was 7.5 % in 2012)22 , thus lowering the gross national income /19/ of the Czech Republic compared to the gross domestic product. The Czech Republic is thus joining some other countries such as Ireland, Hungary and now Slovakia as well, which are losing an important part of created value that cannot be used for consumption or investment. Reinvestment and repatriation of earnings will continue to be the main source of the current account deficit also because of expected restrictions on reinvestment of earnings in existing companies and due to continued income flow to parent companies abroad.23
In the past five years, the current account deficit of the CR stabilized at an annual average of 2.6 % of GDP (see Table 14). Although it was slightly higher than the average deficit of the developed countries of the EU-15, or eurozone countries, it is still an acceptable imbalance for an economy at a lower economic level, which is closing in on the income levels in developed countries. However, an important aspect is the current account structure, which may become a problem if the sharp rise in the income balance deficit and only a weak improvement in net exports continue. Of the thirteen new EU countries, the CR had the fourth-highest current account deficit in 2013.24 With respect to the national economy, the current account deficit is the result of insufficient national savings in relation to investments. This gap has to be financed from foreign sources. While the entrepreneurial sector increased its ability to generate savings and improved its profitability, the measure of household savings is low compared to developed EU countries. The negative gap between savings and investments is generated primarily by the government sector.
Foreign investment and the Czech economyForeign direct investment became an important factor of growth in new Member States of the EU including the Czech economy.25 In the case of the Czech economy, a substantial FDI inflow began after 1998 in connection with the implementation of investment incentives, the continuing privatization, and with the restructuring of businesses. A strong inflow was registered in 2002 (7.1 % of GDP, due to the privatization of banks), followed by an FDI inflow
22 Analysts link this significant outflow (in 2009 as well) to the repatriation of earnings by parent companies during the European debt crisis. 23 The Czech Republic together with Russia, Kazakhstan and Kyrgyzstan were the only “European” and “Eurasian” countries ranked among countries with the highest FDI income in 2011 (double-digit values), see UNCTAD: World Investment Report 2013. UN, Geneva & New York, 2013.24 Many new member states registered higher current account surpluses, which represents a relatively radical change in comparison with the first decade of the new century. In 2013, only Estonia, Poland, Cyprus and Latvia registered deficits (1.8, 1.6, 1.4 and 0.8, % of GDP, respectively). On the other hand, countries with high current account deficits in past years experienced considerable improvement in the current account – deficit-plagued Lithuania (1.3 %), Slovakia (2.5 %) or Bulgaria (1.9 %), and Hungary (3.1 %) or Slovenia (5.3 %) registered positive and relatively high GDP values as well. Croatia and Malta had a nearly neutral current account (data according DG ECFIN: Statistical Annex of European Economy. Spring 2014. ECFIN, Brussels, April 2014).25 Foreign investment and balance of payments analyses usually also include an assessment of an economy’s investment position, which however is not dealt with (merely indirectly in connection with the trend in mining and quarrying) in this report due to lack of space.

70Economy and minerals – Development of the Czech and global economies
in 2005 in the amount of 6.8 % of GDP, and by a record level of 10.0 % of GDP at the height of the pre-crisis economic cycle in 2007. The effect of the financial crisis was reflected in a sharp decline in FDI (the annual average for 2008–2013 amounted to only 2.9 % of GDP), but an improvement in the economic climate as a whole led to renewed growth and the FDI inflow exceeded 5 % in 2012 and the estimate for 2013 is close to the average“crisis” level of 2.7 % of GDP.
The cumulative net FDI26 in relation to GDP reached nearly 58 % in 2013, and the CR ranked third behind Bulgaria (94 %) and Estonia (60 %) among 11 new Member States of the EU excluding Malta and Cyprus (EU-11). Slovakia (56 %) ranked fourth and Hungary (54 %) fifth. The two Mediterranean countries mentioned above occupy a distinctive position reflecting the character of their economies and tax measures, which distinguish them from the rest of the new Member States (see Figure 9).27 Nearly 31 % of the total FDI volume (this share has been declining in recent years, benefiting some service sectors such as factoring (about 22 %), real estate (8 %), and information and communication services over 5 %) was directed at the Czech
26 This is the so-called net position, i.e. the difference between investments by foreign companies in the CR and investments by Czech companies abroad.27 In terms of cumulative FDI (1990–2013, inward FDI) per capita, the CR (about USD 13.0 thousand) ranked second behind Estonia (USD 16 thousand) and ahead of Hungary (USD 11.2 thousand) and Slovakia (USD 10.9 thousand) among new Member States of the EU excluding Cyprus and Malta, based on preliminary data for 2013. The average for new Member States (NMS11) was USD 7.7 thousand, or USD 7.9 thousand for NMS13; for comparison purposes, the average for the old EU-15 countries exceeded USD 19.2 thousand and amounted to about USD 16.9 thousand for the entire EU-28 (own calculations based on the UNCTAD and ECFIN databases, 2014).
Note: EU-13 – all new EU member states including Croatia (CR), EU-11 – new EU member states (i.e. without Cyprus and Malta), EU-15 – old EU member states, EU-28 – all EU member states. Net stock – net FDI stock, i.e. differences between FDI inward and FDI outward stocks at the end of a particular year. Values for 2013 are preliminary, values for 1990 are not utilized since they are not available for some countries or are UNCTAD experts’ estimates. Values for EU-15, EU-13 and EU-11 are simple averages of individual values. Source: UNCTAD, FDI database (September 2014); DG ECFIN, database Ameco (May 2014); MMF, WEO database (April 2014), own calculation.
Figure 10: FDI inward stock, new EU member states (net stock, in % of GDP)

71Economy and minerals – Development of the Czech and global economies
manufacturing industry. With the FDI inflow, the number of foreign-controlled companies in the Czech economy increased sharply as well. In 2009, in the sector of non-financial businesses (100 or more employees), these companies accounted for 74 % of income from the sale of goods and services, for nearly 62 % of employment, and salaries were 20 % higher than the average for all businesses. These companies also adjusted more easily to the impacts of the crisis because company sales fell sharply in the non-state sector, while growing slightly (just as employment) in the case of foreign-controlled companies.28
A qualitative change in the structure of FDI directed at the Czech economy occurred in the past five years. The major portion of investments are not financed with the capital of parent companies, but generated by the companies themselves in the CR (reinvested earnings minus other capital, which is monitored separately). The onset of reinvestment in the CR did not begin to be monitored until 1998, and its extent and importance for the total investment activity of foreign companies varied substantially from year to year. Initially, its importance was low (about ¼ until 2002), increasing gradually as the profits generated by foreign-controlled companies grew (in keeping with the so-called investment life cycle). In 2013 just as in 2009, reinvestments were practically the only source of FDI inflow (an inflow of about CZK 98 billion, reinvested earnings of about CZK 95 billion). They were again a substantial source for financing the investments of foreign-controlled companies in 2006 and 2011 (about 66 and 93 %, respectively). According to CNB data for 2013, the share of reinvested earnings reached 57 % (a substantial year-on-year growth from 50 %).29 Major investors were businesses from the Netherlands, which replaced German businesses as the primary investors in the CR. They were followed distantly by investors from Austria, Cyprus, Belgium and the Republic of Korea.30 The number of Asian investors from Japan and China was very small and only the Republic of Korea was represented more prominently. From a long-term perspective (from 2004 to the end of 2013), the dominant portion of investments comes from the Netherlands, Austria and Germany (cumulatively CZK 256, 211 and 189 billion), followed at a distance by investments from the USA, Switzerland, Belgium (roughly CZK 50 billion) and France (about CZK 33 billion); the shares of other countries were minor. With respect to structure, the manufacturing industry (related to the automotive industry and electronic products), transportation and telecommunications (both sectors over CZK 200 billion), various business services (financial services, facility management, etc.), trade and the hospitality industry were predominantly represented.
28 In the case of all foreign-controlled companies (financial and non-financial businesses, 2008, percentage of the total for the given item), production reached 42.5 % of the total, gross value added about 30 %, intermediate consumption 48 %, salaries and wages 33 % and net operating surplus 56 %; see Dubská, D.: Firmy se zahraniční majetkovou účastí v ekonomice ČR: oslabily nebo dále sílí?/Enterprises with Foreign Capital Participation in the Economy of the CR: Have they Weakened or are they Strengthening? Analysis report of the ČSÚ. ČSÚ, Prague, 2012.The latest data for foreign-controlled companies are not yet available due to a transition to a new industrial classification (NACE Rev. 2.0). 29 In some years, reinvestments reached higher values than the total volume of FDI (these years are not taken into account), caused by loan repayments by Czech companies to parent companies, e.g. 2003 or 2008; see MPO: Analýza vývoje ekonomiky a odvětví v působnosti MPO za rok 2009/ Survey of the Czech Economy and MIT Sectors in 2009. MPO, Prague, April 2010, p. 19.30 The reason for the high FDI inflow from the Netherlands and Cyprus are tax, legal and other advantages provided by these countries.

72Economy and minerals – Development of the Czech and global economies
The importance of foreign capital in the mining and quarrying industryThe importance of foreign capital in the mining and quarrying industry, measured by the cumulative inflow of foreign direct investment, corresponded roughly to the industry’s share of GDP (see Table 15). In 2013, investments in the industry rose slightly (inflow of CZK 1.7 billion, following an inflow of nearly zero in 2012 and an outflow of CZK 6.1 billion in 2011). Each year since 2004, the FDI inflow into the industry has reached negative values (except in 2004, 2010 and 2012), specifically in connection with the end of the multi-year commodity market boom and with the spread of the financial crisis to other countries and economic sectors worldwide as well as with the cutback on investments in new and existing capacities in the CR. Thus, many originally planned investments were held back or suspended due to sufficient existing capacities. This is reflected in a drop in the industry’s share of total cumulative stock of capital (about 2.3 %) as well as its individual components: investment in equity capital (1.5 %), reinvested earnings (2.4 % of the total volume of reinvested earnings) and also other capital, whose importance in terms of total FDI is slightly growing (6.9 % in 2013).31
Table 15: FDI inward stock, as of 31. 12. 2013 (mil CZK)
Equity capital
Reinvested earnings
Other capital
Total
Total 1 364 526 1 133 692 200 325 2 698 543
Mining and quarrying 20 504 27 673 13 861 62 037
Share of mining and quarrying (in %) 1.5 2.4 6.9 2.3
Note: figures for 2013 are preliminary (final figures for 2013 will be published in 2015). Source: ČNB (2014), Balance of Payments Statistics, own calculation.
With regard to the size and structure of the economy and to the size of Czech companies, the flow of Czech foreign direct investment abroad is substantially lower (see Table 13). However, in recent years, Czech capital has been penetrating foreign markets with increasing success and, therefore, also into foreign businesses, which allow for the supply of the local market (manufacturing industry) or which provide supplies of raw materials and intermediate products (coal mining in Poland, and exploration for and production of crude oil and natural gas in African and CIS countries). Here, however, they face strong competition from large often state-owned and therefore financially very strong enterprises from Russia, Brazil, the United Kingdom, China or India. Similarly to the previous year, the leading destinations for Czech FDI in 2013 were the Netherlands, Slovakia, France, Romania, Poland and Liechtenstein. Similar countries were targeted by Czech companies also in the past. As far as the long-term trend is concerned, the dominant position is held by the Netherlands, followed by Slovakia, Bulgaria, Romania, Cyprus, Poland, Ireland and Germany.
The impacts of the crisis were also reflected in the low volume of Czech FDI abroad. However, a change in the previous trend occurred in 2013 because the total FDI amount reached nearly CZK 64.5 billion (about 84 % higher when compared year-on-year, as investment in equity capital rose sharply). On average, CZK 37 billion have been invested annually since
31 For example, intercompany loans used within the group – parent company vs. subsidiary are monitored precisely under other capital. Looking at preliminary CNB data for 2013, the share in total inflow was 1.8 %, in investment in equity capital 0.9 %; the other items registered an outflow.

73Economy and minerals – Development of the Czech and global economies
2004. The maximum thus far was CZK 73.8 billion in 2008, primarily due to a one-time transaction, without which there would have been only a slight year-on-year increase. The increase in the FDI volume in 2013 indicates that healthy and stable companies took advantage of the turbulent economic environment to make investments that would otherwise have been impossible. Reinvested earnings amounted to CZK 19.1 billion, which represented investments made by several entities and not only a sharp one-time fluctuation caused by the investments of a single company belonging to the real estate and business services sectors.
The flow of Czech FDI abroad from the mining and quarrying industry was also minimal in 2013 (in terms of total volume amounting to nearly CZK 0.1 billion). Most of it was connected to investment in equity capital. The cumulative amount of Czech FDI up the end of 2013, shown in Table 16, indicates an entirely negligible share in the total structure of Czech FDI. This is due to a decline in the activities of Czech companies in this sector abroad in 2009–2011.
Table 16: FDI outward stock, (cumulative, as of 31. 12. 2013, mill CZK)
Equity capital
Reinvested earnings
Other capital
Total
Total 208 778 171 938 14 698 395 414
Mining and quarrying 116 49 0 165
Share of mining and quarrying (in %) 0.1 0.0 0.0 0.0
Note: figures for 2013 are preliminary (final figures for 2013 will be published in 2015). Source: ČNB (2014), Balance of Payments Statistics, own calculation.

74
Glossary of selected economic terms
Vojtěch Spěváček1, Václav Žďárek1,2
1 University of Economics and Management; 2 School of Economics and Management, ŠKODA AUTO University
/1/ Gross domestic product (GDP) is one of the basic and widely used macroeconomic indicators characterizing economic activity and growth. It can be defined either as the sum of the gross value added of various sectors and branches of the national economy (the value of goods and services produced after subtracting intermediate consumption, i.e. the value of goods and services consumed during their production) or as the value of domestic final demand (final consumption and gross capital formation) plus exports minus imports.
/2/ Supply side of the economy relates to the basic factors of economic activity (labour, capital, and total factor productivity) and to the main branches of activity (agriculture, industry, construction, services).
/3/ Purchasing power parity is a notional, artificially calculated currency exchange rate, which corresponds to its purchasing power. It is a rate at which we would obtain the same amount of goods and services at home as well as in the country with which we compare ourselves. It is used in the international comparisons of real magnitudes, such as GDP per capita, for which the market exchange rates are not useful. For comparison purposes, prices of so-called reference countries are usually used. A so-called purchasing power standard (PPS), derived from average prices of European Union countries, is used for countries of the EU.
/4/ Demand side explores the basic components of demand in the use of GDP, which satisfy the basic needs of the population and society and which determine economic growth. They include final consumption, which is further divided into private and public consumption, gross capital formation (investments), and foreign trade.
/5/ Final consumption includes private consumption (household final consumption expenditures) and public consumption (government final consumption expenditures). It represents the decisive component in the final use of output and is the purpose of economic activity because its growth determines a rise in the standard of living.
/6/ Domestic demand is a sum of final consumption and gross capital formation.
/7/ Private consumption is given by household final consumption expenditures and determines the standard of living of the population. It contains household consumption of goods and services for final use, which is covered by the disposable income of the population. The general rule is the faster the GDP growth, the faster the rise in private consumption. /8/ Public consumption is part of final consumption, which is covered by the disposable income of government institutions. It may be individual consumption (expenditures on health
Economy and minerals – Glossary of selected economic terms

75Economy and minerals – Glossary of selected economic terms
care, education, culture) or collective consumption (military, police and state administrative expenditures).
/9/ Gross fixed capital formation is a basic component of investment and includes acquisitions of fixed assets (esp. machinery, equipment, buildings and structures) during a certain period. Accumulation of fixed assets (its growth, structure and technical level) is regarded as a significant growth factor, which is important for economic growth as well as for growth in the standard of living. Total investments include gross fixed capital formation, changes in reserves, and net acquisition of valuables.
/10/ Foreign trade is an important growth factor, primarily in small open economies dependent on foreign demand, such as the Czech Republic. The balance of foreign trade (so-called net export, which is the difference between the value of exports and imports of goods and services) influences GDP growth and the macroeconomic balance of a country. An increase in net exports speeds up economic growth and improves macroeconomic balance. On the other hand, a declining surplus or growing deficit of foreign trade has the opposite effect.
/11/ Gross value added (GVA) is a widely used indicator of the total economic performance of each branch. It is an indicator corresponding to the GDP in the entire national economy. It is calculated by subtracting intermediate consumption (consumption of raw materials, energy, materials) from the total value of production.
/12/ Real growth of gross value added is growth calculated in constant prices, which excludes the influence of price changes. In the past, real growth was expressed in the constant prices of a specific year (2000, 2005), and it was influenced by this year’s relative prices. In order to improve the accuracy of data on the growth of GDP and GVA in a quickly changing economic structure, European Union countries switched to comparative price levels of the previous year, which better reflect current prices and economic structure.
/13/ Index of industrial production is calculated in accordance with international standards and based on statistics of selected products and a two-stage weighting system. It is a selective index representing the weighted arithmetic average of the indeces of selected indicators, which is used to characterize industrial production growth.
/14/ Macroeconomic point of view is a viewpoint based on the entire national economy and takes into account mutual linkages and connections.
/15/ Tables of inter-industry relations (input-output tables) are chessboard tables (in the form of matrices), which show flows of output of individual industries. Intermediate consumption (according to individual industries) and final use of the output of industries are given in the lines. Industry costs according to supplier industries are given in the columns.
/16/ External economic balance is given by the relationship of the total income of a country from abroad (incomes from the export of goods and services, and inflow of primary incomes and transfers) and expenses to foreign countries (import of goods and services, outflow of primary incomes and transfers). It can be assessed from the current account balance.

76Economy and minerals – Glossary of selected economic terms
/17/ Terms of trade express the movement of prices in foreign trade (the ratio of changes of export prices to import prices). They are calculated by dividing the export price index by the import price index. When prices of exports grow more quickly than those of imports, a country can import a higher physical volume of imports for the same physical volume of exports.
/18/ Appreciation means valuation (strengthening) of the currency exchange rate of one country against another depending on the demand and supply on the foreign exchange market.
/19/ Gross national income is an indicator based on the gross domestic product, which takes into account inflow and outflow of primary income (income from labour, capital and ownership). Primary income balance towards foreign countries influences the so-called disposable income of a country, on which final consumption and savings depend. If the outflow of income is higher than the inflow, the possibility of increasing the standard of living is reduced. This indicator is therefore more appropriate for characterizing the growth of a country’s welfare than GDP.

77Economy and minerals – Mineral facts – Europe’s Mineral Supplies and EU Mineral Policy
Mineral facts
Europe’s mineral supplies and EU mineral policy
Phillip Crowson University of Dundee, Centre for Energy, Petroleum and Mineral Law and Policy (CEPMLP), United Kingdom
1. Supply situationThe European Union and its twenty eight individual member states have long relied heavily on imports to supply their requirements for mineral raw materials of all types. Even where they existed in the first place domestic ore deposits were exhausted, or became unable to compete many years ago in many European countries. Their mineral consuming industries have increasingly relied on overseas sources of higher quality and lower cost materials. That trend has been far more pronounced for metallic than for non-metallic ores, where there is considerable European production of a range of products.
Table 1 shows the European Union’s shares of the world’s mine production of a wide range of minerals, including petroleum and natural gas, and their production as a percentage of apparent usage in 2012. There is no European Union mine production of a large range of minerals, including antimony, borates, iodine, molybdenum, niobium, rare earths, tantalum, tin, titanium, vanadium and zircon, and its output of lithium and platinum group minerals is negligible. Most European production of metallic minerals is now confined to the peripheral countries of Scandinavia, Iberia, Ireland and Poland.
Europe’s mine production of non-metallic, or industrial, minerals is relatively much more important than its mine output of metallic minerals, although recycling makes a major additional contribution to Europe’s usage of the latter. Domestic smelting and refining industries may meet a large share of European usage of many metals but they rely heavily on imports of ores and concentrates from other continents. Some by-product metals, such as cadmium, gallium, germanium, indium, selenium and tellurium, are only extracted from their host ores during the smelting and refining process. Within Europe, but not the EU, Norway is a major producer of titanium minerals. Turkey, an aspirant to EU membership, is a significant producer of a range of products including borates, chromite, magnesite and feldspar. It also mines non-ferrous metals and coal.
The figures for production as a percentage of usage are mainly based on apparent consumption (production plus imports less exports) and first uses and do not always take account of trade in semi-processed materials. Production from secondary sources is only included for copper, lead and zinc. Much recycled material, even of these three metals, is re-used in a semi-processed or finished form so that the table understates Europe’s self-sufficiency for a number of products, such as iron ore and nickel, where iron and steel scrap may substitute for virgin materials.

78Economy and minerals – Mineral facts – Europe’s Mineral Supplies and EU Mineral Policy
Table 1. European Union’s mineral production in 2012
Production as % of world output
Production as % of usage
Metallic
Aluminium (bauxite) 0.9 18
Chromium 2.2 51
Cobalt 1.1 c. 9
Copper a 4.9 55
Gold 1 b
Iron 1 16
Lead a 4.2 95
Manganese 0.2 8
Nickel 2.3 14
Silver 7.1 33
Tungsten 2.6 c. 10–15
Zinc a 5.6 51
Energy
Coal 7.3 71
Uranium 0.6 2
Petroleum 2 13
Natural Gas 4.8 36
Non-metallic
Barytes 1.1 16
Bentonite 16.4 71
Diatomite 14.8 95
Feldspar 31.9 73
Fluorspar 3.3 29
Graphite 0.3 9
Gypsum 13 100
Kaolin 30.8 90
Magnesite 11.3 81
Mica 10.6 56
Phosphate 0.3 13
Potash 12.8 100
Salt 21 96
Sulphur 11.5 100
Talc 13.8 95
Notes: a – Production includes secondary refined metal. b – A substantial portion of gold is absorbed by investment rather than final demand.
The data are for the 28 member states of the European Union. The source shows shares for a wider 35 nation group that includes Norway, Switzerland, Iceland, Macedonia, Montenegro, Serbia and Turkey.Sources: European Mineral Statistics 2008-12, British Geological Survey, Keyworth, Nottingham, 2014; World Mineral Statistics 2008-12, British Geological Survey, Keyworth, Nottingham, 2014; World Metal Statistics Yearbook 2014, World Bureau of Metal Statistics, Ware, 2014 .

79Economy and minerals – Mineral facts – Europe’s Mineral Supplies and EU Mineral Policy
To place its shares of global minerals output in context, the European Union accounts for 3.3 % of the world’s land area and 7.3 % of its population. Perhaps more relevantly it produces about 19% of the world’s gross domestic product, measured on a purchasing power parity basis.1 That provides a yardstick against which to judge the EU’s call on global resources.
European industry obtains its mineral raw materials through a variety of commercial transactions with mines and processing plants throughout the world. In some instances they may have financial stakes in their suppliers, but the bulk of their transactions are at arm’s length, either under contracts of varying duration or on a spot basis. The contracts set out the quantities to be supplied and their pricing arrangements. Increasingly those have been based on prevailing market levels and have fluctuated in step with changing world market conditions.
Reductions in trade barriers of all types, and falling international shipping costs progressively widened Europe’s sources of supply throughout the second half of the twentieth century. They also prompted the closure of some small scale and high cost mining operations within Europe. Even if their physical ore deposits were not completely exhausted such operations were unable to compete with lower cost supplies from overseas. Provided the quality and delivery arrangements were satisfactory, users of mineral products generally sought the cheapest sources of supply. Whilst there were periodic concerns about the security of supply of some materials, usually in response to a temporary disruption and a spike in prices, such concerns were usually of short duration. Users were unwilling to place themselves at a continuing competitive disadvantage against their competitors by paying over the market levels for their raw materials in order to increase their security of supply. Prices may have been volatile but genuine physical shortages over a sustained period have been extremely rare. End users benefitted from the willingness of mineral-rich countries to produce adequate materials to meet rising demand at prevailing prices.
2. Mineral policy2.1. Principles – indifference and emphasis on environmentAgainst this background European governments have normally taken little, if any, interest in minerals procurement. Their policies towards their domestic mining industries have often been of indifference bordering on malign neglect. User industries were generally content with their reliance on global markets at prevailing prices. Concerns about protecting and enhancing the environment and minimising pollution became the dominant influences on government policy in most European countries rather than worries about the availability of raw materials. That is as true for policies for re-use and recycling as for attitudes to the development of new mining operations, including the expansion of existing mines. The planning and environmental conditions under which mines can operate have become increasingly stringent. In many European countries the extraction of minerals is no longer regarded as the pre-eminent user of land that it once was.
1 Land Area from World Development Indicators 2013, World Bank, Washington, and population and GDP from World Economic Outlook Database, April 2014, International Monetary Fund, Washington. The EU’s share of world GDP on a purchasing power parity basis was 19.2% in 2012 and 18.7% in 2013. Its share on the basis of current US dollar exchange rates, was 23.1% in 2012 and 23.5% in 2013.

80Economy and minerals – Mineral facts – Europe’s Mineral Supplies and EU Mineral Policy
2.2. Supply crises and the rise in China’s importance2.2.1. Lack of concern during the 1980s and 1990sFrom time to time official indifference to mineral procurement has been punctured by political concerns, by unexpected disruptions to supply, or by adverse price movements. Civil war in Zaire (now the Democratic Republic of Congo) in the late 1970s, which disrupted cobalt supplies, was one such event which prompted a flurry of policy measures. During the later stages of the Cold War worries about dependence on Soviet and South African supplies of a range of key minerals led to a number of initiatives on minerals usage and supply in consuming countries on both sides of the Atlantic. The impetus behind these initiatives vanished with the breakup of the Soviet Union and the collapse of South Africa’s apartheid regime. From the late 1980s until the mid-2000s the prevailing official attitude to mineral policy was one of nearly universal apathy. Demand was rising fairly slowly, there was ample capacity to supply and prices were on a generally declining trend. During this period China became an increasingly important supplier of a widening range of mineral products to global markets. Many mines elsewhere closed down, unable to compete on price with Chinese suppliers exporting material surplus to domestic requirements.
2.2.2. Market forces after 2000During the past decade the minerals kaleidoscope has shifted once again, mainly because of developments in China. Strongly rising Chinese domestic demand placed global markets under increasing strain. Producers had become attuned to slowly rising demand and weakening prices and were unable to adjust supply rapidly enough to the changed market conditions. The burden of adjustment initially fell on prices which rose sharply, and over a lengthy period. For some minerals the period of adjustment was relatively brief, but for others it was protracted. The global financial problems and uncertainties of 2008–2009 delayed the restoration of underlying balance between supply and demand. Meantime, China’s export surpluses dwindled in response to rising domestic needs and tightening official restrictions on China’s small-scale and medium sized mines imposed for environmental and health and safety reasons.
Whereas both consumer governments and industrial users are readily acquiescent in market forces when they are moving in their favour, their attitudes often change when prices rise steeply. The combination of sharp price rises for nearly all metals and minerals and reduced Chinese supplies of a range of products re-awakened concerns about minerals availability in Japan, the United States and Europe during the late 2000s. The concerns were greatly exacerbated by China’s imposition of export controls on some products, and notably on rare-earths, ostensibly to conserve supplies for domestic needs, but with strategic undertones. This was the background to the EU Raw Materials Initiative set out in the European Commission’s document COM(2008)699 "The raw materials initiative – meeting our critical needs for growth and jobs in Europe". Those directly affected by sharp price rises and the prospect of potential shortages became acutely aware of the latent risks of increasing dependence on Chinese supplies that they had largely ignored for many years and sought government action to alleviate them. Worries about import dependence for so-called critical raw materials swiftly moved up the political agenda.
In the late 1970s attention was focussed on those minerals whose supply was vulnerable to disruption of one form or another and which met strategic uses. Many of those uses were in the defence industries. Modern concerns are similar, but with rather more attention paid to the essential raw material inputs of a wider range of industries. By no means all uses of a given

81Economy and minerals – Mineral facts – Europe’s Mineral Supplies and EU Mineral Policy
mineral may be critical to the European economy, no matter how important that mineral might be for a particular industry. The changing concerns and priorities of the past forty years reflect both changes in the global political economy but also economic and technological developments.
This dynamism, both in end uses and in sources of supply, highlights some of the problems for a proactive mineral policy. Actions taken to meet today’s challenges and problems may be completely inappropriate for tackling future needs. By the time policy measures bear fruit the immediate crisis that triggered them may have passed, no matter how well-crafted they might be. In a fast changing industrial and technological landscape the nature of materials usage can change rapidly. What was once seen as a critical material vulnerable to supply disruptions may no longer be so regarded. Conversely, a mineral previously treated as relatively unimportant may have become a more vital element for key sectors of the economy as a consequence of technical change.
In a globally interdependent world critical minerals may not be traded as such but might be embodied in imported components or finished products. In some instances the basic ores may be relatively common but the technology of extraction and processing might be complex and capital intensive and difficult to replicate. Effective insurance against supply disruptions to the materials might theoretically require a wide range of autarchic industrial policies. Not only might those be politically unacceptable within Europe but they could involve conflicts with trading partners.
2.3. EU’s raw material initiativeWritten against a background of concern about China’s involvement in both the supply and usage of minerals, the EU’s Raw Materials Initiative stresses sustainable access to raw materials through international diplomacy, trade agreements and development policy. In general that falls squarely within the EU’s remit, but mention is also made of ‘sustainable management of raw materials’ and of ‘the use of budget support’ in the field of development policy. These statements imply a degree of EU intervention in minerals procurement that goes beyond ensuring the proper functioning of global markets. To the extent that many companies trading in Europe have to follow them, the provisions of the United States’ Frank-Dodd Act on conflict minerals demonstrate all too clearly that security of minerals supply is often not the main, or even subsidiary, objective of policy.
2.3.1. The importance of market pricesUsually market imbalances of all types are signalled by a sudden sharp surge in prices. Purchasers of the affected products may then seek government assistance to counter perceived threats to their raw material supplies. There is a pervasive belief in many quarters that market forces alone are too slow and possibly too weak to ensure the desired response to changing market needs. In practice those forces are usually much stronger and more far-reaching than is often believed, although they do not always act quickly. They are, however, largely outside bureaucratic control and governments often need to be seen to act vigorously in response to a perceived threat. They tend to be impatient with messy market mechanisms, and their impatience is reinforced by the clamour of those adversely affected. Yet historical experience demonstrates the powerful effects of the price mechanism in choking off demand, encouraging substitution and stimulating research, exploration and new mine development. Muting the effects of that mechanism through support for domestic production, subsidies and regulatory interventions of all types may delay or even subvert the necessary adjustments. That would not be in the best interests of European industry and consumers.
82Economy and minerals – Mineral facts – Europe’s Mineral Supplies and EU Mineral Policy
2.3.2. European mineral policy limitsMost of Europe’s ore deposits have been exhausted by centuries of extraction and processing. Exploration techniques are continually developing, and geologists’ understanding of ore genesis and distribution is steadily improving. This means that new discoveries may still be made in previously worked-out areas. The geology of much the European Union is not, however, conducive to the future discovery of competitive large scale deposits of metallic minerals. Where it is more suitable, as in Iberia and Scandinavia, companies are prepared to devote substantial resources to exploration and subsequent mine development. In general, however, discoveries are relatively small scale, and often potentially high cost compared with those being mined elsewhere. With a few exceptions, Europe lacks the type of rocks that host many of the materials that are considered to be critical.
Most minerals exploration is carried out by profit-seeking companies. They either hope to sell their interest in any viable discovery or to make profits from mining the ore they discover. As exploration is costly, both in time and resources, companies are not concerned with the ultimate size of the ore deposits they discover, but merely in proving sufficient reserves to justify their investment in extraction and processing facilities. Provided the basic geology and structure of a region are understood, drawing up national inventories of minerals is largely an academic exercise with relatively little practical worth.
In any case, promising geology is a necessary but not a sufficient condition for minerals exploration and development. Throughout the European Union there is widespread public antipathy towards new mine development, an antipathy shared by many officials and politicians. Their attitudes have been shaped by experience of outmoded mining practices and sites, and by an unwillingness to accept the short to medium term environmental disturbances caused by mining. Environmental and planning restrictions greatly inhibit new mine development at the regional and local level. In any conflict between industrial needs for minerals and environmental protection, the latter usually triumphs. The banana (build absolutely nothing anywhere near anything) usually comes up more often than the plum (people love us mining) in the official fruit machine. The difficulties and time involved in securing permission to mine throughout most European countries weaken the incentive to search for mineral deposits.
Most minerals exploration within Europe is carried out by foreign companies applying skills and experience acquired elsewhere. The main focus of research and development and technological innovation in both exploration and minerals processing is now outside Europe where the prospective rewards are much greater. Funds devoted to such activities within Europe are much more likely to benefit the organisations involved and overseas mineral producing countries than to improve the security of European supplies of critical materials. That is not to deny the potential contributions of European research organisations, but to question whether this is an appropriate use of scarce resources.
Some production of virgin material will always be needed. Unless demand for a particular material were to fall off dramatically in response to technical or regulatory change recycling will never meet total requirements. Increasing the efficiency of use of resources, fostering substitution, promoting recycling and facilitating the use of secondary raw materials, are all aspects of the Raw Materials Initiative. Devoting research spending to improving recycling techniques and to satisfying consumer requirements in less materials intensive ways are likely to prove much more fruitful avenues for European research and development spending and policy initiatives than devoting official resources to research into geological studies, mining or primary processing. Such spending can work with, rather than against the grain of

83Economy and minerals – Mineral facts – Europe’s Mineral Supplies and EU Mineral Policy
European public opinion. Even so, due care must be taken to ensure that European industry’s competitiveness does not suffer by too slavish an insistence on recycling, regardless of cost.
2.4. The best Mineral Policy may be no specific policySince the Raw Materials Initiative was first promulgated global market conditions for all minerals, critical or otherwise, have changed considerably. Market mechanisms have once again demonstrated their effectiveness, albeit slowly in some instances. An EU mineral policy can mean many different things to different interest groups. Invariably all groups emphasise the need for spending on projects that they believe will further their own interests. Most minerals have substitutes, direct or indirect in most uses. A seemingly obvious means of dealing with a short-term market imbalance through some form of intervention may not be the most satisfactory in the longer run. The most effective means of ensuring substitution through the most cost-effective fashion has been demonstrated time after time to be via price movements rather than through market intervention of any type. Short term pain eventually leads to longer term benefits. In short, the best Mineral Policy may be no specific policy, but just a general pressure for minimising resource use.

84Economy and minerals – Mineral facts – Recent trends in the mining and metals industry
Recent trends in the global mining and metals industry
Phillip Crowson University of Dundee, Centre for Energy, Petroleum and Mineral Law and Policy (CEPMLP), United Kingdom
The main themes in the recent development of the global mining industries have been a slackening rate of growth of underlying economic activity, only partly because of changes within China, weakened prices even while costs remain high, generally rising fiscal burdens on the industry, and reduced profitability.
The growing importance of ChinaTrends in world steel production are a good barometer of demand for a wide range of mineral products. Those are either used in steel manufacture as raw materials or processing aids or they are incorporated with steel in fabricated products. China has become a progressively more important producer over the past decade. Figures 1 (volumes) and 2 (percentage changes) show how monthly production of crude steel has progressed since the beginning of 2006 separately for China and for the rest of the world. As figure 2 illustrates, China’s output recovered rapidly from the 2008 recession and grew to equal the rest of the world’s output by late 2013.
The recession was much deeper and more prolonged in the rest of the world, whose output remains below its pre-recession peak. China’s steel output dipped slightly in 2012, and its growth rate has eased again in 2014.
Source: World Steel Association.
Figure 1. World crude steel output, million tonnes monthly

85Economy and minerals – Mineral facts – Recent trends in the mining and metals industry
Source: World Steel Association.
Figure 2. World crude steel production monthly: % changes over previous year
China’s rising share of global steel output shown in figure 1 is typical of its growing dominance of demand for all minerals during the past decade . This is brought out in table 1, which compares global and Chinese usage in 2003 and 2013 for some major products . The table shows output rather than consumption of steel, as that drives demand for minerals .
Table 1. Global and Chinese demand for minerals in 2003 and 2013
2003 2013
World China China % World China China %
Steel production (ths kt) 972 222 22.8 1606 779 48.5
Consumption:
Aluminium (kt) 27 891 5 178 18.6 46 565 21 955 47.1
Copper (kt) 15 315 3 084 20.1 20 981 9 830 46.9
Lead (kt) 6 753 1 155 17.1 10 391 4 467 43.0
Nickel (kt) 1 249 133 10.6 1 799 909 50.5
Zinc (kt) 9 526 2 003 21.0 13 151 5 995 45.6
Coal (mtce)a 3 918 1 302 33.2 5 740 2 888 50.3
Note a: mtce – million tonnes of coal equivalent = 8.14 MWh.Sources: Steel Statistical Yearbooks, World Steel Association, BP Statistical Review of World Energy 2014, World Mineral Statistics Yearbooks, WBMS.
China’s share of the usage of all the listed products more than doubled between 2003 and 2013 . In some instances the increase in the volume of its consumption exceeded the overall

86Economy and minerals – Mineral facts – Recent trends in the mining and metals industry
growth of usage, as shown in table 2. That reflects the weakness of many of the advanced economies as well as China’s rapid growth .
Table 2. Growth in volumes between 2003 and 2013 and China’s share of that growth
World China China %
Steel production (ths kt) 634 557 87.9
Consumption:
Aluminium (kt) 18 674 16 777 89.8
Copper (kt) 5 666 6 746 119.1
Lead (kt) 3 638 3 312 91.0
Nickel (kt) 550 776 141.1
Zinc (kt) 3 625 3 992 110.1
Coal (mtce) 1 822 1 586 87.0
Note: mtce = million tonnes of coal equivalent = 8.14 MWh.Source: Table 1.
In summary, however, developments in the global minerals industry during the past decade have been driven by the burgeoning needs of China for raw materials .
The influence of economic activityDemand for all mineral products, even in China, primarily depends on rates of economic activity, especially in the construction industries and in the capital goods and consumer durables sectors . Although China has become the dominant user of mineral products, the advanced industrial countries remain important . Their recovery from the 2008–2009 recession has been both erratic and hesitant. Even by the first four months of 2014 their industrial production remained over 5% below its pre-crisis level in 2008 . Figure 3 shows year-on-year percentage changes in their monthly industrial output .
After a relatively strong advance in 2010 recovery was not sustained in 2011–2013, largely because of weakness in Europe and Japan . A stronger showing in late 2013 and early 2014 has not been maintained . Meantime, rates of growth have eased back in China and the rest of the world . Figure 4 compares percentage annual changes in quarterly manufacturing output since mid-2011 for China and the rest of the world . Growth rates have been universally lower than in 2011, despite an upsurge in the first quarter of this year in China and the developing countries.
The International Monetary Fund (IMF) has recently downgraded its forecasts of global economic activity in 2014 and 2015, reflecting the strains and uncertainties still plaguing most regions . Table 3 compares its predictions of October 2014 for percentage changes in real gross domestic product in 2014 and 2015 with the changes since 2009 .
China’s rate of growth is expected to weaken as it rebalances total expenditure towards domestic consumption rather than exports and capital spending . The United States is on a slow recovery path, but the Japanese and European economies remain weak . GDP is expected to decline in France and Italy this year and Germany is slipping back into recession . Many commentators are more bearish about global activity than the IMF .

87Economy and minerals – Mineral facts – Recent trends in the mining and metals industry
Source: International Financial Statistics, International Monetary Fund, Washington, October 2014.
Figure 3. Industrial Production in Advanced Economies: Percentage change on previous year
Source: Quarterly Report on Manufacturing, UNIDO, Geneva, successive issues.
Figure 4. Percentage annual changes in world manufacturing output

88Economy and minerals – Mineral facts – Recent trends in the mining and metals industry
Trends in individual productsAlthough demand for all metals and minerals is strongly influenced by overall economic activity, the end uses, geographical locations and market balances of each differ considerably. Given the sluggishness of economic activity, the reported rates of growth of demand in 2013–14 for some products, such as copper and zinc, are surprisingly robust.
Tables 4 and 5 draw together recent data about coal and a range of metallic products. Table 4 shows the volume of output, use and trade in the past six years, and Table 5 gives the annual percentage rates of change for the same items since 2011, with some estimates for 2014 to date.
Production and use have risen fairly consistently over the period, although the rates of change have varied between products. The production of iron ore, lead and zinc metal fell in 2012 but recovered in 2013, whilst the output of tin and brown coal fell in both 2012 and 2013. Mine output of copper, lead and gold rose more strongly in 2013 that in 2012, but lead output has fallen back in 2014. Production of copper and lead metal grew more slowly than mine output in both 2012 and 2013.
Aluminium and lead have remained in overall surplus throughout, although the lead market has moved back towards balance. The International Lead and Zinc Study Group forecasts small global deficits for lead in 2014 and 2015, largely because of a shortage of secondary lead. The tin market has been broadly balanced, but with a slight tendency towards deficit, whilst the nickel sector moved into surplus in 2012–13. That surplus has been offset by reductions in Indonesian exports of nickeliferous iron which is used in the Chinese steel industry in competition with primary nickel. The Indonesian government has banned exports of unprocessed minerals. The International Nickel Study Group expects the output of primary nickel to show little change between 2013 and 2015, but usage to grow by 7.9% in 2014. Further modest growth in 2015 will lead to a small market deficit, which can be comfortably met from a rundown in inventories.
Production of zinc metal exceeded usage throughout the 2008–12 period, leading to a sizeable build-up of inventories, but usage revived sufficiently strongly in 2013 through 2014 to move the market into a deficit that has enabled a reduction in reported stocks. The International Lead and Zinc Study Group forecasts a 5.1% rise in demand in 2014 followed by a 2.9% increase in 2015. Output is expected to show more modest growth so that there will be large deficits in both years that will reduce inventories to more normal levels.
The usage of copper metal has exceeded production since 2009, notwithstanding a strong rise in output since 2011. The deficit has been comfortably met by a rundown of inventories, many of which were unreported. The International Copper Study Group predicts a deficit of
Table 3. Percentage annual changes in real gross domestic product 2010–15
2010 2011 2012 2013 2014 2015
World 5.4 4.1 3.4 3.3 3.1 3.8
China 10.4 9.3 7.6 7.7 7.4 7.1
Advanced economies of which: 3.1 1.7 1.2 1.4 1.8 2.3
EU 2.0 1.8 –0.3 0.2 1.4 1.8
USA 2.5 1.6 2.3 2.2 2.2 3.1
Japan 4.6 -0.4 1.5 1.5 0.9 0.8
Source: World Economic Outlook Database, International Monetary Fund, Washington, October 2014.

89Economy and minerals – Mineral facts – Recent trends in the mining and metals industry
Table 4. Production and use of metallic products and coal, 2008 to 2013
2008 2009 2010 2011 2012 2013
Aluminium (kt)
Primary metal output 39 960 37 162 41 504 44 776 46 339 47 693
Usage 36 900 34 572 40 181 42 471 45 543 46 236
Balance 3 059 2 590 1 323 2 305 796 1457
Copper (kt)
Mine output 15 524 15 903 16 038 16 053 16 699 18 082
Metal output 18 239 18 270 18 986 19 596 20 137 20 930
Usage 18 054 18 088 19 129 19 697 20 387 21 230
Balance 185 182 –143 –101 –250 –300
Lead (kt)
Mine output 39 805 3 810 4 161 4 636 5 007 5 386
Metal output 9 196 9 242 9 850 10 606 10 550 11 138
Usage 9 188 9 242 9 812 10 444 10 483 11 123
Balance 8 0 38 162 67 15
Nickel (kt)
Metal output 1 382 1 317 1 440 1 613 1 751 1 941
Usage 1 278 1 234 1 465 1 607 1 659 1 772
Balance 104 82 –25 6 92 169
Tin (kt)
Metal output 332 336 356 368 364 353
Usage 337 325 370 382 362 359
Balance –5 10 –13 –14 2 –6
Zinc (kt)
Mine output 11 882 11 601 12 354 12 644 13 130 13 201
Metal output 11 772 11 280 12 896 13 074 12 630 12 891
Usage 11 574 10 914 12 649 12 699 12 386 12 985
Balance 198 366 247 375 244 -94
Iron ore (Mt)
Production 1 693 1 588 1 836 1 873 1 849 1 982
Trade 897 948 1 055 1 112 1 154 1 225
Steel(Mt)
Production 1 330 1 220 1 416 1 518 1 537 1 602
Coal (Mt)
Production
Hard coal 4 997 5 126 5 452 5 843 6 039 6 120
Brown coal 867 840 841 891 889 840
Exports
Metallurgical coal 236 212 282 286 294 302
Thermal coal 718 741 829 916 1 031 1 072
Gold (t)
Mine production 2 430 2 612 2 739 2 838 2 862 3 024
Supply 4 014 4 381 4 462 4 517 4 477 3 887
Fabrication usage 3 027 2 519 2 787 2 760 2 613 2 937
Sources: Copper from International Copper Study Group (www.icsg.org), lead & zinc from International Lead & Zinc Study Group (www.ilzsg.org), steel from World Steel Association (www.worldsteel.org) and other products from Resources and Energy Quarterly Statistical Data September 2014, Bureau of Resources and Energy Economics, Canberra, Australia. (http://www.bree.gov.au/publications/resources-and-energy-quarterly).

90Economy and minerals – Mineral facts – Recent trends in the mining and metals industry
0.3 million tonnes in 2014, much less than the 0.59 million tonnes recorded in the first eight months. Both mine and metal production are now rising more rapidly than usage, and, subject to any unforeseen shocks, supply is expected to outstrip usage in 2015.
Total exports of iron ore rose much faster than steel production in 2012 and 2013, with iron ore output growing strongly in 2013. The output of brown coal, very little of which is traded, peaked in 2011 and the rate of increase of hard coal production has eased back. Meantime, total exports of metallurgical coal have grown less rapidly than steel production, and the rate of growth of exports of thermal, or steam, coal has fallen substantially.
Mine output of gold changed very little in 2012, but increased by 5.7% in 2013 to exceed 3,000 tonnes for the first time. Mine production is supplemented as a source of supply of
Table 5. Annual percentage changes in production, use and trade 2011–2014
2011 2012 2013 2014 to datea
AluminiumMetal 7.9 3.5 2.9Usage 5.7 7.2 1.5CopperMine 0.1 4.0 8.3 3.2Metal 3.2 2.8 3.9 7.0Usage 3.0 3.5 4.1 12.1LeadMine 11.4 8.0 7.6 –4.1Metal 7.7 –0.5 5.6 2.4Usage 6.4 0.4 6.1 1.4NickelMetal 12.0 8.6 10.8Usage 9.7 3.3 6.8TinMetal 3.3 –1.1 –3.0Usage 3.2 –5.0 –1.0ZincMine 2.3 3.8 0.5 2.3Metal 1.4 –3.4 2.1 4.1Usage 0.4 –2.5 4.8 7.7Iron oreProduction 2.0 –1.3 7.2Trade 5.4 3.8 6.1Steel production 7.2 1.3 4.2 3.7Coal Production Hard coal 7.2 3.4 1.3 Brown coal 5.9 –0.2 –5.5Exports Metallurgical coal 1.3 2.8 2.7 Thermal coal 10.5 12.5 3.9GoldMine production 3.6 0.8 5.7Supply 1.2 –0.9 –13.2Fabrication usage –1.0 –5.3 12.4
Note: a – First seven months for copper, lead and zinc and first eight months for steel.Sources: As Table 4.

91Economy and minerals – Mineral facts – Recent trends in the mining and metals industry
gold by recycling and by the release of hoarded stocks. Total supply is always more volatile than mine output. It peaked in 2011 when prices were at their strongest, but then fell back, especially in 2013. Usage of gold in fabrication followed an inverse path, falling in 2011, but recovering in subsequent years, with a strong showing in 2013.
Changes in London Metal Exchange inventoriesInventories of metal held in London Metal Exchange (LME) warehouses make up only a portion of total inventories, but they are normally the most visible and volatile portion. Consequently movements in them provide a reasonable indicator of shifts in global supply/demand balances. Table 6 shows the levels of inventories of the main metals held in LME warehouse at the end of September in the years 2011 to 2014.
Table 6. London Metal Exchange Stocks, ‘000 tonnes, end September
2011 2012 2013 2014
Aluminium 4 563.8 5 049.8 5 374.6 4 613.8
Copper 475.0 223.5 533.3 152.3
Lead 374.1 265.1 239.4 225.5
Nickel 97.1 124.1 222.7 358.4
Tin 20.9 12.3 13.2 8.4
Zinc 818.8 989.5 1 024.0 750.7
Source: London Metal Exchange.
The trends illustrated emphasise the messages of tables 4 and 5 that the balances between supply and demand for the non-ferrous metals tightened during 2014. The relatively weak prospects for economic activity, combined with the start-up of capacity whose initiation commenced during the boom years, suggest that the tightening may not persist into 2015 for most metals.
PricesRecent trends in prices highlight the relatively weak conjuncture. For example, figure 5 compares monthly average LME prices for copper with the end-month levels of stocks of copper in LME warehouses since January 2006. The steep decline in stocks during 2013–14 did not occasion a sharp rise in prices, as it had done in earlier years.
Prices of other mineral products followed similar paths to copper, subject to their individual supply/demand characteristics. Figures 6 and 7 show the behaviour of monthly average prices of iron ore and gold respectively since January 2006. Iron’s price peak, like that of copper, was in early 2011 and the gold price peaked later in the same year. The spot price of iron ore is now well under half its peak level whilst the price of gold has dropped by almost one third.
The table brings out the sharp decline in most prices between 2011 and 2013 and their continuing weakness. Only nickel and zinc of the products covered in the table have experienced any strong recovery, mirroring their move towards deficits.

92Economy and minerals – Mineral facts – Recent trends in the mining and metals industry
Source: London Metal Exchange.
Figure 5. Copper prices and London Metal Exchange stocks
Source: International Financial Statistics, IMF, Washington, September 2014.
Figure 6. Iron ore prices: Chinese import ore fines 62% Fe spot (CFR Tianjin port), USD per tonne

93Economy and minerals – Mineral facts – Recent trends in the mining and metals industry
Source: London Bullion Market Association.
Figure 7. Gold prices London pm fix, USD/troy ounce
Table 7 summarises the performance of the prices of a range of products by comparing their September averages since 2010. The table brings out the sharp decline in most prices between 2011 and 2013 and their continuing weakness. Only nickel and zinc of the products covered in the table have experienced any strong recovery, mirroring their move towards deficits.
Table 7. September average prices, 2010–2014. USD/tonne, except gold and uranium
2010 2011 2012 2013 2014
Copper 7 709 8 315 8 068 7 161 6 872
Lead 2 184 2 299 2 169 2 088 2 122
Nickel 22 643 20 392 17 215 13 780 18 079
Tin 22 701 22 655 20 697 22 747 21 125
Zinc 2 151 2 077 2 002 1 848 2 294
Iron ore 141 177 99 134 82
Coal 102 132 95 83 71
Uranium (USD/lb) 47 52 48 34 34
Gold (USD/troy ounce) 1 271 1 781 1 742 1 348 1 241
Sources and notes: Copper. Lead, nickel, tin and zinc; London Metal Exchange Settlement prices. Iron ore; Iron ore fines 62% Fe, Chinese spot prices, CFR Tianjin port from International Monetary Fund, Primary Commodity Report. Coal; Australian thermal coal, 12 000 Btu/lb, less than 1% sulphur, 14% ash FOB Newcastle/Port Kembla, from International Monetary Fund. Uranium; Nuexco exchange spot price from International Monetary Fund. Gold; London a.m. fix, from London Bullion Market Association. 1 lb (pound) = 0.4536 kg1 troy ounce = 31.1035 g

94Economy and minerals – Mineral facts – Recent trends in the mining and metals industry
Sources: Mine 2014: Realigning expectations, PWC 2014 and US Federal Reserve. The after tax returns are for the top 40 companies included each year in the PWC reports, rather than a constant sample. They are shown both before and after impairment charges, such as capital write-offs.
Figure 8. Mining Industry percentage returns on equity, after tax, and US 10 year bond yields.
Source: Mineral and Petroleum Exploration, Australia, June 2014, Series 8412, Table 5. Australian Bureau of Statistics, Canberra.
Figure 9. Australian private expenditure on minerals exploration, quarterly, AUD million.

95Economy and minerals – Mineral facts – Recent trends in the mining and metals industry
ProfitabilityThe collapse in prices in 2012–2013 was immediately reflected in the mining industry’s profitability which had recovered well in 2010–2011 from 2009’s recession. Figure 8 compares a measure of the industry’s after-tax rate of return on equity with the yield on ten-year US treasury bonds. In 2013 the two were perilously close.
The unexpected sharpness of the fall in prices and profitability prompted mining companies to reassess their capital spending programmes and many cancelled or delayed projects. Also there were substantial write-downs of the value of assets as shown by the difference between rates of return on equity before and after impairment charges in figure 8. Shareholders pressed for companies to devote much greater attention to cost control and profitability and to boosting dividend payments than to the growth of volume that had previously been a major objective.
Exploration spendingOne result of a focus on cost reductions was a substantial fall in expenditure on exploration. The annual survey of corporate exploration budgets carried out by Metals economics Group, part of SNL Metals and Mining, indicated that spending had been temporarily cut in 2009 from its 2008 peak in response to the financial crisis, but had risen strongly to a new level in 2012. In 2013, however, it had dropped by about 30%, and a further large fall is predicted for 2014. The reductions have been spread across all regions and countries. Accurate data are not available for most countries on a timely basis, but quarterly spending in Australia, illustrated in figure 9, gives a reasonable snapshot of global developments.
Total spending more than halved between the peak in the second quarter of 2012 and the first quarter of 2014, with reductions in all sectors. As well as cutbacks by companies seeking to reduce costs and conserve cash, weakening product prices and gloomier expectations of future demand adversely affected the ability of junior companies to raise finance for exploration spending.
Regional patterns of minerals outputShortage of finance and cutbacks in capital spending may restrain the future growth of capacity, but that has risen considerably in recent years and many increases are too advanced to be halted. Moreover, China is now the world’s largest producer of minerals as well as the largest user and its companies have not been constrained by shortages of finance like those companies quoted on the major stock markets. Chinese companies are investing in resource projects overseas, notably in Africa.
The geographical location of minerals production is constantly changing as ore deposits become depleted and new projects start up. The top half of table 8 shows the percentage changes between 2007, just before the global financial crisis, and 2013 in the mine production of a range of minerals. The final column gives the changes in global output, which compare with the regional changes in the other columns. China is separated out from the rest of Asia. The bottom half of the table shows the regional shares of global output in 2013.
The lower half of the table brings out China’s role as a major supplier of minerals, complementing its position as the leading user. It is deficient in bauxite, copper and nickel,

96Economy and minerals – Mineral facts – Recent trends in the mining and metals industry
but is a major producer of the other products shown in the table, as of many other minerals. Imports are, however, increasingly needed to supplement domestic supplies. Latin America is the largest source of copper (mainly Chile and Peru) and silver (mainly Mexico and Peru).
In all products save nickel Chinese output grew much faster than the global total. That was because of a substantial increase in production of nickeliferous iron ore in Indonesia destined for Chinese pig iron plants. Increased production of bauxite and coal in Indonesia and Australia, and of iron ore in the latter was based on rising Chinese demand. Production of all products other than gold and silver either fell or increased more slowly than the total in Europe and North America. Experiences were mixed in the other regions, emphasising that the market characteristics of individual minerals can be as important as political and economic conditions in resource rich countries in driving investment.
One recurring theme of recent years has been the changing balance of power between host countries and companies. During the 1990s and early 2000s, when prices and profitability were subdued, fiscal provisions tended to favour investors. Governments were keen to attract
Table 8. Global Mine Production: regional growth and shares
Eu
rop
e
Afr
ica
Ch
ina
Oth
er A
sia
No
rth
Am
eric
a
Lat
in A
mer
ica
Oce
ania
TOTA
L
Percentage change 2007 to 2013
Bauxite –15.5 –1.1 110.8 89.6 –2.3 –7.8 29.9 35.3
Coal –2.6 3.7 36.7 42.3 –13.3 17.3 21.1 19.8
Copper 6.5 126.0 83.9 3.6 –1.0 9.7 5.4 17.7
Gold 35.9 11.4 58.3 –11.2 3.7 39.2 9.7 19.3
Lead 15.3 –2.0 117.4 85.0 –31.3 19.9 10.9 50.7
Iron ore –5.0 56.1 103.1 –10.9 11.8 –1.3 103.3 53.1
Nickel 6.5 54.6 48.2 251.4 –12.4 0.7 27.5 61.3
Silver 27.8 9.6 44.7 31.3 –22.3 32.6 –0.6 24.3
Zinc 3.3 –11.6 76.9 14.6 –15.3 10.8 0.6 23.3
Shares of world total in 2013
Bauxite 3.1 7.1 15.5 28.4 0.0 17.2 28.6 100
Coal 14.0 3.3 46.6 16.3 12.2 1.5 6.1 100
Copper 8.9 10.4 9.3 11.1 10.3 44.0 6.0 100
Gold 8.7 19.4 15.4 10.3 12.7 21.2 12.4 100
Lead 6.2 1.7 54.4 7.1 6.4 11.4 12.7 100
Iron ore 6.5 2.9 46.2 7.6 1.9 13.8 19.7 100
Nickel 13.9 4.4 3.9 44.9 8.9 8.2 15.8 100
Silver 13.1 1.5 15.1 7.7 6.4 48.7 7.4 100
Zinc 7.9 2.0 39.3 11.5 8.8 19.4 11.1 100
Note: Europe includes Russia and Turkey.Sources: World Metal Statistics Yearbook 2014, World Bureau of Metal Statistics, Ware, England, 2014. BP Statistical
Review of World Energy 2014.

97Economy and minerals – Mineral facts – Recent trends in the mining and metals industry
investment. The surge in prices and profitability during the late 2000s led to many countries revising their tax regimes, often through increasing royalties, in order to capture a greater share of profits. Unfortunately there is often a lag between official perceptions and policy changes and falling profitability has frustrated the ability to capture greater fiscal revenues in many instances.
Concluding commentThis lag between changing profitability and tax changes is merely one of the lags that bedevil the mineral industries. Producers were slow to react to rising demand and prices in the early to mid-2000s, having geared their production planning to the modest rates of growth and price levels of the 1990s. There were inevitably delays in expanding existing operations and developing new mines, even where ore reserves were available. Gradually new capacity was brought on stream, and with gathering momentum. Mineral producers became accustomed to the growth rates and price levels of the late 2000s and built those into their planning and capital spending programmes. The fall in prices of 2012–13 jolted those bullish projections and companies reacted accordingly. The next chapter in the evolving story has yet to be written, but the one certainty is that the minerals industry will remain cyclical. Each cycle is, however, subtly different from its predecessors, usually in unexpected ways. The future remains uncertain.

98Economy and minerals – The economic situation of domestic mining companies
The economic situation of domestic mining companies
Inka Neumaierová, Ivan Neumaier University of Economics, Prague
Tab. 1: Mining total
Source: own calculations according to Ministry of Industry and Trade and Czech Statistical Office data
Table 1: Mining total shows the general data for selected mining companies. This procedure was chosen because the published data in the classification CZ-NACE B Mining and quarrying generally lack the detail needed to serve our purpose. It was therefore necessary to base calculations on selected companies involved in mining. The calculation includes four specific characteristics:1. It is impossible to distinguish pure mining from other activities. All data are for the company as
a whole, such as, for example, the manufacture of bricks and trade activity are combined. This problem also exists in the CZ-NACE industrial classification, where companies are classified according to their predominant activities.
2. The companies belong not only to the group CZ-NACE1 B Mining and quarrying, but also to CZ-NACE 23 Manufacture of other non-metallic mineral products, specifically companies of the glass, ceramics and building material industries (glass and construction minerals), and several companies from other CZ-NACE groups, e.g. from CZ-NACE F construction (mining is one of the activities).
3. Companies that produce several minerals pose a problem as well. They are therefore listed for each mineral. That is why the total of sales, value added and the number of employees is higher
1 Translator’s note: CZ NACE – Czech adoption of the General Industrial Classification of Economic Activities within the European Communities (Nomenclature générale des Activités économiques dans les Communautés Européennes)

99Economy and minerals – The economic situation of domestic mining companies
in “our” Mining total than what is listed for CZ-NACE B Mining and quarrying. Their values are easily comparable over time as far as relative indices are concerned, such as book value added per employee.
4. It is possible to collect many data (e.g. from annual reports) for large companies, but in the case of small ones data are not available. This affects the selection of indexes.
5. In view of confidential individual data, it was necessary to combine the mining companies into larger groups.
The selection of indicators in the tables is as follows:– Number of companies– Registered average number of employees – Sales (sales of goods and sales of own goods and services)– Book value added (VA) (= sales + change of stocks of own production + capitalization
(production of a company for own consumption) – purchased goods – intermediate consumption (consumption of supplies and raw materials, energy and services))
– Sales per employee (labour productivity based on sales, i.e. sales per registered employee)– Book value added per employee (labour productivity based on book value added, i.e. book
value added per registered employee)– Hourly labour productivity (book value added per working hour)– Average salary– (Book value added – salaries) per employee, i.e. book value added after deduction of salaries
to cover other costs and formation of profits.The period covers the years 2009–2013. Indicators for time series are supplied by chain
Source: own calculations according to Ministry of Industry and Trade and Czech Statistical Office data(CSA in this and following figures means “Corrective additives for cement production”)
Fig. 1. Number of companies

100Economy and minerals – The economic situation of domestic mining companies
indices and by average growth for a given period. Comparable indices for individual minerals are compared with values for Mining total that equals 100 %.
An effort was made to provide a brief summary of available economic data on mining companies (both large and small). It is only a small amount of data, but in view of the availability of data on small companies, this is the maximum possible.
Even though the following figures and tables are self-explanatory, a brief commentary is included.
It is generally possible to say that the number of companies (Fig. 1) was stable in 2009-2012. In 2013, the number of companies increased in practically all mineral industries.
There were many reasons for this development. However, the most important fact is that economic data on more companies involved in mining were available. The group CZ-NACE B Mining and quarrying included 356 companies in 2013. Our selection (with the repeated inclusion of companies producing several minerals and mining companies belonging to other CZ-NACE groups) comprises 244 companies. Calculations include all of the larger companies (more than 50 employees) from the CZ-NACE B group.
As expected in our sample of minerals, crushed stone and sand and gravel account for the highest number of companies. In reality this number will probably be significantly higher, because these mineral industries have many small companies, which we have not recorded. On the contrary for bituminous and brown coal we recorded all companies because there are big companies only in these commodities. The smallest number of companies is recorded for glass sand.
The recalculated number of employees (Fig. 2) in terms of Mining total declined in 2009–2011, increased slightly in 2012, but grew significantly in 2013 due to the inclusion of more companies. This is particularly obvious primarily in the case of sand and gravel and foundry sand, or brick clays and related minerals.
Source: own calculations according to Ministry of Industry and Trade and Czech Statistical Office data
Fig. 2. Number of employees

101Economy and minerals – The economic situation of domestic mining companies
Bituminous coal, brown coal, lignite and crushed stone account for the highest number of employees, and foundry sand again for the lowest number. As a result of the clustering of the sales of various branches in 2013, sand and gravel accounted for a higher number of employees as well. The number of employees increased by five thousand in our Mining total. During 2009–2013, the number of employees for the entire CZ-NACE B group fell by more than five thousand.
To provide more detailed information on the number of employees, Figure 3 has been incorporated so as to show the average number of employees of companies for a given mineral. The largest companies are in the bituminous and brown coal mining industries.
Companies producing foundry sand and crushed stone are smaller and include only mining operations. The smallest companies are those that produce glass sand (with the exception of 2013) and dimension stone.
As a result of the clustering, companies producing glass sand and sand and gravel grew in 2013.
Sales are shown in Figure 4. Sales define the overall productivity of companies producing individual minerals. If sales are non-existent, then the necessary money flow that covers expenses is non-existent as well. The lowest sales figure with regard to the Mining total was registered in 2009. Sales grew in 2010–2011, declined slightly in 2012, and increased sharply in 2013 (which was again influenced considerably by the clustering of more related branches in the companies category, i.e. an increase in the sales of specific companies).
In 2009, production of bituminous coal, brown coal, crushed stone, and sand and gravel
Source: own calculations according to Ministry of Industry and Trade and Czech Statistical Office data
Fig. 3. Average number of employees

102Economy and minerals – The economic situation of domestic mining companies
Source: own calculations according to Ministry of Industry and Trade and Czech Statistical Office data
Fig. 4. Sales (CZK million)
Source: own calculations according to Ministry of Industry and Trade and Czech Statistical Office data
Fig. 5. Average sales (CZK million)

103Economy and minerals – The economic situation of domestic mining companies
accounted for the largest share of Mining total sales. This situation continues to this day except for a sharp rise in the sales of sand and gravel and of the Other minerals group.
In 2009–2013, the strongest growth was registered by sand and gravel and by the Other minerals group, and bituminous coal conversely experienced the sharpest decline.
As in the case of the number of employees, average values per company (Fig. 5) have also been incorporated for sales. Clearly the largest companies in terms of sales are those involved in the production of coal. On the contrary, as may be expected, the smallest companies were those involved in the production of stone, gravel and sand.
In 2013, there was an obvious increase in the average sales figures in the case of glass sand, sand and gravel, and in the Other minerals group due to the clustering of the companies involved.
There is a relationship between value added (Fig. 6) and GDP, or more precisely gross value added (GVA), which serves as a basis for calculating GDP. The advantage of value added compared to sales is that it does not change as a result of company break-ups and mergers. From this perspective, indices of value added are more informative than those of sales.
Until 2012, the mining of bituminous and brown coal clearly accounted for the highest share of value added. In 2013, value added grew in the case of sand and gravel and declined sharply in the case of bituminous coal, which is exactly why sand and gravel and brown coal registered the highest value added figures.
If we take into account the structure of the Other minerals group, where production of crude oil, natural gas and uranium prevail, than it is possible to state that the share of energy mineral production is crucial for GDP (or GVA) formation in mining and quarrying.
Source: own calculations according to Ministry of Industry and Trade and Czech Statistical Office data
Fig. 6. Book value added (CZK million)

104Economy and minerals – The economic situation of domestic mining companies
The set of relative indices will start off with labour productivity. Of all the chosen indicators, the value added labour productivity is one of the main indicators for evaluating companies. As is evident in Figure 7, great differences exist between different minerals. Glass sand, limestone and corrective additives for cement production , dolomites and both coal mining industries seem to be excellent. Dimension stone, kaolin, clays and bentonite, and feldspar rank at the opposite end.
Since it is a comparative indicator, a comparison of each mineral with the Mining total is possible as well as a comparison of the Mining total with larger units such as those of the industrial classification of companies (CZ-NACE).
In our selection of companies, the labour productivity of the Mining total in 2013 is 4 % higher than the mining and quarrying (CZ-NACE B) classification. The productivity of our selection is 35 % higher in comparison with CZ-NACE C Manufacturing industry, and the labour productivity of our selection is 17% higher when compared with industry, i.e. CZ-NACE B + C + D + E. It is evident that our selection of companies is partly connected with manufacture (e.g. part of CZ-NACE 23 Manufacture of porcelain and ceramic products), which lowers labour productivity.
In industry, in terms of value added labour productivity, mining and quarrying is in second place behind energy. This is due to the fact that consumption of materials in mining is very low – there are no manufactured products from purchased supplies.
Hourly value added labour productivity (Fig. 8) has similar characteristics as productivity per employee (Fig. 7). On the other hand, it is a more precise expression of productivity, because it shows the book value added per working hour.
Source: own calculations according to Ministry of Industry and Trade and Czech Statistical Office data
Fig. 7. Labour productivity based on value added (CZK/employee)

105Economy and minerals – The economic situation of domestic mining companies 105
Source: own calculations according to Ministry of Industry and Trade and Czech Statistical Office data
Fig. 8. Hourly labour productivity (CZK/working hour)
Source: own calculations according to Ministry of Industry and Trade and Czech Statistical Office data
Fig. 9. Sales per employee (CZK thousand/employee)

106Economy and minerals – The economic situation of domestic mining companies 106
Source: own calculations according to Ministry of Industry and Trade and Czech Statistical Office data
Fig. 10. Average salary (CZK/employee)
Source: own calculations according to Ministry of Industry and Trade and Czech Statistical Office data
Fig. 11. (Value added – salaries) per employee (CZK/employee)

107Economy and minerals – The economic situation of domestic mining companies 107
When comparing our selection of companies with aggregates, sales per employee (Fig. 9) exhibits rather opposite results compared to value added labour productivity. Even though sales per employee for our selection were 1% higher in 2012 than for CZ-NACE B Mining and quarrying, they were considerably lower than those of CZ-NACE C Manufacturing industry (by 23 %) and 38% lower than those of industry (CZ-NACE B + C + D + E). The influence of subsequent manufacturing is not that great.
In general, the greater the integration of mineral extraction with subsequent manufacturing, the higher the sales per employee in relation to value added labour productivity. This clearly applies, for example, to brick clays and related minerals, where mining operations are usually carried out by companies manufacturing bricks and roof tiles.
Glass sand, limestone and corrective additives for cement production, dolomite and brick clays and related minerals are again at the top of the list. The integration with subsequent manufacturing is illustrated by dimension stone in 2013.
The average salary (Fig. 10) is more or less equal despite relatively big differences in labour productivity between individual minerals. Compared to CZ-NACE B Mining and quarrying, the average salary of our selection of companies is 6 % lower and, on the other hand, 22% higher in comparison with CZ-NACE C. The Mining total again corresponds to CZ-NACE B.
Bituminous coal registered the highest average salary figures, which is understandable because of underground mining. A slight surprise is glass sand, which ranked second. Dimension stone, clays and bentonite registered the lowest average salary figures.
The difference between value added labour productivity and average salary (Fig. 11) is a deciding indicator for the evaluation of an enterprise‘s productivity (in our selection of indices). The higher the value, the better, i.e. it leaves more money for covering other costs (depreciation, social taxes, financial costs etc.) and for profit creation. In view of the fact that average salaries are not too variable, the result is due to differences in the book value added labour productivity. For company owners, this is the most important index from our selection of indices. The more an employee produces, the more remains at an owner´s disposal to cover costs and for formation of profits.
Glass sand is at the top of the list, followed by brown coal, limestone and corrective additives for cement production, and dolomite.
For a better understanding of the index (value added – salaries) per employee, the growth in the value of the 2013/2009 index (Fig. 12) was calculated. A positive aspect is that the Mining total registered a growth of 14 %. In other words, the mining business was more lucrative in 2013 than in 2009.
The production of other minerals is excellent. Unfortunately due to data protection, we cannot divulge the reasons for this fact. Crushed stone ranked second. Feldspar, sand and gravel, and bituminous coal ranked third. Bituminous coal, glass sand and corrective additives for cement production declined drastically. A review of individual minerals follows.
Even though bituminous coal is produced by two companies, or more precisely by one, the ČSÚ (Czech Statistical Office) lists more than three companies in the sector CZ-NACE 05.1 Mining and processing of bituminous coal. We have classified bituminous coal under researchedminerals.

108Economy and minerals – The economic situation of domestic mining companies 108
The fewest number of companies are those that produce bituminous coal (Tab. 2) (2.87% share of the Mining total), but in terms of absolute financial indices it is one of the most important minerals because it accounted for 19.37% of employees, 15.74% of sales, and 11.11% of value added in 2013.
With regard to relative indices, this mineral industry ranked highest in 2013 only in terms of average salary (underground mining). However in 2009–2012, it also ranked above-average in other relative indices.
The trend in absolute indices in 2010-2011 was very unfavourable. Unfortunately, a very negative trend began in 2012 , which was caused by a decline in global coal prices. Production is being cut back as a result of uncompetitiveness due to high production costs. In addition, domestic demand for bituminous coal is decreasing, which is for example related to a decline in metallurgy.
Another problem is that these are companies involved in mining and auxiliary mining operations and that costs associated with reclamation, etc., practically do not decrease during a decline in mining that sustains the companies. In addition, organizational changes are also causing problems for this mineral industry.
There are again few companies that produce brown coal and lignite (Tab. 3) ( 2.87 % share of the Mining total ), but in terms of absolute financial indices it is the third most important mineral, accounting for 13.80% of employees, and it ranks second in sales (16.02%) and first in value added (23.59%).
In terms of relative indices, this mineral ranks highest in both labour productivity categories and above-average in sales per employee.
Source: own calculations according to Ministry of Industry and Trade and Czech Statistical Office data
Fig. 12. Index 2013/2009 (book value added – salaries) per employee

109Economy and minerals – The economic situation of domestic mining companies 109
Tab. 2: Bituminous coal
Source: own calculations according to Ministry of Industry and Trade and Czech Statistical Office data
Tab. 3: Brown coal and lignite
Source: own calculations according to Ministry of Industry and Trade and Czech Statistical Office data

110Economy and minerals – The economic situation of domestic mining companies 110
The trend in absolute indices in 2009–2013 was insignificant. The highest values were registered in 2009, followed by a decline in index values. Even though values have grown since 2011, they have not been able to reach the 2009 levels.
The trend in relative indices in 2009–2013 was very good.
Companies producing kaolin (Tab. 4), which again ranked among medium to less important mineral industries, accounted for 2.46% of the number of companies, for 4.29% of the number of employees, for 4.03% of sales, and for 3.18% of value added.
One company from CZ-NACE 23 Manufacture of other non-metallic mineral products (porcelain manufacture) was included, which lead to a higher value in sales and in the number of employees because of kaolin production being integrated with subsequent manufacturing. Unfortunately, the mining and subsequent processing operations cannot be separated. An effort was made to aquire data only on kaolin production from various sources. However the data obtained, according to which sales may hover around CZK billion 2.5, included only some companies.
In terms of relative indices, this is one of the least efficient mineral industries.Compared to 2009, the trend in indices in 2013 was very good, with the exception of
average salary.
In the case of clays and bentonite (Tab. 5), it is again impossible to separate mining from manufacturing – three companies from CZ-NACE 23 are included. These companies account for more than half of the number of employees and sales. According to sources available (which again do not include all companies), sales for the mineral itself may have hovered around CZK billion 1 in 2013.
Tab. 4: Kaolin
Source: own calculations according to Ministry of Industry and Trade and Czech Statistical Office data

111Economy and minerals – The economic situation of domestic mining companies 111
Tab. 5: Clays and bentonite
Source: own calculations according to Ministry of Industry and Trade and Czech Statistical Office data
In terms of absolute indices in 2013, this was again a moderately important mineral. It accounted for 4.51% of the number of companies, for 3.08% of the number of employees, for 2.85% of sales, and for 2.41% of value added.
This is again one of the least efficient mineral industries in terms of relative indices.The trend in absolute indices in 2013 compared to 2009 was influenced by an increase in
the number of companies in 2013. The trend was good until 2012, but the values of practically all indices fell sharply in 2013.
In the case of feldspar (Tab. 6), the index values also demonstrate the connection of mining with manufacturing. Two manufacturing companies from the CZ-NACE 23 sector and construction were included in 2013. These companies accounted for two-thirds of sales.
In terms of absolute indices, this is a less to moderately important mineral industry. It accounted for 2.46 % of the number of companies, for 4.64 % of the number of employees, for 3.98% of sales, and for 3.04% of value added.
This is again a less effective mineral in terms of relative indices.The trend in absolute indices in 2013 was very positive compared to 2009. The trend in relative indices was again very good in 2013 compared to 2009. With regard
to relative and absolute indices, the best year for the mineral was 2011 and 2013, respectively.
Glass sand (Tab. 7) was the least important mineral industry in terms of absolute indices until 2012, yet the most efficient mineral with regard to relative indices with the exception of average salary. A change occurred in 2013 as a result of the inclusion of a company from CZ-NACE 23 instead of a company involved in mining. In spite of an increase in absolute values and a drop in relative values, this was still a good mineral industry.

112Economy and minerals – The economic situation of domestic mining companies 112
Tab. 6: Feldspar
Source: own calculations according to Ministry of Industry and Trade and Czech Statistical Office data
Tab. 7: Glass sand
Source: own calculations according to Ministry of Industry and Trade and Czech Statistical Office data

113Economy and minerals – The economic situation of domestic mining companies 113
Because of the inclusion of the company from CZ-NACE 23, the absolute values soared in the 2013/2009 index and the values of relative indices fell sharply.
As in the case of glass sand, foundry sand (Tab. 8) was similarly influenced by the inclusion of five manufacturing companies, which in terms of absolute indices reflected a very positive trend in the 2013/2012 indices and a negative trend in the values of relative indices. However, the trend in indices in 2009–2012 was not good.
With regard to efficiency in 2013, this was a significantly less effective mineral industry compared to glass sand, the second least effective mineral regarding sales per employee, and third worst in labour productivity.
Limestone and corrective additives for cement production, and dolomite (Tab. 9) are industries that are highly integrated with manufacturing, specifically with CZ-NACE 23, 24 (chemical industry) and construction.
In 2013, these were rather moderately important mineral industries in terms of absolute indices. They accounted for a 7.79% share of the Mining total with regard to the number of companies, for 3.11% of the number of employees, for 3.77% of sales, and for 2.66% of value added.
The levels of relative indices in 2009-2012 were good. In 2013, the values of relative indices fell below the Mining total average with the exception of sales per employee.
The trend in sales is very unfavourable. These minerals are linked primarily to construction output. Construction is constantly declining. However, the decline in construction output is greater. Key subsequent manufacturing operations connected with these minerals (e.g. cement production) are probably optimizing production not only according to Czech demand.
Tab. 8: Foundry sand
Source: own calculations according to Ministry of Industry and Trade and Czech Statistical Office data

114Economy and minerals – The economic situation of domestic mining companies 114
A bad sign for these minerals are the continuous cutbacks in state-funded construction projects.
In 2013, dimension stone (Tab. 10) included nine new companies, specifically from the manufacturing and construction sectors. The operations of these companies are integrated with mining.
This is the least important mineral industry in terms of the number of employees (1.41%), sales (1.47%) and value added (1.38%).
With regard to relative indices, dimension stone is the least efficient mineral industry. This industry includes many small companies that are not classified. According to expert estimates, the economic efficiency would improve slightly if these companies were included.
With regard to indices for the 2013/2009 period, this was the best mineral industry, probably due to the addition of new mining companies.
The crushed stone (Tab. 11) industry accounts for the highest number of companies (30.67 % of the total), and ranks decently in the number of employees (13.01%), sales (11.27%) and value added (12.72%).
In terms of relative indices, it hovers around the average of the Mining total.With regard to absolute values, this mineral industry grew until 2011 and then declined. On
the other hand with regard to relative indices in 2013 compared to 2009, it registered sharp growth in labour productivity (Value added per employee), decent growth in average salary and hourly labour productivity, and growth in sales per employee.
This is again a mineral industry with a high number of small companies. Our selection includes larger companies. We do not have data for small companies.
Tab. 9: Limestone and corrective additives for cement production and dolomite
Source: own calculations according to Ministry of Industry and Trade and Czech Statistical Office data

115Economy and minerals – The economic situation of domestic mining companies 115
Tab. 10: Dimension stone
Tab. 11: Crushed stone
Source: own calculations according to Ministry of Industry and Trade and Czech Statistical Office data
Source: own calculations according to Ministry of Industry and Trade and Czech Statistical Office data

116Economy and minerals – The economic situation of domestic mining companies 116
Sand and gravel (Tab. 12) is an industry that accounts for the second highest number of companies (21.33% of the total in 2012). It ranked first in terms of other absolute indices, accounting for 17.71% (second-best) of the number of employees, for 18.23% (first) of sales, and for 22.54% (second-best) of value added in 2013. The relative index levels in 2013 were predominantly above-average.The sharp increase in sales in 2013 is due to a “change” in companies involved in mineral processing, from purely mining-oriented companies (lacking data for 2013) to those integrated with manufacturing (whose data was not available until 2013). However, a fact that remains is that the purely mining-oriented companies were swallowed up by subsequent manufacturing operations (primarily construction).
This mineral industry again had a high number of small companies (whose data are not available).
Brick clays and related minerals (Tab. 13) is one of the smaller mineral industries (3.83 % of sales in 2013, etc.).
In terms of relative indices, it ranks second best in labour productivity (Value added per employee). The problem is that this is again an industry with integrated mining and subsequent manufacturing operations, making it impossible to separate both items. This is evident when compared to the Mining total, as sales per employee were highly above-average in 2009–2012 and above-average in 2013.
In terms of the average growth rates of absolute indices, this mineral industry registered high growth during the 2013/2009 period. On the other hand, relative indices declined sharply.
Tab. 12: Sand and gravel
Source: own calculations according to Ministry of Industry and Trade and Czech Statistical Office data

117Economy and minerals – The economic situation of domestic mining companies 117
Tab. 13: Brick clays and related minerals
Source: own calculations according to Ministry of Industry and Trade and Czech Statistical Office data
Tab. 14: Other minerals (uranium + crude oil + graphite + gemstones + silicaminerals + gypsum)
Source: own calculations according to Ministry of Industry and Trade and Czech Statistical Office data

118Economy and minerals – The economic situation of domestic mining companies 118
Because there were only few companies in the other mineral sectors, it is impossible to publish data on them. Therefore they were aggregated into the Other minerals group (Tab. 14). It includes production of uranium, crude oil, natural gas, graphite, gemstones, diatomite, silica minerals and gypsum. To comment on such a diverse group is problematic. It contains very efficient mineral industries (crude oil, natural gas), but also very problematic ones (uranium) due to near-zero or intermittent mining.

119Economy and minerals – Outl ine of domestic mine production
Outline of domestic mine production
2009 2010 2011 2012 2013
Energy minerals
Uraniumt U 286 259 252 222 232
Concentrate production, t U (1) 243 237 216 219 206
Bituminous coal kt 10 621 11 193 10 967 10 796 8 610
Brown coal kt (2) 45 354 43 931 46 848 43 710 40 585
Lignite kt 262 0 0 0 0
Crude oil kt 217 173 163 150 152
Natural gas mil m3 180 201 187 204 207
Industrial mineralsGraphite kt 3 0 0 0 0
Pyrope bearing rock kt 26 23 17 12 16
Moldavite (tectite) bearing rock
ths m3 58 57 65 41 41
kt (1 m3 = 1.8 kt) 104 103 117 74 74
KaolinRaw, kt (3) 2 886 3 493 3 606 3 318 3 108
Beneficiated, kt 488 636 660 624 609
Clays kt 377 429 499 485 465
Bentonite (4) kt 177 183 160 221 226
Diatomite kt 0 32 46 43 49
Feldspar kt 431 388 407 445 411
Feldspar substitutes kt 23 19 22 15 15
Silica minerals kt 16 14 24 17 15
Glass sand kt 990 888 976 849 862
Foundry sand kt 374 473 395 491 412
Limestones and correcti-ve additives for cement production
kt 9 488 9 828 11 244 9 858 9 605
Dolomite kt 337 385 369 440 392
Gypsum kt 13 5 11 14 11
Construction minerals
Dimension stone
Mine production in reserved deposits, ths m3 (5) 209 262 192 138 140
Mine production in reserved deposits, kt (1 m3 = 2.7 kt) (5) 564 707 518 374 378
Mine production in non-reserved deposits, ths m3 (6) 54 43 46 44 31
Mine production in reserved deposits, kt (1 m3 = 2.7 kt) (6) 146 116 130 130 84
Crushed stone
Mine production in reserved deposits, ths m3 (5) 13 947 12 350 12 299 10 950 11 420
Mine production in reserved deposits, kt (1 m3 = 2.7 kt) (5) 37 657 33 350 33 207 29 565 30 384
Mine production in non-reserved deposits, ths m3 (6) 1 350 1 450 1 300 1 100 970
Mine production in non-reserved deposits, kt (1 m3 = 2.7 kt) (6) 3 650 3 920 3 510 2 970 2 620
Sand and gravel
Mine production in reserved deposits, ths m3 (5) 7 269 6 187 6 902 6 136 5 346
Mine production in reserved deposits, kt (1 m3 = 1.8 kt) (5) 13 084 11 140 12 424 11 045 9 623
Mine production in non-reserved deposits, ths m3 (6) 6 050 4 500 5 000 4 300 4 300
Mine production in non-reserved deposits, kt (1 m3 = 1.8 kt) (6) 10 890 8 100 9 000 7 740 7 740
Brick clays and related minerals
Mine production in reserved deposits, ths m3 (5) 1 028 838 932 852 743
Mine production in reserved deposits, kt (1 m3 = 1.8 kt) (5) 1 850 1 508 1 678 1 534 1 337
Mine production in non-reserved deposits, ths m3 (6) 203 182 147 176 140
Mine production in non-reserved deposits, kt (1 m3 = 1.8 kt) (6) 365 328 265 317 252
Metallic ores (not mined)
(1) corresponds to sales production (without beneficiation losses) (2) ČSÚ (Czech Statistical Office) presents so-called sales mining production which is production of marketable brown coal and
reaches on average about 95 % of given mine production (3) raw kaolin, total production of all technological grades(4) including mining of montmorillonite clays overburden of kaolins since 2004(5) decrease of mineral reserves by mining production (6) estimate

120Economy and minerals – Domestic share in the wor ld mine production
Domestic share in the world mine production
2009 2010 2011 2012 2013
Energy minerals
Uranium (U) world: WNA 0.56 % 0.48 % 0.47 % 0.38 % 0.39 %
Bituminous coal world: EIA, BP 0.18 % 0.18 % 0.16 % 0.16 % 0.12 %
Brown coal + Lignite world: EIA, BP 5.30 % 5.10 % 5.14 % 4.83 % 4.83 %
Crude oil world: WBD, BP 0.006 % 0.004 % 0.004 % 0.004 % 0.004 %
Natural gas world: BP 0.006 % 0.006 % 0.006 % 0.006 % 0.005 %
Industrial minerals
Graphite world: WBD, MCS – – – – –
Gemstones
Pyrope bearing
rockN N N N N N
Moldavite
(tectite) bearing
rock
N N N N N N
Kaolin world: MCS 9.43 % 10.27 % 10.64 % 9.76 % 8.40 %
Clays N N N N N
Bentonite world: MCS 1.81 % 1.83 % 1.55 % 2.21 % 2.19 %
Diatomite world: MCS – 1.75 % 2.19 % 2.05 % 2.28 %Feldspar world: MCS 2.28 % 1.94 % 1.92 % 2.34 % 1.79 %Feldspar substitutes N N N N NGlass + Foundry sand world: MCS 1.22 % 1.26 % 0.99 % 0.96 % 0.90 %
Limestones and corrective
additives for cement
production
world: MCS * 0.28 % 0.28 % 0.26 % 0.23 % 0.20 %
Dolomite N N N N N
Gypsum world: MCS 0.01 % 0.003 % 0.01 % 0.01 % 0.01 %
Construction minerals
N N N N N
Metallic ores (not mined)
* calculation based on lime and cement production. 2 t of limestone = 1 t of lime or 2 t of cement

121
ENVIRONMENT AND MINERALS
Mining and nature protection
1,496 reserved and 854 non-reserved mineral deposits were registered in the Czech Republic as of December 31, 2013. The number of exploited deposits was markedly lower – 502 reserved and 203 non-reserved. Only 39 reserved and 15 non-reserved deposits were mined in the specially nature protected areas, which represents 7.8 % and 7.4 % of the total number, respectively.
Act No 114/1992 Sb. on nature and landscape protection in its present wording regulates activities in specially protected areas (ZCHÚ) of the Czech Republic (national parks – NP (Národní park), protected landscape areas – CHKO (Chráněná krajinná oblast), national nature reserves, nature reserves, national nature monuments and nature monuments). According to this Act, all mineral mining (section 16) in national parks (with exception of crushed stone and sand mining for construction in the territory of the national park), in the first zone of protected landscape areas (section 26) and in national nature reserves (section 29) is prohibited. Although the mining of mineral resources is not prohibited by law in other areas (2nd to 4th zones of the CHKO, nature reserves, national nature monuments and nature monuments), it is very difficult to obtain authorization. Legal regulations which mention prohibition of the “permanent damage of the soil surface” are the main reason – and they practically exclude mineral mining. A further reason is the civil activity in the field of environmental protection.
Mineral deposits are mined, and were in the past mined, in the CHKO in majority of cases where the mining claims were already determined before these CHKO were established. Mining in the CHKO declined after 1989 till 2002, after it rather grows till 2008 and after declines and stagnates respectively namely of registered deposits, which follows from the data in the table “Mining of reserved and non-reserved mineral deposits in CHKO” below and also from the fact that reserved deposits were mined in 19 from 25 CHKO in 2007 and 2008 (see the table “Mining of reserved and non-reserved mineral deposits in individual CHKO”) compared to 17 from 25 CHKO in 2006. Deposits were mined only in 16 CHKO in 2009 and 2010 and in 14 CHKO in 2011 till 2013.
Specially protected areas (ZCHÚ) in the Czech Republic
Number/Year 2009 2010 2011 2012 2013
Total number 2 247 2 267 2 301 2 338 2 421
National parks (NP) 4 4 4 4 4
Protected landscape areas (CHKO) 25 25 25 25 25
Others 2 218 2 238 2 272 2 309 2 392
Source: AOPK ČR (2014)

122Environment and minerals – Mining and nature protection
Structure of ZCHÚ in 2013
Category of specially protected areas NumberArea (km2)
Proportion on the territory of the Czech Republic 78 864 km2 (%)
LARGE-EXTENT ZCHÚ:
National parks (NP) – mining explicitly prohibited 4 1 195 1.52
Protected landscape areas (CHKO) 25 10 867 13.78
– (in them the 1st zones of CHKO where mining
is explicitly prohibited)25 871
1.10
ZCHÚ with mining explicitly prohibited
by the Act No. 114/1992 Sb.29 2 066 2.62
SMALL-EXTENT ZCHÚ:
National nature monuments (NPP) 113 45 0.06
National nature reserve (NPR) 110 281 0.36
Nature monuments (PP) 1 360 273 0.35
Nature reserves (PR) 809 412 0.52
NPP, NPR, PP, PR 2 392 1 011 1.28
– (from them NPP, NPR, PP, PR on the area of NP, CHKO) 740 520 0.67
LARGE-EXTENT AND SMALL-EXTENT ZCHÚ – total 2 421 12 554 15.92
Source: AOPK ČR (2014)
Mining of reserved and non-reserved mineral deposits in CHKO, kt
mineralReserved deposits Non-reserved deposits
2009 2010 2011 2012 2013 2009 2010 2011 2012 2013
Gemstones* 26 23 17 12 16 – – – – –
Crude oil 0 0,5 0 0 0 – – – – –
Natural gas** 6 4,4 0 2 0 – – – – –
Quartz sand 0,9 0 0 0 0 – – – – –
Feldspar 230 214 240 286 279 – – – – –
Limestone 3 283 3 384 3 033 3 501 3 278 – – – – –
Dimension stone** 46 42 55 54 41 2 1 3 3 2
Crushed stone**. *** 3 941 3 027 3 146 2 685 3 041 94 67 586 219 173
Sand and gravel** 1 175 1 133 1 206 1046 980 40 45 36 43 28
Brick clay** 0 0 0 0 0 0 0 0 0 0
Total 8 708 7 827 7 697 7 586 7 636 136 113 625 265 203
Index, 1990=100 54 48 48 47 48 – – – –- –-
Index, 2000=100 – – – –- – 44 36 202 85 66
* pyrope bearing rocks, ** conversion to kt: natural gas (1,000,000 m3 = 1 kt), dimension and crushed stone (1,000 m3 = 2.7 kt), sand and gravel and brick clays (1,000 m3 = 1.8 kt), *** increase in mine production of non-reserved crushed stone deposits in 2011 is caused by increase in production of non-reserved part of Měrunice deposit at the expense of its reserved one

123Environment and minerals – Mining and nature protection
Mining of reserved and non-reserved mineral deposits in individual CHKO, kt*
Name of CHKO 2009 2010 2011 2012 2013
Beskydy Mts. 64 71 117 63 30
Bílé Karpaty Mts. 490 260 186 220 170
Blaník 0 0 0 0 0
Blanský les 490 604 516 536 663
Broumov region 145 110 100 104 149
České středohoří Mts. 1 788 1 142 1 383 1 231 1 439
Český kras (Bohemian Karst) 3 357 3 405 3 016 3 360 3 375
Český les Mts. 0 0 0 0 0
Český ráj 0 0 0 0 0
Jeseníky Mts. 138 103 103 136 94
Jizerské hory Mts. 0 0 0 0 0
Kokořín region 0 0 0 0 0
Křivoklát region 432 355 381 250 234
Labské pískovce (Elbe sandstones) 0 0 0 0 0
Litovelské Pomoraví region 54 7 0 0 0
Lužické hory Mts. 8 9 0 5 8
Moravský kras (Moravian Karst) 168 178 201 289 31
Orlické hory Mts. 0 0 0 0 0
Pálava region 0 0 0 0 0
Poodří region 0 0 0 0 0
Slavkovský les region 129 119 148 154 160
Šumava Mts. 78 70 78 54 63
Třeboň region 1 241 1 243 1 298 1 196 1 130
Žďárské vrchy Mts. 131 130 130 130 131
Železné hory Mts. 130 135 132 123 162
Total mine production (rounded) 8 843 7 941 7 789 7 851 7 839
As far as the impact of mining on the area is concerned, the CHKO Český kras (Bohemian Karst – limestone mining) is especially unfavourably affected. The impact on some other CHKO, especially CHKO Třeboň region, Poodří, České středohoří Mts., Blanský les and Moravský kras (Moravian Karst) is still rather high (see Tab. “Impact of mining of reserved deposits in CHKO”).

124Environment and minerals – Mining and nature protection
Impact of mining of reserved deposits in CHKO, t/km2 in a year(areas of CHKO as of December 31)
Name of CHKOarea km2
in 20132009 2010 2011 2012 2013
Beskydy Mts. 1 160 55 61 22 23 12
Bílé Karpaty Mts. 715 685 364 260 308 238
Blaník 40 0 0 0 0 0
Blanský les 212 2 311 2 849 2 434 2528 3 122
Broumov region 410 354 268 244 224 351
České středohoří Mts. 1 070 1 671 1 067 1 293 993 1 226
Český kras (Bohemian
Karst)132 25 432 25 795 22 848 25 288 25 485
Český les Mts. 473 0 0 0 0 0
Český ráj 182 0 0 0 0 0
Jeseníky Mts. 740 186 139 139 184 127
Jizerské hory Mts. 350 0 0 0 0 0
Kokořín region 270 0 0 0 0 0
Křivoklát region 630 686 563 605 390 365
Labské pískovce (Elbe
sandstones)245 0 0 0 0 0
Litovelské Pomoraví 96 563 73 0 0 0
Lužické hory Mts. 270 30 33 0 0 0
Moravský kras (Moravian
Karst)92 1 826 1 935 2 185 3 141 337
Orlické hory Mts. 200 0 0 0 0 0
Pálava region 70 0 0 0 0 0
Poodří region 82 0 0 0 0 0
Slavkovský les 640 202 186 231 241 250
Šumava Mts. (CHKO + NP) 1 684 46 42 46 32 37
Třeboň region 700 1 773 1 776 1 854 1 683 1 570
Žďárské vrchy Mts. 715 183 182 182 182 182
Železné hory Mts. 380 342 355 347 323 426
TOTAL (total mining/total area)
11 558 814 731 666 656 661
Note: an impact exceeding 10,000 t/km2 in a year is regarded as critical
It is possible to get a clearer picture of mining activities in the Czech Republic from following map.
As well as the Act No. 114/1992 Sb. on nature and landscape protection, Act No. 100/2001 Sb. on environmental impact assessment and the Decree of the MŽP No. 175/2006 Sb. (formerly
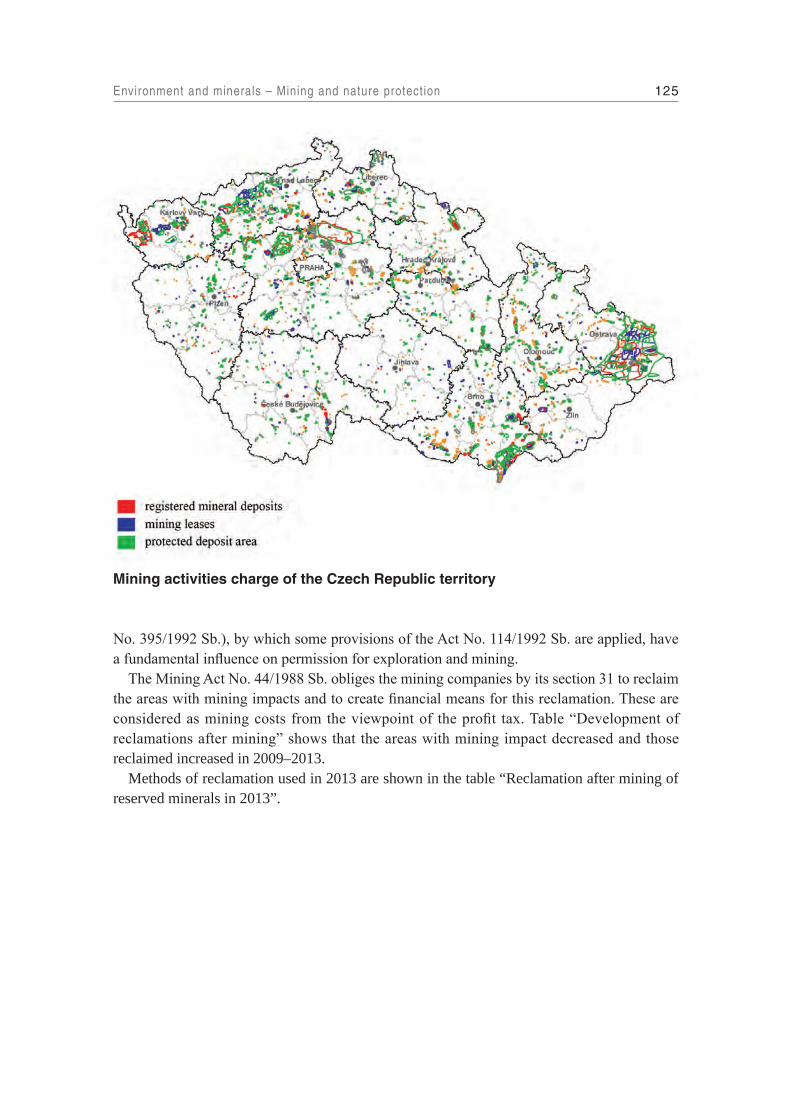
125Environment and minerals – Mining and nature protection
No. 395/1992 Sb.), by which some provisions of the Act No. 114/1992 Sb. are applied, have a fundamental influence on permission for exploration and mining.
The Mining Act No. 44/1988 Sb. obliges the mining companies by its section 31 to reclaim the areas with mining impacts and to create financial means for this reclamation. These are considered as mining costs from the viewpoint of the profit tax. Table “Development of reclamations after mining” shows that the areas with mining impact decreased and those reclaimed increased in 2009–2013.
Methods of reclamation used in 2013 are shown in the table “Reclamation after mining of reserved minerals in 2013”.
Mining activities charge of the Czech Republic territory
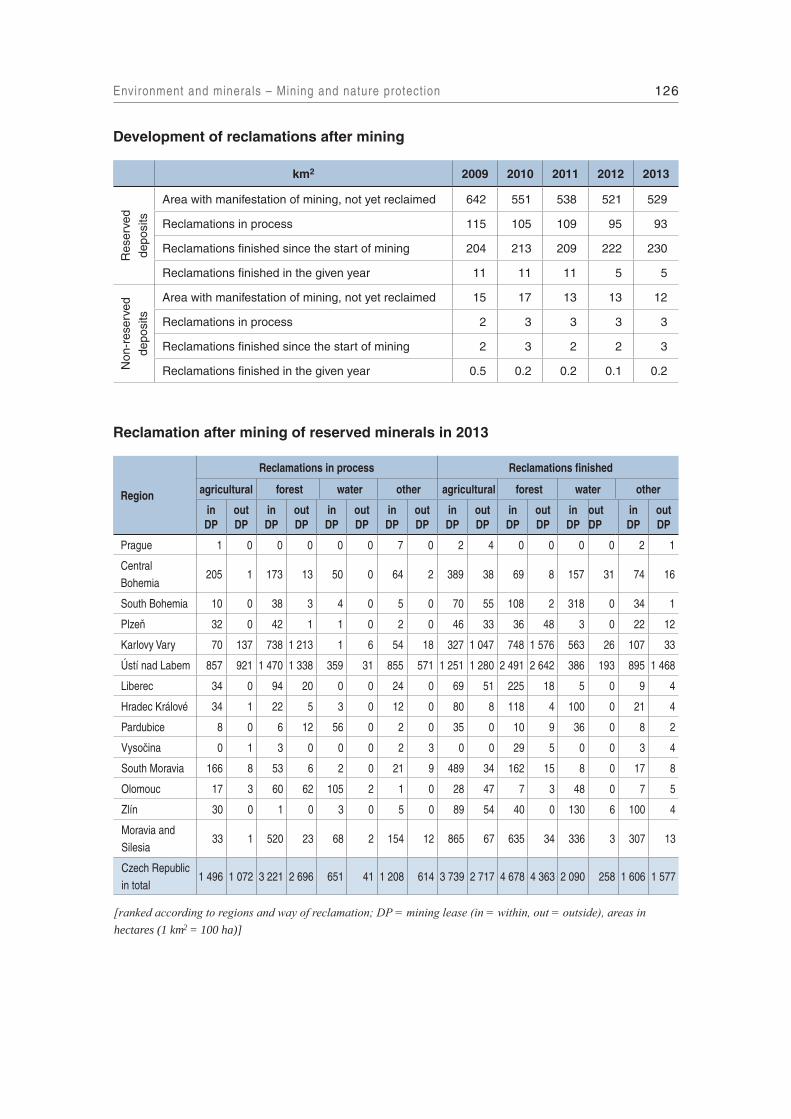
126Environment and minerals – Mining and nature protection
Development of reclamations after mining
km2 2009 2010 2011 2012 2013
Res
erve
d
depo
sits
Area with manifestation of mining, not yet reclaimed 642 551 538 521 529
Reclamations in process 115 105 109 95 93
Reclamations finished since the start of mining 204 213 209 222 230
Reclamations finished in the given year 11 11 11 5 5
Non
-res
erve
d
depo
sits
Area with manifestation of mining, not yet reclaimed 15 17 13 13 12
Reclamations in process 2 3 3 3 3
Reclamations finished since the start of mining 2 3 2 2 3
Reclamations finished in the given year 0.5 0.2 0.2 0.1 0.2
Reclamation after mining of reserved minerals in 2013
Region
Reclamations in process Reclamations finished
agricultural forest water other agricultural forest water other
in DP
out DP
in DP
out DP
inDP
out DP
in DP
out DP
in DP
out DP
in DP
out DP
in DP
out DP
in DP
out DP
Prague 1 0 0 0 0 0 7 0 2 4 0 0 0 0 2 1
Central Bohemia
205 1 173 13 50 0 64 2 389 38 69 8 157 31 74 16
South Bohemia 10 0 38 3 4 0 5 0 70 55 108 2 318 0 34 1
Plzeň 32 0 42 1 1 0 2 0 46 33 36 48 3 0 22 12
Karlovy Vary 70 137 738 1 213 1 6 54 18 327 1 047 748 1 576 563 26 107 33
Ústí nad Labem 857 921 1 470 1 338 359 31 855 571 1 251 1 280 2 491 2 642 386 193 895 1 468
Liberec 34 0 94 20 0 0 24 0 69 51 225 18 5 0 9 4
Hradec Králové 34 1 22 5 3 0 12 0 80 8 118 4 100 0 21 4
Pardubice 8 0 6 12 56 0 2 0 35 0 10 9 36 0 8 2
Vysočina 0 1 3 0 0 0 2 3 0 0 29 5 0 0 3 4
South Moravia 166 8 53 6 2 0 21 9 489 34 162 15 8 0 17 8
Olomouc 17 3 60 62 105 2 1 0 28 47 7 3 48 0 7 5
Zlín 30 0 1 0 3 0 5 0 89 54 40 0 130 6 100 4
Moravia and Silesia
33 1 520 23 68 2 154 12 865 67 635 34 336 3 307 13
Czech Republic in total
1 496 1 072 3 221 2 696 651 41 1 208 614 3 739 2 717 4 678 4 363 2 090 258 1 606 1 577
[ranked according to regions and way of reclamation; DP = mining lease (in = within, out = outside), areas in hectares (1 km2 = 100 ha)]

127Environment and minerals – Mining and nature protection
Mining influences the environment, changes the character of the landscape, and alters ecological conditions for flora and fauna. In some areas mining activities can last several human generations. This way the impact of mining persists and a more permanent new arrangement of natural conditions and relationships in its area is not quickly evident. The new arrangement can be equal to or even better than the original one, of course on a different level. Examples include artificial lakes formed e.g. in south Bohemia by sand and gravel mining, constructions and sport grounds in former quarries or specially protected nature areas proclaimed paradoxically in the territory of former quarries, and also 35 hectares of new vineyards planted as agricultural reclamation of a closed brown coal mine in the north of Bohemia in the Most wine region. They represent by their area almost 6.5 % of the total 550 hectares of productive vineyards of the Czech wine region.
In Bavaria, Germany, they studied the plant biodiversity in local quarries (S.Gilcher-U.Tränkle (2005): Steinbrüche und Gruben Bayerns und ihre Bedeutung für den Arten- und Biotopschutz.-Bayerischen Industrieverband Steine und Erden e.V.,München.). Of the 2 533 known plant species (of which 701 are endangered) in Bavaria in quarries whose combined area amounts to 0.006 % of Bavaria’s total area, they counted 1039 species (41 % of the total count), of which 87 species were endangered (12.4 % of all endangered plant species).
In Baden-Württemberg, Germany, (Schelkingen quarries – raw material for cement) an original research project was developed (Brodkom E.-Benett P.-Jans D. (editors)(2001): Good environmental practice in the European extractive industry. A reference guide.-Environnement, hors-série no 1, p. 35. Société de l’industrie minérale.Paris.). “This consisted of using cut grass to encourage vegetation growth by spreading it over the floor of a closed-down quarry. In order to protect germination, the grass counteracts high soil temperatures. The moisture of the soil is retained much longer, and the air humidity under the grass is higher. ... Corresponding

128Environment and minerals – Mining and nature protection
tests on the following substrates were carried out at the quarry: raw soil substrate (unchanged quarry site), mixed substrate (screen residue and excavated material), excavated material. ... With regard to effectiveness, it can be stated that 50 to 60 % of the species established on the areas from which the cut grass was taken were introduced and naturalised in an single mowing process. The costs incurred by such the process range between a minimum of 0.43 – 0.61 EUR/m2 (without site preparation) and a maximum of 1.36 – 1.87 EUR m2 (including distribution of substrate and further measures). In contrast to that, the costs occuring for recultivation for agricultural or forestry purposes, amount to between 1.02 – 3.07 EUR/m2.”
In 2009, participants in the workshop Obnova území narušených těžbou nerostných surovin (“Restoration of Mining-Impacted Land”) organized by the citizens association Calla-Association for Preservation of the Environment and by the Department of Botany of the Faculty of Science at the University of South Bohemia set down principles of eco-friendly restoration of mining-impacted land (J.Řehounek (2010): Přírodovědci formulovali zásady ekologické obnovy po těžbě./Naturalists formulate principles of post-mining ecological restoration.-Minerální suroviny/Surowce mineralne (magazine),1:32-33.Mining Union of the Czech Republic,Brno.):1. Prior to commencing mining, a qualified biological assessment not only of the mining area,
but also of its surroundings is essential. It would be beneficial if the actual mining were to be managed, if possible, in such a way so as to preserve (possibly maintain and expand) as many (semi) natural habitats in the immediate vicinity of the mine site or dumping ground. A roughly 100-metre zone in an area that can be accessed by most of the species is key for the subsequent colonization of the mining-impacted land during spontaneous succession.
2. Environmental impact assessments, biological assessments and reclamation plans, which concern the restoration of mining-impacted land and dumping grounds, should be prepared by experts, who are not only familiar with the current state of knowledge in the field of ecological restoration, but also with realistic possibilities and limits of mining technology. These problems should henceforth be included in the examinations for persons authorized to prepare environmental impact assessments pursuant to Act No. 100/2001 Coll. (EIA), and for persons certified in preparing biological assessments pursuant to § 67 of Act No. 114/1992 Coll. and in preparing assessments evaluating impacts on bird areas and on Special Areas of Conservation (SAC) pursuant to § 45i of said Act. Ongoing training in ecological restoration should be mandatory for these persons.
3. A basic restoration plan (e.g. in the form of a remediation and reclamation summary) should already be known when a mining lease (in the case of reserved deposits) is granted, or when a planning permit that designates the area for mining (in the case of non-reserved deposits) is granted, and should take into account the potential possibilities of the area. Room must be left to make any possible changes according to current conditions during the mine planning phase (plan of mine development work /POPD/ including detailed rehabilitation and reclamation plans, mining permits, etc.) and during the actual mining and completion phases.
4. It is essential to conduct another continuous assessment of the locality (a scheduled monitoring programme) already during the course of mining and after its termination, which may discover the presence of rare and endangered species and communities, as well as important geological and geomorphological phenomena. The restoration plan will have to be modified with respect to this assessment, which should be provided by the mining company via or under supervision of a qualified person.

129Environment and minerals – Mining and nature protection
5. Prior to, during and after mining, it is necessary to monitor invasive species at the mine site and in its surroundings. If their presence may possibly jeopardize the intended restoration method, then they must be removed by sanitation methods.
6. The great majority of mining-impacted land can restore itself spontaneously – via spontaneous succession, which may in some cases also be guided (directed, blocked or reversed). As a rule, at least 20 % of a large mine site’s total area should be left to spontaneous succession in the most bilogically valuable areas. Smaller mining sites and dumping grounds can usually be integrated into the landscape without problem, thus ecological succession may be implemented in their entire area.
7. If endangered and specially protected species and communities are highly dependent on the mine site environment, then their population and biotypes will have to be managed appropriately. This should be covered by mandatory funds generated by the mining company for reclamation, after its completion by public funds designated for landscape programmes.
8. The most valuable mine sites and dumping grounds should be declared specially protected areas (most often classified specifically as a nature monument) and managed accordingly, or declared temporary protected areas if only temporary protection is needed. Less valuable mine sites and dumping grounds left to eco-friendly restoration should almost always at least be registered as important landscape elements. Special attention should be paid to mine sites that may be incorporated into the territorial system of ecological stability.
9. Restoration of a mine site or dumping ground should primarily increase the observable landscape diversity. It is necessary to break up straight lines and surfaces (peripheries, shore lines, etc.) with uneven areas, at the very latest after termination of (or preferably during the course of) mining. Shallow shore areas are necessary at flooded mine sites.
10. Unsuitable pieces of equipment and waste should removed after mining is terminated, if the aim is to integrate a mine site or dumping ground into the environment.
11. The nutrient-rich top soil sections must be permanently removed from those parts of the mine site that are designated for eco-friendly restoration in the least amount of time. This already needs to be taken into account during the reclamation planning phase. As overburden is returned, so are excess nutrients, which mostly support the evolution of a few less abundant, agressive species, including invasive ones. Once mining commences it is therefore necessary to verify, in collaboration with protection of agricultural land resources authorities (hereinafter OZPF), if the overburden is being carefully and completely removed from areas designated for eco-friendly restoration. Otherwise it is necessary to modify the implementation of the reclamation plan, again however in collaboration with OZPF and mining authorities.
12. From an environmental protection perspective, phased mining and restoration works best at larger mine sites, specifically when spread out over a longer period so that abandoned areas of the mining area are gradually left to restoration. This procedure helps create more varied and higher-quality communities with regard to age and extent in restored areas.
13. It is beneficial to place permanent study areas designated for scientific research, testing of eco-friendly interventions and monitoring in all types of mining areas. These areas should be respected by the mining companies.
Conclusion of the workshop: Eco-friendly restoration of mining-impacted land is certainly not the only option of how to deal with the integration of these areas into the landscape. Our laws should however allow for this restoration method, which is common in many countries,

130Environment and minerals – Mining and nature protection
to become an equivalent alternative to the thus far predominant forest and agricultural reclamations.
In 2011, a final report on project VaV SP/2d1/141/07 “Rekultivace a management nepřírodních biotopů v České republice” (“Reclamation and Management of Non-Natural Biotypes in the Czech Republic”) was published for the entire duration of the project in 2007 – 2011 carried out by the Institute for Environmental Policy, Public Benefit Corporation, by the Institute of Geology of the Academy of Sciences of the Czech Republic, Public Research Institution, and by the Czech University of Life Sciences Prague. Its findings and recommendations state among other things:
“Areas impacted by mining and by some other human activities such as quarries, sand pits, mining sites of kaolin and brick clays, waste piles/dumps and large waste depots, are by far not really devastated, dead “lunar landscapes”. On the contrary, it is being demonstrated that, in terms of the protection of diverse biotypes, they are a very important refuge, where mushrooms and wild plants and animals are finding optimum living conditions, which they entirely lack in urbanized and industrial areas, and on land used intensively by agriculture. ...
It is absolutely vital that the relevant state administration authorities respond appropriately to the new scientific findings. In the next legislative session, they should in collaboration with experts prepare and put into practice appropriate changes to laws and executive regulations, which regulate mining and other related human activities, primarily remediation and reclamation. The following legal regulations must be amended:• Act No. 44/1988 Coll., on mineral protection and use (the Mining Act) – subsequently
amended• Regulation of the ČBÚ No. 172/1992 Coll., on mining leases in the wording of the Regulation
No. 351/2000 Coll.• Regulation of the ČBÚ No. 104/1988 Coll., on efficient use of reserved deposits, on permits
and notification of mining operations and other activities employing mining methods – subsequently amended
• Act No. 61/1988 Coll., on mining operations, explosives and the state mining – subsequently amended
• Act No. 334/1992 Coll. on protection of agricultural land resources – subsequently amended• Regulation of the MŽP ČR No. 13/1994 Coll., governing some details of agricultural land
resources protection – subsequently amended• Act No. 289/1995 Coll., on forests, modifying and amending certain acts (the Forest Act); • Regulation of the Ministry of Agriculture of the Czech Republic No. 77/1996 Coll., on
necessary elements of applications for dispossession or curtailment of rights, and on details of protection of lands devoted to forest function performance – subsequently amended
• Act No. 114/1992 Coll., on nature and landscape protection – subsequently amendedThese unavoidable changes should eliminate evident discrepancies and deficiences in the
legislation concerning the areas in question and harmonize legal regulations, so that ecological and economic highly effective nature-friendly methods of restoration based on natural or directed ecological succession may be used to a greater extent. ...”

131Environment and minerals – Mining and nature protection
Share of specially Protected Areas of the Czech Republic nature (zvláště chráněná území přírody České republiky (ZCHÚs)) established in localities with former mining (“after mining”) in all the ZCHÚs (compiled after data of the Agency for Nature Conservation and Landscape Protection of the Czech Republic – AOPK ČR in 2014)
Region
Nu
mb
er o
f Z
CH
Ús
(wit
ho
ut
CH
KO
s)
Are
a o
f Z
CH
Ús
(wit
ho
ut
CH
KO
s)
(ha)
Nu
mb
er o
f Z
CH
Ús
“a
fter
min
ing
”
Are
a o
f Z
CH
Ús
(wit
ho
ut
CH
KO
s)
“aft
er m
inin
g”
(ha)
Sh
are
of
ZC
HÚ
are
as
“aft
er m
inin
g”
in t
he
all Z
CH
Ús
area
Sh
are
of
ZC
HÚ
nu
mb
er
“aft
er m
inin
g”
in t
he
all Z
CH
Ús
nu
mb
er
Sh
are
of
ZC
HÚ
are
as “
afte
r m
inin
g”
in t
he
all Z
CH
Ús
area
in
th
e C
zech
Rep
ub
lic
Sh
are
of
ZC
HÚ
nu
mb
er “
afte
r m
inin
g”
in t
he
all Z
CH
Ús
nu
mb
er
in t
he
Cze
ch R
epu
blic
Central Bohemia 254 12 042 41 817.99 6.79% 16.14% 0.80% 1.69%
Prague 91 2 344 36 714.04 30.46 39.56% 0.70% 1.48%
Karlovy Vary 69 4 056 6 33.03 0.81% 8.70% 0.03% 0.25%
Olomouc 152 7 353 20 195.88 2.67% 13.16% 0.20% 0.82%
South Moravia 301 8 608 23 343.00 3.98% 7.64% 0.34% 0.95%
Pardubice 101 5 260 5 116.84 2.22% 4.95% 0.12% 0.21%
Plzeň 194 10 989 17 148.09 1.35% 8.76% 0.15% 0.70%
Zlín 177 2 139 6 23.72 1.11% 3.39% 0.02% 0.25%
Moravia and
Silesia162 8 262 17 264.81 3.21% 10.49% 0.26% 0.70%
Liberec 124 5 584 6 244.38 4.38% 4.84% 0.24% 0.25%
Vysočina 188 5 684 4 29.25 0.51% 2.13% 0.30% 0.16%
Ústí nad Labem 160 6 423 12 327.79 5.11% 7.50% 0.32% 0.25%
Hradec Králové 131 7 138 6 17.10 0.24% 4.58% 0.02% 0.25%
South Bohemia 327 15 265 18 247.24 1.62% 5.50% 0.24% 0.75%
Czech Republic total
2 431 101 147 217 3 523.16 3.48% 8.93% 3.48% 8.93%

132Environment and minerals – Eliminating negative consequences of mining
Eliminating negative consequences of mining in the Czech Republic – main methods and financial resources
Vít Kaštovský Ministry of Industry and Trade of the Czech Republic
IntroductionThe process of restructuring coal and ore mining, and of eliminating negative environmental consequences of mining in the landscape and erasing these consequences in affected areas of the Czech Republic, is executed in several ways and with various financial resources. It specifically involves:1. Use of funds from a financial reserve generated by mining companies for remediation,
reclamation and mining damages 2. Use of funds from annual royalties paid by mining companies on mining leases and on
extracted reserved minerals pursuant to the Mining Act 3. Phase-out programme of mining activities and erasing consequences of coal, ore and
uranium mining funded by the national sources via the Ministry of Industry and Trade 4. Use of proceeds from privatisation of state assets in eliminating old ecological burdens
caused by mining, existing prior to privatisation of mining companies 5. A programme which deals with ecological damage caused prior to privatisation of brown coal
mining companies in the Ústí nad Labem Region and Karlovy Vary Region, with ecological revitalisation upon termination of mining operations in the Moravian-Silesian Region, with eliminating ecological burdens caused by the exploration for and extraction of crude oil and natural gas in designated areas of the South Moravian Region, and with reducing the impacts caused by the termination of coal mining in the Kladno Region based on Government resolutions in 2002. Funds are provided by proceeds from privatisation of national assets.
6. Sources of European Union – Operational Programme Environment (administered by the Ministry of Industry and Trade)
1. Use of funds from a financial reserve generated by mining companies for remediation, reclamation and mining damages
Financial reserve for remediation and reclamationThe most important source for funding the elimination of the consequences of mining operations in the Czech Republic is the financial reserve for remediation and reclamation, generated by mining companies during the exploitation of reserved mineral deposits.
An amendment of Mining Act No. 541/1991 Coll., under article 31 section 6, imposes on the mining company to generate a financial reserve in order to meet the obligation established under article 31 section 5 of the Mining Act, thus guaranteeing the remediation and reclamation of all plots of land affected by mining (hereinafter “reserves”). The reserves are part of the company’s expenses. Pursuant to article 32 section 2 of the Mining Act, the determination of anticipated expenses for remediation and reclamation is part of the plan for opening, preparation and exploitation of reserved deposits (hereinafter “POPD”), and the POPD must

133Environment and minerals – Eliminating negative consequences of mining
also contain a proposal regarding the amount of, and the method for, generating the required financial reserve. However, the anticipated amount of financial costs for remediation and reclamation must for the first time already be included, pursuant to the provision under article 2, section 3, letter k) item 4 of Decree No. 172/1992 Coll., as amended, in the application for the grant of a mining lease. An interim provision of Act No. 541/1991 Coll. established that the required reserve amount should be provided in 10 years (i.e. by 20 December 2001) in the case of existing mines. In a subsequent amendment of the Mining Act by Act No. 168/1993 Coll., the time period for generating the reserve was changed to last for the duration of the economic life of the mine, quarry or their sections. However, that did not apply to companies with an announced or approved phase-out programme (ores, coal).
According to the provision under article 37a section 2 of the Mining Act, the generating of reserves is subject to approval by Regional Mining Authorities (OBÚ). Upon the request of a company, these also permit the drawing on funds from the generated reserve upon agreement with the Ministry of the Environment and upon notification by the relevant municipality. In the case of public enterprises, the OBÚ makes a decision regarding the drawing on the reserve upon agreement with the Ministry of Industry and Trade.
Generated and drawn reserves for remediation and reclamation (in CZK thousand)
YearBituminous coal Brown coal
Crude oil and natural gas
OresIndustrial minerals
Radioactive minerals
Total
gene-rated
drawn gene-rated
drawn gene-rated
drawn gene-rated
drawn gene-rated
drawn gene-rated
drawn gene-rated
drawn
1993 118 500 0 1 341 769 65 615 12 722 0 0 0 97 438 8 236 0 0 1 570 429 73 851
1994 123 750 18 600 573 242 259 929 6 836 0 0 0 255 155 30 335 0 0 958 983 308 864
1995 85 895 136 064 3 845 935 265 856 22 414 370 0 0 276 724 24 230 0 0 4 230 968 426 520
1996 143 500 97 993 1 436 957 831 817 25 811 113 0 0 270 432 31 829 0 0 1 876 700 961 752
1997 108 000 42 108 1 302 735 1 087 993 62 618 5 569 0 0 484 420 53 262 0 0 1 957 773 1 188 932
1998 51 594 48 033 1 226 036 994 133 22 112 9 541 0 0 466 649 59 913 0 0 1 766 391 1 111 620
1999 132 143 56 236 1 199 633 704 199 26 181 7 473 0 0 318 852 141 530 0 0 1 676 809 909 438
2000 42 747 52 029 1 119 474 683 179 23 487 600 0 0 307 433 140 225 0 0 1 493 141 876 033
2001 876 194 77 458 1 267 431 678 515 23 184 2 750 390 0 215 379 53 893 0 0 2 382 578 812 616
2002 887 250 129 600 1 007 561 653 557 100 250 0 0 157 721 50 604 0 0 2 001 946 822 491
2003 1 800 498 5 199 919 4 844 371 11 782 1 050 0 0 179 763 57 848 0 0 5 393 264 4 903 767
2004 65 002 54 162 1 031 828 720 168 4 770 0 0 0 160 102 73 177 0 0 1 261 702 847 507
2005 66 504 54 204 964 222 547 883 17 524 9 409 0 0 228 713 113 743 0 0 1 254 884 766 460
2006 74 178 113 691 845 008 663 055 17 893 3 300 0 0 144 665 92 489 0 0 1 081 744 872 535
2007 32 696 88 462 718 820 240 060 25 417 17 259 0 0 127 413 82 329 0 0 904 346 428 110
2008 17 660 66 941 626 649 330 397 24 828 16 372 0 0 233 615 99 610 0 0 1 008 637 513 320
2009 21 780 69 711 650 696 394 528 15 454 1 324 0 0 177 681 77 290 0 0 955 897 542 853
2010 22 800 147 848 298 205 133 171 16 302 461 0 0 96 207 94 517 0 0 433 515 375 997
2011 22 500 170 958 625 011 491 068 22 336 986 0 0 82 252 87 681 0 0 752 099 750 693
2012 22 500 141 432 632 601 364 264 9 871 1 693 0 0 96 263 91 721 0 0 761 235 599 110
2013 15 000 240 951 648 019 325 791 13 530 2 044 0 0 86 121 57 478 0 0 762 670 626 254

134Environment and minerals – Eliminating negative consequences of mining
Financial reserve for mining damagesPursuant to article 37a section 1 of the Mining Act, a mining company is obliged to generate a financial reserve to ensure settlement of mining damages. The reserve amount generated and charged to expenses must correspond to the needs for settling mining damages in the course of time depending on their creation, or prior to their creation (article 37 section 4).
Generating of reserves is subject to approval by the relevant Regional Mining Authority, which also approves the drawing on these reserves upon agreement with the Ministry of the
The issues mentioned are further regulated by FMF (Federal Ministry of Finance) Measure No. ref. V/20 100/1992 Coll., on the chart of accounts and on accounting procedures, which lays down the rules regarding the generating and use of financial reserves by companies with permitted mining operations. At the end of each accounting period, companies execute closings of books and carry out document inventories, which verify the balancing of books (Act No. 593/1992 Coll. and No. 563/1991 Coll.).
The last update of the legal regulation of reserves for remediation, reclamation as well as mining damage occurred after Act No. 223/2006 Coll. (amendement of the Reserves Act) and No. 313/2006 Coll. (amendment of the Mining Act) went into effect.
Generated and drawn reserves for mining damages (in CZK thousand)
YearBituminous coal Brown coal
Crude oil and natural gas
OresIndustrial minerals
Radioactive minerals
Total
gene-rated
drawngene-rated
drawngene-rated
drawngene-rated
drawngene-rated
drawngene-rated
drawngene-rated
drawn
1993 400 721 4 093 150 548 42 957 0 0 0 0 28 462 0 0 0 579 731 47 050
1994 105 650 38 813 50 000 32 223 0 0 0 0 9 328 28 852 0 0 164 978 99 888
1995 204 785 86 001 209 207 37 748 0 0 0 0 10 673 9 394 0 0 424 665 133 143
1996 151 643 74 952 259 779 84 258 0 0 0 0 13 100 3 407 0 0 424 522 162 617
1997 77 900 142 512 318 981 127 715 0 0 0 0 5 733 683 0 0 402 614 270 910
1998 185 723 174 640 252 920 112 852 0 0 0 0 16 043 3 638 0 0 457 686 291 130
1999 111 588 174 640 212 722 40 448 0 0 0 0 10 803 6 844 0 0 335 113 221 932
2000 110 088 107 852 240 655 188 685 0 0 0 0 11 414 1 020 0 0 362 157 297 557
2001 145 750 188 073 105 513 217 306 192 0 100 0 35 877 6 628 0 0 286 872 412 007
2002 102 750 168 531 102 700 510 200 0 0 0 0 2 327 2 338 0 0 207 777 681 069
2003 0 0 816 197 999 271 90 0 0 0 12 576 2 263 0 0 828 863 1 001 534
2004 187 700 139 714 164 700 315 321 0 0 0 0 3 007 4 560 0 0 355 407 459 595
2005 191 700 143 974 97 433 279 955 0 0 0 0 6 597 4 273 0 0 295 730 428 202
2006 285 780 251 941 522 908 1 334 150 0 0 0 4 517 6 846 0 0 813 355 260 121
2007 260 850 190 982 193 147 932 392 30 0 0 0 4 298 3 831 0 0 458 325 1 127 205
2008 304 700 308 593 64 601 155 924 0 0 0 0 3 739 2 788 0 0 373 040 467 305
2009 317 625 282 928 30 200 25 800 0 0 0 0 3 447 1 216 0 0 351 272 309 944
2010 283 008 173 686 25 034 15 730 100 0 0 0 2 644 1 514 0 0 310 786 190 930
2011 468 508 196 012 25 663 25 248 100 0 0 0 2 695 2 595 0 0 496 966 223 855
2012 811 202 741 987 30 000 5 818 100 0 0 0 6 157 3 325 0 0 847 459 751 130
2013 145 000 131963 30 000 0 0 0 0 0 3 378 2 724 0 0 178 378 134 686

135Environment and minerals – Eliminating negative consequences of mining
Environment. Prior to making a decision on the drawing on theses reserves, the Regional Mining Authority requests a statement from the relevant municipality. In the case of public enterprises, the OBÚ decides in agreement with the Ministry of Industry and Trade.
A company’s request to draw on the financial reserve for mining damages must be furnished with a list of mining damages, an expense estimate for their elimination and a time table of resource expenses for the elimination of mining damages.
2. Use of funds from annual royalties paid by mining companies on mining leases and on extracted reserved minerals pursuant to the Mining Act
Royalties on mining leasesAct No. 44/1988 Coll., on the protection and use of the mineral resources (the Mining Act), imposes an obligation on mining companies, under sect. 32a) par. 1, to pay to the account of the relevant Regional Mining Authority an annual royalties, on the mining lease. The amount of royalties on the mining lease is set at CZK 100 to CZK 1 000 per hectare, and graded with
Royalties from mining lease areas paid out to municipalities pursuant to article 32a) sect. 1 of the Mining Act (in CZK thousand)
Year Number of municipalities Total
1993 1 327 25 929
1994 1 194 22 752
1995 1 168 24 114
1996 1 225 24 032
1997 1 191 23 446
1998 1 269 22 885
1999 1 208 23 629
2000 1 178 23 780
2001 1 171 23 728
2002 1 168 22 899
2003 1 158 21 740
2004 1 161 21 511
2005 1 138 21 077
2006 1 127 16 178
2007 1 118 15 512
2008 1 305 15 127
2009 1 239 14 925
2010 938 14 032
2011 885 13 888
2012 939 13 809
2013 918 13 800
Total 418 793

136Environment and minerals – Eliminating negative consequences of mining
Royalties on extracted reserved mineralsThe royalties on extracted minerals established under article 32a) section 2 of Act No. 541/1991 Coll., amounts to 10 % of the market price of extracted minerals at the most and, under section 4, from the royalties yield, pursuant to section 2, the Regional Mining Authority transfers 50 % to the state budget of the Czech Republic and 50 % to the budget of the municipality in whose territory the mining lease is situated. If the mining lease is located in the territory of several municipalities, the Regional Mining Authority distributes the revenue according to the share in mining, similarly to the royalties on a mining lease.
Amendment No. 10/1993 Coll. of the Mining Act established that 50 % of the royalties transferred to the state budget will be used for the purpose of remediation of environmental damage caused by the mining of reserved deposits.
In 2000 a change occurred and article 32a), section 4 of Act No. 366/2000 Coll. established that, of the royalties pursuant to section 2, the Regional Mining Authority shall transfer only 25 % to the state budget of the Czech Republic, from which these funds will be used for the purpose of remediating environmental damage caused by the mining of reserved as well as non-reserved deposits, and that the Regional Mining Authority shall transfer the remaining 75 % to the municipality’s budget. Simultaneously, Government Resolution No. 906/2001 and, again, Government Resolution No. 69/2008 approved to divide the 25% of royalties transferred to the state budget into 12.5 % for use by the Ministry of Industry and Trade in remediation of environmental damage caused by the mining of reserved as well as non-reserved deposits, and into 12.5 % for use by the Ministry of the Environment in liquidation of old mine workings.
At the same time, Government Resolution No. 69/2008 approved the transfer of the yield from royalties on extracted minerals pursuant to sect. 32a par. 4 of Act No. 44/1988 Coll., on the protection and use of mineral resources (Mining Act), as amended, via Regional Mining Authorities directly to the income accounts of the budget of the Ministry of Industry and Trade and the Ministry of the Environment starting in 2008.
The table above clearly shows the payment and use of funds for the 1993–2013 period. In 21 years mining companies paid a total of CZK 11.3 billion., of which municipalities received cca CZK 6.5 billion, and Regional Mining Authorities transferred to the state budget a total of CZK 3.8 billion for remediation of environmental damage caused by the mining of reserved as well as non-reserved minerals, which was subsequently released from the state budget and of which cca CZK 2.9 billion went to the Ministry of Industry and Trade and cca CZK 0.9 billion to the Ministry of the Environment.
respect to the environmental protection level of the relevant area, the type of activity conducted in the mining lease and its environmental impact.
The ultimate recipient of the mining lease royalties are the municipalities, in whose territory the mining lease is located. These resources are used, in large measure, as compensation for negative impacts of mining on the municipalities in question. As shown in the following table, a total of CZK cca 419 million was paid out to municipalities in 1993–2013 since the inception of royalties payments on mining leases.

137Environment and minerals – Eliminating negative consequences of mining
Distribution of royalties on extracted reserved minerals pursuant to sect. 32a) par. 4 of the Mining Act (in CZK thousand)
Year50 %
SR (State budget)
50 %Municipalities
Total
1993 230 400 230 526 460 926
1994 245 762 245 276 491 038
1995 221 909 221 566 443 475
1996 229 703 229 703 459 406
1997 228 874 228 874 457 748
1998 220 885 220 886 441 771
1999 219 938 219 938 439 876
2000 227 778 227 859 455 637
Total 1 825 249 1 824 628 3 649 877
12.5 % MPO (Ministry of Industry and Trade)
12.5 % MŽP (Ministry of the Environment)
75 % Municipalities
Total
2001 153 166 12 500 302 221 467 887
2002 55 000 59 500 356 724 471 224
2003 61 713 61 800 371 827 495 340
2004 70 000 69 500 393 695 533 195
2005 76 398 76 700 449 135 602 233
2006 76 305 76 400 455 947 608 652
2007 82 716 82 300 494 737 659 753
2008 84 367 84 250 505 782 674 399
2009 80 720 80 720 484 556 645 996
2010 73 023 73 023 435 103 581 149
2011 80 714 80 714 484 284 645 712
2012 78 711 78 711 472 266 629 688
2013 74 554 74 554 447 323 596 430
Total 2001–2013 1 047 387 910 672 5 653 600 7 074 871
Total 1993–2013 2 872 636 910 672 6 478 228 11 261 535
3. Phase-out programme of mining activities and erasing consequences of coal, ore and uranium mining funded by the national sources
The restructuring of industry in the Czech Republic, specifically of metallurgy and engineering, initiated after 1989, had an immediate impact on the mining sector . Uneconomic ore, coal and uranium mining, and a lower raw material demand were the decisive reasons for the restructuring and subsequent privatisation of mining companies . Part of the restructuring of

138Environment and minerals – Eliminating negative consequences of mining
the mining industry was the announcement of a phase-out of mining activities in uneconomic underground mines and quarries.
The essential method of funding the restructuring of the mining sector is provided by subsidies from the state budget, in accordance with relevant Government resolutions, for the phase-out and to erase the consequences of mining operations.
In the initial phase, the phase-out in individual branches of mining occurred independently, mainly because mining companies reported to various departments.
The phase-out of uranium mining was already decided upon in 1989, as based on documents processed by the Federal Ministry of Fuel and Energy, which was approved by ČSSR (Czechoslovak Socialist Republic) Cabinet Resolution No. 94/1989 on the concept of lowering the unprofitability of uranium mining in the ČSSR in 1990, in the 9th and 10th five-year plans by phasing it out. This Cabinet resolution from 1990 was subsequently amended by the Government of the ČSFR (Czechoslovak Federal Republic) with new Government Resolution No. 894/1990 regarding the modification of the phase-out concept for uranium mining in the ČSFR.
In 1990, ore mining was integrated into the Federal Ministry of Metallurgy, Engineering and Electric Engineering which, for the purpose of dealing with ore mining and the announcement of a phase-out programme for the ore mining industry as of 1 July 1990, processed documents for Government proceedings and Government Resolution No. 440/1990 was adopted.
The phase-out of coal mining was announced at the end of 1992 based on Government Resolution No. 691/1992 concerning the programme for restructuring the coal industry, and documents for Government proceedings were processed by the Ministry of Industry and Trade.
Even though the phase-out of ore mining was not completed, a merger of Rudné doly Příbram state enterprise with DIAMO state enterprise occurred as of 1 January 2001, thereby ending the industry-by-industry monitoring of the phase-out, i.e. ore and uranium mining.
Another modification of the reporting method concerning the drawing on state budget funds occurred in 2003, when, in addition to the proposed state participation in the completion of the

139Environment and minerals – Eliminating negative consequences of mining
restructuring of coal mining, Government Resolution No. 395/2003 authorised the transfer of the Barbora locality from OKD, a. s. company to DIAMO state enterprise, and the localities of Ležáky, Kohinoor and of Kladenské doly to Palivový kombinát Ústí state enterprise.
Since the initiation of the phase-out of mining in 1992, a total of cca CZK 86.4 billion was released from the state budget for the phase-out of mining and to erase the consequences of mining. As shown in the table above, cca CZK 53.1 billion were spent on technical work related to the phase-out of mining and on erasing the consequences of mining operations, and cca CZK 33.4 billion on social health benefits for miners.
Use of national sources subsidies for the phase-out of mining and to erase consequences of mining and mandatory social health expenses (in CZK million)
YearMining in total Coal mining Ore mining Uranium mining
TÚ MSZN Total TÚ MSZN Total TÚ MSZN Total TÚ MSZN Total
1993 2 555.1 1 436.3 3 991.4 1 816.1 949.7 2 765.8 43.2 189.0 232.2 695.8 297.6 993.4
1994 3 940.1 1 528.0 5 468.1 2 333.4 1 011.7 3 345.1 35.1 179.6 214.7 1 571.5 336.7 1 908.2
1995 3 861.1 1 678.1 5 539.2 1 956.8 1 329.9 3 286.7 198.8 36.4 235.2 1 759.3 346.4 2 105.7
1996 3 755.5 1 823.2 5 578.7 2 168.3 1 422.7 3,591,0 126.7 33 159.7 1 486.9 367.0 1 853.9
1997 2 305.9 1 811.1 4 117.0 1 364.6 1 362.8 2 727.4 100.1 34.9 135.0 836.6 413.4 1 250.0
1998 2 571.7 1 862.9 4 434.6 1 690.2 1 403.7 3 093.9 94.8 30.2 125.0 979.7 422.9 1 402.6
1999 2 073.5 1 955.8 4 029.3 1 206.1 1 475.9 2 682.0 79.2 37.6 116.8 787.9 442.2 1 230.1
2000 2 064.2 1 986.1 4 050.3 1 193.8 1 475.2 2 669.0 158.0 30.2 188.2 712.3 474.9 1 187.2
2001 2 296.2 1 955.6 4 251.8 1 118.4 1 451.0 2 569.4 part of uranium
mining
1 174.6 500.4 1 675.0
2002 1 729.9 1 913.8 3 643.7 574.9 1 359.2 1 934.1 1 154.8 553.3 1 708.1
2003 2 148.5 1 751.1 3 899.6 654.4 1 294.2 1 948.6 1 494.1 455.5 1 949.6
2004 2 576.1 1 713.2 4 289.3
With the merger of s. p. Rudné doly Příbram with s. p. DIAMO and the takeover of phased out areas of OKD, a. s.,
monitoring on an industry-by-industry basis was terminated
2005 2 110.3 1 669.1 3 779.4
2006 2 069.8 1609.3 3 679.1
2007 1 917.9 1 574.1 3 492.0
2008 1 971.9 1 465.7 3 437.6
2009 2 027.4 1 383.5 3 410.9
2010 2 281.0 1 257.6 3 538.6
2011 2 557.1 1 149.6 3 706.7
2012 2 717.8 979.4 3 697.2
2013 2 428.0 855.9 3 283.9
Total 53 059.3 33 359.4 86 418.7 16 632.7 14 536.0 31 168.7 1 083.9 570.9 1 654.8 12 950.1 4 610.3 17 560.4
TÚ – technical work related to phase-out and erasing consequences of mining operationsMSZN – mandatory social health expenses

140Environment and minerals – Eliminating negative consequences of mining
4. Use of proceeds from privatisation of state assets in eliminating old ecological burdens originated prior to privatisation of mining companies
Based on a decision by the Czech Republic Government, the former National Property Fund of the Czech Republic (as of 1 January 2006 the Ministry of Finance, based on Act No. 179/2005 Coll.) pledged, by virtue of “ecological contracts” entered into with particular individual assignees of assets from privatisation, to eliminate, with its privatisation proceeds, old ecological burdens created prior to privatisation.
The procedures and process principles for implementing measures leading to remediation of old ecological burdens created prior to privatisation are established in accordance with Government Resolution No. 51 from 10 January 2001.
The process adheres primarily to the following Acts and Resolutions of the Czech Republic Government:a) Act No. 92/1991 Coll., on the terms and conditions regarding the transfer of state assets to
other persons, as amended; b) Act. No. 178/2005 Coll., on the National Property Fund of the Czech Republic liquidation
and on on the responsibility of Ministry of Finance during privatisation Czech Republic assets (Act on the National Property Fund liquidation), as amended;
c) Act No. 179/2005 Coll., which amends some laws in connection with adopting the Act on the National Property Fund liquidation
d) Government Resolution No. 51 from 10 January 2001, which contains the appendix entitled Principles for Settlement of Ecological Obligations Arising during Privatisation (hereinafter Principles), as amended;
e) Government Resolution No. 565/2006 on Principles during completion of privatisation pursuant Act No. 92/1991 Coll., on the terms and conditions regarding the transfer of state assets to other persons and Act No. 178/2005 Coll., on the National Property Fund of the Czech Republic liquidation and on on the responsibility of Ministry of Finance during pri-vatisation Czech Republic assets, as amended;
f) Act No. 137/2006 Coll., on public contracts, as amended.The processing of the programme is always provided by the Ministry of Finance. The
Ministry of the Environment provides guaranteed expertise in the process and issues binding
Overview of entities with which “ecological contracts” were entered into, including guaranteed financial sums and their actual amount drawn (in CZK) – as of 31. 8. 2014
Name of mining companyAmount of guarantee
Drawn from guarantee
Amount available for drawing
DIAMO, státní podnik 4 200 000 000 2 599 133 765.21 1 600 866 234.79
DIAMO, státní podnik 3 797 000 000 3 787 286 690.79 9 713 309.21
DIAMO, státní podnik 32 000 000 000 3 769 027 000.00 28 230 973 000.00
OKK Koksovny, a.s. 27 800 000 000 2 649 542 078.45 25 150 457 921.55
Sokolovská uhelná, právní
nástupce, a.s.214 000 000 144 836 971.71 69 163 028.29
Severočeské doly, a.s. 172 265 000 4 812 509.37 167 452 490.63

141Environment and minerals – Eliminating negative consequences of mining
opinions on individual process steps. Mutual collaboration of both authorities in this process is regulated by the “Rules for Mutual Collaboration of the Ministry of the Environment and the Ministry of Finance in the Awarding of ‘Ecological Contracts’ to Eliminate Old Ecological Damage”.
The elimination of old ecological damage created prior to privatisation proceeds for the most part according to priorities established by the MŽP ČR (Ministry of the Environment).
5. A programme dealing with ecological damage caused prior to privatisation of brown coal mining companies in the Ústí nad Labem Region and the Karlovy Vary Region, with ecological revitalisation upon termination of mining in the Moravian-Silesian Region, with eliminating ecological burdens caused by the exploration for and extraction of crude oil and natural gas in designated areas of the South Moravian Region, and with reducing impacts caused by the termination of coal mining in the Kladno Region based on Government resolutions in 2002 and 2008. Funds are provided by proceeds from privatisation of state assets.
After the privatisation of mining companies, the financial settlement of related ecological damage was not resolved in an appropriate manner, within the scope of privatisation projects. However within the scope of privatisation, companies took over not only mining localities but also extensive areas from the state, which were designated for revitalisation and for which a required financial reserve was not generated in the past.
Mining companies are only obliged to generate a financial reserve for remediation and reclamation of areas affected by mining since 1994, and that on the basis of Amendment (No. 168/1993 Coll.) of the Mining Act.
In 2002, the Czech Republic Government being aware of this fact began to intervene financially in the ecological and partially economic revitalisation of regions with active or terminated mining operations. The goal was to eliminate environmental damage caused by mining operations prior to implemented legal regulation.
For this purpose it earmarked, from the proceeds from sale of assets designated for privatisation and from the profits of public enterprises, CZK 15 billion to deal with ecological damage created prior to privatisation of brown coal mining companies in the Ústí nad Labem Region and Karlovy Vary Region, CZK 20 billion to deal with ecological damage caused by mineral mining, primarly underground mining of bituminous coal in the Moravia and Silesia Region, CZK 1 billion to eliminate ecological burdens caused by the exploration for and extraction of crude oil and natural gas in the South Moravian Region, and CZK 1.177 billion to deal with reducing the impacts caused by the termination of coal mining in the Kladno Region.
The funds from the proceeds from privatisation are released in accordance with Government decisions to cover the expenses of eliminating environmental damage caused by present operations of mining companies, to cover the expenses of and support investment and non-investment activities connected with the remediation of environmental damage caused by mineral mining and to revitalise affected areas, and for financial support of development projects in areas designated for industrial use approved by the Government.

142Environment and minerals – Eliminating negative consequences of mining
Dealing with ecological damage created prior to privatisation of brown coal mining companies in the Ústí nad Labem Region and the Karlovy Vary RegionFor more than 150 years, the character of the landscape was affected significantly by intensive opencast and underground mining of brown coal in the Krušné Hory Mts. piedmont area of Northwest Bohemia. Undergroung mining primarily affected the territory with the deepest seams (up to 450m below the surface) in the central, Most-Bílina area of the basin as well as the Teplice area of the North Bohemian Basin. Opencast mining occurred primarily in areas of coal seam outcrops southwest of Chomutov, west and east of the City of Most, north of the City of Bílina, northwest of the City of Teplice, southwest and north of the City of Ústí nad Labem.
In 2002, the then National Property Fund of the Czech Republic was bound by resolutions of the Czech Republic Government to eliminate ecological damage caused by the activities of coal mining companies in the Ústí nad Labem Region and the Karlovy Vary Region, and to revitalise affected areas. The process was initiated that same year.
In accordance with a relevant resolution of the Czech Republic Government, the process dealing with ecological damage created prior to privatisation of brown coal mining companies in the Ústí nad Labem Region and the Karlovy Vary Region includes both of the Krušné hory Mts Basin situated in the territory of the Districts of Sokolov, Chomutov, Most, Teplice and of Ústí nad Labem, i.e. the Sokolov Basin and the North Bohemian Basin, or the mining leases of Sokolovská uhelná, a.s., Severočeské doly, a.s., Mostecká uhelná společnost, a.s. (currently mining companies Severní energetická, a.s. and Vršanská uhelná, a.s.), Kohinoor, a.s., and Palivový kombinát Ústí, s. p.
The programme mentioned specifies a group of projects aimed primarily at creating and renewing: – forest stands,– agricultural land,– bodies of water,– landscape vegetation,– biocorridors and biocentres,– areas for recreation,– areas designated for ecology and natural science,– building sites.
As of 31 December 2013, the funds actually spent on 213 concluded projects amounted to CZK 8.161 billion, and on 57 projects in progress they amounted to CZK 3.917 billion as of the specified date. The remaining financial amount required to secure additional money for the projects in progress amounts to about CZK 1.207 billion according to contracts.
List of companies included in the programme plan:Sokolovská uhelná, legal successor, a.s. (SU)Severočeské doly, a.s. (SD)Mostecká uhelná společnost, a.s. (MUS), currently mining companies Severní energetická,
a. s. a Vršanská uhelná, a. s.Palivový kombinát Ústí, s.p. based in Hrbovice (PKÚ)
List of regions (projects of cities and municipalities) included in the programme plan:Karlovy Vary Region – KKÚstí nad Labem Region – ÚK

143Environment and minerals – Eliminating negative consequences of mining
Projects concluded and projects in progress (in CZK)
CoalCompanies
Projects concluded Projects in progress
Number of projects
Project costsNumber of
projectsProject prices
Amount drawn as of 31 Dec 2012
SU 8 1 334 225 740 18 1 886 682 440 1 693 826 130
SD 26 2 043 995 476 1 28 885 604 5 124 237
MUS 39 530 874 652 17 1 453 240 535 1 106 773 600
PKÚ 38 2 560 771 577 6 566 512 726 488 673 765
Total 1 111 6 469 867 445 42 3 935 321 305 3 294 397 732
MunicipalitiesTotal
Projects concluded Projects in progress
Number of projects
Project costsNumber of
projectsProject prices
Amount drawn as of 31 Dec 2012
KK 31 516 729 928 6 543 962 233 269 881 929
ÚK 71 1 173 987 678 8 645 104 842 352 574 442
Total 2 102 1 1 690 717 606 14 1 189 067 075 622 456 371
Total 1 + 2 213 8 160 585 051 57 5 124 388 380 3 916 854 103
Revitalisation of the Moravian-Silesian and South Moravian RegionCurrently, the revitalisation of the Moravian-Silesian Region is aimed primarily at eliminating the consequences of ecological burden caused by bituminous coal mining and, in the South Bohemian Region, at eliminating ecological burdens caused by the exploration for and extraction of crude oil and natural gas.
As of 31 December 2013, the funds actually spent on 81 concluded projects amounted to about CZK 1.171 billion, and on 75 projects in progress they amounted to about CZK 5.512 billion as of the specified date.
Categories of priority projects, approved by the Government, which deal with eliminating environmental damage caused by mineral mining in the Moravian-Silesian and South Moravian Region 1. Reclamation work2. Reducing thermal activity3. Comprehensive site development 4. Comprehensive reduction of uncontrolled methane emissions5. Eliminating old ecological burdens in OKD, a. s.6. Land development upon termination of mining7. Eliminating ecological burdens caused by the exploration for and extraction of crude oil
and natural gas

144Environment and minerals – Eliminating negative consequences of mining
Projects concluded (in CZK) – as 31. 12. 2013
Project nameProject costs
1. Reclamation work
7/03 Reclamation of reservoirs and lands below the Stachanov reservoirs – additional construction work 8 824 451
7/04 Reclamation of the Žofie waste dump 1 950 601
7/06 Drainage of lands south of Kuboň Pond – site A and B 2 377 507
7/10 Remediation of the Václav waste dump – external review AR 36 000
7/15 Development along the Orlovská Stream 6 275 508
7/16 Development along the Sušanky Stream 5 957 512
7/16 Development along the Sušanky Stream – phase II. 2 026 032
7/16 Development along the Sušanky Stream – updated estimate of project documentation 17 850
Final assessment of the “Reclamation of reservoirs and lands below the Stachanov reservoirs – additional construction work” project
42 000
7/20 Drainage of waterlogged lands in Paskov 6 974 421
7/02 Rudná land reclamation, structure 5 (along Polanecká street) 5 727 264
Total 1 40 209 147
2. Reducing thermal activity
8/01 Survey and monitoring of thermal activity in the Heřmanice waste dump 4 962 696
8/02 Survey and monitoring of thermal activity in the Hedvika waste dump 6 506 627
8/04 Survey and monitoring of thermal activity in the Heřmanice waste dump – site II 4 224 505
8/05 Survey and monitoring of thermal activity in the Ema waste dump 1 487 696
8/10 Comprehensive remediation of the contaminated area in the Trojice locality – phase I: updated risk assessments of the contaminated area
2 337 570
Examiner’s report: Comprehensive remediation of the contaminated area in the Trojice locality – phase I: updated risk assessments of the contaminated area
46 800
8/08 Long term monitoring of thermal activity in the Hedvika waste dump 3 270 345
Total 2 22 836 239
3. Comprehensive site development
9/01 Height measurement in areas with phased out mining operations managed by DIAMO (ODRA) – execution 5 109 270
Height measurement in areas with phased out mining operations 1 094 800
Examiner’s report – Height measurement in areas with phased out mining operations 44 140
Extinguishing of local fire on the Ludvík waste dump in the cadastral area of Radvanice – project 513 600
Total 3 6 761 810
4. Comprehensive reduction of uncontrolled methane emissions
Comprehensive analysis of the methane problem in connection with old mine workings – study 7 602 000
Examiner’s report on the conceptual solution of the methane problem 35 000
Measures for removing emergency measures regarding methane emissions in the City of Orlová 62 873 211
Reducing verified methane emissions in the City of Orlová – Project Orlová 2 – additional construction work 6 933 219
35/1 Security provision of liquidated shaft Jan Maria and remediation of mine area 32 103 924
35/2 Elimination of uncontrolled natural gas emissions from deep exploration boreholes in the area of Trojanovice – survey
18 315 000

145Environment and minerals – Eliminating negative consequences of mining
35/A Preparing individual methodical procedures of basic activities 1 856 400
Survey of mine gas emissions in areas with phased out coal mining and related health and environmental risks 2 344 300
Reducing verified methane emissions in the City of Orlová – Project Orlová 2 34 503 154
Expert assessment 35/AKT updated project no. 35 – Comprehensive analyses of the methane problem in connection with old mine workings
160 650
35/L1 “Economics of filling underground spaces“ 2 261 000
35/L2 Geophysical and borehole survey 1 707 650
35/L3 Scientific-research support for important safety improvements regarding uncontrolled mine gas emissions from old workings, as a result of dealing with residual coal gas capacity and gas bearing capacity of phased out and abandoned mine sections
2 261 000
Reducing verified methane emissions in the City of Orlová from 1. 2. to 31. 5. 2010 – provision of essential safety measures 2 397 600
Reducing verified methane emissions in the City of Orlová from 1. 6. to 30. 9. 2010 – provision of essential safety measures
2 397 600
Reducing verified methane emissions in the City of Orlová from 1. 10. 2010 to 31. 1. 2011 – provision of essential safety measures
2 397 600
Reducing verified methane emissions in the City of Orlová from 1. 2. 2010 to 31. 5. 2011 – provision of essential safety measures
2 397 600
Reducing verified methane emissions in the City of Orlová from 1. 6. 2010 to 30. 9. 2011 – provision of essential safety measures
2 397 600
Methane emissions in locations of plugged shallow boreholes in the cadastral area of Trojanovice – project 780 000
Total 4 185 724 508
5. Eliminating old ecological burdens in OKD, a.s.
Processing the “Remediation and reclamation of the Kašpárkovice lands” project 809 200
Processing the “Remediation of the Solca tailing ponds” project 1 224 510
Processing the “Development of lands including Karvinský Creek in the area of Špluchov – phase 3” project 1 860 565
Remediation and reclamation of the Křemenec area 113 929 281
Expert assessment of the legitimacy of OKD, a.s. request for approval of Method Changes No. 3 – Křemenec 39 668
Reclamation of waste dump D – reclamation of waste dump D1 and D2 51 126 441
Dolina I land decontamination and reclamation 19 393 615
Louky land reclamation – structure 8 60 525 001
Land development within the scope of revitalising the František locality 376 902 703
František locality – additional construction work 63 260 118
Remediation of Solec hill, structure 2 – additional construction work 4 389 633
Total 5 693 460 735
6. Land development upon termination of mining
Demolition KOBLOV 6 914 610
Demolition HRUŠOV 6 845 432
Project documentation regarding land development within the scope of eliminating environmental damage upon termination of mining – executed in areas no. 1 and 3 of project no. 45
1 543 500
45/01 František premises, phase 1 13 917 808
45/02 František premises, phase 2 – demolition 1 229 793
Ostravice Dam – Hrabová km 12.05, no. st. 237 63 580 471
Remediation of the damaged Ostravice dam body – additional construction work 12 184 996
45/07 Přívoz premises, demolition 10 835 872

146Environment and minerals – Eliminating negative consequences of mining
45/08 Pokrok premises, demolition 25 498 110
Landslide stabilisation and drainage modification in the area of Bučinský les in the cadastral area of Radvanice and Bartovice – project
1 591 030
Landslide stabilisation and drainage modification in the area of Bučinský les in the cadastral area of Radvanice and Bartovice – supplemental engineering-geological survey
235 620
45/09 Farma VKK 1 Rychvald premises 19 276 732
VKK Rychvald premises – additional construction work 3 321 357
45/11 Comprehensive development of the water channel and canal network on the premises of the Petr Bezruč mine – project documentation
1 920 000
45/12 Land development upon termination of mining by DIAMO, s. p., o. z. ODRA – Hlubina premises 7 057 921
45/14 Land development upon termination of mining by DIAMO, s. p., o. z. ODRA – Barbora premises, phase 2 2 268 698
Huminisation of the town centre of Orlová Lutyně – study 2 031 687
Reclamation of lands of the former František – Horní Suchá mine – additional construction work 17 729 490
Preparation of a biological assessment according to Act No. 114/1992 Coll., as amended, as part of the land development upon termination of sand and gravel mining – Hlučín
237 600
Realization of Mír Gardens in Svinov – project 201 600
45/15 Petr Bezruč mine premises, phase 2 3 519 309
Reclamation of former mining land in the cadastral area of Malá Štáhle for leisure and tourism purposes – project 2 208 000
Documentation according to article 6, Act No. 100/2001, on environmental impact assessment, noise and dispersion study to the project Huminisation of the town centre of Orlová
228 000
Huminisation of the town centre of Orlová Lutyně – project documentation 4 447 000
Reclamation of the waterbody in the historic Božena Němcová Park, affected by mining, for leisure activities of residents of the City of Karviná – project
2 352 000
Revitalization of former mining land in the cadastral area of Horní Benešov – project 2 358 440
Total 6 222 933 026
Total 1–6 1 165 163 655
Projects in progress (in CZK)
Project nameProject price
Project costs thus
far
1. Reclamation work
7/03 Remediation and reclamation of reservoirs and lands below the Stachanov reservoirs 54 190 395 39 595 086
7/05 Drainage of waterlogged land at Ščučí – project 7 349 654 7 282 789
7/09 Reclamation of NP 1 lands 117 400 280 38 443 430
7/10 Remediation of the Václav waste dump 19 615 573 18 658 833
7/13 Remediation SALMA 7 131 668 6 787 012
7/14 Reclamation of the Oskar waste dump 6 091 630 5 486 004
7/17 Remediation of the Urx lanslide area 6 948 771 6 926 827
7/18 Capacity increase of Sčučí floodway – project documentation 2 371 600 166 500
7/21 Anti-erosion measures Salma 877 212 688 670
7/23 Remediation of Lipina premises, land A 5 963 654 4 150 451
Total 1 227 940 437 128 185 602

147Environment and minerals – Eliminating negative consequences of mining
2. Reducing thermal activity
3. Comprehensive land development
9/02 Monitoring, measuring and assessment of the area of the Slezkoostravsky and Bartovicky fault 533 520 489 060
Total 3 533 520 489 060
4. Comprehensive reduction of uncontrolled methane emissions
Controlled methane drainage from underground areas in the City of Orlová (Project Orlová 3) 111 299 603 41 469 421
35/4 Humanization of foolproof or liquidated old mine workings and degasifying boreholes in Ostrava town residential area
193 140 597 92 677 871
35/5 Avoidance of uncontrolled leakages of gas from deep explorarion boreholes in Trojanovice territory, boreholes NP 546 and NP 805
48 295 233 42 478 164
35/6 Avoidance of uncontrolled leakages of gas from deep explorarion boreholes in Václavice, Soběšice-Dolní Domaslavice, Fryčovice-Příbor východ territory – exploration works
48 276 482 29 687 519
35/D3 Monitoring and maintaining the old mine working during the project execution, methane-screening
21 920 903 18 571 457
35/B “Land categorisation map OKR“ 2 264 500 1 816 290
35/D3 Monitoring and maintenance of old mine working with continuous data transfer (4 old mine workings) – project
2 398 000 1 642 323
35/J Redesign of existing electrical monitoring system – project 37 855 151 31 093 934
Updated project no. 35 – Comprehensive reduction of methane connected with old mine workings in the Moravian-Silesian Region
1 271 961 696 287 696 695
35/7 Plugging of deep exploration oil and natural gas borehole Lm – 1 Dolní Lomná 15 471 008 0
Repeated liquidation of the old mining working Michálkovická jáma (Michálkovice shaft) 9 416 752 0
Total 4 1 762 299 925 547 133 674
5. Eliminating old ecological burdens in OKD, a.s.
Decontamination and reclamation of sludge tanks – phase III., IV. and V. 261 721 195 239 156 396
Darkov land reclamation, phase I, locality C2 395 104 159 386 637 496
Decontamination and reclamation of the Lazy mine sludge tanks, phase I. and II. 33 773 258 27 703 704
Reclamation of the Lazy waste dump 101 268 628 89 703 807
Rehabilitation of the Zdeněk Nejedlý Park – phase I., remediation of land south of the Karvinský Stream
47 697 096 41 104 265
Reclamation at the former OKD Dopravy, site A – construction work 4 713 506 3 226 693
Reclamation of Solecký Hill, structure II 22 569 081 8 524 655
Regulation of the Stonávka River, km 0.00–2.90 phase A 177 037 484 152 597 059
Regulation of the Stonávka River, km 0.00–2.90 phase A - additional construction work 31 789 848 21 833 568
Reclamation of the D1 waste dump – slope adjustment 11 443 632 9 522 951
Total 5 1 087 117 887 980 010 595
6. Land development upon termination of mining
Reclamation of lands of the former František – Horní Suchá mine 95 200 679 93 765 102
Land stabilisation and drainage modification in the area of the Šporovnice locality in the cadastral area of Radvanice – project
1 779 600 1 631 300
Remediation and reclamation of land upon termination of sand and gravel mining at Hlučín – project documentation
34 675 090 13 801 200
Remediation and reclamation of land upon termination of sand and gravel mining at Hlučína – project documentation
34 508 640 13 801 200
Revitalization of municipality Doubrava centrum – square – project 120 000 110 000

148Environment and minerals – Eliminating negative consequences of mining
Revitalization of former sandpit lands and forest areas in the cadastral area of Sedlnice for recreation purposes – project
2 334 000 1 661 000
Reviclamation of the area of Volný Pond and forest lands in the cadastral area of Radvanice for leisure activities
4 912 661 4 396 893
Development of former mining land – Reconstruction of road no.III/472 (Doubrava-Dědina) damaged by mining activities – project documentation
2 403 790 1 636 690
Revitalisation of the centre of the Svinov District near the elementary school at Bílovecká 1 – project
270 810 158 400
Reclamation of former mining land in the cadastral area of Horní Benešov – Cycle Routes – project
2 157 330 809 600
45/19 Comprehensive development of the water channel and canal network on the premises Koblov – project documentation
2 110 700 1 508 350
45/20 Potable water conveyance to and from the Alexander premises – project documentation 368 200 215 600
Reclamation of former mining land in the cadastral area of Horní Benešov – Road Restoration – project
1 136 406 535 260
Reclamation of former mining land in the cadastral area of Bruntál – “Za mlékárnou” locality – project documentation
2 416 975 0
Reclamation of former mining land in the cadastral area of Bruntál – “Za mlékárnou” locality – EIA documentation
496 100 0
Reclamation of former mining land in the cadastral area of Bruntál – “Laguny” locality – project documentation
2 349 700 1 078 000
Remediation and reconstruction of the canal system due to the aftermath of mining impacts of coal mining in Petřvald
354 445 568 297 210 515
Documentation pursuant to article 6 of Act No. 100/2001 Coll., on environmental impact assessment; Noise Study and Dispersion Study for the project documentation
228 000 209 000
Reconstruction of bridge in Albrechtice 1 438 830 383 900
Reclamation of formenr mining land in Ostrava-Nová Ves cemetery locality 3 592 000 3 102 558
Development of former mining land – multifunctional area of former Důl Dukla mine 252 273 612 194 283 695
Revitalization (remediation) of Slezská Ostrva Castle in connection with damage control of former mining activity and land preparation for leisure activities
34 626 442 11 554 021
Revitalization and resocialization of lands affected by mining activity in Horní Město – Revitalization of community centre after mining – security provision of old mine workings
22 745 956 13 447 321
Revitalization and resocialization of lands affected by mining activity in Horní Město – Revitalization of community centre after mining – security provision of old mine workings – additional construction works
2 011 277 0
Revitalization of territory negative influenced by construction of water reservoirs for mines and iron works – Revitalization Žermanice dam territory – right bank protection – phase I. and II.
70 996 213 18 566 466
Revitalization (remediation) of Ostravice river Castle in connection with damage control of former mining activity
174 795 342 93 364 498
Lučina, revitalization of waterway after mining activity, river kilometrage 0.000–3.262, construction no. 5657 – project documentation
2 323 200 238 650
Ostravice river, check dam in river kilometrage 0.0–3.0 construction no. 5659 – project 2 328 040 943 500
Ostravice river, check dam in river kilometrage 0.0–3.0 construction no. 5659 – project 2 308 800 0
Remediation of mine damages at Bohumínská Stružka, Rychvaldy weir – Czech Railways track, kms 4.595-10.530, construction no. 5660 – project documentation
2 318 360 0
Documentation processing and engineering for project Remediation, reclamation and revitalization of territory after sand and gravel mining near Hlučín – additional services
3 840 672 1 722 446
Damage control of former mining activity and subsidence of ground – flood control Žabník in Ostrava – Koblová
58 657 519 0
Revitalization and resocialization of lands affected by mining activity in Horní Město – Revitalization of former mining land in Skály u Rýmařova, the cadastral area of Skály u Rýmařova – project
1 172 490 0

149Environment and minerals – Eliminating negative consequences of mining
Revitalization of former mining land in the cadastral area of Brumtál – locality “Uhlířský vrch” – I. stage – project
145 200 0
Revitalization and resocialization of lands affected by mining activity in Horní Město – Preparation of industrial zone – project
1 089 000 0
Revitalization and resocialization of lands affected by mining activity in Horní Město – Preparation of industrial zone – Cycle track Rešov – Rešovské vodopády (Rešov waterfalls) – project
1 028 500 0
Revitalization and resocialization of lands affected by mining activity in Horní Město – Cycle track Dobřečov – Ferdinandov – project
907 500 0
Total 6 1 143 695 762 756 333 965
7. Eliminating ecological burdens caused by the extraction of crude oil and natural gas
Remediation of old ecological burdens – insufficiently plugged probe holes upon termination of the extraction of crude oil and natural gas – Eliminating hazardous conditions at probe hole HR 43
238 149 638 238 144 159
Remediation of old ecological burdens – inadequately liquidated probe holes of past crude oil and natural gas production – Eliminating hazardous conditions at probe hole HR 44 – additional construction work
38 147 146 6 580 424
Remediation of old ecological burdens – inadequately liquidated probe holes of past crude oil and natural gas production in sector I CHOPAV of the Quaternary of the Morava River
828 284 357 667 664 835
Remediation of old ecological burdens – inadequately liquidated probe holes of past crude oil and natural gas production in sector II CHOPAV of the Quaternary of the Morava River
707 223 047 552 613 475
Remediation of old ecological burdens – inadequately liquidated probe holes of past crude oil and natural gas production in sector III CHOPAV of the Quaternary of the Morava River
526 483 998 409 744 030
Remediation of old ecological burdens – inadequately liquidated probe holes of past crude oil and natural gas production in sector IV CHOPAV of the Quaternary of the Morava River
812 284 527 268 316 792
Remediation of old ecological burdens – inadequately liquidated probe holes of past crude oil and natural gas production in sector V CHOPAV of the Quaternary of the Morava River
714 553 603 140 424 873
Remediation of old ecological burdens – inadequately liquidated probe holes of past crude oil and natural gas production in sector VI CHOPAV of the Quaternary of the Morava River
3 204 512 981 816 084 155
Total 7 7 069 639 297 3 099 572 743
Total 1–7 11 291 246 528 5 511 725 639
Reducing impacts caused by the termination of coal mining in the Kladno Region In the middle of 2002, the Czech Republic Government decided to phase out underground mining of bituminous coal in the Kladno Region due to the economic ineffectiveness of mining. This hasty closure of mines in this region brought about, similarly as in the preceding coal districts, the need to deal with eliminating environmental damage caused by past mining operations in a special way.
In consideration of the situation which developed in the Kladno Region, the Czech Republic Government noted the need to reduce the impacts caused by the termination of coal mining in the Kladno Region, by issuing Resolution No. 552 on 4 June 2003, dealing with the reduction of impacts caused by the termination of coal mining in the Kladno Region. It agreed with the idea of gradually releasing, according to the means of the National Property Fund of the Czech Republic, an amount of up to CZK 1.177 billion from FNM resources starting in 2004 in order to deal with ecological impacts caused by coal mining in the past and with land reclamation. Considering the shortage of funds in order to carry out the “Reclamation of the Tuchlovice Mine Waste Dump” contract, the Czech Republic Government modified the above-mentioned resolution with Resolution No. 1467 on 20 December 2006, and agreed with the idea of gradually releasing, according to the means of the MF, funds in the amount of up to CZK 1.427 billion starting in 2004

150Environment and minerals – Eliminating negative consequences of mining
Projects concluded (in CZK)
Project name Project costs
V Němcích Schoeller mine waste dump – eliminating dangerous conditions 234 429 193
Eliminating the dangerous conditions at the V Němcích Schoeller mine waste dump –
stage 2, western section106 862 466
Eliminating the dangerous conditions at the V Němcích Schoeller mine waste dump –
additional construction work46 608 677
Reclamation of Tuchlovice dump – Supplementno. 1 of the Project Erosion control
measures20 274 715
Total 408 609 117
Projects in progress (in CZK)
Project name Project price Project costs
thus far
Reclamation of the Tuchlovice mine waste dump 1 024 256 235 1 023 565 669
Reclamation of the Schoeller mine waste dump in
Libušín271 177 604 253 959 392
Reclamation of the Schoeller mine waste dump in
Libušín9 625 428
Total 1 305 084 615 1 277 525 061
6. Sources of European Union – Operational Programme Environment (administered by the Ministry of Industry and Trade)
The European Union funds used via Operational Programme Environment have been the important source of funding of ming activity damages and old environmental burden avoidance since 2008. Till present the sum CZK 886 930 ths has been used from the source at 10 concluded projects in the period 2008 – 2013, next 3 projects for realization in 2014–2015 are developed and utilization of EU funds is expected. Projects for subsequent periods are continuously prepared depending on bids offered by Ministry of the Environment.
from a special account managed by the MF pursuant to article 4 of Act No. 178/2005 Coll., on the termination of the National Property Fund, in order to deal with ecological burdens caused in the past and with land reclamation. From that time the sum was increased to CZK 1.727 billion pursuant Government Resolution No. 688 on 9 June 2008.
The following projects are considered essential: • eliminating the dangerous conditions at the V Němcích Schöeller mine waste dump • reclamation of the Tuchlovice mine waste dump
As of 31 December 2012, the funds actually spent on 4 concluded projects amounted to CZK 0.409 billion and on 3 projects in progress they amounted to CZK 1.277 billion as of the date specified. The remaining financial amount required to secure additional money for projects in progress amount to about CZK 0.025 billion according to contracts.

151Environment and minerals – Eliminating negative consequences of mining
Project nameProject
realization term
Share of EU subsidy
(issued RoPD) 85% (CZK)
Total project costs (incl. VAT) – as per attached invoices
(CZK)
Project status
Territory risk analysis for lands managed by s.p. DIAMO – o.z. SUL Příbram, former mining and benefication plant Březové Hory – Příbram
2009–2010 2 509 246 3 705 571
Execution of the project finished,
documents of ZVA na SFŽP
Risk analysis of dumps affected by internal burning managed by DIAMO s. p., o.z. Odra
2009–2010 11 547 099 16 673 582
Execution of the project finished,
documents of ZVA na SFŽP
Remediation and reclamation of old environmental burden of DIAMO s.p. at Mydlovary premises – chemical treatment plant and tailing pond K IV/D
2008–2010 467 951 745 704 758 892
Execution of the project finished,
documents of ZVA na SFŽP
Territory risk analysis for lands managed by s.p. DIAMO – o.z. SUL Příbram, former mining and benefication plant Kaňk – Kutná Hora
2009–2010 3 382 997 5 188 890
Execution of the project finished,
documents of ZVA na SFŽP
Territory risk analysis for lands managed by s.p. DIAMO – o.z. TÚU Stráž pod Ralskem affected by uranium underground mining
2009–2010 14 337 972 20 240 150
Execution of the project finished,
documents of ZVA na SFŽP
Risk analysis of uranium ore and aggregates loading area Milín
2011–2012 1 340 778 4 176 782
Execution of the project finished,
documents of ZVA na SFŽP
Complex risk analysis of DIAMO s.p. at Mydlovary premise and tailing ponds, inclusive wider vicinity
2011–2012 11 039 922 17 005 730
Execution of the project finished,
documents of ZVA na SFŽP
Risk analysis of withdrawal area endangering by incompletely liquidated drilled wells after oil and natural gas mining in “CHOPAV Kvartér řeky Moravy”
2009–2011 80 286 441 104 283 936
Execution of the project finished,
documents of ZVA na SFŽP
Risk analysis of Bytíz premise after uranium underground mining
2012–2013 3 262 494 6 557 336
Execution of the project finished,
documents of ZVA na SFŽP
Finalization of rock environment and groundwater polution exploration of lands managed by s.p. DIAMO – o.z. SUL Příbram, former mining and benefication plant Kaňk – Kutná Hora and its close vicinity
2012–20143 062 191 4 339 576
Execution of the project finished,
documents of ZVA na SFŽP
Land remediation of former mining and benefication plant Příbram, Březové Hory – Phase 1
2012–2015 (2016) 92 530 127 114 878 912 Project is executed
Notes: RoPD = Rozhodnutí o poskytnutí dotace vydávané žadatelům Ministerstvem životního prostředí = Decision on subsidizing issued to applicants by Ministry of the Environment
CHOPAV = Chráněná oblast přirozené akumulace vod = Natural water accumulation protected area “CHOPAV Kvartér řeky Moravy” = Natural water accumulation protected area of Morava River QuaternaryZVA na SFŽP = Závěrečné vyhodnocení na Státní fond životního prostředí = Final assessment for the State
Environmental Fund

152
GEOLOGY AND MINERALS
Geological evolution of the area of the Czech Republic
Arnošt Dudek
The Czech Republic is located in the very centre of Europe at the limit between the Hercynian Meso-Europe and the Neo-Europe (Fig. 1). There is hardly any country with such a variegated geological structure in such a small area and with such a complex geological evolution. Practically all known rocks and the majority of geological formations and known types of ores and industrial minerals occur on the state territory. Even though most ore deposits are interesting mainly from a scientific and mineral collectors’ point of view, a number were of European importance during the Middle Ages and the beginning of modern time. The interesting and complex history of this area attracted attention of researchers already in early times and it strongly influenced the evolution of the mining and geological sciences. It was on this territory where one of the oldest mining laws, the Jihlava Mining Law (1260), and slightly later the mining law of the King Wenceslas II “Ius regale montanorum” (1300), which became basis of many mining laws in other states of the world especially in South America, came into being. The origin of the world-known works of Georgius Agricola, especially his book “Bermannus sive de re metallica dialogus” (1530), is also linked to the territory of the Bohemian Massif.
Three main structural complexes form the geological structure of Czech territory. The oldest one, consolidated already during the Precambrian orogenies, is Brunia (Brunovistulicum), taking basically the area of Moravia. This segment of the Earth’s crust probably represents an extremity of the East European platform, even though some researchers consider it as a part of the African plate. The influence of the younger – Paleozoic and Alpine – orogenies was only minor and it served as a foreland of the nappe structures which were thrust over it. The Hercynian-consolidated Bohemian Massif, overlapping to the area of the neighbouring Austria, Germany and Poland in the south, west and north, forms the major part of the state territory. Bohemian Massif belongs to the Paleo-Europe. The Hercynian orogeny in the end of the Carboniferous put the finishing touches on it, even though it also contains older building elements. It already behaved as a consolidated block after the Hercynian orogeny, only sometimes flooded by epi-continental sea and affected only by fault tectonics. As a crustal block rising from young sedimentary formations, it broke up only during the younger mountain-building processes, morphologically only in the end of the Neogene and in the Quaternary. Geological continuation of the Hercynides towards the west is indicated by other crustal blocks which were created later – Schwarzwald, Vosges Mountains, the French Massif Central and Iberian Meseta, in the northern branch then the Armorican Massif and massifs in southern England and Ireland. The eastern margin of the Bohemian Massif was thrust over the Cadomian unit of the Brunovistulicum during the Hercynian orogeny. The boundary between the hercynian Mesoeurope and alpine Neoeurope crosses the eastern part of the Czech Republic. The Alpides are represented there

153Geology and minerals – Geological evolution of the area of the Czech Republic
Fig. 1: Geological position of the Czech Republic in Europe

154Geology and minerals – Geological evolution of the area of the Czech Republic
by the West Carpathians. They are built by an inner unit – Central West Carpathians, Outer Flysh Carpathians and the Carpathian Foredeep. The Central West Carpathians are formed by pre-Mesozoic volcanosedimentary complexes, mostly metamorphosed and penetrated by late-Hercynian granitoid plutons, and their sedimentary cover (Trias to Lower Cretaceous). At the beginning of Upper Cretaceous the Central Carpathians were intensively folded and in places also metamorphosed. A tectonic zone of first order – the Klippen Belt, built mostly by Mesozoic sedimentary rocks separates the Central Carpathians from the external Flysh Carpathians. The Outer Flysh Carpathians are formed (besides rare uppermost Jurassic sediments and local Cretaceous volcanics) predominantly by sedimentary complexes of Cretaceous and Paleogene age. These complexes were as horizontal nappes thrust over the Brunovistulian basement and its sedimentary cover over a distance of tens of kilometres partly even over the Neogene Carpathian Foredeep.
As in the study of the history of mankind, there is little information on the oldest periods of the evolution of the Earth we live on, and our findings are accompanied by a large number of uncertainties. This of course applies also for the Czech territory, even though it belongs to the areas where systematic geological research was in progress since the beginning of the 19th century.
Complexes of the Brunia (Brunovistulicum) crop out on the surface only in the western Moravia, but they reach far to the east below the overthrust nappes of the Outer Flysh Carpathians. They are formed by metamorphic rocks – mainly monotonous biotite paragneisses – which were altered during the Proterozoic orogenies, and intruded by huge massifs of abyssal magmatic rocks of about 550 Ma age at the boundary between the Proterozoic and Paleozoic. The Brno and Dyje Massifs represent the exposures of these rocks. Granitoid plutons covering large areas as well as smaller basic massifs of gabbros and norites compacted this unit and prevented its later reworking by younger mountain-building processes, which formed the Bohemian Massif. Western parts of the Brunovistulicum are built by variegated volcano-sedimentary complexes (involving limestones, graphitic rocks, quartzites, amphibolites and orthogneisses). These parts were strongly affected by the Hercynian tectonometamorphic processes. They crop out from beneath of the overthrust Hercynian complexes of the Moldanubicum and Lugicum in tectonic windows of the Dyje and Svratka Domes of the Moravicum and Desná Dome of the Silesicum. Their appurtenance to the Brunia (Brunovistulicum) has not been commonly accepted yet and these units are by some authors ranked to the Lower Paleozoic and to the Hercynian Bohemian Massif. Platform sediments – the Cambrian conglomerates and sandstones in limited areas, marine Silurian shales sporadically and extensive and important sediments of the Devonian, Mississippian (Lower Carboniferous) and continental sediments of the coal-bearing Pennsylvanian (Upper Carboniferous) – are deposited on the Cadomian basement. The younger platform cover is represented by sediments of the Jurassic, Cretaceous, Paleogene and the Neogene of the Carpathian Foredeep. This consolidated basement was overthrust by nappes of the Outer Flysh Carpathians from the east (Fig. 2).
The lower level (basement) of the Bohemian Massif – the epi-Variscan platform – is built by metamorphic rocks intruded by numerous and very large granitoids massifs, and by only weakly metamorphosed or unmetamorphosed but Hercynian-folded Lower Paleozoic. Regionally it is divided (Fig. 3) into the core, formed by the highly metamorphosed Moldanubicum and mostly only weakly metamorphosed Bohemicum (Teplá-Barrandian domain). This core is rimmed by the Saxothuringicum (Krušné hory Mts.) on the NW, Lugicum (Krkonoše Mts., Orlické hory Mts., Králický Sněžník) on the north and Moravo-Silesicum (Jeseníky Mts., eastern part
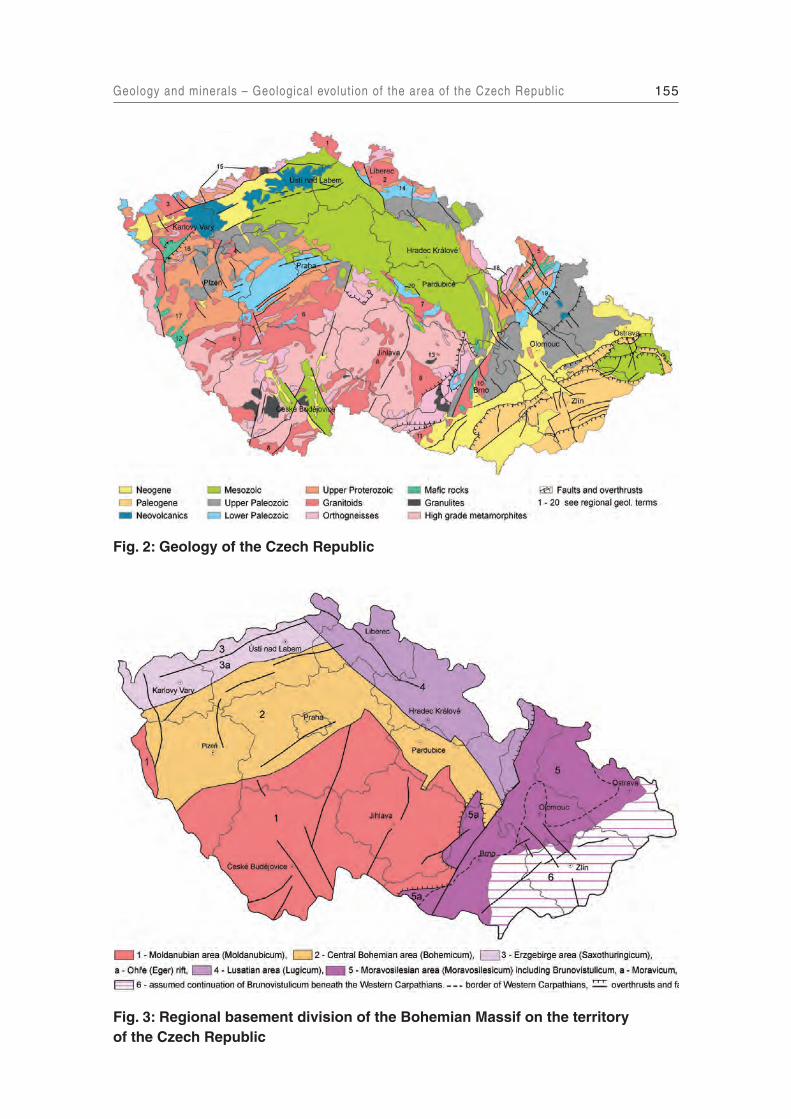
155Geology and minerals – Geological evolution of the area of the Czech Republic
Fig. 2: Geology of the Czech Republic
Fig. 3: Regional basement division of the Bohemian Massif on the territory of the Czech Republic

156Geology and minerals – Geological evolution of the area of the Czech Republic
of the Českomoravská vrchovina Highlands) on the east (see Fig. 3). These marginal complexes are metamorphosed mostly less intensively than the central Moldanubicum.
The Moldanubicum is formed by rocks metamorphosed mainly in the amphibolite facies – sillimanite and cordierite gneisses and migmatites with intercalations of orthogneisses, marbles, quartzites, graphitic rocks and amphibolites. Bodies of high-temperature and high-pressure metamorphic rocks – granulites and garnet peridotites with eclogites – are numerous, too. Their occurrences mark the course of old tectonic zones, along which these rocks were exhumed from depth. They are exposed mainly in southern Bohemia (Blanský les, Prachatice, Křišťanov and Lišov granulite massifs) and western Moravia (Bory and Náměšť granulite massifs). The age of the protolith of Moldanubian complexes is probably Upper Proterozoic; their metamorphism under the amphibolite, granulite and eclogite facies conditions is linked to the Hercynian orogeny. Pre-Paleozoic, Cadomian metamorphism of regional extent, mostly overprinted by the Hercynian processes, is nevertheless documented. Minor bodies of old orthogneisses exhumed along deep-reaching faults in the southern Bohemia, the radiometric age of which is even 2.1 Ga, represent a single exception. They document the existence of the Lower Proterozoic in the deeper crustal structure of the Bohemian Massif. Some Moldanubian rocks, especially gneisses, granulites and amphibolites, represent common resources of building stone.
The metamorphic rock complexes of the central Bohemian Bohemicum (Teplá-Barrandian domain) as well as the marginal complexes of the Saxothuringicum, Lugicum and Moravo-Silesicum developed by regional metamorphism of mainly Upper Proterozoic protoliths (1,000–545 Ma). During this period, the area of today’s Bohemian Massif was covered by a deep sea, in which sandy and clayey rocks were deposited. Surrounding continents, probably rather distant in the mainland formed by very old rocks, represented the source area of the deposited material. Some clastic minerals from metamorphic rocks of the southern Bohemia (up to 2.7 Ga old, in the neighbouring Bavaria even 3.8 Ga) were at least in part derived from the Archaic of the African shield. They were of course deposited much later. The sedimentation was accompanied by submarine volcanism of tholeiitic basalts, which formed linear structures tens of kilometres long, maybe in some cases standing out above the sea level (island arcs) as well as much less extensive acid volcanism. The volcanic activity was accompanied by deposition of black shales with abundant pyrite and of siliceous sediments – lydites. Finely banded structures resembling organogenic stromatolites, which would belong to the oldest organic remnants on the Czech territory, were found rarely in the latter. A set of these sediments and volcanic rocks was intensively folded and mostly also metamorphosed in the end of the Proterozoic. Very weakly metamorphosed Proterozoic rocks are nowadays exposed only in central Bohemia between Prague and Plzeň (in the so-called Barrandian). The intensity of their alteration increases towards the marginal mountains. A continuous succession of thin metamorphic zones of Barrovian type up to gneisses with kyanite and sillimanite developed especially towards the W and SW. Proterozoic rocks are altered into gneisses and amphibolites also in the Krušné hory Mts., Krkonoše Mts., Orlické hory Mts. and Hrubý Jeseník Mts. These complexes were intruded by numerous massifs of granites (especially Stod, Čistá-Jesenice and Lužice massifs) and gabbros (Kdyně and Poběžovice massifs) in the end of the tectonometamorphic processes especially in the western and northern Bohemia. The Pre-Paleozoic Cadomian orogeny represents one of the most important magmatogennic and tectonometamorphic processes in the evolution of the Bohemian Massif.
The Earth’s crust in Czech territory was not completely solid after the Cadomian orogeny and it gradually broke into a number of smaller blocks, which moved away from each other and

157Geology and minerals – Geological evolution of the area of the Czech Republic
were partly flooded by sea again during the Lower Paleozoic [Cambrian, Ordovician, Silurian, Devonian to Mississippian (Lower Carboniferous)]. Unaltered sediments were preserved especially in central Bohemia, in the area between Prague and Plzeň (Pilsen), named Barrandian, to a lesser extent also in other parts of the Bohemian Massif. In its marginal parts (excluding Brunovistulicum), Paleozoic complexes experienced strong metamorphism and therefore their identification and dating is commonly very difficult. In the Barrandian, sedimentation started already in the Lower Cambrian, represented by a formation of conglomerates and sandstones up to several hundred to thousand meters thick. Sporadic occurrences of shales of fresh-water or brackish origin, in which the oldest fossils of arthropods in Bohemia were found, are known here. Sea penetrated to central Bohemia in the Middle Cambrian and deposited sandstones and especially shales, which are world-known for their occurrences of trilobite fauna. The evolution of the Cambrian was terminated by extensive rhyolites and andesite terrestrial volcanism.
The Ordovician started by the sea again transgressing in central Bohemia and by the formation of the so-called Prague Basin, the evolution of which continued until the Middle Devonian. The Ordovician rocks are represented mainly by clastic sediments, mostly various types of shales with thick quartzite intercalations), the deposition of which was accompanied by intensive basaltic volcanism. Deposits of sedimentary iron ores (e.g. Nučice, Ejpovice etc.) which were of a high importance in the 19th and beginning of the 20th century originated in relation to the volcanic activity. The Bohemian Massif was located close to the southern polar circle in the Ordovician and sedimentation of rocks as well as volcanic activity proceeded in the sub-polar climate. This crustal segment moved rather rapidly to the north, into warmer waters of the tropic of Capricorn in the end of the Ordovician.
The change of the climate and by this also conditions of development of organisms and sedimentation during the Silurian resulted in formation of fine-grained black shales with abundant graptolite fauna, accompanied also by intensive volcanic activity and intrusions of numerous diabase sills. Mass development of organisms with carbonate shells occurred in its upper parts with regard to the increasing temperature and massive limestone formations were formed.
Continuous carbonate sedimentation in the Prague Basin lasted until the Devonian, whereas in the surrounding parts of Europe as well as more distant areas the rock deposition was interrupted by the Caledonian orogeny. Gradual unaffected evolution of both the sediments and organisms and their long-lasting detailed study by several generations of Czech paleontologists was a prerequisite for the determination of the first, globally valid stratotype between two systems (Silurian and Devonian) in Klonk u Suchomast SW of Prague. The limestone sedimentation in the Prague Basin terminated in the Middle Devonian and sandstones with terrestrial flora ended the Devonian sedimentation in this area.
Sedimentation of the Devonian rocks continued in the Upper Devonian only in the area of the Krkonoše Mts. (on Ještěd Mt.) and especially in Moravia in the Jeseníky Mts. and in the Moravian Karst. Evolution of the Devonian in Moravia differed from that on the Bohemian territory. Transgressive complex of the siliciclastic and volcanic rocks with stratiform deposits of Fe, Cu, Au, Zn and Pb overlie the old Brunovistulian basement in its western, more mobile part. This clastic sedimentation continues also in the Mississippian (Lower Carboniferous). The Devonian rocks on the more stable Brunovistulian basement in the south and east begin by clastic rocks, which in places reach over 1,000 m in thickness. Limestones appear only in the Upper Devonian and their evolution continues until the Mississippian (Lower Carboniferous). There is therefore no manifestation that the sedimentation was interrupted by the Hercynian

158Geology and minerals – Geological evolution of the area of the Czech Republic
orogeny in Moravia . Sedimentation spaces just moved to the east to Ostrava region and to today’s Carpathian basement . Limestones of the Upper Devonian form important deposits especially in central Moravia (e.g. Mokrá, Líšeň, Hranice etc.).
A change in the character of the sedimentation in the end of the Devonian is an expression of the Hercynian orogeny, which affected (about 340–310 Ma ago) the majority of the Czech lands with a high intensity and expressed itself by the development of the nappe structure and a very strong metamorphism of large areas . Even the crystalline complexes formed during the Cadomian orogeny were metamorphosed again . Vast massifs of granitoid magmatic rocks of several thousand km2 extent, not yet completely uncovered by denudation, formed practically simultaneously . Their intrusions were accompanied also by extensive surface volcanic activity and the development of very numerous deposits of variable genetic types (e .g . Krušné Hory Mts . massifs and Sn, W, Li, Ag, U, Co, Ni mineralization in the Saxothuringicum or Central Bohemian and Moldanubian Plutons in the Moldanubicum and Au, Sb, Ag, Pb, Zn, U mineralization) . Granitoid massifs represent an important resource of building and dimension stone as well as feldspar raw materials . Weathered crusts of granitoids (e .g . Krušné hory Mts . massifs, Dyje Massif) are an important source of kaolin, too .
There are two different types of the Carboniferous and its rocks in the Bohemian Massif as a result of the Hercynian orogeny . The Mississippian (Lower Carboniferous) is represented in Bohemia only by restricted relics of marine sediments found by drillings under the Bohemian Cretaceous Basin E of Hradec Králové, and by weakly metamorphosed slates in the Ještěd
Fig. 4: Carboniferous and Permian in the Bohemian Massif and in the basement of the Western Carpathians on the territory of the Czech Republic

159Geology and minerals – Geological evolution of the area of the Czech Republic
Ridge SW of Liberec. The sedimentation of the continental type begins in the intra-mountain basins only in the Pennsylvanian (Upper Carboniferous, Westphalian) and continues in the Permian. Basins with partly individual evolution extend in the Plzeň (Pilsen) surroundings towards the North and Northeast as far as the Broumov area in the NE tip of the Czech Republic (Fig. 4), where their stratigraphic extent is the largest and the sedimentation finishes as late as the Lower Triasic. They are to a large extent overlain by sediments of the Bohemian Cretaceous Basin. River and lake deposits – conglomerates, arkoses and shales with layers of tuffs, tuffites and lavas – are in many places accompanied also by formation of coal seams, which were and still are of a high economic importance. Some seams show an elevated U content making them even potential deposits. The Carboniferous arkoses in the Plzeň (Pilsen) and Podbořany regions gave rise to important deposits of kaolin. Carboniferous mainly refractory clay and claystone are important, too. The Bohemian Massif reached the equator on its way to the north and coal formation reflects the dominating tropical climate.
In Moravosilesian area, which was just weakly influenced by the Hercynian orogeny thanks to the solid Brunovistulian basement, the Devonian sedimentation was continuous until the Mississippian (Lower Carboniferous), when the formation of limestones terminated. It was followed by flyshoid sedimentation of conglomerates, greywackes and shales in multiple alternation of individual layers (Culm development). The greywackes represent a resource of a high-quality building stone. The depositional environment gradually changed from marine to fresh-water during the latest Mississippian and the Pennsylvanian (Upper Carboniferous) and important deposits of bituminous coal (paralic basins of the Ostrava, and limnic basins of the Karviná region) formed in the coastal marshes. The Czech part of the Upper Silesian Basin represents the most important bituminous coal mining district in the Czech Republic. The Carboniferous system in the Czech Republic was, and remains, not only an important energy base of the state but also a world-known classical area of Carboniferous flora and fauna.
The Hercynian mountains were rapidly lowered by erosion and denudation in the Permian, and thick formations of red-brown conglomerates, sandstones, arkoses and shales formed. Sedimentation was accompanied also by basaltoid, andesitoid up to rhyolitic volcanism of the intra-plate type and sedimentation of clastic rocks with elevated Cu content. A substantial change of climate, caused by the shift of the lithospheric plate with the Bohemian Massif further north, into the belt between the equator and tropic of Cancer, resulted in the formation of deserts, which covered most of Europe. These sediments are today preserved in the Bohemian Massif only in relics. They reach the highest thickness – up to 3 km – in tectonic troughs of roughly N-S direction, so-called grabens (Boskovice and Blanice grabens). Coal seams (today already mined out) of Upper Stephanian age occur locally on the basis of the Permian in these grabens, and higher horizons contain restricted lake and river calcareous sediments. These are commonly overfilled by relics of Stegocephalians and especially of the Permian insects, which made the Boskovice Graben famous.
The Bohemian Massif was slowly uplifted as a compact block after the Hercynian consolidation and it remained mainly land almost until the end of Mesozoic. White lake sandstones of the Triassic are represented only to minor extent in NE Bohemia in the Krkonoše Mts. Piedmont and Intra-Sudetic Basins. Sea penetrated from the Carpathian area to northern Germany by a narrow channel across northern Bohemia (roughly between Brno and Dresden) in the uppermost Jurassic. This channel linked the deep Tethys on the SE with the shallow shelf sea to the north from the Bohemian Massif. Limestones (Oxfordian–Kimmeridgian) are exposed only in small islands along the Lužice Fault. In the consolidated Bohemian Massif

160Geology and minerals – Geological evolution of the area of the Czech Republic
was the Alpine orogeny represented mainly by origin of faults or rejuvenation of older fault systems. Transgression of the Upper Cretaceous sea, which flooded all the northern and partly also the central part of the Bohemian Massif, was of much higher importance. Several hundreds meters thick strata of the Upper Cretaceous claystones, marlites, sandy marlites and sandstones (the Bohemian Cretaceous Basin – Fig. 5) developed there. The Bohemian Cretaceous Basin is divided into facies areas (developments) shown in Fig. 5 based on character of sedimentation in particular parts of the Basin. Rock complexes of the Basin represent the most important underground water reservoir in the Czech Republic and also an important raw material resource (ceramic and refractory clay, glass, foundry and mortar sand, cement raw materials, building and sculpture stone but also uranium). A small occurrence of Upper Cretaceous sediments near Osoblaha is an extremity of the Polish Opole Cretaceous Basin. Smaller, but fresh-water Upper Cretaceous basins formed also in southern Bohemia. It is the České Budějovice Basin localized more westward and the Třeboň Basin localized more eastward.
The evolution in Moravia was different. The Triassic is not represented at all, whereas in the Jurassic the sea penetrated from the Mediterranean area far to the NW and flooded the eastern margin of the Bohemian Massif. Jurassic sediments are nowadays to a large extent covered by rocks of the Neogene or the Outer Flysh Carpathian nappes. Tectonic blocks of the Jurassic limestones, exhumed from depth in front of the Carpathian nappes and forming isolated klippen by Štramberk and in the Pavlovské vrchy Hills, represent an important land-forming element and also an important resource of very pure carbonate raw material.
The character of the sedimentation in the Outer Carpathians markedly changed in the Cretaceous. Sediments formed in deeper sea from submarine slides and turbidite currents,
Fig. 5: Upper Cretaceous in the Bohemian Massif on the territory of the Czech Republic

161Geology and minerals – Geological evolution of the area of the Czech Republic
transporting clastic material far from the land. They are characterized by multiple alternations of sandy and clayey layers of a low thickness (dm to m) and infrequently also sandstone benches, which are collectively called flysh. The sediments reach even many thousand meters in thickness. The flysh sedimentation continued in this area also in the Paleogene (Fig. 6).
The Bohemian Massif remained land which was only occasionally flooded in the east by shallow epicontinental sea from the Carpathian area. Nevertheless, several depressions with intensive freshwater sedimentation were formed as a result of strong tectonic movements in the Alpine and Carpathian space in the end of the Paleogene and in the Neogene. This is the area of the South Bohemian basins (the České Budějovice Basin and the Třeboň Basin) with lignite, clay and diatomite deposits and also a marked tectonic trough of the SSW-NNE direction (Ohře Rift) in north-western Bohemia, where the Krušné Hory Piedmont basins (Cheb, Sokolov, North Bohemian and Zittau) formed – see Fig. 6. Sandstones and especially clays and claystones with thick (exceptionally and locally up to 60 m) brown coal seams sedimented in these basins. Brown coal deposits in the North Bohemian and Sokolov basins represent the most important brown coal deposits in the Czech Republic. Important deposits of Neogene clays then occur in the Cheb Basin. Formation of basins was accompanied by very intensive volcanic activity and a large accumulation of lavas and pyroclastics (the Doupovské hory Mts. Volcanic Complex, České středohoří). The rocks are mainly various types of olivine basalts and alkaline basaltic rocks, to lesser extent also more acid phonolites. Volcanic conduits and necks give today’s landscape a beautiful character. The main volcanic activity took place 35–17 Ma ago, a younger phase 8 Ma ago and the last minor volcanoes are just several thousand years old (Komorní and Železná hůrka). The area represents a classical example of alkaline volcanism
Fig. 6: Tertiary in the Bohemian Massif and Western Carpathians on the territory of the Czech Republic

162Geology and minerals – Geological evolution of the area of the Czech Republic
and it played an important role in the evolution of geosciences. The rocks are important not only as a building stone but also as a raw material for manufacture of molten basalt products. Deposits of the Bohemian garnets at the southern margin of České středohoří are related to the volcanic activity, too (pyropes were carried up by volcanic necks from the ultrabasic rocks in the crystalline basement). Weathering and decomposition of tuffs of the Doupovské hory and České středohoří Mts. resulted in the formation of important bentonite deposits.
The flysh complexes of the Carpathian area were folded and thrust in the form of nappes (verified by exploration) over a distance of several tens of kilometres towards the west and southwest over the Bohemian Massif in the end of the Paleogene. The Carpathian Foredeep, partly still covered by the arriving nappes, formed in front of the thrust nappes in the Neogene (Miocene). The sediments of the Vienna Basin (of up to 5 km in thickness) were subsequently hardly folded. These are represented mainly by marine clay, marl and sand, just partially diagenetically consolidated, which contain smaller deposits of oil and gas. The depositional setting of the younger formations became progressively fresh-water. The youngest ones contain deposits of lignite.
Important tectonic processes expressing themselves by marked vertical movements of individual crustal segments operated in the Bohemian Massif in the end of the Tertiary and beginning of the Quaternary. In this way, the marginal mountains – Šumava Mts., Český les Mts., Krušné hory Mts., Krkonoše Mts., Orlické hory Mts. as well as Hrubý Jeseník Mts. – were uplifted by up to 1,000 m and the Bohemian basin was formed. This is sometimes considered as being formed by the impact of a large meteorite, but this is a nonsense resulting from the interpretation of satellite images without knowledge of the real structure of the massif. The Bohemian Massif was influenced by several phases of continental and mountain glaciations
Fig. 7: Quaternary division on the territory of the Czech Republic

163Geology and minerals – Geological evolution of the area of the Czech Republic
during the Quaternary. A periglacial climate dominated here, which resulted in the formation of massive stony debris and block-seas, terrace system of the rivers (Fig. 7) as well as really extensive loesses. Terrace sediments of rivers especially form important deposits of sand and gravel and feldspar raw materials, and loesses of brick clays. The continental ice sheet reached as far as the northern margin of the massif and left sediments of frontal moraines in the Ostrava region, on the northern piedmont of the Hrubý Jeseník Mts. and in the Šluknov and Frýdlant extremities. Mountain glaciers modified morphology of the marginal mountains, especially the Krkonoše Mts., to a lesser extent also the Jeseníky Mts. and Šumava Mts., where even minor glacier lakes formed.
Figures in this chapter were adapted by the author from: Dudek, A., Svoboda, J. (1968): Geological position of Czechoslovakia in Europe. – IGC Praha; Geologie České republiky, postcard – ČGÚ [Geology of the Czech Republic, postcard. – Czech
Geological Institute.]; Mísař, Z., Dudek, A., Havlena, V., Weiss, J.(1983): Geologie ČSSR. I. Český masiv. – SPN
Praha [Geology of the Czechoslovak Socialist Republic. I. Bohemian Massif. – State Pedagogic Publishing House];
Zpráva Československé stratigrafické komise (1992): Regionálně geologické dělení Českého masivu na území České republiky. – Časopis min. geol., 37, 257–276, Praha [Report of the Czech Stratigraphic Commission (1992): Areal geological division of the Bohemian Massif on the territory of the Czech Republic. – Journal for Mineralogy and geology, No. 37, 257–276, Praha]

164Geology and minerals – Regional geological units and minerals associated with them
Regional geological units and minerals associated with them
Arnošt Dudek
Bíteš orthogneiss – mostly muscovitite orthogneiss of the Cadomian age, characteristic of the Moravicum of the Dyje and Svratka domes between Krems in Austria and Svojanov in the Czech Republic (opal, kaolin, crushed stone) – Fig . 3 – unit 5a
Blanice Graben – fault system of the NNE-SSW direction in central and southern Bohemia, marked also by downthrown islands of the uppermost Carboniferous and Permian with hard coal an anthracite seams . It continues as Rodel line in Austria (Au-Ag-ores) – Fig . 4 – unit 4b
Bohemian Cretaceous Basin – sediments of the Upper Cretaceous (Cenomanian to Santonian), overlying mainly crystalline complexes and Upper Paleozoic rocks in the northern part of the Bohemian Massif. Based on the lithological character, it has been regionally classified into facial developments as follows:
– Lužice (U-Zr-ores, glass and foundry sand) – Fig . 5 – unit 1a– Jizera (glass and foundry sand, dimension stone) – Fig . 5 – unit 1b – Orlice-Žďár (foundry sand) and its east Bohemian (clays) and Moravian parts (clay) Fig . 5 –
unit 1d – Ohře (Eger) – the Most, Teplice (quartzite, corrective additives for cement production) and
Louny part (clay) Fig . 5 – unit 1e– Vltava-Beroun including Prague surroundings (clay, dimension stone) Fig . 5 – unit 1f Boskovice Graben – tectonic trench of the NNE-SSW direction in western Moravia filled with
sediments of the uppermost Carboniferous and Permian (hard coal) Fig . 4 – unit 4aBory granulite massif – a small granulite body in the Moldanubicum N of Velké Meziříčí in
western Moravia (feldspar, crushed stone) – Fig . 4 – unit 4aBrno Massif – a large massif in western Moravia built by a variable series of both acid and
basic plutonic rocks of the Cadomian age (feldspar, crushed stone) – Fig . 2 – unit 10Carpathian Flysh – a part of the Outer Carpathians in eastern Moravia built by clayey and sandy
Cretaceous and Paleogene sediments, with a marked nappe structure of the pre-Miocene age . It composes the Chřiby Mts. and the Ždánice Forest and mountain ranges on the border with Slovakia – the Beskydy, Javorníky and Bílé Karpaty Mts . (natural gas) – Fig . 6 – unit 4c
Carpathian Foredeep – the external part of the Carpathian mountain chain in eastern Moravia, which was formed in front of the Outer Carpathian nappes and overlies the south-eastern slope of the Bohemian Massif. It is filled with the Miocene sediments of the Egerian to Badenian (oil, natural gas, clay, bentonite, gypsum in the Opava Basin) – Fig . 6 – unit 4a
Central Bohemian Pluton – an extensive Hercynian granitoids pluton on the border between Bohemicum and Moldanubicum, more basic than the massifs of the Krušné hory Mts . and in Českomoravská vrchovina Highlands (granodiorites, tonalite, diorite). Important deposits in the exocontact (U, Au, Ag-Pb-Zn-ores, feldspar, quartz, dimension and building stone) – Fig . 2 – unit 6

165Geology and minerals – Regional geological units and minerals associated with them
Cheb Basin – the westernmost of the Tertiary basins, at the crossing of the Ohře rift and the Tachov Graben . Sedimentation continued from Eocene until Pliocene (brown coal, kaolin, clay, diatomite, glass and foundry sand – numerous conflicts of interest) – Fig. 6 – unit 1a
České Budějovice Basin – a smaller, western basin of South Bohemian basins, filled with fresh-water sediments of the Upper Cretaceous and to a minor extent Neogene and Quaternary . Episodic ingressions of the sea from the Alpine foredeep (lignite, tectites, diatomite, sand and gravel) – Fig . 6 – unit 3a
České středohoří Mts. – a classical area of the Tertiary alkaline volcanic rocks (olivine basalts to phonolites) exposed in the Ohře (Eger) rift between Chomutov and Nový Bor, with the main volcanic centre in Roztoky nad Labem (pyrope, diatomite, feldspar substitutes, crushed stone) – Fig . 6 – unit 2b
Čistá-Jesenice Massif – a minor granitoid massif in western Bohemia composed of both Cadomian and Hercynian bodies . It is covered from a large part by Carboniferous and Permian sediments (feldspar, dimension and building stone) – Fig . 2 – unit 4
Domažlice Crystalline Complex – south-western part of the upper Proterozoic of the Bohemicum in the Šumava piedmont, metamorphosed during both Cadomian and Hercynian orogeny, with minor massifs of granitoids and gabbroic rocks and abundant pegmatites (feldspar) – Fig . 2 – unit 17
Doupovské Hory Mts. – a volcanic complex of the Tertiary age at the crossing of the Ohře rift with the Jáchymov fault, between Karlovy Vary and Kadaň. Alkaline volcanic rocks are represented mainly by olivine basalt, “leucitic” tephrite and abundant tuffs . Phonolites are missing (bentonite, crushed stone) – Fig . 6 – unit 2a
Dyje Massif – a massif of the Cadomian granitoids in the Dyje Dome of the Moravicum in SW Moravia, extending from the northern vicinity of Znojmo almost to Danube . It was affected by a strong tropical weathering in the Jurassic and Neogene and from a large part covered by sediments of the Carpathian foredeep (kaolin, feldspar, building stone) – Fig . 2 – unit 11
Hroznětín Basin – the northern extremity of the Sokolov Basin N of Karlovy Vary (bentonite) – Fig . 6 – unit 1b
Intra-Sudetic Basin – southern extremity of the Lower Silesian Basin in the NE tip of Bohemia, with sedimentary fill from the Mississippian (Lower Carboniferous) to Upper Cretaceous about 3,000 meters in thicknes, and Pennsylvanian and Permian volcanites . (hard coal) – Fig . 4 – unit 3a
Islet zone of the Central Bohemian Pluton – a number of both large and minor blocks of the contact metamorphosed Proterozoic and Lower Paleozoic rocks from the mantle of the pluton, downthrown into granitoids (Au, building stone, barite, limestone) – Fig . 2 – unit 6
Jílové Belt – a belt of the Upper Proterozoic volcanic (basalt, andesite, boninite and rhyolites), subvolcanic and acid plutonic rocks extending over 120 km in NNE-SSW direction south of Prague, from a major part enclosed in granitoids of the Central Bohemian Pluton (Au-ores, building stone) – Fig . 2 – unit 6
Kdyně Massif – a complex of metabasic, gabbroic and dioritic rocks in the Domažlice Crystalline Complex on the border of Šumava and Bohemian Forest (dimension and building stone) – Fig . 2 – unit 12
Kladno-Rakovník Basin – one of the basins of the Central Bohemian limnic Carboniferous, partly covered by Cretaceous sediments (hard coal, kaolin, claystone) – Fig . 2 – unit 12
Krkonoše-Jizera Crystalline Complex – western part of the Lužice area built by metamorphic rocks of the Proterozoic and Lower Paleozoic age (limestone, dolomite) and intruded by

166Geology and minerals – Regional geological units and minerals associated with them
plutons of the Cadomian (Lužice) and Hercynian (Krkonoše-Jizera) age (feldspar, dimension and building stone). Fe-bearing skarns, Sn and W-ores, fluorite and barite occur in the exocontact of the plutons – Fig . 2 – unit 14
Krkonoše-Jizera Massif – Hercynian granitoid massif building the border range with Poland (excellent dimension stone, feldspar) – Fig . 2 – unit 2
Krkonoše Mts. piedmont basin – one of the Sudetic (Lugian) Upper Paleozoic basins partially covered with Cretaceous sediments . Formations encompass Westphalian C, Stephanian, whole Permian and extend up to the lowermost Triasic (Cu-ores, Au paleoplacers, bituminous coal, pyrope) – Fig . 4 – unit 3c
Krušné hory Mts. Piedmont basins – a group of limnic Tertiary basins associated with the Ohře Rift SE of the Krušné hory Mts. From WSW to ESE, these are: Cheb, Sokolov and North Bohemian basins . – Fig . 6 – unit 1
Krušné hory Mts. Pluton – a large Hercynian granitoid pluton underlying metamorphic rocks of the Krušné Hory and Smrčiny Mts., exposed by erosion only in numerous partial massifs (Sn-W-ores, kaolin, feldspar, quartz, building stone) – Fig . 2 – unit 3
Krušné hory Mts. Crystalline Complex – a part of the Saxothuringicum built by metamorphic complexes mostly of the Proterozoic, subordinately also of the Lower Paleozoic age (U, Ag, Bi, Co, As-ores, Cu-ores, Sn-skarns, fluorite, barite, kaolin) and intruded by Hercynian granitoids . – Fig . 3 – unit 3 (Fig . 2 – unit 15)
Lužice Massif – an extensive Cadomian granitoids massif predominantly on the German territory, extending into the Jizera Mts . (quartz, dimension and building stone) – Fig . 2 – unit 1
Moldanubian Pluton – the largest Hercynian granitoids complex in the Bohemian Massif in Českomoravská vrchovina Highlands, Šumava and Waldviertel (dimension and building stone; Au-W and U-ores and Ag-Pb-Zn-ores in the exocontact) – Fig . 2 – unit 8
Moldanubicum – basement of the southern part of the Bohemian Massif built by high-grade metamorphic complexes of Proterozoic and probably also Lower Paleozoic age . The cadomian tectonometamorphic processes were followed by hercynian high temperature and low pressure metamorphism and whole complex was penetrated by numerous late-Hercynian granitoid plutons . – Fig . 3 – unit 1
Moravian-Silesian Devonian – weakly metamorphosed volcano-sedimentary unites in the Jeseníky Mts . – Vrbno Strata, Šternberk-Benešov Belt (Fe-ores, Cu-ores, Pb-Zn-ores, barite, quartzite, dolomite) – Fig . 2 – unit 19
Moravian-Silesian Carboniferous – marine flyshoid Mississippian (Lower Carboniferous) of the Nízký Jeseník Mts. and Drahany Highlands (slate, quartz) and productive paralic Mississippian to limnic Pennsylvanian (Upper Carboniferous) of the Ostrava region (Upper Silesian Basin – hard coal, natural gas) – Fig . 4 – unit 1, 2
Mšeno-Roudnice Basin – one of the Central Bohemian Carboniferous to Permian basins, completely overlain by the Bohemian Cretaceous Basin (hard coal) – Fig . 4 – unit 3g
Nasavrky Massif – a minor however very complex Hercynian granitoid body exposed in the Železné hory Mts. (pyrite, dimension and building stone; fluorite and barite in the exocontact) – Fig . 2 – unit 7
North Bohemian Basin – the largest Tertiary basin of the Ohře Rift between the Doupov Mts. and České středohoří Mts. (brown coal, clay, bentonite, diatomite, quartzite) – Fig. 6 – unit 1c
Ohře rift – a prominent fault structure in the south-eastern piedmont of the Krušné hory Mts . delimited by the Krušné hory and Litoměřice faults and their directional continuations.

167Geology and minerals – Regional geological units and minerals associated with them
Tertiary alkaline volcanites, coal-bearing basins and mineral as well as thermal waters are associated with the rift – Fig . 3 – unit 3a
Orlické hory Mts.-Kłodzko Crystalline Complex – metamorphic complexes of probably Proterozoic age in the eastern part of the Lužice area in the Orlické hory and Rychleby Mts. and in Kłodzko – Fig. 2 – unit 18
Outer klippen zone of the Western Carpathians – extensive fragments of Jurassic and Cretaceous sediments brought up from depth in front of the flysh nappes – Štramberk, Pavlovské vrchy (limestone) – Fig . 2 and 6 – unit 4c
Plzeň Basin – an independent basin at the SW margin of the West Bohemian Carboniferous (hard coal, kaolin, clay) – Fig . 4 – unit 3a
Quaternary alluvia – alluvia and terraces of majority of larger water courses (feldspar, sand and gravel, in south Bohemia and SW Moravia also tectites) – Fig . 7 – units B2a, B2b, B2f
Quaternary placers – in piedmont of the Šumava and Jeseníky Mts . (Au), Krušné Hory Mts . (Sn), southern piedmont of the České středohoří Mts. (pyrope)
Sokolov Basin – the smallest Tertiary basin of the Ohře Rift WSW of the Doupovské hory Mts. with important deposits of energy minerals (brown coal, U, clay, bentonite) – Fig . 6 – unit 1b
South Bohemian Basins – freshwater sedimentation space of the Upper Cretaceous and Tertiary age, where the Rudolfov horst separates the smaller České Budějovice Basin in the west from the larger Třeboň Basin in the east – Fig. 6 – unit 3
Svratka Dome of the Moravicum – the northern of the domes built by metamorphic rocks of the Moravicum W of Brno (graphite, feldspar, limestone, building stone) – Fig . 3 – unit 5a
Syrovice-Ivaň terrace – a higher located Quaternary terrace between the Jihlava and Svratka rivers S of Brno (feldspar) – Fig . 7 – unit B2f
Teplá Crystalline Complex – the NW part of the Proterozoic of the Central Bohemian area (Bohemicum) with a rapid succession of metamorphic zones from SE to NW into the Slavkov les Forest (feldspar) – Fig . 2 – unit 16
Tertiary relics of the Plzeň region – relics of the formerly more extensive Tertiary sediments on the site of a river paleostream discharging into the North Bohemian Basin (clay, bentonite) – not shown on scale of the maps
Třebíč Massif – an extensive massif of the Hercynian melanocratic granitoids and syenitoids (durbachites) in the Českomoravská vrchovina Highlands (amethyst, morion, feldspar, dimension stone) – Fig . 2 – unit 9
Třeboň Basin – a larger, eastern basin of South Bohemian basins with continental Cretaceous and Teriary sediments (kaolin, clay, bentonite, diatomite) – Fig . 6 – unit 3b
Upper Silesian Basin – a Pennsylvanian (Upper Carboniferous) basin situated predominantly in Poland and extending to the Czech Republic only by its SW part . It is formed by volcanoclastic sediments with numerous hard coal seams . On the Czech territory, it is further subdivided into i) western, more mobile paralic Ostrava part, ii) eastern, platform limnic Karviná part and iii) southern Beskydy part (hard coal, natural gas) – Fig . 4 – unit 2
Variegated Group of the Moldanubicum – metamorphic complexes of paragneisses and migmatites with numerous intercalations of amphibolites, marbles, quartzites, graphitic rocks and skarns (Fe-skarns, graphite, feldspar, limestone, dolomite, fluorite, building stone) – part of the Modanubian unit 1, in Fig . 3
Vienna Basin – an extensive Tertiary Neogene basin with marine sedimentary fill gradually becoming freshwater of more than 5,000 m in thickness (lignite, oil, natural gas) – Fig . 6 – unit 4b

168Geology and minerals – Regional geological units and minerals associated with them
Železné hory Mts. area – part of Bohemicum built by weakly metamorphosed volcanosedimentary series of the Upper Proterozoic and sediments of the Lower Paleozoic (Mn-Fe-carbonates, pyrite, fluorite, barite, limestone) and the Hercynian granitoid Nasavrky Massif – Fig. 2 – unit 20
Zittau Basin – a Tertiary basin in the continuation of the Ohře Rift, extending only by a negligible south-eastern extremity into the Czech territory (brown coal, lignite, clay) – Fig . 6 – unit 1d
Žulová Massif – a minor Hercynian granitoid massif in the northern tip of the Moravian-Silesian area (kaolin, quartz, dimension and building stone) – Fig . 2 – unit 5

169Geology and minerals – Geodynamics of the or igin of the Bohemian Massif
Geodynamics of the origin of the Bohemian Massif covering the territory of the Czech Republic
Karel Schulmann, Vojtěch Janoušek, Ondrej Lexa
The Bohemian Massif represents one of the largest exposure of the European Variscan belt located at its eastern extremity (Figure 1). The Variscan architecture of the Bohemian Massif can be defined by four major tectonic units: 1) The Saxothuringian Neoproterozoic continental basement with its Palaeozoic cover, 2) The Teplá-Barrandian (Bohemicum) Neoproterozoic basement and its Early Palaeozoic cover of the Prague Basin (the Bohemia Terrane of South Armorica), 3) The Moldanubian high- to medium-grade metamorphic unit intruded by numerous Carboniferous granitic plutons, altogether forming the high-grade core of the orogen, 4) The easterly Brunia Neo-Proterozoic basement with Early to Late Palaeozoic cover.
The Gondwana faunas of Lower Palaeozoic (Cambrian and Ordovician) sediments of the Saxothuringian and Teplá-Barrandian domains and numerous isotopic and U-Pb zircon data imply affinity to northern Gondwana margin. Schulmann et al. (2009) suggested that the Variscan structure of the Bohemian Massif resulted from Andean type convergence and formed as a typical upper plate orogen located above a long lasting Devonian-Carboniferous subduction system. These authors showed that all the current criteria defining an Andean type of convergent margin are present and surprisingly well preserved. In particular it is: 1) the development of blueschist facies metamorphism along the Saxothuringian margin, 2) calc-alkaline to potassium rich (shoshonitic) arc type magmatism in distance 150–200 km from the suture zone (Žák et al., 2005), 3) back-arc basin developed on continental upper plate crust later replaced by thick continental root (Schulmann et al., 2005), 4) deep granulite facies metamorphism associated with supposed underplating of the crust by mafic magmas at the bottom of the root and 5) continental lithosphere underthrust underneath the thickened root system. Based on these criteria, the architecture of the eastern Variscan belt is interpreted as the result of a large-scale and long-lasting subduction process associated with crustal tectonics, metamorphism, magmatic and sedimentary additions that developed over the width of at least 500 km, in present coordinates, and time scale of ~80 Ma.
Present day architecture of the Bohemian Massif and location of Palaeozoic sutures Saxothuringian is represented by Neoproterozoic par-autochthon represented by migmatites and paragneisses dated at ~580 -550 Ma. These rocks are intruded by Cambro-Ordovician calc-alkaline porphyritic granodiorites converted to augen orthogneiss during the Variscan orogeny. The basement is unconformably covered by Cambrian and Ordovician sequences overlain by Late Ordovician to Fammenian pelagic sediments and Famennian to Visean flysh. The par-autochthon is thrust by allochthonous units containing deep water equivalents of the Ordovician to Devonian rocks of the para-autochthon and proximal flysh sediments.
The allochthonous are represented by pile of thrust sheets marked by decreasing pressure and metamorphic age from the top to the bottom (Franke, 2000; Konopásek and Schulmann, 2005).

170Geology and minerals – Geodynamics of the or igin of the Bohemian Massif
In the highest structural position occur thrust sheets with metabasites of Ordovician protolith age eclogitized during Devonian (~395 Ma). Structurally deeper occur sheets associated with middle pressure assemblages and Late Devonian zircon and Hbl cooling ages (~365 Ma). This rock pile represents Late Ordovician to Devonian passive margin imbricated during Devonian convergence. In the Sudetic part (Figure 1, Figure 2a-c) of the Bohemian Massif, the Ordovician rift sequences are characterized by the presence of deep marine sediments and MORB type volcanics followed by Silurian and Devonian sedimentary sequences. The Ordovician oceanic rocks are metamorphosed at blueschist-facies conditions probably at Late Devonian.
The oceanic subduction stage was followed by Carboniferous continental subduction of the Saxothuringian continental rocks underneath easterly Teplá-Barrandian block which was responsible for the eclogitization of continental crust at ~350 – 340 Ma (Schmädicke et al., 1995). This event is responsible for the global reworking of the Saxothuringian at high pressure conditions, thrusting of subducted continental crust and exhumation of deep rocks.
Figure 1. Plate tectonic map of the Bohemian Massif

171Geology and minerals – Geodynamics of the or igin of the Bohemian Massif
Figure 2b. Architectural evolution of the Bohemian Massif – Devonian stage
Figure 2a. Architectural evolution of the Bohemian Massif – Ordovician stage
suture zone
suture zone

172Geology and minerals – Geodynamics of the or igin of the Bohemian Massif
The Saxothuringian – Teplá-Barrandian boundary is characterized by presence of units with high proportions of ultramafic and mafic high pressure rocks (Figure 1). Represented by serpentinites at the bottom and thick body of amphibolites, eclogites and metagabbros (Medaris et al., 1995). The protolith of gabbros and eclogites was dated as Cambrian and Ordovician while the Devonian metamorphic and cooling ages range between 410 and 370 Ma. The metamorphic evolution started with eclogite-facies metamorphism and terminated by granulite and amphibolite-facies retrogression. These rocks are interpreted as the oceanic fragment at suture position.
Teplá-Barrandian (the Bohemicum) consists of Neoproterozoic basement with the lower arc-related volcano-sedimentary sequence, followed by siliceous black shales and a flyshoid sequence (shales, greywackes and conglomerates. The Neoproterozoic basement is unconformably overlain by a thick sequence (1500–2000 m) of Lower Cambrian conglomerates, graywackes, and sandstones and Upper Cambrian volcanics. The Lower Palaeozoic Prague Basin is characterized by Early Ordovician (Tremadocian) transgression followed by mid-Ordovician rift related volcanics. Sedimentation of Silurian graptolite shales was associated with important volcanic activity accompanied by basaltic and ultramafic intrusions. The sedimentation continued from Upper Silurian to Devonian by carbonate dominated sequence and terminated at mid-Devonian with Givetian calc turbidites.
The whole sedimentary package is folded by steep folds presumably of Late Devonian age as indicated by Culm facies sediments unconformably deposited on folded Early Paleozoic strata.
Metamorphic zones and facies: Ky – kyanite zone, St – staurolite zone, amphibolite facies, Grt – granulite facies, Bt – blueschist facies
Figure 2c. Architectural evolution of the Bohemian Massif – Carboniferous stage
suture zone

173Geology and minerals – Geodynamics of the or igin of the Bohemian Massif
The deformation affected also the underlying Neoproterozoic basement, with the intensity and age increasing progressively to the west (Zulauf, 2001). In the same direction rises also the metamorphic degree, reaching amphibolite-facies conditions close to the Teplá-Barrandian/Saxothuringian boundary. In this area is developed a typical Barrovian metamorphic zonation ranging from biotite zone in the east up to kyanite zone in the west dated at middle Devonian by 40Ar/39Ar method (Dallmeyer and Urban, 1988).
The Teplá-Barrandian and Moldanubian domain boundary is masked by the Central Bohemian Plutonic Complex. Its activity started with intrusions of calc-alkaline Devonian (~370 Ma) tonalites to granodiorites transformed into orthogneisses. The first unmetamorphosed plutonic rocks were Late Devonian (~354 Ma) calc-alkaline tonalites, granodiorites, trondhjemites, quartz diorites and gabbros. The source of the basic magmas was a slightly depleted mantle above a subduction zone. Further south/southeast occur Early Carboniferous (~349–346 Ma) high-K calc-alkaline plutonic bodies (mainly granodiorites with minor quartz monzonite and monzogabbro bodies). The intermediate rock types resulted from mixing of slightly enriched mantle-derived and crustal magmas. Finally, further east occur syn-deformational bodies or post-tectonic elliptical intrusions of magnesio-potassic rocks of mid-Carboniferous (~343–337 Ma) ages. The plutonic bodies contain numerous xenoliths, screens of the Barrandian-like Palaeozoic and Neo-Proterozoic rocks.The Central Bohemian Plutonic Complex is interpreted as a relatively shallow section (< 10 km) through the Devonian-Carboniferous magmatic arc, which widened and expanded to the east with time.
The Moldanubian is subdivided into two tectonic units: The Drosendorf Unit composed of the “Monotonous Group” represented by Proterozoic metasediments, with numerous Late Proterozoic to Early Palaeozoic orthogneisses, quartzites and amphibolites and the “Varied Group” composed of plagioclase-bearing paragneiss quartzites and marbles intercalated with amphibolites and leptynites (Tollmann et al., 1982). The protoliths of varied metasediments are supposed to be at least partly Early Palaeozoic in age. Structurally highest is the “Gföhl Unit” composed of orthogneiss with Ordovician protolith ages, amphibolitized eclogites, granulites, garnet- and spinel-bearing peridotites surrounded by felsic migmatites.
Two NW-SE trending belts of high-pressure rocks (granulites, eclogites and peridotites) are distinguished: the western belt located close to the Barrandian–Moldanubian boundary, and the eastern belt rimming the eastern margin of the Bohemian Massif (Medaris et al., 1995). These two belts alternate with NW-SE trending wide belts represented by the Varied and Monotonous groups.
The amphibolite-facies metamorphism developed on the regional scale in the Drosenforf Unit and reflects maximal pressures of 10 kbar at temperatures of 650–700 °C. However, higher grade (eclogitic) boudins have been identified, generally at the boundary between both groups. Metamorphism of the Gföhl unit is characterized by early eclogite facies followed with granulite-facies and amphibolite-facies retrogression (O’Brien and Rötzler, 2003). The age of early high-pressure metamorphism was probably Late Devonian and the granulite-facies overprint is of Viséan age as shown by a number of zircon ages.
The deformation history in the Moldanubian Zone reveals early vertical NNE-SSW trending fabrics, associated with crystallization of high-pressure mineral assemblages. These steep foliations are reworked by flat deformation fabrics that are associated with medium- to low-pressure and high-temperature mineral assemblages. The subhorizontal foliations bear intense NE-SW trending mineral lineation that is commonly associated with generalized ductile flow towards NE. The early sub-vertical fabrics is dated at 350 to 340 Ma, while the ages for the

174Geology and minerals – Geodynamics of the or igin of the Bohemian Massif
sub-horizontal vary around 335 Ma. In the SW part of the Moldanubian domain, younger set of steep NW-SE metamorphic fabrics reworks the flat foliation, having been associated with low-pressure metamorphic conditions at around 325–315 Ma (Schulmann et al., 2005).
The Moldanubian metamorphic units are commonly intruded by numerous Variscan plutons including magnesio-potassic syenites to melagranites (durbachites), and S-type granitoids. The magnesio-potassic syenites to melagranites are spatially, structurally and temporally associated with high-pressure granulites (Janoušek and Holub, 2007). These rocks have isotopic signatures indicating a metasomatized lithospheric mantle source, presumably contaminated by subducted mature crustal material.
The Moldanubian – Brunia continental transition zone was defined as a zone of medium grade metamorphism called the Moravo-Silesian Zone (Suess, 1926). This zone of intense deformation resulted from thrusting of the Moldanubian over Brunia continent to the east. The contact between these units is marked by a particular unit, the Moravian “micaschist zone”, which is composed of kyanite-bearing micaschists. This first order tectonic boundary contains boudins of eclogites, high-pressure granulites and peridotites embedded in the metapelites of both Moravian and Moldanubian parentage order tectonic boundary.
The underlying Moravo-Silesian Zone is characterized by two nappes composed of orthogneiss at the bottom and metapelite sequence at the top. This nappe sequence is overlying Neoproterozoic basement which is often imbricated with Pragian to Givetian cover. The orthogneisses of the Moravian Zone are derived from the underlying Brunia continent. This zone of intense deformation, 50 km wide and 300 km long, is marked by a tectonically inverted metamorphic sequence ranging from chlorite to kyanite-sillimanite zones. The metamorphism is interpreted as a result of continental underthrusting associated with intense top to the NNE oriented shearing. The subsequent deformation is connected with recumbent folding and imbrication of Neoproterozoic gneisses with Devonian cover. The age of this later phase is constrained at 340 – 325 Ma 40Ar/39Ar ages (Fritz et al., 1996).
The Brunia continent originally called the Brunovistulicum by Dudek (1980) consists of Neoproterozoic migmatites and schists dated at ~680 Ma and intruded by 550 Ma old granites. This basement is unconformably overlain by Cambrian and Ordovician strata followed by Lower Devonian quartzites and conglomerates and Givetian carbonate platform sedimentation. Since Early to Late Carboniferous (~350 – 300 Ma), foreland sedimentary environment developed resulting in deposition of 7.5 km thick Variscan flysch (Culm facies). Low-grade source rocks gradually pass to high-grade metamorphic source material marked by pyrope-rich mineral fraction and granulite pebbles dated at 340 – 330 Ma (Hartley & Otava, 2001, Kotková et al., 2007). Since 310 Ma deformation started of the flysch basin characterized by metamorphism and intense deformation in the west. The deformation terminated by folding of molasse sediments at ~ 300 Ma.
Geodynamic evolution of the Bohemian MassifThe succession of tectonic events (Figure 3) can be interpreted in terms of south-eastward (in the present-day coordinates) oceanic subduction of large Saxohuringian ocean underneath an active continental margin, obduction of the passive margin units, formation of a fore-arc region, growth of a magmatic arc and development of a large-scale back-arc system on the continental lithosphere. The early Saxothuringian oceanic subduction event was followed by a continental underthrusting of Saxothuringian continent leading to gradual flattening of the subduction

175Geology and minerals – Geodynamics of the or igin of the Bohemian Massif
zone marked by eastward migration of arc depocenters and subsequent crustal thickening. The latter event was responsible for the development of a thick continental root at the expense of the upper plate composed of the Teplá-Barrandian and Moldanubian units. The final evolution is marked by the continental indentation of easterly Brunia continent, exhumation of the Moldanubian lower crust, collapse of the Teplá-Barrandian and Moldanubian thrusting over Brunia platform.
Early Devonian oceanic subduction underneath the continental margin (Figure 4) is marked by relics of Ordovician to Lower Devonian passive margin metamorphosed under blueschist–eclogite facies conditions indicating a Mid-Devonian oceanic subduction. These units are obducted above a continuously underthrust continental Saxothuringian plate. The Barrovian metamorphic zonation and related deformation in the overriding Teplá-Barrandian continental margin are interpreted as ductile part of the Barrandian crust extruded during early stage of upper plate Late Devonian shortening. The steep folding of central part of anchimetamorphic Barrandian Neoproterozoic sequences is interpreted as a same deformation event but occurring in more shallow crustal levels. The subduction of a Saxothuringian oceanic crust underneath the Tepla-Barrandian crust is responsible for the origin of a magmatic arc represented by Devonian calc-alkaline orthogneisses and tonalities of the Central Bohemian Magmatic Complex and by isolated granodiorite stocks intruding Neoproterozoic sediments. At this stage the Barrandian basin operated as fore-arc domain as it is indicated by Devonian zircons in the sediments of the same age in the Prague basin. It is difficult to evaluate the original depositional origin of Moldanubian metasediments, metabasites and other high grade rocks due to severe and polyphase reworking.
Figure 3. Chronological chart of tectonic events forming Bohemian Massif

176Geology and minerals – Geodynamics of the or igin of the Bohemian Massif
Amphibolites derived from Siluro-Devonian tholeiitic basalts associated with carbonates, widespread in Lower Austria and south Bohemia, are interpreted as volcanic products of a large-scale back-arc system. In addition, the felsic metavolcanics and amphibolite layers in the Varied Group are regarded as continuity of back-arc bimodal volcanism till Givetian. The back-arc hypothesis corroborates with impressive amount of marbles with high Sr isotopic ratios that indicate shallow marine environment during Palaeozoic. A back-arc environment is further supported by bimodal volcanic activity in narrow Devonian basins developed on the north-eastern margin of the Brunia continent suggesting only minor thinning of continental crust at the easternmost termination of the back-arc system. In this concept the rest of Brunia represents a stable continental domain not affected by the back-arc spreading.
The Barrandian became a for-arc region, while the future Moldanubian continued to evolve as a crustal back-arc system. The position of high-pressure rocks, existence of the Mariánské Lázně Complex at suture position and location of calc-alkaline magmatic rocks confirm a polarity of the oceanic subduction underneath the easterly fore-arc and magmatic arc system during Late Devonian. The distance of the arc from the trench area represented by the suture indicates that the dip of subduction zone was probably moderate (30–40 degrees). The migration of magmatic centres to the east associated with temporal evolution of magma geochemistry from calc-alkaline to more potassic/shoshonitic affinities (from 370 to 336 Ma) are compatible with flattening of the subduction zone during Early Carboniferous.
The Carboniferous crustal thickening is recognized in all units except the Teplá-Barrandian. The Saxothuringian domain is characterized by the arrival of the continental crust and its subduction underneath the easterly Teplá-Barrandian–Moldanubian. The main thrust boundary migrated further west, so that the continent was thrust underneath the fossil Devonian suture and former fore-arc region. At the same time the deformation regime changed in the far field back-arc region, which recorded progressive thickening of the whole previously thinned and thermally softened domain. Recent structural studies have shown that the earliest preserved fabrics have been sub-horizontal, which may indicate that the lower crustal material was flowing horizontally from the area of subduction channel towards region of easterly back stop.
Indeed, the influx of lower crustal material transported by east dipping Saxothuringian continental subduction zone underneath the fore arc (Teplá-Barrandian) and subsequently towards the former back-arc domain is regarded to be at the origin of the future “Gföhl Unit”. This hypothesis is in line with the whole-rock geochemical and Sr-Nd isotopic composition as well as the zircon inheritance patterns in the Moldanubian HP-HT granulites. Importantly, the crustal material involved in the subduction and extruded over the sub-arc and sub-back arc mantle lithosphere may have developed voluminous high-pressure granulites known from many regions of the Bohemian Massif. Alternatively, the back-arc domain with inherited high thermal budget from Devonian stretching may have been thickened and the partially molten lower crust may have been transported downwards and transformed to high-pressure granulites.
The onset of thickening of the root is not recorded in the Teplá domain, which behaved as a supra-structural domain at this time, but it is shown by deformation in the Barrandian domain. Here, the steep fabric is well dated by adjacent syntectonic calc-alkaline plutons at about 355–345 Ma. In contrast to the west, the eastern sector records onset of loading of the Brunia platform at Tournaisian manifested by sedimentation of coarse basal clastics and destruction of the Givetian carbonate platform.

177Geology and minerals – Geodynamics of the or igin of the Bohemian Massif
Late Visean exhumation of orogenic lower crust of the upper plate during Early Carboniferous is exemplified by the two NE–SW trending belts of granulites, eclogites and peridotites initimately associated with the magnesio-potassic plutons. The first belt, recognized west of the magmatic arc, was exhumed along huge west dipping detachment zone, which was also responsible for collapse of the upper part of the magmatic arc system and downthrow of the whole Barrandian section. Such a huge vertical material transfer could have been responsible for vertical exchange of lower crustal and upper crustal material in a range of 50 km with final throw of 15 km. The cooling ages from the lower crustal domain show that the granulites passed the 300 °C isotherm during Carboniferous, suggesting that the lower crustal bulge reached very shallow position in the upper plate.
Figure 4. Geodynamics of the Bohemian Massif

178Geology and minerals – Geodynamics of the or igin of the Bohemian Massif
The second lower crustal belt rims the eastern margin of the Bohemian Massif, i.e. the boundary with the Brunia continent. Here the fabric of granulites is also vertical and is interpreted in terms of massive vertical exchanges with orogenic middle crust. The zone of lower crustal bulge is interpreted as enormous anticline extrusion surrounded by middle crust coevally transported downwards in form of huge crustal scale synforms. The model of vertical extrusion is based on the concept of buckling of lower and mid-crustal interface followed by growth of crustal scale antiforms. This process is thought to be triggered by rheological and thermal instabilities in the arc region, while to the east it is forced by rigid back-stop, preserved only locally.
However, the most important feature of the eastern Variscan front is the development of horizontal fabrics in the Moldanubian root zone, parallel to the Brunia continental margin. The intense deformation of the Brunia leading to the formation of Moravo-Silesian imbricated nappe system, the origin of crustal mélange forming the Moravian micaschist zone and mixed high-pressure rocks and migmatites in the overlying Moldanubian nappe have been recently interpreted in terms of indentation of the Brunia continent into the hot and thick continental root. This lower crustal indentation and flow of hot lower crustal rocks in supracrustal levels are consistent with the model of continental channel flow driven by arrival of crustal plunger, a model which is advocated for two decades for the deformation of the Eastern Cordillera in the Andes. Finally, the load of Brunia platform related to deep indentation process, leads to the development and easterly propagation of the foreland basin associated with progressive involvement of the early clastic basin infill into the channel flow process. In our model (Schulmann et al., 2008) as the hot Moldanubian rocks advances over the Brunia platform, the imbricate footwall nappe system of the Moravian zone is generated and thrust over the foreland basin rocks.
ReferencesDallmeyer, R.D. & Urban, M. 1998. Variscan vs Cadomian tectonothermal activity in
northwestern sectors of the Teplá-Barrandian zone, Czech Republic: constraints from 40Ar/39Ar ages. Geologische Rundschau, 87, 94–106.
Dudek, A., 1980. The crystalline basement block of the Outer Carpathians in Moravia. Rozpravy Československé Akademie Věd, 90, 1–85.
Franke, W., 2000. The mid-European segment of the Variscides: Tectonostratigraphic units, terrane boundaries and plate tectonic evolution. In: Orogenic processes: Quantifica tion and modelling in the Variscan belt. (ed Franke, W., Haak, W. Oncken, O. and Tanner, D.) 179, 35–63, Geological Society Special Publication, London.
Fritz, H., Dallmeyer, R. D. & Neubauer, F., 1996. Thick-skinned versus thin-skinned thrusting: Rheology controlled thrust propagation in the Variscan collisional belt (The southeastern Bohemian Massif, Czech Republic – Austria). Tectonics, 15, 1389–1413.
Hartley, A. J. & Otava, J., 2001. Sediment provenance and dispersal in a deep marine foreland basin: The Lower Carboniferous Culm Basin, Czech Republic. Journal of the Geological Society, 158, 137–150.
Janoušek, V. & Holub, F. V., 2007. The causal link between HP-HT metamorphism and ultrapotassic magmatism in collisional orogens: Case study from the Moldanubian Zone of the Bohemian Massif. Proceedings of the Geologists‘ Association, 118, 75–86.
Konopásek, J. & Schulmann, K., 2005. Contrasting Early Carboniferous field geotherms:

179Geology and minerals – Geodynamics of the or igin of the Bohemian Massif
Evidence for accretion of a thickened orogenic root and subducted Saxothuringian crust (Central European Variscides). Journal of the Geological Society, 162, 463–470.
Kotková, J., Gerdes, A., Parrish, R.R., & Novák, M., 2007. Clasts of Variscan high-grade rocks within Upper Viséan conglomerates – constraints on exhumation history from petrology and U-Pb chronology. Journal of Metamorphic Geology, 25, 781–801.
Medaris, G., Jelínek, E. & Mísař, Z., 1995. Czech eclogites: terrane settings and implications for Variscan tectonic evolution of the Bohemian Massif. European Journal of Mineralogy, 7, 7–28.
O’Brien, P. J. & Rötzler, J., 2003. High-pressure granulites: formation, recovery of peak conditions and implications for tectonics. Journal of Metamorphic Geology, 21, 3–20.
Schmädicke, E., Metzgyer, K., Cosca, M.A. & Okrusch, M. 1995. Variscan Sm–Nd and Ar-Ar ages of eclogite-facies rocks from the Erzgebirge, Bohemian Massif. Journal of Metamorphic Geology, 13, 537–552.
Schulmann, K., Kröner, A., Hegner, E., Wendt, I., Konopásek, J., Lexa, O. & Štípská, P., 2005. Chronological constraints on the pre-orogenic history, burial and exhumation of deep-seated rocks along the eastern margin of the Variscan orogen, Bohemian Massif, Czech Republic. American Journal of Science, 305, 407–448.
Schulmann, K., Lexa, O., Štípská, P., Racek, M., Tajčmanová, L., Konopásek, J., Edel, J.-B., Peschler, A. & Lehmann, J., 2008. Vertical extrusion and horizontal channel flow of orogenic lower crust: key exhumation mechanisms in large hot orogens? Journal of Metamorphic Geology 26, 273–297.
Schulmann, K., Konopásek, J., Janoušek, V., Lexa, O., Lardeaux, J.-M., Edel, J.-B., Štípská, P. & Ulrich, S., 2009. An Andean type Palaeozoic convergence in the Bohemian Massif. Comptes Rendus Geoscience 341, 266–286.
Suess, F. E., 1926. Intrusionstektonik und Wandertektonik im variszichen Grundgebirge. Borntträger, Berlin.
Tollmann, A., 1982. Großräumiger variszischer Deckenbau im Moldanubikum und neue Gedanken zum Variszikum Europas. Geotektektonische Forschungen, 64, 1–91.
Zulauf, G. 2001. Structural style, deformational mechanisms and paleodifferential stress along an exposed crustal section: constraints on the rheology of quartzofeldspathic rocks at supra- and infrastructural levels (Bohemian Massif). Tectonophysics, 332, 211–237.
Žák, J., Holub, F.V. & Verner, K. 2005. Tectonic evolution of a continental magmatic arc from transpression in the upper crust to exhumation of mid-crustal orogenic root recorded by episodically emplaced plutons: the Central Bohemian Plutonic Complex (Bohemian Massif). International Journal of Earth Sciences, 94, 385–400.

180
MINERALS CURRENTLY MINED IN THE CZECH REPUBLIC
ENERGY MINERALS
Bituminous coal
1. Registered deposits and other resources of the Czech Republic
Coal basins:(Names of basins with mined deposits are indicated in bold type)
1 Czech part of the Upper-Silesian Basin
2 Czech part of the Intra-Sudetic Basin
3 Krkonoše Mts. Piedmont Basin
4 Central Bohemian Basins (namely Kladno-Rakovník Basin)
5 Mšeno Part of Mšeno-Roudnice Basin
6 Plzeň Basin and Radnice Basin
7 Boskovice Graben
8 Roudnice Part of Mšeno-Roudnice Basin
9 Mnichovo Hradiště Basin
reserved registered deposits exhausted deposits and other resources

181Minerals currently mined – Energy minerals – Bituminous coal
2. Basic statistical data of the Czech Republic as of December 31 Number of deposits; reserves; mine production
Year 2009 2010 2011 2012 2013
Deposits – total number 62 62 62 62 62
exploited 8 8 8 8 8
Total mineral *reserves, kt 16 455 297 16 421 504 16 339 004 16 324 263 16 315 667
economic explored reserves 1 543 177 1 536 411 1 518 929 1 496 792 1 487 287
economic prospected reserves 6 011 672 6 009 407 5 998 902 5 995 983 5 993 801
potentially economic reserves 8 900 448 8 875 686 8 821 173 8 831 488 8 834 579
exploitable (recoverable) reserves 205 630 168 917 180 729 168 538 66 301
Mine production, kt 10 621 11 193 10 967 10 796 8 610
* See NOTE in the chapter Introduction above on a terminological difference between Czech official application of the term reserves and standard international application of the term. The relationship of domestic and foreign classifications of mineral reserves and resources is described in the separate chapter Mineral reserve and resource classification in the Czech Republic of this yearbook
Approved prognostic resources P1, P2, P3
Year 2009 2010 2011 2012 2013
P1, kt 590 300 590 300 590 300 590 300 590 300
P2 – – – – –
P3 – – – – –
3. Foreign trade
2701 – Bituminous coal, briquettes and similar solid fuels made of bituminous coal
2009 2010 2011 2012 2013
Import kt 1 789 2 022 2 398 1 979 2 153
Export kt 6 032 6 445 6 257 5 369 4 837
2701 – Bituminous coal, briquettes and similar solid fuels made of bituminous coal
2009 2010 2011 2012 2013
Average import prices CZK/t 2 390 2 775 3 534 3 146 2 468
Average export prices CZK/t 2 612 3 015 3 349 3 010 2 380

182Minerals currently mined – Energy minerals – Bituminous coal
2704 – Coke and semi-coke from bituminous coal, brown coal or peat, agglomerated retort coal
2009 2010 2011 2012 2013
Import kt 517 787 552 469 438
Export kt 530 890 509 435 450
2704 – Coke and semi-coke from bituminous coal, brown coal or peat, agglomerated retort coal
2009 2010 2011 2012 2013
Average import prices CZK/t 3 365 6 387 6 494 5 205 4 696
Average export prices CZK/t 9 580 8 396 9 572 8 394 7 395
4. Prices of domestic market
Average sale prices of bituminous coal EXW (EUR/tonne) recalculated to CZK/tonne with using of Czech National Bank CZK/EUR exchange rate annual averages
Coal type/Year 2009 2010 2011 2012 2013
coking coal EUR/tonne 87 138 177 125 98
steam coal EUR/tonne 72 60 67 74 56
exchange rate CZK/EUR 26.4 25.3 24.6 25.1 26.0
coking coal CZK/tonne 2 297 3 567 4 453 3 112 2 548
steam coal CZK/tonne 1 901 1 594 1 722 1 857 1 456
Sources:
In 2009 - New World Resources Annual Report and Accounts 2011. New World Resources Plc, pp. 31, 35.
For 2010 - 2013 – New World Resources Annual Report and Accounts 2013. New World Resources Plc, p. 45.

183Minerals currently mined – Energy minerals – Bituminous coal
OKD, a.s. bituminous coal sales
Coal type/Year 2009 2010 2011 2012 2013
coking coal
sales tonnes 5 999 105 6 037 299 4 964 500 5 167 830 4 290 210
revenueths
CZK15 425 261 23 103 968 22 390 420 16 574 935 11 147 387
average
price
CZK/
tonne2 571 3 827 4 510 3 207 2 598
steam coal
sales tonnes 4 939 502 5 477 941 5 849 660 4 726 870 5 079 459
revenueths
CZK11 000 194 10 077 808 9 577 580 8 738 661 7 371 043
average
price
CZK/
tonne2 227 1 840 1 637 1 849 1 451
Sources:
For 2009–2010 – OKD výroční zpráva 2010, OKD, a.s., p. 29.
In 2011 – OKD výroční zpráva 2012, OKD, a.s., pp. 17–18.
For 2012–2013 – OKD výroční zpráva 2013, OKD, a.s., p. 12.
Note: výroční zpráva – annual report
5. Mining companies in the Czech Republic as of December 31, 2013
OKD, a.s., Ostrava
6. World production and world market prices
World mine productionThe trend in world production of bituminous coal for the last five years was as follows:
2009 2010 2011 2012 2013e
Steam coal (WBD), mill tonnes 5 035.6 5 311.0 5 722.2 5 726.6 –
Steam coal (IEA), mill tonnes 5 199.1 5 437.3 5 763.4 5 918.4 5 979.3
Coking coal (WBD), mill tonnes 785.1 903.5 954.0 978.2 –
Coking coal (IEA), mill tonnes 783.5 914.1 972.7 987.2 1 003.5
e – preliminary values
Sources (IEA): Coal information 2013. International Energy Agency Statistics. OECD/IEA, 2013.
Coal information 2014. International Energy Agency Statistics. OECD/IEA, 2014.
In 2012, the total world production of bituminous coal amounted to 6 704.8 million tonnes, 14.6 % of which was coking coal, which is considered to be a strategic mineral in the EU.

184Minerals currently mined – Energy minerals – Bituminous coal
Major producers (2012, according to WBD):Steam coal Coking coalChina 50.6 % China 52.2 %USA 13.7 % Australia 15.0 %India 8.7 % USA 8.3 %Indonesia 7.1 % Russia 7.4 %RSA 4.5 % India 4.8 %Russia 3.6 % Canada 3.2 %Australia 3.5 % Mongolia 2.1 %Kazakhstan 1.9 % Ukraine 1.8 %Poland 1.2 % Kazakhstan 1.3 %Columbia 1.1 % Poland 1.2 %
The World Coal Association published preliminary data on the world coal industry and trade for 2013 (Coal Facts 2014). According to these statistics, the following countries were the top ten producers of steam and coking coal by tonnage (mill tonnes):Steam coal Coking coalChina 3 034 China 527USA 756 Australia 158India 526 USA 78Indonesia 486 Russia 73South Africa 255 India 42Australia 239 Canada 34Russia 201 Mongolia 20Kazakhstan 103 Ukraine 20Columbia 81 Kazakhstan 12Poland 65 Poland 12
According to World Energy Resources: 2013 Survey, world recoverable reserves of bituminous coal at the end of 2013 reached 403 199 million tonnes.
According to Coal Facts 2014, 1 028 million tonnes of bituminous steam coal and 301 million tonnes of coking coal were traded worldwide in 2013. The top exporters of steam coal were Indonesia (423 mill t), Australia (182 mill t) and Russia (118 mill t), followed by Columbia (73 mill t), South Africa (72 mill t) and the USA (47 mill t). The top exporter of coking coal was Australia (154 mill t), followed by the USA (60 mill t), Canada (33 mill t) and Russia (22 mill t). The leading importers of bituminous coal were China (327 mill t, of which 77 mill t was coking coal), followed by Japan (196 mill t in total, 54 mill t of coking coal), India (180 mill t, of which 38 mill t was coking coal), and South Korea as the fourth leading importer (126 mill. t in total, 31 mill t of coking coal).
World market prices World prices of bituminous coal, both contract and spot prices, have traditionally been determined largely by the prices of American and Australian coal. In recent years, bituminous coal prices at northwest European ports peaked in the summer of 2008 and then fell sharply due to the growing global economic crisis. Prices grew gradually again in 2010 and hovered

185Minerals currently mined – Energy minerals – Bituminous coal
around a relatively high level of 120–130 USD/t in mid-2011. They reached an absolute long-term peak of 139.05 USD/t in January 2011. However by the second half of that year, they had already fallen to around 100 USD/t due to an unusually mild start to winter. Since then, primarily the inventories of thermal coal have grown. The prices of coking coal fared better. In 2011, the spot prices of US coking coal hovered on average around 280 USD/t FOB. This relatively high level was also influenced by disruptions in the supply of Australian coal as a result of flooding in Queensland. During the course of 2012, prices declined yet again, and bituminous coal prices fluctuated around 90 USD/t in the second half of the year. Although contracts on a quarterly basis are more prevalent, spot trades are gradually gaining in importance. This is also due to the weakening of the US dollar, making US coal more attractive for Europe. Coking coal is bought in relatively small volumes, which negatively effects the price stability of spot trades. In the third quarter of 2013, spot prices reached 152 USD/t. That same quarter, contract prices were 145 USD/t. NWR in Ostrava sold coking coal for around 100 EUR/t in the second quarter of 2013, and on average for 92 EUR/t in the third quarter. At the beginning of 2014, NWR sold coking coal for 91 EUR/t and steam coal for only 60 EUR/t.
According to Platts Market Data 2014, the long-term average price of bituminous coal in 2009–2014 was 94.01 USD/t.
In the first half of 2011, the spot prices of coke also rose to a very high level of 500 USD/t CIF ARA (ARA = Amsterdam, Rotterdam, Antverpen), but already fell at the end of the year to 395 USD/t.
According to information from the World Energy Council, the trends of average prices of some bituminous coal types in USD/tonne were as follows:
Year 2009 2010 2011 2012 2013
NW Europe marker price 70.66 92.50 121.52 92.50 81.69
US Central Appalachian coal spot
price index68.08 71.63 87.38 72.06 71.39
Japan coking coal import CIF price 167.82 158.95 229.12 191.46 140.45
Japan steam coal import CIF price 110.11 105.19 136.21 133.61 111.16
Asian marker price 78.81 105.43 125.74 105.50 90.90
Steam coal export costs (average unit value, USD/tonne)
Year 2009 2010 2011 2012 2013
Colombia 58.26 77.31 110.38 83.30 71.40
Indonesia 55.29 71.03 87.32 68.13 62.40
South Africa 60.99 91.26 116.52 93.06 80.70
Source: Coal information 2014. International Energy Agency Statistics. OECD/IEA, 2014.

186Minerals currently mined – Energy minerals – Brown coal
Brown coal
1. Registered deposits and other resources of the Czech Republic
Coal basin(Names of basins with mined deposits are indicated in bold type)
1 Cheb Basin 3 North-Bohemian Basin
2 Sokolov Basin 4 Czech part of the Zittau (Žitava) Basin
reserved registered deposits exhausted deposits and other resources
area of ecological territorial limits for mining
(Government Resolution no. 444/1991)

187Minerals currently mined – Energy minerals – Brown coal
Ecological territorial limitsRather large brown coal reserves in northern Bohemia (in North-Bohemian Basin) are blocked based on the announcement of the so-called ecological territorial limits of brown coal mining in northern Bohemia. These were established by the Czech Republic Government Resolution No. 444 from 1991. The resolution of the government defines mining leases and areas which should remain unexploited. Environmental and landscape protection in the area of northern Bohemia was the main reason for their establishment. Lifetime of reserves beyond the ecological territorial limits represents about 18-year mining and concerns namely the ČSA, Bílina and Vršany open-pit mines. Reserves of about 0.9 billion tonnes are bound by these so-called ecological territorial limits. There is an increasing pressure on revaluation or correction of the original decision from 1991 in relation to decreasing brown coal reserves in the mined localities. It remains a fact that brown coal is, along with nuclear power stations, a single relevant raw material for the Czech energy production. Brown coal represents also an essential raw material for the Czech heating plant industry. In terms of energy security, domestic raw material resources are also gaining in importance.
↑ NW

188Minerals currently mined – Energy minerals – Brown coal
2. Basic statistical data of the Czech Republic as of December 31
Number of deposits; reserves; mine production
Year 2009 2010 2011 2012 2013
Deposits – total number 54 54 53 53 53
exploited 10 10 10 11 11
Total mineral* reserves, kt 9 055 290 8 998 999 8 948 767 8 936 157 8 859 890
economic explored reserves 2 789 379 2 405 345 2 361 825 2 347 268 2 308 649
economic prospected reserves 2 168 466 2 063 444 2 063 444 2 063 444 2 062 445
potentially economic reserves 4 097 445 4 530 210 4 523 498 4 525 445 4 488 796
exploitable (recoverable) reserves 862 633 915 100 871 142 862 202 825 322
Mine production, kt 45 354 43 931 46 848 43 710 40 585
Notes: * See NOTE in the chapter Introduction above on a terminological difference between Czech official application of the term reserves and standard international application of the term. The relationship of domestic and foreign classifications of mineral reserves and resources is described in the separate chapter Mineral reserve and resource classification in the Czech Republic of this yearbook
3. Foreign trade
2702 – Brown coal, also agglomerated, except jet
2009 2010 2011 2012 2013
Import kt 163 187 236 486 447
Export kt 1 300 1 109 1 188 1 332 1 241
2702 – Brown coal, also agglomerated, except jet
2009 2010 2011 2012 2013
Average import prices CZK/t 1 763 2 106 2 017 1 203 1 263
Average export prices CZK/t 1 400 1 432 1 426 1 540 1 641
Note: Jet is a compact black variety of brown coal used in (mourning) jewelry

189Minerals currently mined – Energy minerals – Brown coal
4. Prices of domestic market
Domestic brown coal prices*
Product specification 2009 2010 2011 2012 2013
graded; cube coal II; 17.6 MJ/kg; Severočeské doly
1 847–2 143 1 868–2 143 1 900–2 150 1 930–2 170 2 135–2 150
graded; nut coal I; 17.6 MJ/kg; Severočeské doly
1 748–1 942 1 742–1 937 1 730–1 950 1 960–1 730 1 800–1 850
graded; nut coal II; 17.6 MJ/kg; Severočeské doly
1 461–1 782 1 461–1 782 1 470–1 790 1 810–1 490 1 700–1 800
coarse coal dust I, II; Severočeské doly; 16.9 MJ/kg
758–1 095 796–1 146 812–1 169 1 095–1 250 N
industrial mixture; 10.5–15.6 MJ/kg; Severočeské doly
511–915 691–943 538–962 570–1 010 N
graded; cube coal; Mostecká uhelná 2 015 N N N N
graded; cube coal I; Mostecká uhelná 1 910 N N N N
graded; cube coal II; Mostecká uhelná 995 N N N N
graded; cobble; Sokolovská uhelná 950–1 120 N N N N
graded; cube coal; Sokolovská uhelná 880–1 020 N N N N
dried brown coal dust; Sokolovská uhelná 1 270–1 625 N N N N
* Prices given without taxes on solid fuels.
Sokolovská uhelná Company has not been producing graded coal since 2009. Mostecká uhelná Company has been selling the coal in auctions, price lists will no longer be issued.
Price quotations*) (for home consumption) of Graded Brown Coal Most (THU**)) quoted on the Energy Exchange of the Czech Moravian Commodity Exchange Kladno (CZK/tonne)
2009 2010 2011 2012 2013
Coal type***)
Calorific value
Qir (MJ/kg)1. 4. – 31. 12. 1. 1. – 31 .3. 1. 4. – 31. 12. 1. 1. – 31. 3. 1. 4. – 31. 12. 1. 1. – 21. 2.
cube 19.90 1 720 1 720 1 737 1 737 1 775 1 786 –
nut 1 20.00 1 650 1 650 1 667 1 667 1 695 1 700 –
nut 2 19.80 920 920 929 929 1 173 1 310 –
Source: Czech Moravian Commodity Exchange KladnoExplanations: *) Prices are quoted in CZK without VAT, solid fuels tax or any other indirect tax and do not include transport costs **) THU = tříděné hnědé uhlí***) Regular grain size (mm): cube = 40–100, nut 1 = 20–40, nut 2 = 10–20

190
Czech Moravian Commodity Exchange Kladno closed down its market with graded brown coal on 31 December 2012 that was organized by independent branch Energy Exchange since 2009. Purpose of the trading in the marketplace was to meet demand for graded brown coal above frame of wholesale – coal depots long-term contracts. Operation of the market was programmed for a term of years 2009–2012 and its closure had controlled character.
5. Mining companies in the Czech Republic as of December 31, 2013
Severočeské doly, a.s., ChomutovVršanská uhelná a.s., MostSokolovská uhelná, právní nástupce, a.s., SokolovSeverní energetická a.s., Most
6. World production and world market prices
World mine productionThe trend in world production of brown coal for the last five years was as follows:
2009 2010 2011 2012 2013e
Brown coal and lignite (WBD), mill tonnes 952.6 974.9 1 032.1 1 030.9 –
Brown coal and lignite (IEA), mill tonnes 856.1 841.2 890.7 888.8 840.1
e – preliminary valuesSources (IEA): Coal information 2013. International Energy Agency Statistics. OECD/IEA, 2013.
Coal information 2014. International Energy Agency Statistics. OECD/IEA, 2014.
Germany was the leading producer in 2012 with an 18 % share of world production, followed by China (13.3 %). Other important producers were Turkey and the USA (7 %), Russia (6.8 %), Australia (6.4 %), Poland (6.2 %), Greece (6 %) and India (4.5 %). The Czech Republic ranked tenth with 4.8 %.
Coal Facts 2014 provided preliminary data on the top ten producers (mill t) in 2013.Germany 183 Australia 63Russia 73 Greece 54USA 70 India 45Poland 66 Czech Republic 40Turkey 63 Serbia 40
Contrary to the above-mentioned data for 2012, this summary does not include China.
According to World Energy Resources: 2013 Survey, world recoverable reserves of brown coal amounted to 488 332 million tonnes at the end of 2013.
Minerals currently mined – Energy minerals – Brown coal

191Minerals currently mined – Energy minerals – Brown coal
Market and pricesGlobal brown coal trade is very limited. According to Coal Facts, it totaled 3.7 million tonnes in 2011. In recent years, international trade peaked in 2012 with 6.9 million tonnes. In 2013, it declined again to 4.8 million tonnes. In comparison with the bituminous coal trade, brown coal is inefficient from an economic perspective to transport over long distances.
Therefore, trade takes place mainly between neighbouring countries based on contract prices, which are not published in available statistics.

192
Principal areas of deposits presence:(names of areas with exploited deposits are indicated in bold type)
1 Vienna Basin 2 West-Carpathian Foredeep
Minerals currently mined – Energy minerals – Crude oil
Crude oil
1. Registered deposits and other resources of the Czech Republic
reserved registered deposits exhausted deposits and other resources

193Minerals currently mined – Energy minerals – Crude oil
* See NOTE in the chapter Introduction above on a terminological difference between Czech official application of the term reserves and standard international application of the term. The relationship of domestic and foreign classifications of mineral reserves and resources is described in the separate chapter Mineral reserve and resource classification in the Czech Republic of this yearbook
Year 2009 2010 2011 2012 2013
Deposits – total number 33 34 33 34 39
exploited 27 27 27 27 30
Total mineral *reserves, kt 31 031 29 015 30 891 30 781 28 811
economic explored reserves 15 440 15 424 20 326 20 108 21 236
economic prospected reserves 4 482 4 475 3 983 4 092 1 758
potentially economic reserves 11 109 9 116 6 582 6 581 5 817
exploitable (recoverable) reserves 1 535 1 415 1 664 1 628 1 534
Mine production, kt 217 173 163 150 152
2. Basic statistical data of the Czech Republic as of December 31
Number of deposits; reserves; mine production
2709 – Petroleum oils and oils obtained from bituminous minerals, crude
2009 2010 2011 2012 2013
Import kt 7 452 7 770 6 969 7 024 6 630
Export kt 22 18 19 21 25
2709 – Petroleum oils and oils obtained from bituminous minerals, crude
2009 2010 2011 2012 2013
Average import prices CZK/t 8 115 10 907 14 113 16 374 15 966
Average export prices CZK/t 8 174 10 334 13 733 15 411 14 989
271011 – Petrol (Gasoline)
2009 2010 2011 2012 2013
Import kt 697 501 606 N N
Export kt 142 220 315 N N
Notice: The conversion 1 000 litres of petrol = 750 kg was used
3. Foreign trade

194Minerals currently mined – Energy minerals – Crude oil
Czech Republic crude oil import by country and import costs
2009 2010 2011 2012 2013
Kazakhstan kt 499 563 597 518 620
Russian Federation kt 5 097 4 945 4 102 4 545 4 213
Poland kt – – 1 – –
Italy kt – – – 11 –
Other non–OECD
Europe/Eurasiakt 1 530 2 008 2 038 1 859 1 659
Iran kt 29 161 168 – –
Algeria kt 15 50 19 141 60
Nigeria kt 17 – – – –
Total kt 7 170 7 727 6 925 7 074 6 552
Import costs, average
unit value, CIF
USD/bbl 60.77 79.04 110.42 112.33 110.26
USD/tonne* 447.87 582.52 813.80 827.87 812.62
Note: * – 1 tonne = 7.37 bbl (in average)Sources: Oil information 2012. International Energy Agency Statistics. OECD/IEA, 2012.
Oil information 2013. International Energy Agency Statistics. OECD/IEA, 2013. Oil information 2014. International Energy Agency Statistics. OECD/IEA, 2014.
4. Prices of domestic market
Prices of domestic producers are not open to public.
5. Mining companies in the Czech Republic as of December 31, 2013
MND a.s., HodonínLAMA GAS & OIL s.r.o., Hodonín
271011 – Petrol (Gasoline)
2009 2010 2011 2012 2013
Average import prices CZK/t 12 653 16 814 18 136 N N
Average export prices CZK/t 13 897 18 366 17 755 N N
Notice: The conversion 1 000 litres of petrol = 750 kg was used

195Minerals currently mined – Energy minerals – Crude oil
6. World production and world market prices
World mine productionThe volume of the world´s crude oil production in recent years was as follows:
2009 2010 2011 2012 2013
World crude oil production (WBD), million tonnes 3 729.0 3 800.0 3 847.2 4 051.2 –
World crude oil production (BP), million tonnes 3 890.9 3 979.3 4 010.6 4 117.4 4 130.2
Note: BP – BP Statistical Review of World Energy. June 2014.
Of the 97 producers of crude oil recorded in 2012, the top ten accounted for more than 64 % of world production. They are (according to WBD):
Saudi Arabia 13.5 % Canada 4.0 %Russia 12.8 % United Arab Emirates 3.8 % USA 9.8 % Iraq 3.8 %China 5.1 % Kuwait 3.7 %Iran 4.3 % Mexico 3.6 %
Proved world crude oil reserves amounted 238.2 billion tonnes at the end 2013 (BP Statistical Review of World Energy. June 2014)
In comparison with previous years, the most significant changes that occurred involved Canada, which climbed from 18th place in 2011 to 7th place in 2012 with its production volume of 162.3 million tonnes, and also China, which moved ahead of Iran into 4th place in 2012 with its production of 207.5 million tonnes.
World market pricesDuring the monitored five-year period beginning with 2009, world prices rose from nearly 60 USD/bbl to roughly more than 80 USD/bbl in 2010 and then to a relatively high level of 95-110 USD/bbl in 2011-2013 as a result of the “Arab Spring“, the Russian aggression against Ukraine, and the Islamic State offensive in Northern Iraq. A more detailed view of these price changes is provided by the price quotes for Brent crude, which serve as benchmarks for the fuel prices in Europe. In 2010, these prices fluctuated from less than 75 USD/bbl to around 85 USD/bbl. From this level, they rose relatively sharply to more than 120 USD/bbl in the first half of 2011 and declined to less than 105 USD/bbl in the second half of the year. At the end of the winter of 2011/2012, prices jumped to nearly 125 USD/bbl. A decline to 100 USD/bbl may be observed in 2012 and in mid-2013. An increase to more than 115 USD/bbl occurred at the beginning of 2013.

196Minerals currently mined – Energy minerals – Crude oil
Average spot prices of crude oil according to IEA and BP (USD/bbl)
Commodity/Year UnitsConversion factor
2009 2010 2011 2012 2013
Brent Crude, CIF
Rotterdam
USD/bbl1 tonne =
7.560 bbl
61.67 79.50 111.26 111.67 108.66
USD/
tonne466.23 601.02 841.13 844.23 821.47
Dubai Crude, CIF
Rotterdam
USD/bbl1 tonne =
7.596 bbl
61.39 78.06 106.18 109.08 105.47
USD/
tonne466.32 592.94 806.54 828.57 801.15
West Texas
Intermediate (WTI),
CIF Rotterdam
USD/bbl1 tonne =
7.400 bbl
61.92 79.45 95.04 94.13 97.99
USD/
tonne458.21 587.93 703.30 696.56 725.13
Nigerian Forcados
Crude, CIF
Rotterdam
USD/bbl1 tonne =
7.500 bbl
63.35 81.05 113.65 114.21 111.95
USD/
tonne475.13 607.88 852.38 856.58 839.63
OPEC Basket, CIF
Rotterdam
USD/bbl1 tonne =
7.090 bbl
61.06 77.45 107.465 109.45 105.00
USD/
tonne432.92 549.12 761.93 776.00 744.45

197Minerals currently mined – Energy minerals – Natural gas
Principal areas of deposits and underground gas reservoir Háje:(Names of regions with mined deposits are indicated in bold type)
1 South-Moravian region 2 North-Moravian region 3 underground gas reservoir Háje
reserved registered deposits of natural gas
exhausted deposits and other resources of natural gas
reserved registered deposits of natural gas adsorbed on coal seams
other resources of natural gas adsorbed on coal seams
underground gas reservoirs
Natural gas
1. Registered deposits and other resources of the Czech Republic

198Minerals currently mined – Energy minerals – Natural gas
2. Basic statistical data of the Czech Republic as of December 31
Number of deposits; reserves; mine production
Year 2009 2010 2011 2012 2013
Deposits – total number 92 94 83 90 96
exploited 49 52 48 46 40
Total mineral *reserves, mill m3 46 140 28 924 30 172 30 506 31 085
economic explored reserves 4 339 6 123 7 374 7 243 7 646
economic prospected reserves 39 895 2 281 2 335 2 791 2 981
potentially economic reserves 1 906 20 520 20 463 20 472 20 458
exploitable (recoverable) reserves 27 846 4 767 4 660 4 886 5 512
Mine production, mill m3 180 201 187 204 207
* See NOTE in the chapter Introduction above on a terminological difference between Czech official application of the term reserves and standard international application of the term. The relationship of domestic and foreign classifications of mineral reserves and resources is described in the separate chapter Mineral reserve and resource classification in the Czech Republic of this yearbook
Approved prognostic resources P1, P2, P3
Year 2009 2010 2011 2012 2013
P1, mill m3 16 767 16 767 16 767 16 767 16 767
P2 – – – – –
P3 – – – – –
3. Foreign trade
271121 – Natural gas
2009 2010 2011 2012 2013
Import ths m3 N N N N N
Export ths m3 N N N N N
271121 – Natural gas
2009 2010 2011 2012 2013
Average import prices CZK/ths m3 N N N N N
Average export prices CZK/ths m3 N N N N N

199Minerals currently mined – Energy minerals – Natural gas
Czech Republic natural gas import by country and import costs
2009 2010 2011 2012 2013
Norway million m3 3 000 1 057 280 3 4
Russian Federation million m3 6 683 7 453 9 041 7 468 8 475
Total million m3 9 683 8 510 9 321 7 471 8 479
Average pipeline
import prices
USD/million
Btu8.67 8.74 11.14 13.22 12.10
USD/MWh 29.59 29.83 38.02 45.12 41.30
USD/m3 0.32 0.32 0.41 0.49 0.45
Sources: Natural gas information 2013. International Energy Agency Statistics. OECD/IEA, 2013.Natural gas information 2014. International Energy Agency Statistics. OECD/IEA, 2014.Notes: 1) Own conversion of prices from USD/million Btu to USD/m3 by equations 1 ft3 (cubic foot) of natural gas =
1 050 Btu (British thermal unit); 1m3 = 35,31ft3; 1m3 = 37 075,5 Btu 2) 3 412 969 Btu = 1 MWh
4. Prices of domestic market
Prices of domestic producers are open to public incompletely. In period under consideration company MND a.s. stated (MND a.s. – Výroční zpráva 2010;
výroční zpráva = annual report) for 2010 and 2009 that average price of own production gas was 6.80 CZK/m3 in 2010 so it was by 9.5 % higher of that in 2009 (6.20 CZK/m3).
Unigeo a.s. shows data in its Annual Reports for 2009–2013 which allow to deduct approximate average prices of natural gas supply to local gas distribution system.
2009 2010 2011 2012 2013
Unigeo a.s. price – CZK/m3 4.50 N 6.60 8.89 9.21
Trading on the Energy Exchange of the Czech Moravian Commodity Exchange Kladno (CMKBK) with the SSDP (composite natural gas supply services of gas products (commodity)) – price quotation*) averages weighted by realized quantity
2010(traded since 10th August)
2011 2012 2013
To 630 MWh/delivery point
(630 MWh = 59 684 m3)
CZK/MWh **) 570 696 705 715
CZK/ths m3 ***) 6 017 7 347 7 441 7 547
Over 630 MWh/delivery point
(630 MWh = 59 684 m3)
CZK/MWh **) 516 677 690 703
CZK/ths m3 ***) 5 447 7 146 7 146 7 420
Source: Czech Moravian Commodity Exchange Kladno

200Minerals currently mined – Energy minerals – Natural gas
Explanations:SSDP (sdružené služby dodávky zemního plynu) = composite natural gas supply services of gas products (commodity) = natural gas physically delivered into the customers offtake point on the territory of the Czech Republic with obligation of the customer to take delivery of the gas from the distribution network (gas grid) and responsibility of the holder of the natural gas trading licence (supplier) for any deviations in line with relevant legal regulations according to the Energy Act and the relevant implementing and related regulations in force including distribution of natural gas and the system services. *) Prices are quoted in CZK without VAT, gas tax or any other indirect tax or similar payment and do not include
distribution of natural gas and related services **) Original format of quoted prices***) Recalculated quoted prices with using of calorific value 1 MWh = 94.74 m3 of natural gas
5. Mining companies in the Czech Republic as of December 31, 2013
MND a.s., HodonínGreen Gas DPB, a.s., PaskovLAMA GAS & OIL s.r.o., HodonínUnigeo a.s., Ostrava – Hrabová
6. World production and world market prices
World mine productionThe volumes of world natural gas production in recent years were as follows:
2009 2010 2011 2012 2013
World natural gas production (WBD), million m³ 2 488.4 2 648.5 2 730.3 3 475.6 –
World natural gas production (BP), million m³ 2 957.4 3 180.8 3 233.0 3 310.8 3 347.6
World natural gas production (IEA), million m³ 3 060.8 3 279.3 3 380.0 3 436.8 3 479.0e
Notes: BP – BP Statistical Review of World Energy. June 2014.IEA – Natural gas information 2013. International Energy Agency Statistics. OECD/IEA, 2013.
Natural gas information 2014. International Energy Agency Statistics. OECD/IEA, 2014. e – preliminary values
According to WBD, natural gas was produced by 86 countries in 2012, of which the top ten accounted for nearly 66 % of world production. They were:USA 19.6 % Norway 3.3 %Russia 18.8 % China 3.1 %Canada 4.9 % Saudi Arabia 3.0 %Iran 4.6 % Indonesia 2.6 %Qatar 4.5 % Algeria 2.5 %
Proved world natural gas reserves amounted 185.7 trillion m3 at the end 2013 (BP Statistical Review of World Energy. June 2014)

201Minerals currently mined – Energy minerals – Natural gas
Natural gas prices in various countries according to the BP Statistical Review of Energy 2014 (USD/million Btu converted to USD/m3 and USD/MWh)
Country/year 2009 2010 2011 2012 2013
Germany, average
import price
USD/mill Btu 8.52 8.01 10.48 11.03 10.72
USD/MWh 29.08 27.34 35.77 37.65 36.59
USD/m3 0.32 0.3 0.39 0.41 0.4
United Kingdom, Heren
NBP Index
USD/mill Btu 4.85 6.56 9.04 9.46 10.63
USD/MWh 16.55 22.39 30.85 32.29 36.28
USD/m3 0.18 0.24 0.34 0.35 0.39
USA, Henry Hub, spot
price
USD/mill Btu 3.89 4.39 4.01 2.76 3.71
USD/MWh 13.28 14.98 13.69 9.42 12.66
USD/m3 0.14 0.16 0.15 0.1 0.14
Canada (Alberta)
USD/mill Btu 3.38 3.69 3.47 2.27 2.93
USD/MWh 11.54 12.59 11.84 7.75 10.00
USD/m3 0.13 0.14 0.13 0.08 0.11
Notes:1) Own conversion of prices from USD/million Btu to USD/m3 by equations 1 ft3 (cubic foot)
of natural gas = 1 050 Btu (British thermal unit); 1m3 = 35,31ft3; 1m3 = 37 075,5 Btu2) 3 412 969 Btu = 1 MWh

202Minerals currently mined – Energy minerals – Uranium
Reserved registered deposits(Names of mined deposits are indicated in bold type)
1 Rožná 3 Břevniště pod Ralskem 5 Jasenice-Pucov 7 Stráž pod Ralskem*
2 Brzkov 4 Hamr pod Ralskem 6 Osečná-Kotel
* uranium is recovered only as a byproduct from the treatment of groundwater and technological solutions during mine liquidation and reclamation work upon termination of in-situ leaching (ISL), otherwise in situ recovery (ISR), of uranium ores
Exhausted deposits and other resources
8 Příbram 13 Okrouhlá Radouň 18 Předbořice
9 Jáchymov 14 Dyleň 19 Hájek + Ruprechtov
10 Zadní Chodov + Vítkov 2 15 Javorník 20 Chotěboř
11 Olší 16 Licoměřice-Březinka 21 Slavkovice
12 Horní Slavkov 17 Radvanice + Rybníček
+ Svatoňovice
22 Mečichov-Nahošín
Uranium
1. Registered deposits and other resources of the Czech Republic
reserved registered deposits exhausted deposits and other resources

203Minerals currently mined – Energy minerals – Uranium
Approved prognostic resources P1, P2, P3
Year 2009 2010 2011 2012 2013
P1, t U 19 025 19 025 19 025 19 025 19 025
P2, t U 2 181 2 181 2 181 2 181 2 181
P3 – – – – –
Other* prognostic resources P1, P2, P3
Year 2009 2010 2011 2012 2013
P1, t U 202 827 202 827 202 827 202 827 –
P2, t U 16 522 16 522 16 522 16 522 –
P3 – – – – –
* Prognostic resources of uranium-bearing sandstones type in the Bohemian Cretaceous Basin, unexploitable at the present time
Year 2009 2010 2011 2012 2013
Deposits – total number 7 7 7 7 7
exploited 1 1 1 1 1
Total mineral * reserves, t U 135 425 135 361 135 276 135 214 135 144
economic explored reserves 1 426 1 416 1 406 1 323 1 327
economic prospected reserves 19 420 19 427 19 402 19 458 19 427
potentially economic reserves 114 579 114 518 114 468 114 433 114 391
exploitable (recoverable) reserves 377 374 338 312 284
Mine production, t U 286 259 252 222 232
Production of concentrate, t U ** 243 237 216 219 206
* See NOTE in the chapter Introduction above on a terminological difference between Czech official application of the term reserves and standard international application of the term. The relationship of domestic and foreign classifications of mineral reserves and resources is described in the separate chapter Mineral reserve and resource classification in the Czech Republic of this yearbook** sales production (without ore milling losses)
2. Basic statistical data of the Czech Republic as of December 31
Number of deposits; reserves; mine production

204Minerals currently mined – Energy minerals – Uranium
3. Foreign trade
28441030 – Natural uranium – wrought
4. Prices of domestic market
Extracted uranium is exported .
5. Mining companies in the Czech Republic as of December 31, 2013
DIAMO, s. p., Stráž pod Ralskem
6. World production and world market prices
World mine productionIn recent years, the volume of world production of uranium content of ores was as follows:
2009 2010 2011 2012 2013
Uranium production, tonnes U3O8 (WBD) 59 736 64 460 63 398 68 746 N
Uranium production, tonnes U (WNA*) 50 722 53 663 54 610 58 394 59 673
Notes:1) * Uranium production figures, 2003–2013. World Nuclear Association. December 2014.
2) 1 t U = 1.179 t U3O8
According to WBD, the top ten producers of uranium in 2012 were:Kazakhstan 36 .6 % Russia 4 .9 %Canada 15 .4 % Uzbekistan 4 .1 %Australia 12 .0 % USA 2 .7 %Niger 8 .3 % China 2 .6 %Namibia 7 .3 % Malawi 1 .9 %
2009 2010 2011 2012 2013
Import t U 0 0 0 0.001 0
Export t U 103 169 176 243 264
28441030 – Natural uranium – wrought
2009 2010 2011 2012 2013
Average import prices CZK/kg U – – – 96 000 –
Average export prices CZK/kg U 3 771 3 522 3 032 3 228 2 878

205Minerals currently mined – Energy minerals – Uranium
A noteworthy fact is that the first five countries produced nearly 85 % of the world´s uranium. The top ten producers accounted for more than 95 % of mined uranium.
According to the World Nuclear Association (2011), the world´s known recoverable resources of uranium amounted to 5327 kt. The leading producers´ shares of these resources were as follows:Australia 31 % Brazil 5 %Kazakhstan 12 % Namibia 5 % Russia 9 % USA 5 %Canada 9 % Ukraine 2 %Niger 8 % Uzbekistan 2 %South Africa 5 %
Distribution of worldwide identified conventional uranium resources (thousand tonnes U) by categories and cost ranges according to „Red Book 2014“ in 2013.
Resource category 2013
Identified (total)
<USD 260/kg U 7 635.2
<USD 130/kg U 5 902.9
<USD 80/kg U 1 956.7
<USD 40/kg U 682.9
RAR (reasonably assured resources)
<USD 260/kg U 4 587.2
<USD 130/kg U 3 698.9
<USD 80/kg U 1 211.6
<USD 40/kg U 507.4
Inferred resources
<USD 260/kg U 3 048.0
<USD 130/kg U 2 204.0
<USD 80/kg U 745.1
<USD 40/kg U 175.5
Notes:1) Identified resources = RAR + Inferred resources2) Resources in the cost category of < USD 40/kgU are likely higher than reported, because some countries have
indicated that detailed estimates are not available, or the data are confidential.3) „Red Book 2014“ – Uranium 2014: Resources, production and demand. OECD Nuclear Energy Agency and the
International Atomic Energy Agency. OECD Nuclear Energy Agency 2014.

206Minerals currently mined – Energy minerals – Uranium
In recent years, there has been a change in the overall ratio of primary uranium extraction methods, mainly as a result of a sharp and continuous rise in production in Kazakhstan, and also due to a slight decline in production in Australia and Canada. Underground mining accounted for 32 % of primary uranium production in 2010, but for roughly only 30 % (about 16 100 t) already in 2011. By contrast, uranium production from in-situ leaching increased significantly. Its share of production of around 30 % in 2009 grew to roughly 40 % in 2010, and in-situ leaching accounted for around 45 % (about 24 650 t) of primary uranium production in 2011. The share of open pit uranium mining declined from 25 % in 2005 to nearly 19 % in 2012 (about 10 150 t). The share of uranium recovered as a by-product from the processing of other ores, usually Au and Cu, basically depends on the production of two deposits, specifically Olympic Dam (Australia) and Vaal River (South Africa), and hovers at no more than 10 % (3 990 t). Other uranium recovery methods include, for example, heap leaching, remediation (mainly clean-up of contaminated mine water), etc.
Since 2011, the state-owned Kazakh company KazAtomProm has been the largest mining company as a result of a sharp rise in Kazakhstan´s production. The French company AREVA and Canada´s CAMECO share second and third place. AREVA has a major stake in two deposits mined in Niger, in two in Kazakhstan and in Canada. CAMECO operates deposits in Canada, and has a 70 % stake in the world´s richest deposit McArthur River (the remainder is held by AREVA). Together, these three companies produce roughly 50 % of the world´s uranium. They are followed distantly by the Australian company BHP Billiton, which operates the Olympic Dam deposit.
After reaching a historic peak in 2007, prices fell relatively sharply and approached the 100 USD/kg threshold in the first quarter of 2009. They remained practically unchanged in the following one and a half years, fluctuating between 110 and 120 USD/kg. However, they began to rise in the last quarter of 2010 and peaked between 180 and 190 USD/kg in January and February 2011. They declined slightly during the next three months and stabilized between 130 and 140 USD/kg since the second half of 2011. This period of price stability continued until July 2012; since then, prices declined and hovered around 113 USD/kg at the end of 2012. The trend in prices continued with another decline in 2013 and the price stabilized at around 80-85 EUR/kg U.
ESA average annual prices of natural uranium (EUR/kgU) according to EU Nuclear Observatory
Rok 2009 2010 2011 2012 2013
Long-term price 55.70 61.68 83.45 90.03 85.19
Spot price 77.96 79.48 107.43 97.80 78.24
Note: ESA – Euratom Supply Agency, European agency for common supply policy on the principle of regular and equitable supply of nuclear fuels for European Community users

207Minerals currently mined – Industr ial minerals – Bentonite
INDUSTRIAL MINERALS
Bentonite
1. Registered deposits and other resources of the Czech Republic
reserved registered deposits exhausted deposits and other resources
Principal areas of deposits and deposits outside them(Names of areas and the mined deposit outside are indicated in bold type)
1 České středohoří
2 Doupovské hory
3 Sokolovská pánev
4 Maršov u Tábora
5 Dněšice – Plzeňsko jih
6 Ivančice – Réna
7 Poštorná
8 Rybova Lhota

208Minerals currently mined – Industr ial minerals – Bentonite
2. Basic statistical data of the Czech Republic as of December 31
Number of deposits; reserves; mine production
Year 2009 2010 2011 2012 2013
Deposits – total number 30 32 33 35 35
exploited 4 6 6 6 6
Total mineral *reserves, kt 303 313 304 673 292 159 302 946 294 885
economic explored reserves 60 598 62 401 73 849 73 832 73 703
economic prospected reserves 139 809 139 670 116 400 126 365 128 326
potentially economic reserves 102 906 102 602 101 910 102 749 105 151
exploitable (recoverable) reserves 27 434 28 402 29 599 29 438 30 493
Mine production, kt** 181 183 160 221 226
* See NOTE in the chapter Introduction above on a terminological difference between Czech official application of the term reserves and standard international application of the term. The relationship of domestic and foreign classifications of mineral reserves and resources is described in the separate chapter Mineral reserve and resource classification in the Czech Republic of this yearbook** Including montmorillonite clays from kaolin deposits overburden
Approved prognostic resources P1, P2, P3
Year 2009 2010 2011 2012 2013
P1, kt 23 792 23 792 23 792 27 017 27 017
P2, kt 36 874 36 874 36 874 36 874 36 361
P3 – – – – –
3. Foreign trade
250810 – Bentonite
2009 2010 2011 2012 2013
Import kt 25 19 39 39 45
Export kt 100 120 144 152 162
250810 – Bentonite
2009 2010 2011 2012 2013
Average import prices CZK/t 3 370 2 738 5 500 3 322 2 747
Average export prices CZK/t 2 760 2 626 3 134 2 675 2 843

209Minerals currently mined – Industr ial minerals – Bentonite
250820 – Decolourizing earths and fuller’s earth
2009 2010 2011 2012 2013
Import kt 0 0 0 0 0
Export kt 0 0 0 0 0
250820 – Decolourizing earths and fuller’s earth
2009 2010 2011 2012 2013
Average import prices CZK/t – – – – –
Average export prices CZK/t – – – – –
4. Prices of domestic market
Bentonite prices are not quoted.
5. Mining companies in the Czech Republic as of December 31, 2013
Sedlecký kaolin a.s., BožičanyKERAMOST a.s., Most
6. World production and world market prices
World mine production
2009 2010 2011 2012 2013e
World mine production (according to MCS), kt 9 660 10 600 10 300 9 950 10 300
World mine production (according to WBD), kt 13 209 15 244 15 775 10 300 N
e – preliminary values
World bentonite production in 2013 according to the two most important statistical sources differs significantly and, at first glance, inexplicably. According to MCS, the share of the top ten producers is as follows:USA 48.0 % Czech Republic 2.1 %Greece 11.2 % Ukraine 2.0 %Brazil 5.5 % Spain 1.1 %Turkey 3.9 % Italy 1.0 %Germany 3.4 % Mexico 0.9 %

210Minerals currently mined – Industr ial minerals – Bentonite
The leading producers´shares of world production in 2012 according to both sources seem to be contradictory as well.According to MCS According to BWDUSA 50.0 % USA 29.1 %Greece 8.0 % China 21.2 %Brazil 5.7 % Greece 7.5 %Turkey 4.0 % Turkey 6.0 %Germany 3.8 % Mexico 5.8 %Czech Rep. 2.2 % India 3.6 %Ukraine 2.1 % Russia 3.0 %Spain 1.2 % Japan 2.6 %Italy 1.1 % Iran 2.4 %Mexico 0.5 % Germany 2.2 %
However the main difference, which is evident, is that the MCS statistics do not include data on China. Incorrect statistical procedures are also another reason for the discrepancies, for example when MCS provides figures for sales (USA, Germany, United Kingdom), alongside those for crude bentonite (Czech Republic, Greece, Ukraine, Uzbekistan) or for beneficiated bentonite (Brazil). These distinctions in quality are not listed for the rest of the countries. According to WBD, the CR (Czech Republic) ranked fourteenth with a share of 1.34 %.
Prices of traded commodities (according to IM)
Commodity/Year 2009 2010 2011 2012 2013
Bentonite, cat litter, grade1–5 mm,
bulk, FOB main European port EUR/t 47–70 42–60 42–60 42–60 42–60
Bentonite, Indian, cat litter grade,
crushed, dried, loose in bulk, FOB
Kandla
USD/t 34–53 34–38 34–38 34–38 34–38
Bentonite, API grade, bagged,
rail-car, ex-works WyomingUSD/st 70–100 70–100 70–120 90–130 90–130
Bentonite, foundry grade, bagged,
railcars, ex-works WyomingUSD/st 70–90 90–115 90–115 90–124 97–124
Bentonite, IOP grade, crude, bulk,
ex-works WyomingUSD/st 42–100 48–55 55–60 66–72 66–72
OCMA/Foundry grades, crude &
dried, bulk, FOB MilosEUR/t 50–76 50–75 50–75 50–80 60–80
Bentonite, dried material in bulk,
FOB GreeceEUR/t N N N 50–75 65–75
Bentonite, cat litter grade,
ex-works WyomingUSD/st N N N 50–60 50–60
The price range includes the lowest and highest monthly price quotes for a given year.Note: st – short ton; 1 st = 0.9072 tonne

211Minerals currently mined – Industr ial minerals – Clays
Clays
1. Registered deposits and other resources of the Czech Republic
reserved registered deposits exhausted deposits and other resources
Major deposit areas:(Names of areas with exploited deposits are in bold)
1 Kladno-Rakovník Carboniferous 7 Tertiary relicts of Central Bohemia
2 Moravian and East Bohemian Cretaceous 8 Tertiary relicts of West Bohemia
3 Cretaceous around Prague 9 Cheb Basin and Sokolov Basin
4 Louny Cretaceous 10 North Bohemian Basin
5 South Bohemian Basins 11 Zittau Basin
6 Plzeň Basin 12 Tertiary and Quaternary in Moravia

212Minerals currently mined – Industr ial minerals – Clays
2. Basic statistical data of the Czech Republic as of December 31
Number of deposits; reserves; mine production
Year 2009 2010 2011 2012 2013
Deposits – total number 106 108 108 108 108
exploited 18 18 17 18 18
Total mineral *reserves, kt 925 714 924 112 925 554 920 624 923868
economic explored reserves 180 311 180 945 180 393 175 184 176 926
economic prospected reserves 402 944 401 419 401 667 399 478 399 072
potentially economic reserves 342 459 341 748 343 494 345 962 347 870
exploitable (recoverable) reserves 47 273 46 990 51 742 43 680 42 839
Mine production, kt 377 429 498 485 465
* See NOTE in the chapter Introduction above on a terminological difference between Czech official application of the term reserves and standard international application of the term. The relationship of domestic and foreign classifications of mineral reserves and resources is described in the separate chapter Mineral reserve and resource classification in the Czech Republic of this yearbook
Approved prognostic resources P1, P2, P3
Year 2009 2010 2011 2012 2013
P1, kt 330 710 330 710 330 710 330 710 331 988
P2, kt 38 196 38 196 38 196 38 196 38 196
P3 – – – – –
3. Foreign trade
2508 – Other clays (not including expanded clays of heading 6806), andalusite, kyanite and sillimanite, whether or not calcined; mullite; chamotte or dinas earth
2009 2010 2011 2012 2013
Import t 47 192 52 332 78 294 34 048 38 873
Export t 223 080 242 640 293 909 134 806 132 978
2508 – Other clays (not including expanded clays of heading 6806), andalusite, kyanite and sillimanite, whether or not calcined; mullite; chamotte or dinas earth
2009 2010 2011 2012 2013
Average import prices CZK/t 4 384 3 978 4 807 4 922 5 676
Average export prices CZK/t 2 435 2 374 2 568 2 200 2 736

213Minerals currently mined – Industr ial minerals – Clays
250830 – Refractory (fire) clay
2009 2010 2011 2012 2013
Import t 9 459 12 332 13 242 7 347 11 350
Export t 20 996 22 361 22 536 22 059 10 869
250830 – Refractory (fire) clay
2009 2010 2011 2012 2013
Average import prices CZK/t 3 024 3 092 3 264 3 146 3 353
Average export prices CZK/t 1 294 1 226 1 197 1 272 2 043
250840 – Other clays
2009 2010 2011 2012 2013
Import t 4 840 12 667 14 856 13 333 10 869
Export t 50 494 51 453 73450 62 590 71 729
250840 – Other clays
2009 2010 2011 2012 2013
Average import prices CZK/t 4 334 1 759 1 602 2 549 3 048
Average export prices CZK/t 857 916 846 844 1 472
250870 – Chamotte or dinas earth
2009 2010 2011 2012 2013
Import t 3 035 4 422 5 005 8 627 6 812
Export t 52 005 48 679 54 068 49 980 50 377
250870 – Chamotte or dinas earth
2009 2010 2011 2012 2013
Average import prices CZK/t 4 609 5 341 5 845 6 245 5 971
Average export prices CZK/t 3 806 3 822 3 958 4 243 4 681

214Minerals currently mined – Industr ial minerals – Clays
4. Prices of domestic market
Various qualities of clay have different market prices. Prices are made public in the limited extent only (some producers do not publish them at all). They fluctuate generally between CZK 70–4 400 per tonne.
5. Mining companies in the Czech Republic as of December 31, 2013
Whiteware claysLB MINERALS, s.r.o., Horní BřízaKERACLAY, a.s., Brník
Refractory clays for grogKERACLAY, a.s., BrníkČeské lupkové závody a.s., Nové StrašecíP-D Refractories CZ a.s, Velké OpatoviceRAKO - LUPKY s.r.o., Lubná u Rakovníka
Other refractory clays (ball clays)LB MINERALS, s.r.o., Horní Bříza
Non-refractory ceramic claysLB MINERALS, s.r.o., Horní Bříza Kaolin Hlubany, a.s.
6. World production and world market prices
World mine productionThere are no authoritative figures for world production and trade in ball clays because of the difficulty of classifying these clays in a uniform and directly comparable way in terms of quality and use. However, the United Kingdom is a leading world producer and exporter of high-quality ball clays (Source: Ball clay. Mineral Planning Factsheet.-British Geological Survey-National Environment Research Council 2011).
Mine production of clays in the United Kingdom
2009 2010 2011 2012
Clays kt 5 130 5 934 6 154 5 497
Ball clays kt 727 900 930 748
Source: United Kingdom minerals yearbook 2013.- British Geological Survey, Keyworth, Nottingham, 2014.

215Minerals currently mined – Industr ial minerals – Clays
In the world-wide scale mine production of the fuller’s earth is indicated, the fuller’s earth also has variable composition and in addition to clay minerals it may incorporate zeolites, carbonates, micas.
World mine production of fuller’s earth (MCS):
2012 2013e
ths tonnes % ths tonnes %
USA 1 980 66.4 USA 2 040 68.0
Spain 591 19.8 Spain 590 19.7
Other countries 299 10.0 Other countries 270 9.0
Mexico 108 3.6 Mexico 100 3.3
Italy 3 0.1 Italy 3 0.1
World total 2 980 100.0 World total 3 000 100.0
e - preliminary values
Statistics indicate in clay group even mineral raw materials formed by minerals and rocks which are not clays but serve production of refractory materials: kyanite, sillimanite, shale, quartzose sandstone (quartzite) – ganister.
World resources of clays are extremely large.

216Minerals currently mined – Industr ial minerals – Clays
World market prices
Prices of clays mostly are not indicated . In the 2009–2013 period under consideration Industrial Minerals quoted indicative prices of sillimanite group minerals and in January – March 2009 only prices of some refractory clays too:
commodity/year 2009 2010 2011 2012 2013
Andalusite, 55 %–59 % Al2O3,
FOB European port, EUR/t325–385 335–385 335–400 345–425 350–425
Andalusite, 57 %–58 % Al2O3,
2 000 tonne bulk, FOB
Transvaal, EUR/t
225–255 225–255 225–265 230–280 235–280
Kyanite, 54 %–60 % Al2O3,
18–22 ton lots, raw, ex-works
USA, USD/st
167–309 211–301 211–320 224–320 224–320
Kyanite, 54 %–60 % Al2O3,
18-22 ton lots, calcined,
ex-works USA, USD/st
295–423 351–414 351–439 373–439 373–439
Chinese flintclay, 45 % Al2O3,
FOB China, USD/t80–88 – – – –
European calcined kaolinitic
clay, 47 % Al2O3, FOB, USD/t130–150 – – – –
Mulcoa *products, 47 % Al2O3,
bulk bags, FOB USA, USD/t130–147 130–198 198 198 198
Notes:st – short ton; 1 st = 0.9072 tonne* – Mulcoa is a registered trade name for alumina silica calcines made in Georgia, USA. It is a high mullite
chamotte produced by calcining low alkali clays for consistant quality and chemistry. Mulcoa products have trade marking nos 45, 60, 70 and are utilised in the manufacture of high quality fired and monolithic refractory products.

217Minerals currently mined – Industr ial minerals – Diatomite
1 Borovany-Ledenice
Diatomite
1. Registered deposits and other resources of the Czech Republic
reserved registered deposits exhausted deposits and other resources
2. Basic statistical data of the Czech Republic as of December 31
Number of deposits; reserves; mine production
Year 2009 2010 2011 2012 2013
Deposits – total number 1 1 1 1 1
exploited 1 1 1 1 1
Total mineral *reserves, kt 4 401 4 367 4 318 2 573 2 520
economic explored reserves 4 073 4 039 3 990 1 859 1 808
economic prospected reserves 328 328 328 0 0
potentially economic reserves 0 0 0 714 712
exploitable (recoverable) reserves 4 381 4 349 4 303 1 673 1 624
Mine production, kt 0* 32 46 43 49
* See NOTE in the chapter Introduction above on a terminological difference between Czech official application of the term reserves and standard international application of the term. The relationship of domestic and foreign classifications of mineral reserves and resources is described in the separate chapter Mineral reserve and resource classification in the Czech Republic of this yearbook** Production from previously mined raw material
Exploited deposit:

218Minerals currently mined – Industr ial minerals – Diatomite
3. Foreign trade
2512 – Siliceous fossil meal*, siliceous earth
2009 2010 2011 2012 2013
Import t 3 175 2 753 3 263 3 829 3 693
Export t 3 599 4 230 5 182 6 770 6 569
2512 – Siliceous fossil meal*, siliceous earth
2009 2010 2011 2012 2013
Average import prices CZK/t 8 292 8 690 8 155 8 690 8 784
Average export prices CZK/t 8 072 6 671 5 684 6 103 7 031
Note: * diatomite
6901 – Bricks, blocks, tiles and other ceramic goods of siliceous fossil meals
2009 2010 2011 2012 2013
Import t 2 173 726 2 452 15 014 12 425
Export t 43 19 50 3 173 72
6901 – Bricks, blocks, tiles and other ceramic goods of siliceous fossil meals
2009 2010 2011 2012 2013
Average import prices CZK/t 6 977 6 298 2 913 1 250 1 394
Average export prices CZK/t 60 533 12 389 62 086 43 135 23 430
4. Prices of domestic market
Diatomite was sold domestically for CZK 9 600–15 700 per tonne.
5. Mining companies in the Czech Republic as of December 31, 2013
LB MINERALS, s.r.o., Horní Bříza

219Minerals currently mined – Industr ial minerals – Diatomite
6. World production and world market prices
World mine productionWorld production of diatomite in the past five years was as follows:
2009 2010 2011 2012 2013e
World mine production (according to MCS), kt 1 840 1 820 2 100 2 120 2 150
World mine production (according to WBD), kt 1 558 1 793 1 964 1 968 N
e – preliminary values
There are nine major producers:USA 55.8 % France 3.5 %China 19.5 % Peru 3.4 %Denmark 15.1 % Argentina 2.8 %Japan 4.7 % Spain 2.3 %Mexico 4.0 %
The statistics do not include the extent of world resources. According to MCS, the USA has 250 000 kt of resources and China 110 000 kt.
Prices of traded commodities (USD/t) according to IM
Commodity/Yeark 2009 2010 2011 2012 2013
US, calcined filter-aid grade,
FOB plant370–580 546–610 575–640 555–640 575–640
US, flux-calcined filter-aid grade,
FOB plant380–750 540–786 580–825 580–825 580–825
The price range includes the lowest and highest monthly price quotes for a given year.

220Minerals currently mined – Industr ial minerals – Dolomite
Principal areas of deposits presence:(Names of regions with mined deposits are indicated in bold type)
1 Bohdaneč 5 Hněvotín 9 Kryštofovo Údolí
2 Lánov 6 Horní Rokytnice 10 Křížlice
3 Bystročice 7 Jesenný-Skalka 11 Machnín-Karlov pod Ještědem
4 Čelechovice na Hané 8 Koberovy 12 Podmokly
Dolomite
1. Registered deposits and other resources of the Czech Republic
reserved registered deposits exhausted deposits and other resources

221Minerals currently mined – Industr ial minerals – Dolomite
2. Basic statistical data of the Czech Republic as of December 31
Number of deposits; reserves; mine production
Year 2009 2010 2011 2012 2013
Deposits – total number 12 12 12 12 12
exploited 2 2 2 2 2
Total mineral *reserves, kt 513 382 512 996 512 627 527 219 526 826
economic explored reserves 78 277 77 959 77 608 85 709 85 316
economic prospected reserves 340 843 340 843 340 843 348 288 348 288
potentially economic reserves 94 262 94 194 94 176 93 222 93 222
exploitable (recoverable) reserves 4 381 4 349 10 229 12 615 12 212
Mine production, kt 337 385 369 440 392
* See NOTE in the chapter Introduction above on a terminological difference between Czech official application of the term reserves and standard international application of the term. The relationship of domestic and foreign classifications of mineral reserves and resources is described in the separate chapter Mineral reserve and resource classification in the Czech Republic of this yearbook
Approved prognostic resources P1, P2, P3
Year 2009 2010 2011 2012 2013
P1, kt 23 946 23 946 23 946 23 946 23 946
P2 – – – – –
P3 – – – – –
3. Foreign trade
2518 – Dolomite calcined, roughly trimmed or cut; agglomerated
2009 2010 2011 2012 2013
Import t 417 189 432 068 455 545 399 668 431 159
Export t 18 303 15 133 7 209 30 76
2518 – Dolomite calcined, roughly trimmed or cut; agglomerated
2009 2010 2011 2012 2013
Average import prices CZK/t 244 202 182 201 303
Average export prices CZK/t 2 563 2 569 2 626 5 145 2 618
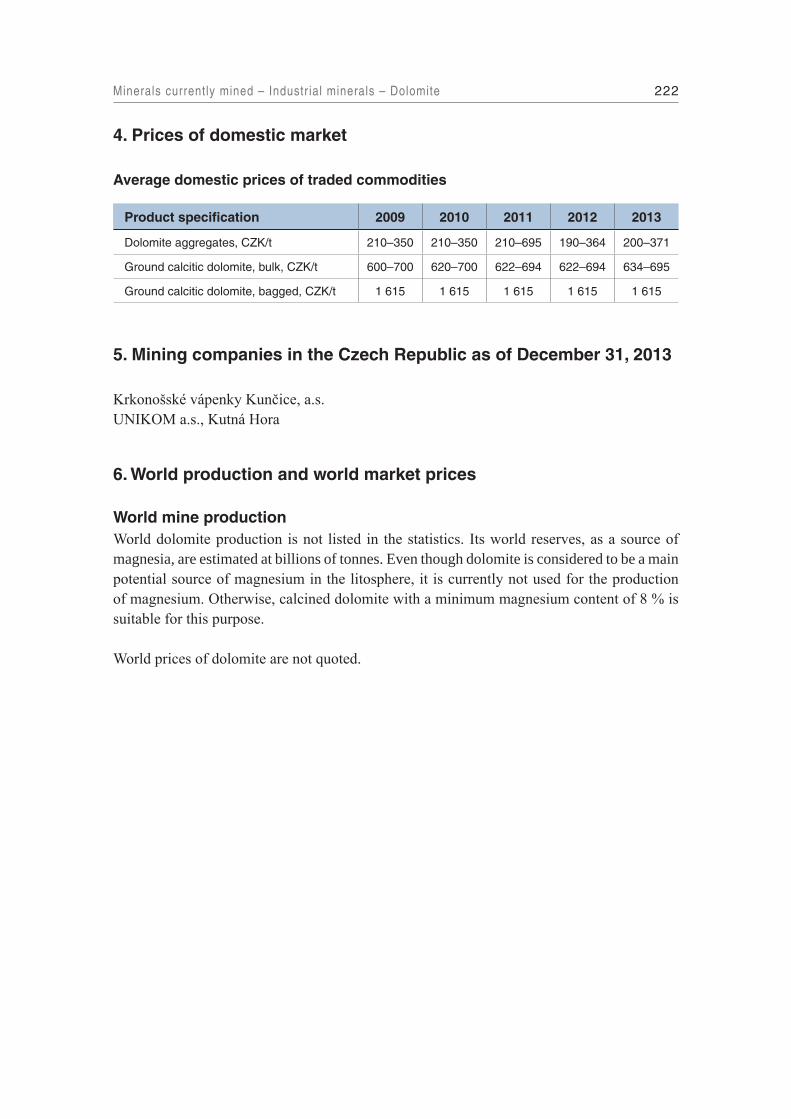
222Minerals currently mined – Industr ial minerals – Dolomite
4. Prices of domestic market
Average domestic prices of traded commodities
Product specification 2009 2010 2011 2012 2013
Dolomite aggregates, CZK/t 210–350 210–350 210–695 190–364 200–371
Ground calcitic dolomite, bulk, CZK/t 600–700 620–700 622–694 622–694 634–695
Ground calcitic dolomite, bagged, CZK/t 1 615 1 615 1 615 1 615 1 615
5. Mining companies in the Czech Republic as of December 31, 2013
Krkonošské vápenky Kunčice, a.s.UNIKOM a.s., Kutná Hora
6. World production and world market prices
World mine productionWorld dolomite production is not listed in the statistics. Its world reserves, as a source of magnesia, are estimated at billions of tonnes. Even though dolomite is considered to be a main potential source of magnesium in the litosphere, it is currently not used for the production of magnesium. Otherwise, calcined dolomite with a minimum magnesium content of 8 % is suitable for this purpose.
World prices of dolomite are not quoted.

223Minerals currently mined – Industr ial minerals – Feldspar
Feldspar
1. Registered deposits and other resources of the Czech Republic
reserved registered deposits
exhausted deposits and other resources
feldspar mineral substitutes (reserved registered deposit and other resources)
1 Sediments of the Lužnice
River region:
1.1 Halámky
1.2 Dvory nad Lužnicí – Tušť
1.1 Krabonoš
1.2 Majdalena
1.1 Tušť – Halámky
2 Sediments of the Jihlava
River (the Syrovice-Ivaň
Terrace):
2 Bratčice
2 Hrušovany u Brna
2 Hrušovany u Brna –
Protlas
2 Ledce – Hrušovany u Brna
2 Medlov
2 Medlov – Smolín
2 Smolín – Žabčice
3 Sediments of the Jihlava River
(the Ivančice region):
3 Ivančice – Němčice
4 Pegmatites (the Poběžovice-
Domažlice region):
4 Luženičky
4 Ždánov
4 Bozdíš
4 Luženičky – WE
4 Meclov 2
4 Meclov – Airport
4 Meclov – West
4 Mutěnín
4 Ohnišťovice – Za Kulichem
5 Pegmatites (the Teplá region):
5 Beroun – Tepelsko
5 Křepkovice – Nezdice
5 Zhořec 1
5 Zhořec 2 – Hanov zone
6 Pegmatites (the western
Moravia region):
6.1 Bory – Olší
6.2 Smrček
7 Granitoids:
7.1 Krásno – Vysoký kámen
7.2 Mračnice
7.3 Hanov u Lestkova
7.4 Štíhlice
7.5 Velké Meziříčí – Lavičky
8 Others:
8.1 Chvalšiny
8.2 Malé (Velké) Tresné
8.3 Markvartice u Třebíče
Feldspar minerals:(Names of exploited deposits are in bold type)

224Minerals currently mined – Industr ial minerals – Feldspar
Feldspar mineral substitutes:
9 Želenice 10 Tašov-Rovný 11 Valkeřice-Zaječí vrch
2. Basic statistical data of the Czech Republic as of December 31
FeldsparNumber of deposits; reserves; mine production
Year 2009 2010 2011 2012 2013
Deposits – total number 34 35 35 37 37
exploited 8 8 9 9 9
Total mineral *reserves, kt 68 788 68 696 68 276 70 191 70 184
economic explored reserves 28 176 27 784 27 392 26 574 25 8898
economic prospected reserves 26 804 27 107 27 079 29 621 30 815
potentially economic reserves 13 808 13 805 13 805 13 996 13 480
exploitable (recoverable) reserves 16 666 15 960 24 940 24 444 24 299
Mine production, kt 431 388 407 445 411
* See NOTE in the chapter Introduction above on a terminological difference between Czech official application of the term reserves and standard international application of the term. The relationship of domestic and foreign classifications of mineral reserves and resources is described in the separate chapter Mineral reserve and resource classification in the Czech Republic of this yearbook
Approved prognostic resources P1, P2, P3
Year 2009 2010 2011 2012 2013
P1, kt 19 737 48 530 48 530 48 530 48 530
P2 – – – – –
P3 – – – – –

225Minerals currently mined – Industr ial minerals – Feldspar
Approved prognostic resources P1, P2, P3
Year 2009 2010 2011 2012 2013
P1 – – – – –
P2, kt 52 900 52 900 52 900 30 300 30 300
P3 – – – – –
3. Foreign trade
252910 – Feldspar
2009 2010 2011 2012 2013
Import t 5 358 6 308 6 551 4 800 5 944
Export t 88 476 115 260 166 859 171 188 173 282
252910 – Feldspar
2009 2010 2011 2012 2013
Average import prices CZK/t 3 205 2 972 2 865 3 225 1 959
Average export prices CZK/t 875 889 947 1 032 1 045
Feldspar substitutes (nepheline phonolites)Number of deposits; reserves; mine production
Year 2009 2010 2011 2012 2013
Deposits – total number 3 3 3 3 3
exploited 1 1 1 1 1
Total mineral *reserves, kt 199 946 199 927 199 905 199 891 199 876
economic explored reserves 0 0 0 0 0
economic prospected reserves 199 946 199 927 199 905 199 891 199 876
potentially economic reserves 0 0 0 0 0
exploitable (recoverable) reserves 24 376 24 357 24 335 24 321 24 306
Mine production, kt 23 19 22 15 15
* See NOTE in the chapter Introduction above on a terminological difference between Czech official application of the term reserves and standard international application of the term. The relationship of domestic and foreign classifications of mineral reserves and resources is described in the separate chapter Mineral reserve and resource classification in the Czech Republic of this yearbook

226Minerals currently mined – Industr ial minerals – Feldspar
4. Prices of domestic market
Feldspars are sold domestically for CZK 97 – 4 800 per tonne depending on their chemism and usage.
5. Mining companies in the Czech Republic as of December 31, 2013
FeldsparLB MINERALS, s.r.o., Horní BřízaKMK GRANIT, a.s., KrásnoDružstvo DRUMAPO, NěmčičkyČeské štěrkopísky spol. s r.o., PrahaAGRO Brno - Tuřany, a.s.
Feldspar substitutesKERAMOST a.s., Most
6. World production and world market prices
World mine productionThe data on world feldspar production and on the production of countries from various sources differ considerably:
Commodity/Year 2009 2010 2011 2012 2013e
World mine production of feldspar
(according to MCS), kt20 000 20 600 21 200 22 700 23 000
World mine production of feldspar
(according to WBD), kt22 347 23 944 24 297 25 470 N
e – preliminary values
252930 – Leucite, nepheline and nepheline syenite
2009 2010 2011 2012 2013
Import t 1 282 1 912 2 252 1 325 2 326
Export t 38 2 2 0 2
252930 – Leucite, nepheline and nepheline syenite
2009 2010 2011 2012 2013
Average import prices CZK/t 6 893 6 170 6 636 6 802 6 736
Average export prices CZK/t 7 132 9 709 10 000 – 11 566

227Minerals currently mined – Industr ial minerals – Feldspar
According to WBD, the top producer is Germany with a 20.9 % share of production, followed by Italy (18.5 %) and Turkey (14 %). Of the 47 producers, the CR ranks fourteenth with 1.8 %. However, the German statistics do not include any domestic production data at all.
According to MCS, Turkey ranked first in feldspar production in both 2012 and 2013. The list of the top ten producers in 2013 is as follows:Turkey 30.4 % Iran 2.8 %Italy 20.4 % Spain 2.6 %China 9.1 % Japan 2.6 %Thailand 4.8 % India 2.3 %France 2.8 % Poland 2.2 %
Total world resources of feldspar are not published. Countries with the largest reserves include Brazil with 320 000 kt and Turkey with 240 000 kt.
Prices of traded commodities (USD/t) (according to IM)
Commodity/Year 2009 2010 2011 2012 2013
Turkish, Na feldspar, crude, max.
10 mm size bulk, FOB GullukUSD/t 22–23 22–23 22–23 22–23 22–23
Turkish, Na feldspar, glass grade,
max. 500 microns, bagged,
FOB Gulluk
USD/t 70 70 70 70 70
Ceramic grade South African,
bagged, FOB DurbanUSD/t 112–145 N N 168 168
Ceramic grade, 170–200 mesh,
(Na), bagged, ex-works USAUSD/st 60–75 N N 150–180 150–180
Na feldspar, floated –150 microns,
bagged, FOB Gulluk, TurkeyUSD/t N N N 53–55 53–55
Na feldspar, floated –500 microns,
bulk, FOB Gulluk, TurkeyUSD/t N N N 38–40 38–40
The price range includes the lowest and highest monthly price quotes for a given year.

228Minerals currently mined – Industr ial minerals – Gemstones
Pyrope-bearing rock: Moldavite-bearing rock: Other gemstones:
1 Podsedice-Dřemčice 8 Hrbov u Lhenic 14 Bochovice *
2 Dolní Olešnice 9 Chlum nad Malší-východ 15 Rašov **
3 Horní Olešnice 1 10 Ločenice-Chlum
4 Horní Olešnice 2 11 Besednice
5 Linhorka-Staré 12 Slavče-sever
6 Třebívlice 13 Vrábče-Nová Hospoda
7 Vestřev
* amethyst, ** opal
Names of mined deposits are indicated in bold type
reserved registered deposits of pyrope-bearing rock
exhausted deposits and other resources of pyrope-bearing rock
reserved registered deposits of moldavite-bearing rock
exhausted deposits and other resources of moldavite-bearing rock
reserved registered deposits of other gemstones
exhausted deposits and other resources of other gemstones
Gemstones
1. Registered deposits and other resources of the Czech Republic

229Minerals currently mined – Industr ial minerals – Gemstones
Year 2009 2010 2011 2012 2013
Deposits – total number a) 14 14 14 14 15
exploited b) 2 2 3 3 3
Total mineral *reserves, kt a) 19 510 19 487 19 471 19 459 19 443
economic explored reserves 3 328 3 305 3 288 3 276 3 260
economic prospected reserves 13 283 13 283 13 002 13 002 13 002
potentially economic reserves 2 899 2 899 3 181 3 181 3 181
exploitable (recoverable) reserves 1 216 1 193 1 176 1 164 1 148
Total mineral *reserves, m3 c) 339 132 793 865 729
718692 072 686 591
economic explored reserves 0 190 078 169 362 154 596 141 638
economic prospected reserves 336 033 600 688 557 257 534 377 541 854
potentially economic reserves 3 099 3 099 3 099 3 099 3 099
exploitable (recoverable) reserves 159 625 732 136 667 589 642 270 636 789
Total mineral *reserves, kt
(1 m3=1.8 t) c) 610 1429 1 313 1 246 1 236
economic explored reserves 0 342 305 278 255
economic prospected reserves 605 1 081 1 003 962 975
potentially economic reserves 6 6 6 6 6
exploitable (recoverable) reserves 287 1 318 1 202 1 156 1146
Mine production, kt a) 26 23 17 12 16
Mine production, ths m3 c) 58 57 65 41 41
Mine production, kt c) (1 m3 = 1.8 t) 104 103 117 74 74
* See NOTE in the chapter Introduction above on a terminological difference between Czech official application of the term reserves and standard international application of the term. The relationship of domestic and foreign classifications of mineral reserves and resources is described in the separate chapter Mineral reserve and resource classification in the Czech Republic of this yearbooka) pyrope‑bearing rockb) one deposit of pyrope , two deposits of moldavite in 2008, one deposit of pyrope, one deposit of moldavite in 2009
and 2010, one deposit of pyrope, two deposits of moldavite in 2011 - 2013.c) moldavite-bearing rock
2. Basic statistical data of the Czech Republic as of December 31
Number of deposits; reserves; mine production

230Minerals currently mined – Industr ial minerals – Gemstones
Approved prognostic resources P1, P2, P3
Year 2009 2010 2011 2012 2013
P1 – – – – –
P2, a) t 100 100 100 100 100
P2, b) kt 749 749 749 749 749
P2, c) ths m3 66 000 66 000 66 000 66 000 66 000
P2, c) kt 119 119 119 119 119
P3 – – – – –
Notes:a) jasperb) pyrope‑bearing rockc) moldavite-bearing rock
3. Foreign trade
7102 – Diamonds, whether or not worked, but not mounted or set
2009 2010 2011 2012 2013
Import kg 283 156 325 1 086 636
Export kg 55 67 32 746 444
7102 – Diamonds, whether or not worked, but not mounted or set
2009 2010 2011 2012 2013
Average import prices CZK/kg 851 025 2 129 526 1 517 606 712 274 543 063
Average export prices CZK/kg 1 605 673 1 885 761 7 862 188 466 015 339 054
7103 – Precious (other than diamond) and semi-precious stones, whether or not worked or graded but not strung, mounted or set
2009 2010 2011 2012 2013
Import kg 173 606 311 474 375 345 231 767 255 550
Export kg 1 495 1 346 1 284 4 146 1 135

231Minerals currently mined – Industr ial minerals – Gemstones
7103 – Precious (other than diamond) and semi-precious stones, whether or not worked or graded but not strung, mounted or set
2009 2010 2011 2012 2013
Average import prices CZK/kg 230 126 122 226 279
Average export prices CZK/kg 16 012 3 779 178 794 7 768 9 978
4. Prices of domestic market
The international gemstone trade is currently so globalized that no substantial price differences exist anywhere in the world including the Czech Republic. The only difference is that rather lower-quality gemstones are imported due to lower purchasing power as well as to less experienced jewellers and customers; high-quality gemstones in the Czech market are rare.
Company Granát, cooperative of art manufacturing in Turrnov, purchased Czech garnets (pyropes) under following conditions in 2011–2013:
Purchase prices of raw Czech garnets by size classes:
Class Screen size (mm) Minimum thickness (mm) Price CZK/g
IV. 2.6–2.9 mm 2.6 mm 6
III. 3.0–3.9 mm 2.6 mm 18
II. 4.0–4.9 mm 3.0 mm 44
I. 5.0–5.9 mm 3.5 mmnegotiated price
from CZK 100 /g
E0 and
bigger From 6.0 mm and more 4.5 mm
negotiated price
from CZK 150 /g
251320 – Emery, natural corundum, natural garnet and other natural abrasives
2009 2010 2011 2012 2013
Import t 987 1 213 1 393 2 419 3 103
Export t 45 47 68 121 375
251320 – Emery, natural corundum, natural garnet and other natural abrasives
2009 2010 2011 2012 2013
Average import prices CZK/t 7 385 6 281 6 467 6 230 6 640
Average export prices CZK/t 17 394 39 921 32 576 11 592 52 624

232Minerals currently mined – Industr ial minerals – Gemstones
Internet wholesale E-vltaviny offered moldavites in the following size–shape-number-price relations (each moldavite was packaged separately in a plastic box with its description):
Mine locality Weight (g) Number of pieces Price (CZK)
Besednice * 2.3–3.1 1 1 422–1 884
mos
tly C
hlum
nad
Mal
ší
0.1–0.5 10 599
0.1–0.5 25 1 325
0.1–0.5 50 2 450
0.1–0.5 100 4 550
0.5–1 10 990
0.5–1 25 2 375
0.5–1 50 4 450
0.5–1 100 7 999
1–5 – –
5–10 – –
10–15 1 1 253–1 488
15–20 1 2 251–2 955
20–45 1 4 770–6 539
Note: * moldavites from this locality are visually regarded as the best
5. Mining companies in the Czech Republic as of December 31, 2013
Pyrope-bearing rockGranát, družstvo umělecké výroby, Turnov
Moldavite-bearing rockMAWE CK s.r.o., Český KrumlovMonday Morning s.r.o., Praha
6. World production and world market prices
World mine productionWorld statistics primarily include diamond production of both gem-grade and industrial diamonds.

233Minerals currently mined – Industr ial minerals – Gemstones
World mine production of jeweller diamonds was as follows:
2009 2010 2011 2012 2013e
World mine production
(according to MCS), ths ct
(ct = carat; 1 ct = 0,2 g)
74 100 79 900 69 900 91 700 91 800
World mine production
(according to MCS), kg14 820 15 980 13 980 18 340 18 360
World mine production
(according to WBD), ths ct
(ct = carat; 1 ct = 0,2 g)
71 891 294 73 444 088 71 006 716 71 908 024 N
World mine production
(according to WBD), kg14 378 14 689 14 201 14 382 N
e – preliminary values
World mine producers share in mine production of jeweller diamonds (MCS):
2012 2013e
ths carats % ths carats %
Congo (Brazzaville) 21 500 23.4 Congo (Brazzaville) 21 500 23.4
Russia 20 700 22.6 Russia 20 700 22.5
Botswana 14 400 15.7 Botswana 14 000 15.3
Zimbabwe 11 000 12.0 Zimbabwe 11 000 12.0
Canada 10 500 11.5 Canada 10 800 11.8
Angola 7 500 8.2 Angola 7 900 8.6
South Africa 2 830 3.1 South Africa 2 800 3.1
Namibia 1 630 1.8 Namibia 1 500 1.6
Lesotho 479 0.5 Lesotho 480 0.5
Sierra Leone 325 0.4 Sierra Leone 300 0.3
e – preliminary values

234Minerals currently mined – Industr ial minerals – Gemstones
World mine producers share in mine production of industrial diamonds (MCS):
2012 2013e
ths carats % ths carats %
Botswana 20 000 26.7 Botswana 22 000 27.5
Congo (Kinshasa) 17 000 22.7 Congo (Kinshasa) 17 000 21.3
Russia 15 000 20.0 Russia 15 000 18.8
Other countries 11 000 14.7 Australia 11 000 13.8
Australia 8 000 10.7 Other countries 11 000 13.8
South Africa 4 000 5.3 South Africa 4 000 5.0
World total 75 000 100.0 World total 80 000 100.0
e – preliminary values
World market pricesGemstone prices are based on type, size and quality in large price ranges.
Rough diamond price: Global average price USD per carat (plus five-year forecast). Excludes lab created diamonds.
Source: Zimnisky P.(2015): Global diamond output to rise in 2015. Mining Journal special publication-PDAC 2015, pp. 17–18.
Year Average price USD/carat
2004 64
2005 66
2006 68
2007 71
2008 78
2009 69
2010 89
2011 115
2012 99
2013 108
2014 103
2015 (P. Zimnisky forecast) 103
2016 (P. Zimnisky forecast) 107
2017 (P. Zimnisky forecast) 114
2018 (P. Zimnisky forecast) 117
2019 (P. Zimnisky forecast) 120
2020 (P. Zimnisky forecast) 120

235Minerals currently mined – Industr ial minerals – Gypsum
Gypsum
1. Registered deposits and other resources of the Czech Republic
1 Kobeřice ve Slezsku-jih 3 Rohov-Strahovice 5 Třebom
2 Kobeřice ve Slezsku-sever 4 Sudice
(Names of mined deposits are indicated in bold type)
reserved registered deposits exhausted deposits and other resources
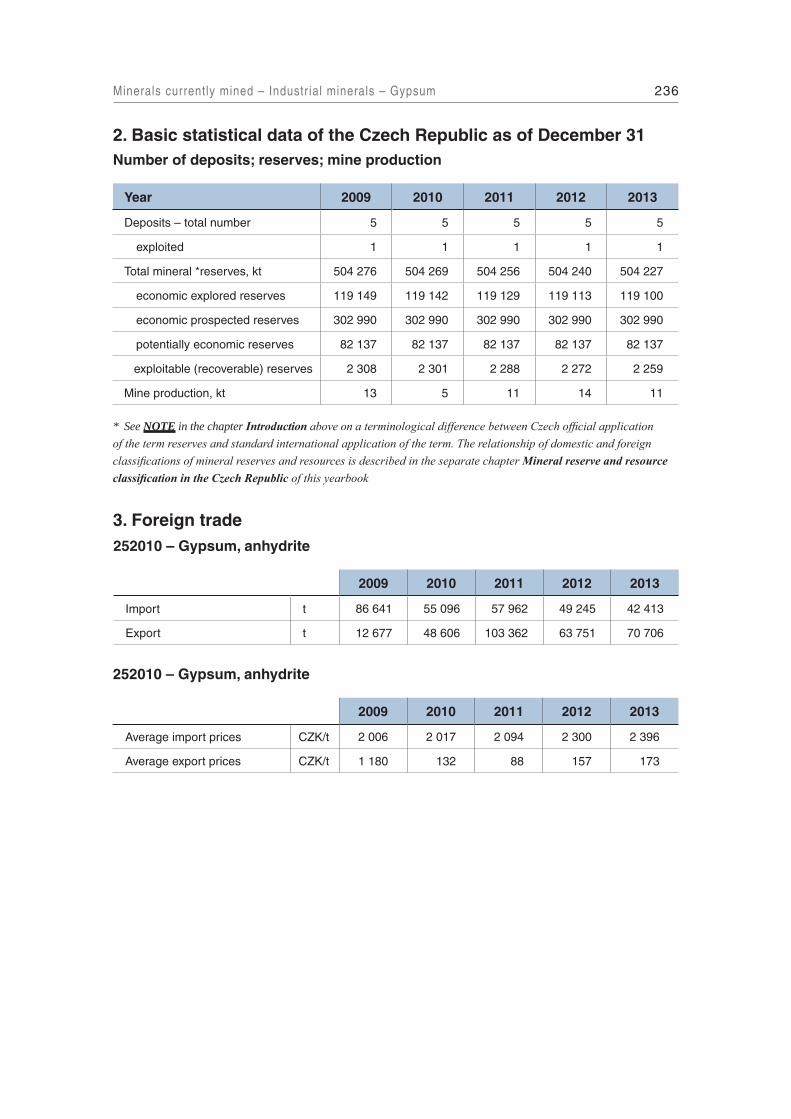
236Minerals currently mined – Industr ial minerals – Gypsum
2. Basic statistical data of the Czech Republic as of December 31Number of deposits; reserves; mine production
Year 2009 2010 2011 2012 2013
Deposits – total number 5 5 5 5 5
exploited 1 1 1 1 1
Total mineral *reserves, kt 504 276 504 269 504 256 504 240 504 227
economic explored reserves 119 149 119 142 119 129 119 113 119 100
economic prospected reserves 302 990 302 990 302 990 302 990 302 990
potentially economic reserves 82 137 82 137 82 137 82 137 82 137
exploitable (recoverable) reserves 2 308 2 301 2 288 2 272 2 259
Mine production, kt 13 5 11 14 11
* See NOTE in the chapter Introduction above on a terminological difference between Czech official application of the term reserves and standard international application of the term. The relationship of domestic and foreign classifications of mineral reserves and resources is described in the separate chapter Mineral reserve and resource classification in the Czech Republic of this yearbook
3. Foreign trade
252010 – Gypsum, anhydrite
2009 2010 2011 2012 2013
Import t 86 641 55 096 57 962 49 245 42 413
Export t 12 677 48 606 103 362 63 751 70 706
252010 – Gypsum, anhydrite
2009 2010 2011 2012 2013
Average import prices CZK/t 2 006 2 017 2 094 2 300 2 396
Average export prices CZK/t 1 180 132 88 157 173

237Minerals currently mined – Industr ial minerals – Gypsum
4. Prices of domestic market
Average prices of traded commodities on the domestic market
2009 2010 2011 2012 2013
mined gypsum, CZK/t 330 N N N N
grey gypsum binder, bagged in 30 kgs, pallets, CZK/t 2 766 3 460 3 460 3 460 3 574
white gypsum binder, bagged in 30 kgs, pallets, CZK/t 4 675 5 851 5 851 5 851 6 044
5. Mining companies in the Czech Republic as of December 31, 2013
GYPSTREND s.r.o., Kobeřice
6. World production and world market prices
World mine productionData on world production of primary gypsum in recent years:
2009 2010 2011 2012 2013e
World mine production of gypsum
(according to MCS), kt148 000 147 000 149 000 152 000 160 000
World mine production of gypsum
(according to WBD), kt 138 253 140 822 139 068 155 968 N
e – preliminary values
According to MCS, of the 83 producing countries, the shares of the top ten in 2013 were as follows:China 31.3 % Russia 3.7 %USA 10.2 % Japan 3.4 %Iran 8.8 % Mexico 3.1 %Thailand 5.6 % Italy 2.5 %Spain 4.4 % India 2.3 %
The total world resources of gypsum are not known. The USA has 700 million tonnes, 450 million tonnes are estimated for Canada, and 230 million tonnes for Brazil.
Gypsum has no worldwide indicative prices.

238Minerals currently mined – Industr ial minerals – Industr ial sands
1 Nýrov** 9 Velký Luh* 17 Lomnička u Plesné**
2 Provodín* 10 Voděrady** 18 Mladějov v Čechách*
3 Rudice-Seč** 11 Babolky** 19 Načešice**
4 Spešov-Dolní Lhota** 12 Blansko 1-Jezírka** 20 Palhanec-Vávrovice**
5 Srní-Okřešice* 13 Blansko 2-Mošna** 21 Polanka nad Odrou**
6 Srní 2-Veselí* 14 Boskovice-Chrudichromy** 22 Rudka-Kunštát**
7 Střeleč* 15 Deštná-Dolní Smržov** 23 Velký Luh 1**
8 Svitavy-Vendolí** 16 Holany** 24 Zahrádky-Srní**
* deposits of glass and foundry sands** deposits of foundry sands
(Names of exploited deposits are in bold type)
Industrial sands
1. Registered deposits and other resources of the Czech Republic
reserved registered deposits exhausted deposits and other resources

239Minerals currently mined – Industr ial minerals – Industr ial sands
2. Basic statistical data of the Czech Republic as of December 31
Glass sandNumber of deposits; reserves; mine production
Year 2009 2010 2011 2012 2013
Deposits – total number 6 6 6 6 6
exploited 5 5 5 5 4
Total mineral *reserves, kt 259 344 258 366 254 942 254 007 254 872
economic explored reserves 89 378 88 415 86 844 86 004 84 755
economic prospected reserves 25 538 25 523 23 523 23 523 25 077
potentially economic reserves 144 428 144 428 144 575 144 480 145 040
exploitable (recoverable) reserves 81 671 80 782 79 873 79 183 78 429
Mine production, kt 990 888 976 849 862
* See NOTE in the chapter Introduction above on a terminological difference between Czech official application of the term reserves and standard international application of the term. The relationship of domestic and foreign classifications of mineral reserves and resources is described in the separate chapter Mineral reserve and resource classification in the Czech Republic of this yearbook
Approved prognostic resources P1, P2, P3
Year 2009 2010 2011 2012 2013
P1, kt 21 750 0 0 0 0
P2, kt 14 927 14 927 14 927 14 927 14 927
P3 – – – – –
Foundry sandNumber of deposits; reserves; mine production
Year 2009 2010 2011 2012 2013
Deposits – total number 23 23 23 23 23
exploited 10 11 11 9 8
Total mineral *reserves, kt 376 774 409 668 409 618 409 079 408 726
economic explored reserves 133 071 129 561 128 903 128 442 127 937
economic prospected reserves 97 066 133 470 133 460 133 448 133 377
potentially economic reserves 146 637 146 637 147 255 147 189 147 412
exploitable (recoverable) reserves 75 520 75 026 78 642 78 535 78 250
Mine production, kt 374 473 395 491 412
* See NOTE in the chapter Introduction above on a terminological difference between Czech official application of the term reserves and standard international application of the term. The relationship of domestic and foreign classifications of mineral reserves and resources is described in the separate chapter Mineral reserve and resource classification in the Czech Republic of this yearbook

240Minerals currently mined – Industr ial minerals – Industr ial sands
Approved prognostic resources P1, P2, P3
Year 2009 2010 2011 2012 2013
P1, kt 23 157 15 157 15 157 15 157 15 157
P2, kt 14 723 14 723 14 723 14 723 14 723
P3 – – – – –
3. Foreign trade
250510 – Silica sands and quartz sands
2009 2010 2011 2012 2013
Import t 284 932 285 692 294 073 235 230 262 866
Export t 445 608 421 217 472 223 388 953 388 052
250510 – Silica sands and quartz sands
2009 2010 2011 2012 2013
Average import prices CZK/t 491 500 535 553 591
Average export prices CZK/t 475 498 475 548 560
7001 – Cullet and other waste and scrap of glass; glass in the mass
2009 2010 2011 2012 2013
Import t 101 287 89 298 141 524 120 129 133 465
Export t 11 080 8 931 8 092 13 565 7 280
7001 – Cullet and other waste and scrap of glass; glass in the mass
2009 2010 2011 2012 2013
Average import prices CZK/t 2 449 2 874 2 169 1 965 1 933
Average export prices CZK/t 847 621 1 082 1 496 2 405
4. Prices of domestic market
Prices of industrial sands are not open to public.

241Minerals currently mined – Industr ial minerals – Industr ial sands
5. Mining companies in the Czech Republic as of December 31, 2013
Glass sandSklopísek Střeleč, a.s., MladějovProvodínské písky a.s., ProvodínLB MINERALS, s.r.o., Horní Bříza
Foundry sandProvodínské písky a.s., ProvodínSklopísek Střeleč, a.s., MladějovLB MINERALS, s.r.o., Horní BřízaSEDOS doprava a.s., DrnoviceKalcit s.r.o., BrnoPEDOP s.r.o., LipovecSETRA s.r.o., Brno
6. World production and world market prices
World mine productionPublicly-available statistical data on industrial sand production are not broken down into glass and foundry sand. The total production in recent years was as follows:
2009 2010 2011 2012 2013e
Industrial sand and gravel (according to MCS), kt 106 000 121 000 138 000 139 000 141 000
e – preliminary values
According to MCS, the top ten producers in 2013 were:USA 37.2 % Australia 4.0 %Italy 11.6 % Spain 3.5 %Germany 5.2 % Mexico 2.6 %Turkey 5.0 % Japan 2.3 %France 4.5 % Moldava 2.1 %
Resources of glass and foundry sand are large and distributed around the world.
Commodity/Year 2009 2010 2011 2012 2013
SiO2 sand, minus 20 micron, bagged,
> 92 brightness, FOB DurbanUSD/t 295 295 295 295 295
Glass sand, container, ex-works USA GBP/t 14–26 20–26 20–26 20–26 20–26
The price range includes the lowest and highest monthly price quotes in IM for a given year.

242Minerals currently mined – Industr ial minerals – Kaolin
Major deposit areas:(Names of areas with exploited deposits are in bold)
1 Karlovy Vary Region 4 Plzeň Region 7 Třeboň Basin
2 Kadaň Region 5 Znojmo Region 8 Vidnava
3 Podbořany Region 6 Cheb Basin
Kaolin
1. Registered deposits and other resources of the Czech Republic
reserved registered deposits exhausted deposits and other resources

243Minerals currently mined – Industr ial minerals – Kaolin
2. Basic statistical data of the Czech Republic as of December 31
Number of deposits; reserves; mine production
Year 2009 2010 2011 2012 2013
Deposits – total number 70 70 70 70 70
exploited 13 13 14 15 15
Total mineral *reserves, kt 1 208 331 1 207 631 1 204 751 1 194 922 1 191 129
economic explored reserves 244 636 240 673 234 061 228 510 225 092
economic prospected reserves 504 720 506 213 507 488 506 058 506 010
potentially economic reserves 458 975 462 222 463 202 460 354 460 027
exploitable (recoverable) reserves 80 024 93 055 102 257 101 277 98 199
Mine production, kt a) 2 886 3 493 3 606 3 318 3 108
Beneficiated (water-washed) kaolin
production, kt488 636 660 624 609
* See NOTE in the chapter Introduction above on a terminological difference between Czech official application of the term reserves and standard international application of the term. The relationship of domestic and foreign classifications of mineral reserves and resources is described in the separate chapter Mineral reserve and resource classification in the Czech Republic of this yearbooka) Raw kaolin, total production of all technological grades;
Approved prognostic resources P1, P2, P3
Year 2009 2010 2011 2012 2013
P1, kt 24 627 29 708 29 708 29 708 25 115
P2, kt 4 998 4 998 4 998 4 998 –
P3 – – – – –
The data of kaolin for production of porcelain and fine ceramics and kaolin used as fillers in paper industry have been stated separately due to great varieties of end use and prices of the individual kaolin types.

244Minerals currently mined – Industr ial minerals – Kaolin
Number of deposits; reserves; mine production
Kaolin for paper industry 2009 2010 2011 2012 2013
Deposits – total number 25 25 26 25 25
exploited 6 6 6 7 7
Total mineral *reserves, kt 301 670 300 649 301 326 295 572 294 576
economic explored reserves 58 589 57 614 55 350 53 186 52 228
economic prospected reserves 183 999 184 015 185 290 183 929 183 929
potentially economic reserves 59 082 59 020 60 686 58 457 58 419
exploitable (recoverable) reserves 27 341 26 468 34 261 33 393 31 319
Mine production, kt a) 700 901 973 877 851
* See NOTE in the chapter Introduction above on a terminological difference between Czech official application of the term reserves and standard international application of the term. The relationship of domestic and foreign classifications of mineral reserves and resources is described in the separate chapter Mineral reserve and resource classification in the Czech Republic of this yearbooka) Exploited deposits: Horní Bříza-Trnová, Chlumčany-Dnešice, Kaznějov-jih, Lomnička-Kaznějov, Otovice-Katzenholz, Rokle
Number of deposits; reserves; mine production
Kaolin for production of porcelain and fine ceramics
2009 2010 2011 2012 2013
Deposits – total number 30 30 30 30 30
exploited 6 7 7 7 7
Total mineral *reserves, kt 256 023 253 228 252 791 252 445 252 089
economic explored reserves 52 748 50 196 49 833 49 556 49 242
economic prospected reserves 111 713 111 713 111 713 111 713 111 713
potentially economic reserves 91 562 91 319 91 245 91 176 91 134
exploitable (recoverable) reserves 6 314 17 919 17 612 17 391 17 122
Mine production, kt a) 257 297 368 302 308
* See NOTE in the chapter Introduction above on a terminological difference between Czech official application of the term reserves and standard international application of the term. The relationship of domestic and foreign classifications of mineral reserves and resources is described in the separate chapter Mineral reserve and resource classification in the Czech Republic of this yearbooka) Exploited deposits: Božičany-Osmosa-jih, Jimlíkov, Krásný Dvůr-Podbořany, Mírová, Podlesí 2, Podlesí-Čapí hnízdo, Ruprechtov

245Minerals currently mined – Industr ial minerals – Kaolin
25070080 – Kaolinic clay (other than kaolin)
2009 2010 2011 2012 2013
Import t 7 186 6 133 7 068 4 204 4 068
Export t 476 583 731 929 599
25070080 – Kaolinic clay (other than kaolin)
2009 2010 2011 2012 2013
Average import prices CZK/t 2 437 3 325 2 418 2 824 3 422
Average export prices CZK/t 4 723 4 015 4 509 5 343 4 615
3. Foreign trade
2507 – Kaolin and other kaolinic clays, whether or not calcined
2009 2010 2011 2012 2013
Import t 13 744 14 124 19 352 17 045 15 815
Export t 379 593 485 427 537 962 507 696 504 180
2507 – Kaolin and other kaolinic clays, whether or not calcined
2009 2010 2011 2012 2013
Average import prices CZK/t 3 658 4 375 3 563 3 976 4 552
Average export prices CZK/t 2 263 2 519 2 629 2 834 2 925
25070020 – Kaolin
2009 2010 2011 2012 2013
Import t 6 558 7 991 12 285 12 841 11 747
Export t 379 117 484 843 537 231 506 766 503 580
25070020 – Kaolin
2009 2010 2011 2012 2013
Average import prices CZK/t 4 995 5 180 4 222 3 976 4 943
Average export prices CZK/t 2 260 2 517 2 627 2 830 2 923

246Minerals currently mined – Industr ial minerals – Kaolin
4. Prices of domestic market
Average prices of traded kaolin on the domestic market
Product specification 2009 2010 2011 2012 2013
Ceramic grade kaolin, CZK/t 2 200–2 950 N 1 100–3 500 2 000–3 000 2 200–3 000
Paper grade kaolin, CZK/t 1 700–2 500 N N 2 100–3 400 2 100–3 500
Kaolin for chemical industry,
microground, CZK/tnad 3 000 N N N N
Kaolin for porcelain manufacture
from Sedlec, CZK/tN N N N N
Beneficiated kaolin from
Podbořany KD, CZK/t1 949 1 949 1 300 – 3 040 N N
Kaolin for manufacture of fine
porcelain and glazes, CZK/t2 392 2 392 2 300 – 3 200 2 600–4 600 3 000–4 800
Activated kaolin from Podbořany
KDA, CZK/t2 900 2 900 N N N
5. Mining companies in the Czech Republic as of December 31, 2013
Kaolin for manufacture of porcelain and fine ceramics Kaolin Hlubany, a.s.Sedlecký kaolin a.s., BožičanyKSB s.r.o., Božičany
Kaolin for ceramics manufacturingLB MINERALS, s.r.o., Horní BřízaSedlecký kaolin a.s., BožičanyKSB s.r.o., Božičany
Kaolin for paper industryLB MINERALS, s.r.o., Horní BřízaKERAMOST a.s., MostSedlecký kaolin a.s., Božičany
Titanium-bearing kaolinSedlecký kaolin a.s., BožičanyKSB s.r.o., Božíčany
Feldspar-bearing kaolinIn 2013 there were no companies mining feldspar-bearing kaolin on the territory of the Czech Republic

247Minerals currently mined – Industr ial minerals – Kaolin
6. World production and world market prices
World mine productionWorld kaolin production in recent years was as follows:
2009 2010 2011 2012 2013e
World mine production (according to MCS), kt 33 000 33 100 33 900 36 200 37 000
World mine production (according to WBD), kt 29 023 30 873 32 301 34 347 N
e – preliminary values
The data from both sources cited clearly differ as follows:Production in kt 2012 according to WBD 2012 according to MCS 2013 according to MCSUSA (1) 5 900 (2) 5 980 (2) 5 950Germany (2) 4 347 .6 (3) 4 900 (3) 4 500India (3) 3 678 N NCzech Rep . (4) 3 318 (4) 3 320 (4) 3 300Chaina (5) 3 300 N NABrazil (6) 2 189 (5) 1 950 (5) 2 050South Korea (7) 1 910 .9 N NUkraine (8) 1 736 (6) 1 300 (7) 1 600England (9) 1 150 (8) 900 (8) 900Turkey (10) 980 .9 (7) 1 200 (6) 2 000Italy (20) 200 (9) 640 (9) 640Spain (15) 332 (10) 303 (10) 300Uzbekistan (?) N (1) 7 000 (1) 7 000
According to MCS statistics, the largets producer of kaolin is Uzbekistan, which is not listed among the 54 producers in the WBD statistics at all . Both statistics do not include China, which is known to be one of the world´s leading producers of kaolin . The CR ranks fourth in both statistics . Its share of world production is 9 .7 % according to WBD, and 8 .9 % according to MCS .
Prices of traded commodities (according to IM)
Commodity/Year 2009 2010 2011 2012 2013
Kaolin № 1 paper coating
grade, Ex-Georgia plantUSD/st 146–185 146–185 150–195 150–209 167.44–217.36
Kaolin № 2 paper coating
grade, Ex-Georgia plantUSD/st 85–147 95–147 100–155 100–166.70 111.8–173.3
Note: st – short ton; 1 st = 0.9072 tonne.
The price range includes the lowest and highest monthly price quotes for a given year .

248Minerals currently mined – Industr ial minerals – Limestones and cement correctives
Major deposit areas:(Names of areas with exploited deposits are in bold)
1 Devonian of the Barrandian
2 Paleozoic of the Železné hory Mts.
3 Central Bohemian Islet Zone
4 Krkonoše Mts.-Jizerské hory Mts. Crystalline Complex
5 South-Bohemian and Moravian Moldanubicum
6 Moravian Devonian
7 Silesicum (Branná Group), Orlické hory Mts.-Kladsko Crystalline Complex and Zábřeh Group
8 Bohemian Cretaceous Basin
9 Outer Klippen Belt of the Western Carpathians
Limestones and corrective additives for cement production
1. Registered deposits and other resources of the Czech Republic
reserved registered deposits exhausted deposits and other resources

249Minerals currently mined – Industr ial minerals – Limestones and cement correctives
2. Basic statistical data of the Czech Republic as of December 31
Limestones – total number Number of deposits; reserves; mine production
Year 2009 2010 2011 2012 2013
Deposits – total number 85 85 85 85 85
exploited 21 21 21 22 22
Total mineral *reserves, kt 4 286 327 4 265 944 4 252 835 4 242 250 4 232 061
economic explored reserves 1 762 240 1 742 290 1 730 722 1 720 472 1 710 231
economic prospected reserves 1 777 754 1 777 529 1 777 351 1 777 016 1 776 915
potentially economic reserves 746 333 746 125 744 762 744 762 744 752
exploitable (recoverable)
reserves1 385 719 1 361 101 1 353 361 1 342 133 1 335 540
Mine production, kt 9 117 9 828 10 859 9 549 9 269
* See NOTE in the chapter Introduction above on a terminological difference between Czech official application of the term reserves and standard international application of the term. The relationship of domestic and foreign classifications of mineral reserves and resources is described in the separate chapter Mineral reserve and resource classification in the Czech Republic of this yearbook
Limestones – total numberApproved prognostic resources P1, P2, P3
Year 2009 2010 2011 2012 2013
P1, kt 114 292 114 292 114 292 114 292 82 489
P2, kt 427 057 427 057 427 057 427 057 350 957
P3 – – – – –
Owing to the importance and considerable differences in technological use and prices, high-percentage limestones, corrective additives for cement production and other limestones are monitored separately.

250Minerals currently mined – Industr ial minerals – Limestones and cement correctives
High-percentage limestones containing 96 % or more of CaCO3
Number of deposits; reserves; mine production
Year 2009 2010 2011 2012 2013
Deposits – total number 27 27 27 27 27
exploited 10 10 10 10 10
Total mineral *reserves, kt 1 369 283 1 368 089 1 361 548 1 356 816 1 351 882
economic explored reserves 635 737 634 543 629 347 624 615 619 681
economic prospected reserves 546 096 546 096 546 096 546 096 546 096
potentially economic reserves 187 450 187 450 186 105 186 105 186 105
exploitable (recoverable) reserves 741 601 737 094 733 125 727 700 726 258
Mine production, kt 4 174 4 389 4 684 4 188 4 491
* See NOTE in the chapter Introduction above on a terminological difference between Czech official application of the term reserves and standard international application of the term. The relationship of domestic and foreign classifications of mineral reserves and resources is described in the separate chapter Mineral reserve and resource classification in the Czech Republic of this yearbook
High-percentage limestones containing 96 % or more of CaCO3
Approved prognostic resources P1, P2, P3
Year 2009 2010 2011 2012 2013
P1, kt 5 400 5 400 5 400 5 400 5 400
P2, kt 26 345 26 345 26 345 26 345 26 345
P3 – – – – –
Other limestonesNumber of deposits; reserves; mine production
Year 2009 2010 2011 2012 2013
Deposits – total number 48 48 48 48 48
exploited 16 16 16 17 17
Total mineral *reserves, kt 2 279 853 2 273 803 2 268 240 2 263 378 2 259 004
economic explored reserves 966 455 960 653 955 286 950 759 946 496
economic prospected reserves 796 115 795 890 795 712 795 377 795 276
potentially economic reserves 517 283 517 260 517 242 517 242 517 232
exploitable (recoverable) reserves 570 302 563 610 560 804 555 957 551 654
Mine production, kt 4 115 4 300 5 205 4 399 3 932
* See NOTE in the chapter Introduction above on a terminological difference between Czech official application of the term reserves and standard international application of the term. The relationship of domestic and foreign classifications of mineral reserves and resources is described in the separate chapter Mineral reserve and resource classification in the Czech Republic of this yearbook

251Minerals currently mined – Industr ial minerals – Limestones and cement correctives
Corrective additives for cement productionApproved prognostic resources P1, P2, P3
Year 2009 2010 2011 2012 2013
P1, kt 86 880 86 880 86 880 86 880 84 493
P2 – – – – –
P3 – – – – –
In many limestone deposits, high-percentage limestones and other limestones are extracted together. Five out of fourteen corrective additives for cement production deposits make part of other limestones deposits.
Other limestonesApproved prognostic resources P1, P2, P3
Year 2009 2010 2011 2012 2013
P1, kt 103 070 103 070 103 070 103 070 71 267
P2, kt 50 000 50 000 50 000 50 000 –
P3 – – – – –
Corrective additives for cement productionNumber of deposits; reserves; mine production
Year 2009 2010 2011 2012 2013
Deposits – total number 15 15 15 15 14
exploited 3 3 3 3 4
Total mineral *reserves, kt 621 989 621 629 621 236 618 267 617 930
economic explored reserves 340 794 340 434 340 041 337 072 336 735
economic prospected reserves 156 785 156 785 156 785 156 785 156 785
potentially economic reserves 124 410 124 410 124 410 124 410 124 410
exploitable (recoverable) reserves 187 292 186 932 186 538 183 745 183 408
Mine production, kt 372 343 385 310 336
* See NOTE in the chapter Introduction above on a terminological difference between Czech official application of the term reserves and standard international application of the term. The relationship of domestic and foreign classifications of mineral reserves and resources is described in the separate chapter Mineral reserve and resource classification in the Czech Republic of this yearbook

252Minerals currently mined – Industr ial minerals – Limestones and cement correctives
2521 – Limestone flux; limestone and other calcareous stone, of kind used for the manufacture of lime or cement
2009 2010 2011 2012 2013
Average import prices CZK/t 173 167 168 192 185
Average export prices CZK/t 474 493 466 472 510
2522 – Quicklime, slaked lime and hydraulic lime
2009 2010 2011 2012 2013
Import t 88 026 106 266 105 506 99 723 98 963
Export t 126 743 153 391 178 510 133 900 167 085
2522 – Quicklime, slaked lime and hydraulic lime
2009 2010 2011 2012 2013
Average import prices CZK/t 1 691 1 604 1 615 1 719 1 824
Average export prices CZK/t 2 098 1 989 1 925 2 117 2 247
2523 – Portland cement, aluminous cement, slag cement, supersulphate cement and similar hydraulic cements, whether or not coloured or in the form of clinkers
2009 2010 2011 2012 2013
Import t 1 058 852 890 708 842 311 753 898 754 966
Export t 616 926 670 725 845 320 676 506 596 748
3. Foreign trade
2521 – Limestone flux; limestone and other calcareous stone, of kind used for the manufacture of lime or cement
2009 2010 2011 2012 2013
Import t 441 951 520 502 458 373 438 035 527 745
Export t 99 693 84 696 155 118 187 743 147 783

253Minerals currently mined – Industr ial minerals – Limestones and cement correctives
2523 – Portland cement, aluminous cement, slag cement, supersulphate cement and similar hydraulic cements, whether or not coloured or in the form of clinkers
2009 2010 2011 2012 2013
Average import prices CZK/t 1 791 1 692 1 672 1 662 1 572
Average export prices CZK/t 1 587 1 434 1 470 1 398 1 416
4. Prices of domestic market
Average prices of traded commodities on the domestic market
Product specification 2009 2010 2011 2012 2013
Cement CEM I, 42,5 R, on pallets,
CZK/t2 400 2 400–2 640 2 640 2 640 2 640
Cement CEM I, 42,5 R, on pallets,
covered with foil, CZK/t2 750 2 700 2 700 2 700 2 700
Cement CEM III A, 32,5 R,
on pallets, CZK/tN 2 300 2 300 2 300 2 300
Cement CEM III A, 32,5 R, on
pallets, covered with foil, CZK/tN 2 360 2 360 2 360 2 360
Dolomitic hydrated lime, bulk, CZK/t N N 3 540 3 790 3 790
Quicklime, ground, bulk, CZK/t N 1 560 1 722 1 773 1 773
Limestone, ground, bulk, CZK/t 480–1 000 390–690 592–643 592–643 570–650
Limestone, crushed, CZK/t 175–320 210–1 408 185–1 408 157–1 408 157–1 408
5. Mining companies in the Czech Republic as of December 31, 2013
High-percentage limestonesVelkolom Čertovy schody a.s., TmaňHolcim (Česko) a.s., člen koncernu, PrachoviceVápenka Vitošov s.r.o., LeštinaLOMY MOŘINA spol.s r.o., MořinaČeskomoravský cement, a.s., Mokrá - HorákovOmya CZ s.r.o.Vápenka Vitoul s.r.o., MladečAgir spol. s r.o., Petrovice

254Minerals currently mined – Industr ial minerals – Limestones and cement correctives
Other limestonesČeskomoravský cement, a.s., Mokrá - HorákovCement Hranice, a.s.Holcim (Česko) a.s., člen koncernu, PrachoviceHASIT Šumav. vápenice a omítkárny, s.r.o., Vel. HydčiceVelkolom Čertovy schody a.s., TmaňOmya CZ s.r.o.LOMY MOŘINA spol. s r.o., MořinaKrkonošské vápenky Kunčice, a.s.Kalcit s.r.o., BrnoLB Cemix, s.r.o., BorovanyLOM SKALKA, s.r.o., Ochoz u Brna
Clayey limestonesLafarge Cement, a.s., Čížkovice
Carbonates for agricultural usePRACTIC 99, s.r.o., Brno
Corrective additives for cement productionČeskomoravský cement, a.s., Mokrá - HorákovCement Hranice, a.s.Holcim (Česko) a.s., člen koncernu, Prachovice
6. World production and world market prices
World mine productionWorld limestone production may be estimated at billions of tonnes. Its amount may be inferred from data on lime and cement manufacture. According to MCS data, world production of these two commodities in recent years was as follows:
2009 2010 2011 2012 2013e
World cement production, mill tonnes 3 060 3 310 3 600 3 800 4 000
World lime production, mill tonnes 299 311 330 348 350
e – preliminary values

255
The same table as above converted to limestone; calculation based on relations 2 tonnes of limestone = 1 tonne of lime or 2 tonnes of cement (mining of limestone for construction purposes is not considered)
2009 2010 2011 2012 2013e
World limestone production derived from
cement production, mill tonnes3 060 3 310 3 600 3 800 4 000
World limestone production derived from lime
production, mill tonnes598 622 660 696 700
World limestone production derived from lime
and cement production, total mill tonnes3 658 3 932 4 260 4 496 4 700
e – preliminary values
The top ten producers of these commodities in 2013 are listed below: Cement in 2013 (MCS) Lime in 2013 (MCS)China 37.5 % China 69.9 %India 7.0 % USA 5.4 %USA 1.9 % India 4.6 %Iran 1.9 % Russia 3.0 %Brazil 1.8 % Brazil 2.4 %Turkey 1.8 % Japan 2.1 %Vietnam 1.6 % Germany 1.9 %Russia 1.6 % Italy 1.7 %Japan 1.3 % Korea, Republic of 1.5 %Saudi Arabia 1.3 % Turkey 1.3 %
Total world resources of limestone are large, but not recorded statistically.
Prices of traded commodities – calcium carbonate (according to IM)
Commodity/Year 2009 2010 2011 2012 2013
CaCO3, (GCC), fine grade,
coated, ex–works UKGBP/t 80–103 80–103 80–103 80–103 80–103
CaCO3, (PCC), coated,
ex–works UKGBP/t 320–550 350–550 370–550 370–550 370–550
CaCO3, (PCC), uncoated,
ex–works UKGBP/t 320–480 320–480 340–550 340–550 340–550
The price range includes the lowest and highest monthly price quotes for a given year.
Minerals currently mined – Industr ial minerals – Limestones and cement correctives

256Minerals currently mined – Industr ial minerals – Sil ica minerals
Quartz – quartzites:
1 Vrábče-Boršov 6 Kaliště 11 Sklená Huť
2 Černava-Tatrovice 7 Kbelnice 12 Stránce
3 Drahoňův Újezd-Bechlov 8 Kublov-Dlouhá Skála 13 Velká Kraš
4 Chomutov-Horní Ves 9 Kyšice-Pohodnice 14 Vikýřovice
5 Jeníkov-Lahošť 10 Litohlavy-Smrkový vrch 15 Železná
Quartz for special glass:
16 Dětkovice 17 Krašovice
(Names of exploited deposits are in bold type)
Silica minerals
1. Registered deposits and other resources of the Czech Republic
reserved registered deposits exhausted deposits and other resources

257Minerals currently mined – Industr ial minerals – Sil ica minerals
2. Basic statistical data of the Czech Republic as of December 31
Number of deposits; reserves; mine production
Year 2009 2010 2011 2012 2013
Deposits – total number 18 18 17 15 15
exploited 1 1 1 1 1
Total mineral *reserves, kt 28 640 28 626 26 166 26 149 25 749
economic explored reserves 907 907 907 907 763
economic prospected reserves 22 981 22 967 20 507 20 490 20 297
potentially economic reserves 4 752 4 752 4 752 4 752 4 689
exploitable (recoverable) reserves 553 540 515 498 528
Mine production, kt 16 14 24 17 15
* See NOTE in the chapter Introduction above on a terminological difference between Czech official application of the term reserves and standard international application of the term. The relationship of domestic and foreign classifications of mineral reserves and resources is described in the separate chapter Mineral reserve and resource classification in the Czech Republic of this yearbook
Approved prognostic resources P1, P2, P3
Year 2009 2010 2011 2012 2013
P1, kt 4 533 4 533 4 533 4 533 4 533
P2 – – – – –
P3 – – – – –
3. Foreign trade
2506 – Quartz (other than natural sands); quartzite, whether or not roughly trimmed or merely cut
2009 2010 2011 2012 2013
Import t 10 483 12 507 13 352 8 295 8 232
Export t 55 29 13 15 15
2506 – Quartz (other than natural sands); quartzite, whether or not roughly trimmed or merely cut
2009 2010 2011 2012 2013
Average import prices CZK/t 2 946 2 535 2 818 3 154 3 099
Average export prices CZK/t 20 600 15 253 37 780 58 510 66 933

258Minerals currently mined – Industr ial minerals – Sil ica minerals
720221 – Ferrosilicon
2009 2010 2011 2012 2013
Import t 22 181 28 758 28 227 26 438 27 869
Export t 4 282 9 492 5 704 7 344 6 915
720221 – Ferrosilicon
2009 2010 2011 2012 2013
Average import prices CZK/t 25 859 30 562 32 466 28 641 26 030
Average export prices CZK/t 23 801 30 284 30 396 26 082 25 634
4. Prices of domestic market
Prices of silica minerals are not open to public.
5. Mining companies in the Czech Republic as of December 31, 2013
Budějovické štěrkopísky spol. s r.o., Vrábče
6. World production and world market prices
World mine productionWorld production of silicon in recent years:
2009 2010 2011 2012 2013e
Silicon production (according to MCS), kt 6 310 7 290 7 370 7 770 7 700
e – preliminary values
The leading producer of silicon (1 500 kt) and ferrosilicon (5 600 kt) in 2013 was China. Its overall output accounted for 66.2l % of world production, followed by Russia (9.1 %), the USA (4.7 %), Brazil (3.0 %) and Norway (2.3 %). With regard to ferrosilicon production, China was followed by Russia, the USA, Brazil and Ukraine.
World resources of silicon are abundant, in view of available reserves of quartzite and silica gravel.

259Minerals currently mined – Industr ial minerals – Sil ica minerals
Prices of traded commodities: – silicon carbide (EUR/tonne) according to Industrial Minerals
Commodity/Year 2009 2010 2011 2012 2013
FEPA 8–220, black, Grade 1,
CIF United Kingdom 1 700–2 100 1 900–2 100 1 900–2 100 1 900–2 100 1 900–2 100
FEPA 8–220, black, Grade 2,
CIF United Kingdom 1 500–1 900 1 500–1 650 1 500–1 650 1 500–1 650 1 500–1 650
Refractory grade, min.
98 % SiC, CIF United Kingdom 900–2 100 1 400–1 800 1 500–1 800 1 500–1 800 1 500–1 800
Refractory grade, min.
95 % SiC, CIF United Kingdom 1 200–1 800 1 250–1 650 1 350–1 450 1 350–1 450 1 350–1 450
The price range includes the lowest and highest monthly price quotes for a given year.
– ferrosilicon (EUR/t) according to Metal Bulletin
Commodity/Year 2009 2010 2011 2012 2013
Lumpy basis, 75% Si
(scale pro rata)750–1 200 950–1 550 1 080–1 550 1 080–1 260 1 060–1 180
The price range includes the lowest and highest daily price quotes for a given year.

260Minerals currently mined – Construction minerals – Aggregates
CONSTRUCTION MINERALS
Aggregates
Aggregates market analysis of selected countries in Central Europe
Nishchay Dayal, Günter TiessMinPol, Agency for International Minerals Policy, Strasshof an der Nordbahn, Austria
1. INTRODUCTION & MARKET DESCRIPTION
1.1 GRAVEL & SAND, CRUSHED STONE: GENERAL MARKET DYNAMICS The sand, gravel and crushed stone industry together with the construction industry can be considered the most resource-intensive sector throughout Europe in terms of the volume of material used. According to Eurostat, they are representing about 40 % of the Direct Material Inputs (DMI) into the European economy (European Environment Agency, 2008).
Construction sand and gravel, which is one of the most accessible natural resources and a major basic raw material, is used mostly by the construction industry. The construction sand and gravel industry is a major contributor to and an indicator of the economic well-being of the Nation, by producing a high volume of basic products with a low unit value. Transportation is a major factor in the delivered price of construction sand and gravel. The cost of moving construction sand and gravel from the plant to the market often exceeds the sales price of the product at the plant. Because of the high cost of transportation, construction sand and gravel continues to be marketed locally. Economies of scale, which might be realized if fewer, larger operations served larger marketing areas, would probably not offset the increased transportation costs. Future demand for construction sand and gravel will continue to be dependent mostly on the growth of construction activity
Crushed stone is a high-volume, low-value commodity. The industry is highly competitive and is characterized by lot of operations serving local or regional markets. Production costs are determined mainly by the cost of labour, equipment, energy, and water, in addition to the costs of compliance with environmental and safety regulations. These costs vary depending on geographic location, the nature of the deposit, and the number and type of products produced. The demand for crushed stone is determined mostly by the level of construction activity, and, therefore, the demand for construction materials. Most crushed stone is used for construction purposes, mainly as aggregate with or without a binder. Road base or road surfacing material, macadam, riprap, and railroad ballast are the major uses without a binder. Aggregate for cement and bituminous concrete in highway and road construction and repair and in residential and non residential construction are the major uses for aggregates with a binder. Other uses include cement and lime manufacture, agriculture, metallurgical flux, and fillers and extenders.

261Minerals currently mined – Construction minerals – Aggregates
1.2 MARKET RESEARCH: APPLIED METHODOLOGYIn this report a market analysis has been performed for selected Central European Union countries for the Sand and Gravel, as well as the Crushed stone industry. Price data has been collected for the mentioned minerals for various European Union countries from 2009–2013. The analysis part involves comparing the change in prices for these minerals in the following years and further a comparison has also been made with the United States of America’s (U.S.A) Market. For the analysis list of countries which have been considered is as follows: Austria, Czech Republic, Poland, Slovakia, Germany, UK, France and Hungary.1
The data for price of aggregate minerals in the various markets has been collected from various sources which have been mentioned in the reference section. At the same time there has been the issue of missing data, wherein the prices were unavailable in some cases the following methodology was applied1. Pricing index for United Kingdom (UK) base as 2005 data and France base as 2009 data2. 2. Linear interpolation/regression of the data, when data is missing for a few years.3. Based on consumption data3, estimating price (using basic demand- price theory*)
In the third methodology, consumption data was calculated empirically (Production + Import – Export) of the primary aggregates (sand and gravel and crushed stone).
After collecting and observing the data for price of gravel and sand, crushed stone, average price was calculated for the European countries and compared with the price in U.S.A from 2009–2013. Important changes and observed trends in the price are provided as a part of analysis. For better understanding of the analysis, the countries are analyzed after segregating them into developed and developing economies.
2. MARKET ANALYSIS
2.1 COUNTRYWISE MARKET RESEARCH AND ANALYSIS: EU2.1.1 SAND AND GRAVELPrices quoted are (net) ex-works sand and gravel prices per tonne. The Hungarian, British, Slovak and Polish prices are converted into euro (Slovakia adopted the euro in 2009). The exchange rates resulted from the daily information of the Austrian National Bank, as on 27. 8. 2014:
1 EUR 312.55 Hungarian Forint
1 EUR 4.20 Polish Zloty
1 EUR 0.79 British Pound
1 EUR 30.3 Slovak Koruna
* A theory relating to the relationship between consumer demand for goods and services and their prices. Demand theory forms the basis for the demand curve, which relates consumer desire to the amount of goods available. As more of a good or service is available, demand drops and therefore so does the equilibrium price. However, if demand is high and the quantity of supply is scarce in that case the prices may rise. (Source: Investopedia)

262Minerals currently mined – Construction minerals – Aggregates
Country name 2009 2010 2011 2012 2013
Austria4 9.6 10.77 11.7 11 12.3
Czech5 8.74 7.09 8.66 6.96 8.71
Poland 9.3 14.75 20 21.2 24.6
Slovakia 7.1 7.9 8.9 8.3 8.8
Germany6 10.2 11.1 11.71 12.78 13.1
UK7 12.8 13.8 13.9 15.05 16.4
France 8.1 8.2 8.3 8.5 8.6
Hungary8 3.8 8.7 6.1 6.7 6.1
Average 8.7 10.3 11.2 11.3 12.3
Using Price Indices with base as 2005 data for UK and 2009 data for France
Interpolated
(Source: Market evaluation conducted by MinPol)
TABLE 1: Price of sand and gravel in various EU nations in EUR/tonne from 2009–2013
Figure 1: Sand and gravel price trend in selected EU nations 2009-2013
(Source: Market evaluation conducted by MinPol)

263Minerals currently mined – Construction minerals – Aggregates
Sand and gravel price development between 2009 and 2013 in percentage in terms of developed economies and developing respectively emerging economies is as follows
Developed economies:Austria +28.13 %Germany +28.43%France +6.79 %United Kingdom +28.13 %
Developing economies:Czech Republic –0.34 %Poland +164.51 %Slovakia +23.94 %Hungary +60.52 %
It is evident from the provided data that the prices have not fluctuated much in the developed economies. The change in the prices in case of developing economies also has not been too steep with the exception of Poland and Hungary. It is observed that Poland saw the highest swell in prices which soared over twice their value relative to that in 2009 in the given period of five years. Poland was followed by Hungary which showed a marked increase in prices during the period. For the other countries like Germany, UK, Austria and Slovakia the increment has been moderate over the five years. For France the prices have increased by a slight amount over the past years.
It must be noted that the price/ton in UK since 2009 has been estimated using price indices (with base as 2005), thus the value provided is a close approximation to the actual prices prevailing in the UK market. Similar methodology has been applied for France with base as prices prevailing in 2009.
For Germany there has been a nominal increase of about 28 % in 5 years. Lack of investments in the construction sector was the outcome of the 2009 recession. However, despite the debt crisis Germany is showing positive signs of solid economic growth as the GDP has been showing a noticeable increase ever since 2009 and the construction sector is expected to show a decent growth of 1.6 % in 2014.9
For Poland, the price has consistently showed an increasing trend in the given span. The price in 2009 was hovering around 9 euro/ton which has skyrocketed to 24.6 euro/tonne in 2013, an increase by over 150 %.10 The accession of Poland in EU led to the start of modernisation and development of many sectors of the economy. A large proportion of the funds received were spent on infrastructure, mainly roads, with the aim of synchronising them with the European transport system11. Aggregate producers were located in the Southern Poland and the road construction plan was being executed in the Northern part. This led to an additional increase in the prices of sand and gravel.12, 13
Similarly for Hungary the price has increased by almost 61 % from 2009 to 2013.For Austria, the price has shown a modest increase of about 28 % comparable to most of
the other nations.14 We observe a decrease in prices in the year 2012 caused due to fall in the Austrian Economy in the corresponding year shown by a decrease in demand of sand and gravel.15
We observe a decrease in prices by a marginal amount in the Czech Republic.

264Minerals currently mined – Construction minerals – Aggregates
Czech construction output continued to fall in 2013, the fifth consecutive year of decline. The reason for the drop was mainly due to decreasing demand for construction brought on by the economic situation. Moreover, in 2013, the Czech construction output saw its steepest decline in the last six years. In 2014 the Czech construction industry is expected to stabilise before seeing the first signs of recovery in 2015.16
United Kingdom recorded a significant increase in sales volumes of sand and gravel thanks to the incipient recovery in residential construction.17
Price trend for United States and average price in Europe can be seen in Figure 2. The development of prices in the USA and EU indicate (continuous) increasing prices, however, with price differences of about 4-6 €. European sand and gravel prices indicate a considerable higher price level and stronger increasing in terms of percentage. In 2013 for U.S was 5.9 euro/tonne18 and EU average was around 12.3 euro/tonne.
The increase in case of European Nations is much steeper compared to the USA. This can be attributed to the price change in developing economies (Poland, Hungary, Czech Republic and Slovakia), which have been higher than their developed counterparts in Europe and the USA. It is rather an expected result since in developing nations the demand for construction materials have an increasing trend, due to the expanding economy. Thus the average price of a set of developed and developing nations (European Union) is giving a higher value than a developed nation (United States).
EXCHANGE RATE AS ON 27. 8. 2014
1 Euro 1.32 U.S Dollar
Figure 2: Sand and gravel trend comparison between USA and EU 2009-2013
(Source: Market evaluation conducted by MinPol, USGS)

265Minerals currently mined – Construction minerals – Aggregates
2.1.2 CRUSHED STONES
FIGURE 3: Crushed stone price trend in selected EU nations 2009–2013
(Source: Market evaluation conducted by MinPol)
TABLE 2: Price of crushed stone in various EU nations in EUR/tonne from 2009–2013
Country name 2009 2010 2011 2012 2013
Austria19 10.7 10.52 10.36 10.2 12.8
Czech20 10.93 10.48 10.88 11 9.65
Poland 9.8 10.93 12.1 13.2 14.32
Slovakia 9.1 8.1 8.6 8.8 10.4
Germany 10.1 12.3 14.5 13.3 18.4
UK21 12.8 13.1 13.7 13.6 18.48
France 7.1 7.2 7.4 7.6 7.6
Hungary22 11.8 12.2 12.5 14.7 14.05
Average 10.3 10.6 11.2 11.5 13.2
Based on Price Indices with base as 2005 data
Interpolated
Approx, based on production stats
(Source: Market evaluation conducted by MinPol)

266Minerals currently mined – Construction minerals – Aggregates
Prices quoted are (net) ex-works crushed stone prices per ton. The Hungarian, British, Slovak and Polish prices are converted into Euro (Slovakia adopted the Euro in 2009). The exchange rates resulted from the daily information of the Austrian National Bank, as on 27. 8. 2014:
1 Euro 312.55 Hungarian Forint
1 Euro 4.20 Polish Zloty
1 Euro 0.79 British Pound
1 Euro 30.3 Slovak Koruna
Crushed stone price development between 2009 and 2013 in percentage in terms of developed economies and developing respectively emerging economies is as follows
Developed economies:Austria +19.62 %Germany +82.17 %France +6.76 %United Kingdom +44.38 %
Developing economies:Czech Republic –11.71 %Poland +46.12 %Slovakia +14.29 %Hungary +19.06 %
As is evident from the provided data the prices have not shown an appreciable increase in most of the developing economies. The maximum increase is observed in the case of Germany, followed by Poland and UK France showed a constant trend in case of crushed stone as well.
There has been a decrease in price of crushed stone in the Czech Republic from 10.93 euro/tonne in 2009 to 9.65 euro/tonne in 2013. This can be related to the decrease in construction activity also reflecting in the decreased GDP/capita of the nation.23 The Czech construction market continued to decline at single-digit pace and certain growth in output is only likely to return in 2014–2015. Cancelled civil engineering construction, particularly in the road infrastructure sector, combined with weaker development in the non-residential segment caused for low demand; a consequence of which was the low price of crushed stone.24
Austria shows a moderate increase in price during 2009–13. The outlook for the construction industry is favourable, as a result of the government’s focus on country’s infrastructure and residential construction.25
Private residential construction was also the growth driver in the United Kingdom. Construction activity in the United Kingdom increased by 1.3 % after a decline in 2012. While deliveries of aggregates rose in the United Kingdom, they remained significantly below the previous year in Germany.
Construction in Germany benefited from the strong economic development, but activities were impaired by the prolonged winter and the floods in the east of the country. Total

267Minerals currently mined – Construction minerals – Aggregates
construction investments in Germany rose only slightly in 2013 compared with the previous year, despite continued strong demand from residential construction. This is evidently reflected in the price rise as demand was more however the supply fell short.26
France’s construction industry is undergoing a period of weakness. The economy is experiencing downfall due to economic troubles in the Eurozone, and this will result in a similar trend in construction activity in the early part of 2014.27
Price trend for United States and average price in Europe can be seen to follow almost a similar trend with price differences of about 4–5 EUR. In 2013, for US the average price of crushed stone was 7.4 euro/tonne and for EU it was 13.2 euro/tonne.28
This is rather an expected observation as the demand for crushed stone in the EU countries has been on the rise owing to inclusion of developing nations (Hungary, Poland, Czech Republic and Slovakia) even as the capacity of the European construction sector remains near depression levels giving rise to high prices. The USA market shows a more or less constant increase in the prices.
EXCHANGE RATE AS ON 27. 8. 2014
1 Euro 1.32 U.S Dollar
Figure 4: Crushed stone trend comparison between U.S.A & EU, 2009–2013
(Source: Market evaluation conducted by MinPol, USGS)

268Minerals currently mined – Construction minerals – Aggregates
REFERENCES
European Environment Agency (2008). Effectiveness of environmental taxes and charges for managing sand, gravel and rock extraction in selected EU countries, EEA Report No 2/2008
1 Data for 2009 collected from: Crushed stone, Günter Tiess, Jörg, Heimburg Montanuniversität Leoben, Chair of Mining
Engineering, Leoben, Austria, 2010 Sand & Gravel, Günter Tiess, Jörg, Heimburg Montanuniversität Leoben, Chair of Mining
Engineering, Leoben, Austria, 2010 2 Monthly Statistics of Building Materials and Components, Department of Business
Innovation and Skills, No. 437, July 2011 Monthly Statistics of Building Materials and Components, Department of Business
Innovation and Skills, No. 451, September 2012 Monthly Statistics of Building Materials and Components, Department of Business
Innovation and Skills, No. 456, February 2013 Producer price index in industrial production sold in France – Market prices – CPF 08.12 –
Sand, gravel, fine gravel, limestone gravel, National Institute of Statistics and Economic Studies
3 Production Data Collected from World Mineral Statistics, British Geological Survey 4 Sand and gravel (Previous Year’s Report),Günter Tiess, Jörg Heimburg, Montanuniversität
Leoben, Chair of Mining Engineering, Leoben, Austria Preisliste 2013 Beton, Kies & Stein 5 MINERAL COMMODITY SUMMARIES OF THE CZECH REPUBLIC 2009, 2010, 2011,
2012, 2013; Czech Geological Survey, Czech Republic Cenik Kameniva 2013, Ridera 6 Besides others, the following sources were used: Preisliste 2011, Holcim Kies and Beton
GmBH Preislisten 2013 Holcim SandKies, Karlsruhe, Kies und Beton Preisliste 2012, Holcim Kies and Beton GmBH Preisliste 2011, Kies, Sand, RC-Baustoffe, Schmidt Preisliste 2009/2010, Radmer Sand and Kies http://www.aggbusiness.com/sections/market-reports/features/germany-europes-top-
aggregates-producer-continues-to-lead-the-way-out-of-the-recession/ 7 Monthly Statistics of Building Materials and Components, 4th June 2014 8 Mean aggregates prices in Hungary between 2008–2013, K. Sari, Z. Cseh, Z. Horváth, 2013 9 http://countryeconomy.com/gdp/germany10 Price List 2011, 2012, 2013, Alamo Water, Poland11 http://www.aggbusiness.com/sections/market-reports/features/polands-aggregates-
production-forges-ahead/12 Geological survey of Spain, Chief of external Affairs, January 201013 Summary mapping Resource Prices, 25th October 2012, ECORYS, Nederland BV14 Besides others, the following sources were used: Preisliste 2010, Sand-Schotter-Kies, Asamer
Preisliste 2011, Sand-Schotter-Kies, Asamer Preisliste 2012, Sand-Schotter-Kies, Asamer
Preisliste 2013, Sand-Schotter-Kies, Asamer

269
15 AUSTRIAN ECONOMIC REPORT 2012, May 201316 MarketResearchReports.com: Construction Sector in Czech Republic in 201417 HeidelbergCement Annual Report 201318 http://www.statista.com/statistics/219381/sand-and-gravel-prices-in-the-us/19 Crushed stone, Günter Tiess, Jörg, Heimburg Montanuniversität Leoben, Chair of Mining
Engineering, Leoben, Austria, 201020 Mineral Commodity Summaries of the Czech Republic, Ministry of Czech Geological Survey –
GEOFOND, October 2011 Other Sources include: Českomoravský štěrk, a.s. Úsek prodeje ČMŠ, Heidelberg Cement, 201421 http://www.fgclassified.com/71210-crushed-stone-prices-including-vat/details.html22 Mean aggregates prices in Hungary between 2008–2013 , K. Sari, Z. Cseh, Z. Horváth, 201323 http://countryeconomy.com/gdp/czech-republic24 http://www.ceeconstruction.com/analysis/123/czech-construction-market-to-stabilise-in-
coming-years25 Construction in Austria, Key trends and opportunities to 201726 HeidelbergCement Annual Report 201327 Timetric Construction Reports: Construction in France, 201328 U.S. Geological Survey, Mineral Commodity Summaries, February 2014
Minerals currently mined – Construction minerals – Aggregates

270Minerals currently mined – Construction minerals – Crushed stone
Because of the large number of crushed stone deposits in the Czech Republic, they are not listed.
reserved deposits – mined (150)
reserved deposits – unmined (169)
non-reserved deposits – mined (40)
non-reserved deposits – unmined (179)
Crushed stone
1. Registered deposits and other resources of the Czech Republic

271Minerals currently mined – Construction minerals – Crushed stone
2. Basic statistical data of the Czech Republic as of December 31
Reserved deposits: Number of deposits; reserves; mine production
Year 2009 2010 2011 2012 2013
Deposits – total number 317 318 320 319 319
exploited 166 164 165 170 169
Total mineral *reserves, ths m3 2 346 363 2 392 813 2 392 105 2 391 958 2 383 849
economic explored reserves 1 153 009 1 156 294 1 157 255 1 155 910 1 089 703
economic prospected reserves 1 043 741 1 089 355 1 090 044 1 091 875 1 149 727
potentially economic reserves 149 613 147 164 144 806 144 173 144 419
exploitable reserves 718 922 715 142 717 064 715 299 704 187
Mine production in reserved
deposits, ths m3 13 947 12 350 12 299 10 950 11 420
* See NOTE in the chapter Introduction above on a terminological difference between Czech official application of the term reserves and standard international application of the term. The relationship of domestic and foreign classifications of mineral reserves and resources is described in the separate chapter Mineral reserve and resource classification in the Czech Republic of this yearbook
Approved prognostic resources P1, P2, P3
Year 2009 2010 2011 2012 2013
P1, ths m3 78 950 78 950 78 950 78 950 61 357
P2, ths m3 399 314 399 314 399 314 399 314 408 807
P3 – – – – –
Non-reserved deposits: Number of deposits; reserves; mine production
Year 2009 2010 2011 2012 2013
Deposits – total number 215 213 214 219 219
exploited 50 48 47 47 40
Total mineral *reserves, ths m3 1 038 869 1 011 792 1 019 574 1 029 457 1 022 363
economic explored reserves 45 772 43 376 43 075 46 617 42 452
economic prospected reserves 912 925 888 377 892 905 899 291 896 645
potentially economic reserves 80 172 80 039 83 594 83 549 83 266
exploitable reserves 34 710 36 000 46 300 43 500 45 084
Mine production in non-reserved
deposits, ths m3 a) 1 350 1 450 1 300 1 100 969
* See NOTE in the chapter Introduction above on a terminological difference between Czech official application of the term reserves and standard international application of the term. The relationship of domestic and foreign classifications of mineral reserves and resources is described in the separate chapter Mineral reserve and resource classification in the Czech Republic of this yearbooka) estimate

272Minerals currently mined – Construction minerals – Crushed stone
4. Prices of domestic market
Domestic prices of crushed stone – nationwide
Product specification 2009 2010 2011 2012 2013
crushed stone, spilite, fraction 4–8mm, CZK/t 284 259 269 292 274
crushed stone, amphibolite, fraction 4–8 mm, CZK/t 345 336 340 334 345
crushed stone, granite, fraction 4–8 mm, CZK/t 288 305 323 309 332
crushed stone, gneiss, fraction 4–8 mm, CZK/t 319 308 319 321 317
crushed stone, porphyry, fraction 4–8 mm, CZK/t 319 300 316 307 290
crushed stone, granodiorite, fraction 4–8 mm, CZK/t 311 323 298 311 319
crushed stone, greywacke, fraction 4–8 mm, CZK/t 297 298 315 309 315
crushed stone, basalt, fraction 4–8 mm, CZK/t 294 230 293 298 299
crushed stone, hornfels, fraction 4–8 mm, CZK/t 248 248 248 255 239
crushed stone, limestones, fraction 4–8 mm, CZK/t 271 255 258 261 259
crushed stone, spilite, fraction 8–16 mm, CZK/t 278 244 262 268 269
crushed stone, amphibolite, fraction 8–16 mm, CZK/t 276 269 275 273 270
crushed stone, granite, fraction 8–16 mm, CZK/t 265 248 241 242 248
crushed stone, gneiss, fraction 8–16 mm, CZK /t 258 247 255 255 252
crushed stone, porphyry, fraction 8-16 mm, CZK/t – 220 248 245 –
crushed stone, granodiorites, fraction 8–16 mm, CZK /t 250 243 256 254 263
crushed stone, greywacke, fraction 8–16 mm, CZK /t 259 261 268 267 263
crushed stone, basalt, fraction 8–16 mm, CZK /t 261 240 267 271 269
crushed stone, hornfels, fraction 8–16 mm, CZK /t 238 238 238 216 224
crushed stone, limestones, fraction 8–16 mm, CZK /t 235 220 230 230 232
3. Foreign trade
251710 – Pebbles, gravel, broken or crushed stone
2009 2010 2011 2012 2013
Import t 229 132 214 440 221 539 223 321 290 563
Export t 344 972 364 457 695 285 384 132 432 645
251710 – Pebbles, gravel, broken or crushed stone
2009 2010 2011 2012 2013
Average import prices CZK/t 342 403 345 333 297
Average export prices CZK/t 187 249 283 234 168

273
Domestic prices of crushed stone in 2013 – subdivided by rocks and regions which the rocks are mined in
Minerals currently mined – Construction minerals – Crushed stone

274Minerals currently mined – Construction minerals – Crushed stone
Domestic prices of crushed stone in 2013 – subdivided by regions and rocks mined in them

275Minerals currently mined – Construction minerals – Crushed stone
Average domestic prices of crushed stone in 2013 – by regional units
5. Mining companies in the Czech Republic as of December 31, 2013
Crushed stone – registered depositsČeskomoravský štěrk, a.s., Mokrá KAMENOLOMY ČR s.r.o., Ostrava –
Svinov EUROVIA Kamenolomy, a.s., Liberec KÁMEN Zbraslav, spol. s r.o. 716.00
71732COLAS CZ, a.s., Praha Kámen a písek s.r.o., Český KrumlovM – SILNICE a.s., Pardubice BASALT CZ s.r.o, Všechlapy CEMEX Sand, k.s., Napajedla BÖGL a KRÝSL, k.s., Praha Berger Bohemia a.s., Plzeň GRANITA s.r.o., Skuteč Skanska a.s., PrahaKámen Brno s.r.o. Silnice Čáslav – Holding, a.s. ZAPA beton a.s., Praha C4SC78 s.r.o., PrahaSHB s.r.o., Bernartice RENO Šumava a.s., Vlachovo Březí Basalt s.r.o., Zabrušany Lom Klecany, s.r.o., Praha 9 LOMY MOŘINA spol.s r.o., MořinaDOBET s.r.o., Ostrožská Nová Ves Rosa s.r.o., Drásov Žula Rácov, s.r.o., Batelov BES s.r.o., Benešov Ludvík Novák, Komňa
OLZ, a.s., Olomouc Zemědělské družstvo Šonov u BroumovaŽPSV a.s., Uherský Ostroh František Matlák, Mochov PEDOP s.r.o., Lipovec Stavební recyklace s.r.o., Sokolov LOM DEŠTNO a.s., SedlčanyMadest s.r.o., Pavlice Froněk s.r.o., Rakovník HUTIRA – OMICE, s.r.o., Omice ČNES dopravní stavby a.s., Kladno PETRA – lom Číměř, s.r.o. KARETA s.r.o., BruntálEKOZIS spol. s r. o., Zábřeh FORTEX – AGS, a.s., Šumperk Kozákov – družstvo, Záhoří Weiss s.r.o., Děčín LB spol. s r.o., Nová Role JHF Heřmanovice spol. s r.o. NATRIX, a.s., BojkoviceThorssen s.r.o., Kamenolom MladeckoKamenolom KUBO s.r.o., Malé ŽernosekyEKOSTAVBY Louny s.r.o. Pavel Dragoun, Cheb Daosz, s.r.o., Jesenec
Crushed stone – non-registered depositsSokolovská uhelná, právní nástupce, a.s.,
Sokolov Kámen a písek s.r.o. Český Krumlov

276Minerals currently mined – Construction minerals – Crushed stone
Českomoravský štěrk, a.s., Mokrá SILNICE MORAVA s.r.o., Krnov KÁMEN Zbraslav, spol. s r.o. COLAS CZ, a.s., Praha ZETKA Strážník a.s., Studenec Basalt s.r.o., Zabrušany LOM Babí, a.s., Trutnov Kamenolom Žlutava, s.r.o. DOBET s.r.o., Ostrožská Nová Ves KAMENOLOMY ČR s.r.o., Ostrava –
SvinovRENO Šumava a.s., Vlachovo Březí Lesy České republiky, s.p., Hradec Králové Stavoka Kosice a.s.
LB spol. s r.o., Nová Role EUROVIA Kamenolomy, a.s., Liberec LOMY MOŘINA spol.s r.o., MořinaSENECO s.r.o., Polná GRANITA s.r.o., Skuteč EKOZIS spol. s r. o., Zábřeh Kozákov – družstvo, Záhoří ZUD a.s., Zbůch Lesostavby Frýdek-Místek, a.s. Kalcit s.r.o., Brno Obec Hošťálková Petr Vaněk – Lomstav, Horní Maršov Kamena výrobní družstvo Brno Lesní družstvo obcí, Přibyslav
6. World production and world market prices
Mine production of the crushed stone is frequently reported together with sand and gravel under the term aggregates.
Crushed stone prices are not formed on the international market. Neither indicative regional prices are quoted.
Aggregates market and prices in the European Union, especially in the Central European countries, are described in „Aggregates market analysis of selected countries in Central Europe“ subchapter of this yearbook.

277Minerals currently mined – Construction minerals – Sand and gravel
Because of their large number, deposits of sand and gravel are not listed.
Sand and gravel
1. Registered deposits and other resources of the Czech Republic
reserved deposits – mined (80)
reserved deposits – unmined (127)
non-reserved deposits – mined (84)
non-reserved deposits – unmined (258)

278Minerals currently mined – Construction minerals – Sand and gravel
2. Basic statistical data of the Czech Republic as of December 31
Reserved deposits: Number of deposits; reserves; mine production
Year 2009 2010 2011 2012 2013
Deposits – total number 208 206 206 207 207
exploited 72 72 72 74 80
Total mineral *reserves, ths m3 2 112 759 2 134 304 2 126 991 2 120 076 2 138 208
economic explored reserves 1 123 164 1 129 913 1 126 123 1 114 756 1 102 371
economic prospected reserves 765 626 782 190 780 987 785 479 813 918
potentially economic reserves 223 969 222 201 219 881 219 841 221 919
exploitable reserves 356 412 358 569 362 676 379 201 381 649
Mine production in reserved deposits, ths m3 7 269 6 187 6 902 6 136 5 346
* See NOTE in the chapter Introduction above on a terminological difference between Czech official application of the term reserves and standard international application of the term. The relationship of domestic and foreign classifications of mineral reserves and resources is described in the separate chapter Mineral reserve and resource classification in the Czech Republic of this yearbook
Approved prognostic resources P1, P2, P3
Year 2009 2010 2011 2012 2013
P1, ths m3 146 177 146 177 146 177 146 177 149 027
P2, ths m3 1 007 985 1 007 985 1 007 985 1 007 985 946 239
P3 – – – – –
Non-reserved deposits: Number of deposits; reserves; mine production
Year 2009 2010 2011 2012 2013
Deposits – total number 338 340 338 339 342
exploited 96 94 95 90 84
Total mineral *reserves, ths m3 2 097 034 2 080 639 2 078 255 2 079 420 2 107 576
economic explored reserves 110 585 107 925 107 945 107 478 106 863
economic prospected reserves 1 745 512 1 734 314 1 731 910 1 733 544 1 760 824
potentially economic reserves 240 937 238 400 238 400 238 398 239 889
exploitable reserves 50 350 50 300 54 600 52 100 50 695
Mine production in non-reserved
deposits, ths m3 a) 6 050 4 550 5 000 4 300 4 297
* See NOTE in the chapter Introduction above on a terminological difference between Czech official application of the term reserves and standard international application of the term. The relationship of domestic and foreign classifications of mineral reserves and resources is described in the separate chapter Mineral reserve and resource classification in the Czech Republic of this yearbooka) estimate

279
3. Foreign trade
250590 – Other sand (natural sand of all kinds, also coloured, except sand containing metals and except silica sand and quartz sand)
2009 2010 2011 2012 2013
Import kt 29 396 10 665 19 977 29 827 88 389
Export kt 422 616 4 928 362 2 979
Minerals currently mined – Construction minerals – Sand and gravel
4. Prices of domestic market
Domestic prices of sand and gravel in 2013 – by regional units
5. Mining companies in the Czech Republic as of December 31, 2013
250590 – Other sand (natural sand of all kinds, also coloured, except sand containing metals and except silica sand and quartz sand)
2009 2010 2011 2012 2013
Average import prices CZK/t 1 070 2 721 1 826 1 336 486
Average export prices CZK/t 7 732 7 463 683 8 330 767
Sand and gravel – registered depositsČeskomoravský štěrk, a.s., Mokrá Holcim (Česko) a.s., člen koncernu, Pracho-
viceLB MINERALS, s.r.o., Horní Bříza KÁMEN Zbraslav, spol. s r.o. CEMEX Sand, k.s., Napajedla EUROVIA Kamenolomy, a.s., Liberec České štěrkopísky spol. s r.o., Praha
Družstvo DRUMAPO, Němčičky TVARBET Moravia a.s., Hodonín KAMENOLOMY ČR s.r.o., Ostrava – Svi-
nov Štěrkovny Olomouc a.s. Písky – J.Elsnic s.r.o., Postoloprty TEKAZ s.r.o., Cheb Městské lesy Hradec Králové a.s. realma-pískovna dolany s.r.o., Zlín

280Minerals currently mined – Construction minerals – Sand and gravel
Kinský dal Borgo, a.s., Chlumec nad Ci-dlinou
Písek – Beton a.s., Veltruby-Hradištko Budějovické štěrkopísky spol. s r.o.,
Vrábče Jana Lobová, Pardubice Pískovna Sojovice, s.r.o. Lubomír Kruncl, Travčice Obec Kostomlátky Pískovny Hrádek a.s., Hrádek nad Nisou Václav Maurer, Lužec nad VltavouPískovna Černovice, s.r.o., Brno MIROS MAJETKOVÁ a.s., PardubiceDOBET s.r.o., Ostrožská Nová VesTěžba štěrkopísku s.r.o., Brodek Zemědělské obchodní družstvo Zálabí,
Ovčáry Kaolin Hlubany, a.s. ZAPA beton a.s., Praha Oldřich Psotka, Mikulovice u Jeseníka KM Beta Moravia s.r.o., Hodonín Ladislav Šeda, Turnov NZPK s.r.o., Podbořany Zechmeister, spol. s r.o., Praha UNIM s.r.o., Všestudy u VeltrusZOD Brniště a.s. František Dvořák, Dolní Dunajovice KARETA s.r.o., Bruntál Sokolovská uhelná, právní nástupce, a.s.,
Sokolov
Sand and gravel – non-registered depositsFrantišek Jampílek, Lázně Toušeň České štěrkopísky spol. s r.o., Praha CEMEX Sand, k.s., Napajedla Vltavské štěrkopísky s.r.o., Chlumín Holcim (Česko) a.s., člen koncernu, Pracho-
vice Písek Žabčice, s.r.o. Pískovny Hrádek a.s., Hrádek nad Nisou Severočeské pískovny a štěrkovny s.r.o.,
Žatec ZEPIKO spol. s r.o., Brno Písník Kinský, s.r.o., Kostelec nad Orlicí Václav Maurer, Lužec nad Vltavou Lubomír Kruncl, Travčice
ZS Kratonohy a.s. AGRO Brno – Tuřany, a.s. Luděk Měchura, Kyjov AZI spol. s r.o., BřeclavRovina Písek, a.s., Písek u Chlumce nad
Cidlinou FRISCHBETON s.r.o., Praha AG Skořenice, akciová společnost Agropodnik Humburky, a.s. Plzeňské štěrkopísky s.r.o., Plzeň DOBET s.r.o., Ostrožská Nová Ves Sušárna a.s. Kratonohy LIKOD s.r.o., Lípa NIKA Chrudim, s.r.o.ACHP s.r.o., Hradec KrálovéROBA štěrkovny Nové Sedlo, s.r.o. Českomoravský štěrk, a.s., MokráSPONGILIT PP, spol. s r.o., Praha ZEPOS a.s., Radovesice Martin Čermák, Jablonné v Podještědí Pískovna Klíčany HBH s.r.o. INGEA realizace s.r.o., Ostrava – SvinovVRAMAT CZ s.r.o., TuskoHradecký písek a.s., Brno Kobra Údlice s.r.o.Obecní lesy Bludov s.r.o.Ing. Václav Luka, Český Brod MAPO, s.r.o., Písty Ing. Milan Tichý – Inženýrské stavby
VOKA, Zahrádky Václav Merhulík, Lety Kateřina Zachová, MarkvarticeSTAVOKA Hradec Králové, a.s. Technické služby města Strakonice s.r.o. Ing. František Klika, KladnoSpráva a údržba silnic Jihoč. kraje,
Č. Budějovice Unigeo a.s., Ostrava – Hrabová Písky – Skviřín, s.r.o., TachovMORAS a.s., Moravany Ilona Seidlová, Jetřichov Recyklace-štěrkovna Frýdlant s.r.o.Mgr. Milan Roček, Moravany SABIA s.r.o., Bohušovice nad Ohří Václav Mašek, Hýskov Silnice Čáslav – Holding, a.s.

281Minerals currently mined – Construction minerals – Sand and gravel
Pražské vodovody a kanalizace a.s. Ing. Josef Varhulík, Lány Obec Rabštejnská Lhota META Servis s.r.o., ČernošiceJiří Bartoš, Poříčí u Litomyšle TEKAZ s.r.o., Cheb
Zemědělské družstvo v Pňovicích Obec Police STAKUS – písek s.r.o., TachovMěstské lesy Jaroměř s.r.o., Proruby Technické služby města Úpice AGROSPOL HRÁDEK, spol. s r.o.
6. World production and world market prices
Mine production of sand and gravel is frequently reported together with crushed stone under the term aggregates.
Sand and gravel prices are not formed on the international market. Neither indicative re-gional prices are quoted.
Aggregates market and prices in the European Union, especially in the Central European countries, are described in Aggregates market analysis of selected countries in Central Eu-rope subchapter of this yearbook.

282Minerals currently mined – Construction minerals – Br ick clays and related minerals
Brick clays and related minerals
1. Registered deposits and other resources of the Czech Republic
There are large numbers of brick mineral deposits registered in the Czech Republic and thus they are not listed in this overview. Their distribution over the Czech territory is rather uneven and consequently in some regions there is a shortage of these minerals (e.g. Českomoravská vrchovina Highlands covering most of the area of Vysočina Region with capital Jihlava).
reserved deposits – mined (14)
reserved deposits – unmined (117)
non-reserved deposits – mined (4)
non-reserved deposits – unmined (119)

283Minerals currently mined – Construction minerals – Br ick clays and related minerals
2. Basic statistical data of the Czech Republic as of December 31
Reserved deposits: Number of deposits; reserves; mine production
Year 2009 2010 2011 2012 2013
Deposits – total number 134 134 131 131 131
exploited 22 18 18 16 14
Total mineral *reserves, ths m3 548 769 546 392 542 022 540 964 538 997
economic explored reserves 217 977 212 276 206 577 203 549 201 808
economic prospected reserves 232 709 231 886 232 827 232 746 232 522
potentially economic reserves 98 083 102 230 102 618 104 669 104 667
exploitable reserves 67 775 64 070 64 217 61 798 64 385
Mine production in reserved
deposits, ths m3 1 028 838 932 852 743
* See NOTE in the chapter Introduction above on a terminological difference between Czech official application of the term reserves and standard international application of the term. The relationship of domestic and foreign classifications of mineral reserves and resources is described in the separate chapter Mineral reserve and resource classification in the Czech Republic of this yearbook
Approved prognostic resources P1, P2, P3
Year 2009 2010 2011 2012 2013
P1, ths m3 27 122 27 122 27 122 27 122 25 691
P2, ths m3 245 494 245 494 245 494 245 494 245 459
P3 – – – – –
Non-reserved deposits: Number of deposits; reserves; mine production
Year 2009 2010 2011 2012 2013
Deposits – total number 122 123 122 123 123
exploited 4 4 3 5 4
Total mineral *reserves, ths m3 686 873 686 264 686 513 687 338 688 639
economic explored reserves 65 114 63 622 63 622 63 622 63 622
economic prospected reserves 515 285 515 789 516 038 516 863 518 164
potentially economic reserves 106 474 106 853 106 853 106 853 106 853
exploitable reserves 725 544 707 1 617 2 834
Mine production in non-reserved
deposits, ths m3 a) 203 182 147 176 140
* See NOTE in the chapter Introduction above on a terminological difference between Czech official application of the term reserves and standard international application of the term. The relationship of domestic and foreign classifications of mineral reserves and resources is described in the separate chapter Mineral reserve and resource classification in the Czech Republic of this yearbooka) estimate

284Minerals currently mined – Construction minerals – Brick clays and related minerals
3. Foreign trade
690410 – Building bricks
2009 2010 2011 2012 2013
Import ths pcs 21 425 15 544 18 070 14 258 11 844
Export ths pcs 12 459 12 914 9 781 11 312 12 375
690410 – Building bricks
2009 2010 2011 2012 2013
Average import prices CZK/piece 14 12 12 14 15
Average export prices CZK/piece 18 20 22 23 25
690510 – Roof tiles
2009 2010 2011 2012 2013
Import ths pcs 4 633 7 834 9 296 8 613 7 311
Export ths pcs 7 594 6 554 12 207 12 108 12 240
690510 – Roof tiles
2009 2010 2011 2012 2013
Average import prices CZK/piece 18 13 15 18 18
Average export prices CZK/piece 18 17 17 17 18
4. Prices of domestic market
Domestic prices of brick clay and brick products
Product specification 2009 2010 2011 2012 2013
Brick clay; CZK/t 80–180 80–180 90–180 95–180 60–120
Full brick; CZK/piece 6–12 6–9 6–7 6–7 6–7
Honeycomb brick; CZK/piece 10–14 11–16 11–14 11–14 11–15
Facing bricks; CZK/piece 10–17 17–33 8–51 17–34 17–30
Brick blocks Porotherm; CZK/piece 35–135 24–114 21–85 22–105 22–90
Clay (ground clay bricks for tennis
courts); CZK/t1 500 900–2 400 900–2 400 1 450–2 400 1 450–2 140
Roof tiles; CZK/t 19–39 19–43 20–44 20–46 21–46
Ventilating, boundary tile; CZK/t 78–183 79–184 81–123 86–205 86–205
Classical shingle tile; CZK/t 12–26 11–38 12–57 12–60 12–60

285Minerals currently mined – Construction minerals – Br ick clays and related minerals
5. Mining companies in the Czech Republic as of December 31, 2013
Brick clays and related minerals – reserved depositsHELUZ cihlářský průmysl v.o.s., Dolní Bukovsko TONDACH Česká republika s.r.o., Hranice Wienerberger Cihlářský průmysl, a.s., Č. Budějovice Cihelna Kinský s.r.o., Kostelec n. Orlicí Cihelna Hodonín, s.r.o. Zlínské cihelny s.r.o., Zlín Cihelna Vysoké Mýto s.r.o. LB MINERALS, s.r.o., Horní Bříza
Brick clays and related minerals – non-reserved depositsWienerberger Cihlářský průmysl, a.s., Č.BudějoviceHELUZ cihlářský průmysl v.o.s., Dolní BukovskoIng. Jiří Hercl, cihelna Bratronice, Kyšice
6. World production and world market prices
Production of brick clays is not recorded on the global scale, many countries do not record it. Brick clays are not subjects of the world trade.

286Minerals currently mined – Construction minerals – Dimension stone
There are many registered dimension stone deposits in the Czech Republic and therefore they are not listed.
reserved deposits – mined (52)
reserved deposits – unmined (107)
non-reserved deposits – mined (15)
non-reserved deposits – unmined (54)
Dimension stone
1. Registered deposits and other resources of the Czech Republic

287Minerals currently mined – Construction minerals – Dimension stone
2. Basic statistical data of the Czech Republic as of December 31
Reserved deposits: Number of deposits; reserves; mine production
Year 2009 2010 2011 2012 2013
Deposits – total number 161 160 159 159 159
exploited 60 61 61 55 52
Total mineral *reserves, ths m3 183 752 183 677 182 753 182 573 181 396
economic explored reserves 79 955 79 950 79 287 77 575 77 414
economic prospected reserves 65 826 65 757 65 421 65 408 64 393
potentially economic reserves 37 971 37 970 38 045 39 590 39 589
exploitable reserves 81 958 82 224 79 099 79 153 79 985
Mine production in reserved deposits, ths m3 209 262 192 138 140
* See NOTE in the chapter Introduction above on a terminological difference between Czech official application of the term reserves and standard international application of the term. The relationship of domestic and foreign classifications of mineral reserves and resources is described in the separate chapter Mineral reserve and resource classification in the Czech Republic of this yearbook
Approved prognostic resources P1, P2, P3
Year 2009 2010 2011 2012 2013
P1, ths m3 5 043 5 043 5 043 5 043 5 043
P2, ths m3 12 701 12 701 12 701 12 701 12 701
P3 – – – – –
Non-reserved deposits: Number of deposits; reserves; mine production
Year 2009 2010 2011 2012 2013
Deposits – total number 70 70 70 69 69
exploited 19 19 18 17 15
Total mineral *reserves, ths m3 33 546 33 498 33 437 33 391 33 362
economic explored reserves 2 293 2 280 2 264 2 257 2 257
economic prospected reserves 28 297 28 262 28 217 28 177 28 146
potentially economic reserves 2 956 2 956 2 956 2 956 2 956
exploitable reserves 2 760 2 690 2 120 1 810 1 582
Mine production in non-reserved deposits, ths m3 a) 54 47 46 44 31
* See NOTE in the chapter Introduction above on a terminological difference between Czech official application of the term reserves and standard international application of the term. The relationship of domestic and foreign classifications of mineral reserves and resources is described in the separate chapter Mineral reserve and resource classification in the Czech Republic of this yearbooka) estimate

288Minerals currently mined – Construction minerals – Dimension stone
2515 – Marble, travertine, ecaussine and other calcareous stone
2009 2010 2011 2012 2013
Import t 1 657 832 859 733 745
Export t 147 2 86 35 47
2516 – Granite, porphyry, basalt, sandstone and other stone
2009 2010 2011 2012 2013
Import kt 14 18 13 9 10
Export kt 9 5 6 16 7
2515 – Marble, travertine, ecaussine and other calcareous stone
2009 2010 2011 2012 2013
Average import prices CZK/t 9 549 13 094 18 690 12 636 17 238
Average export prices CZK/t 10 576 212 486 170 356 180 489 34 714
2516 – Granite, porphyry, basalt, sandstone and other stone
2009 2010 2011 2012 2013
Average import prices CZK/t 18 484 18 023 10 365 10 139 8 755
Average export prices CZK/t 7 054 8 365 15 932 6 652 7 468
3. Foreign trade
2514 – Slate, also rougly worked or cut
2009 2010 2011 2012 2013
Import t 10 888 7 173 12 135 39 445 28 344
Export t 31 441 28 542 12 488 3 694 4 201
2514 – Slate, also rougly worked or cut
2009 2010 2011 2012 2013
Average import prices CZK/t 655 2 220 1 209 693 1 200
Average export prices CZK/t 1 134 995 1 260 1 250 1 369

289Minerals currently mined – Construction minerals – Dimension stone
6802 – Worked monumental and crushed stone (except slate) and stonework
2009 2010 2011 2012 2013
Import t 29 813 29 954 33 2019 34 322 27 220
Export t 61 779 54 356 41 044 42 918 56 574
6803 – Worked slate and articles of slate or of agglomerated slate
2009 2010 2011 2012 2013
Import t 2 664 3 068 3 335 3 350 3 194
Export t 79 62 182 132 80
6802 – Worked monumental and crushed stone (except slate) and stonework
2009 2010 2011 2012 2013
Average import prices CZK/t 17 084 18 053 31 508 58 752 31 222
Average export prices CZK/t 4 455 6 823 21 795 39 239 15 703
6803 – Worked slate and articles of slate or of agglomerated slate
2009 2010 2011 2012 2013
Average import prices CZK/t 11 927 10 576 8 004 12 015 12 113
Average export prices CZK/t 14 795 29 607 21 671 29 717 27 108
6801 – Setts, curbstones and flagstones of natural stone (except slate)
2009 2010 2011 2012 2013
Import t 15 449 5 431 4 517 8 731 12 705
Export t 74 752 56 818 73 078 65 130 68 891
6801 – Setts, curbstones and flagstones of natural stone (except slate)
2009 2010 2011 2012 2013
Average import prices CZK/t 18 851 26 938 133 345 235 770 138 091
Average export prices CZK/t 5 422 1 854 1 782 1 966 2 069
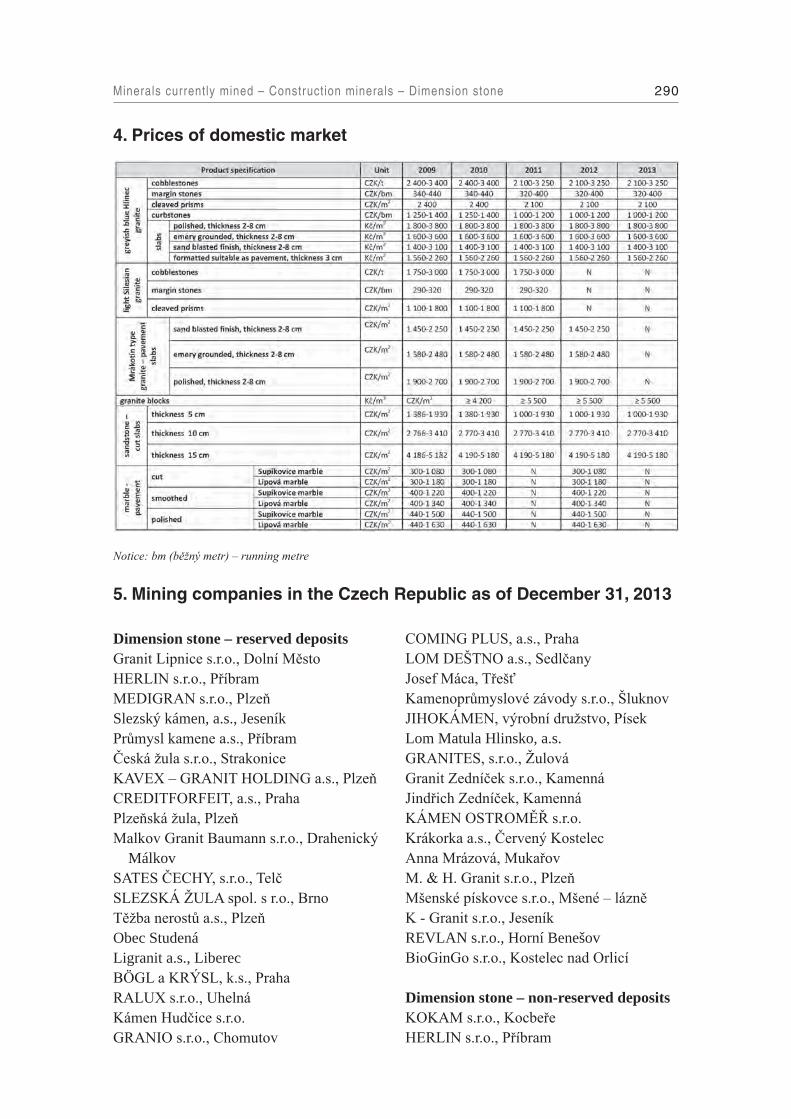
290Minerals currently mined – Construction minerals – Dimension stone
4. Prices of domestic market
Notice: bm (běžný metr) – running metre
5. Mining companies in the Czech Republic as of December 31, 2013
Dimension stone – reserved depositsGranit Lipnice s.r.o., Dolní Město HERLIN s.r.o., Příbram MEDIGRAN s.r.o., Plzeň Slezský kámen, a.s., Jeseník Průmysl kamene a.s., Příbram Česká žula s.r.o., Strakonice KAVEX – GRANIT HOLDING a.s., Plzeň CREDITFORFEIT, a.s., Praha Plzeňská žula, Plzeň Malkov Granit Baumann s.r.o., Drahenický
Málkov SATES ČECHY, s.r.o., Telč SLEZSKÁ ŽULA spol. s r.o., BrnoTěžba nerostů a.s., Plzeň Obec Studená Ligranit a.s., Liberec BÖGL a KRÝSL, k.s., Praha RALUX s.r.o., Uhelná Kámen Hudčice s.r.o. GRANIO s.r.o., Chomutov
COMING PLUS, a.s., Praha LOM DEŠTNO a.s., Sedlčany Josef Máca, Třešť Kamenoprůmyslové závody s.r.o., ŠluknovJIHOKÁMEN, výrobní družstvo, Písek Lom Matula Hlinsko, a.s. GRANITES, s.r.o., ŽulováGranit Zedníček s.r.o., Kamenná Jindřich Zedníček, Kamenná KÁMEN OSTROMĚŘ s.r.o. Krákorka a.s., Červený Kostelec Anna Mrázová, Mukařov M. & H. Granit s.r.o., Plzeň Mšenské pískovce s.r.o., Mšené – lázně K - Granit s.r.o., Jeseník REVLAN s.r.o., Horní Benešov BioGinGo s.r.o., Kostelec nad Orlicí
Dimension stone – non-reserved depositsKOKAM s.r.o., Kocbeře HERLIN s.r.o., Příbram

291Minerals currently mined – Construction minerals – Dimension stone
Jiří Sršeň – TEKAM, Záměl Obec Studená K - Granit s.r.o., Jeseník Lom Horní Dvorce, s.r.o., Strmilov KAVEX – GRANIT HOLDING a. s., Plzeň Alfonz Dovičovič, Hořice
Josef Máca, Třešť SPONGILIT PP, spol. s r.o., Praha Lesostavby Frýdek-Místek, a.s. PROFISTAV Litomyšl, a.s.Ing. Danuše Plandorová, HážoviceKrákorka a.s., Červený Kostelec
6. World production and world market prices
Production of dimension stone is not recorded on the global scale, many countries do not record it. Dimension stone is subject of the world trade. Prices of dimension stone in international market depend on mineral quality and degree of working. In general they are not officially published. Price level on the US market can give a certain idea (Source: Minerals Yearbook 2012. Stone, Dimension, pp.72.1-72.14.-U.S. Geological Survey, U.S. Department of Interior, Washington, DC, August 2014.):
Dimension stone sold or used in the USA in 2012, by type
Quantity, tonnes
Value, ths USD
Average price, USD/t
Granite 500 000 118 000 236
Limestone (and dolomite and
calcareous stone)882 000 176 000 200
Marble 54 600 23 600 432
Sandstone (and quartzite) 324 000 51 700 160
Slate 35 900 17 700 493
Miscellaneous stone 348 000 65 300 188

292Minerals currently mined – Construction minerals – Dimension stone
U.S. Exports of dimension stone by type in 2012
Quantity, ths tonnes
Value, ths USD
Average value, USD/t
Major destination,
by value
Marble, travertine, alabaster, worked
(more than simply cut with a flat
surface)
80 9 430 118 Canada, 47%
Marble, travertine, crude or roughly
trimmed1 800 800 Italy, 42%
Marble, travertine, merely cut by sawing
or otherwise (blocks or slabs)5 4 880 976 Italy, 52%
Granite, crude or roughly trimmed 55 23 500 427 China, 55%
Granite, merely cut by sawing or
otherwise (blocks or slabs)22 6 830 310 Canada, 56%
Slate, worked and articles of slate N 4 010 N Canada, 70%
Slate, whether or not roughly trimmed or
merely cut (blocks or slabs)N 507 N Indonesia, 35%
Other calcareous monumental or building
stone; alabaster (other than marble and
travertine. Crude, roughly trimmed, or
merely cut into blocks or slabs)
35 11 100 317 Canada, 97%
Other calcareous monumental or building
stone (other than calcareous stone and
alabaster, granite, sandstone, slate,
dolomite, quartzite, and steatite.
Crude, roughly trimmed, or merely cut
into blocks or slabs)
14 3 790 271 Canada, 92%

293Minerals currently mined – Construction minerals – Dimension stone
U.S. Imports for consumption of dimension stone, dressed, by type, in 2012
QuantityValue,
ths USD
Average value, USD/t,
or USD/sq ft (USD/m2)
Major source, by value
Marble and alabaster
(simply cut with a flat
surface)
tonne 18 600 21 700 1 167 Italy, 31%
Slate, roofingmillion
sq ft8 9 230
1
(12)China, 33%
Slate, roughly trimmed or
simply cut (rectangular
blocks or slabs)
million
sq ft7 960 3 320 0.0004 (0.004) China, 54%
Slate, worked and articles
of slate, and other
(other than roofing,
including agglomerated
slate)
million
sq ftN 51 500 N China, 50%
Travertine, monumental or
building stone and articles
thereof (simply cut with
a flat surface, other than
tiles and granules)
million
sq ft16 200 14 300
0.0009
(0.01)Mexico, 33%
Travertine, worked
monumental or building
stone (dressed or
polished but not further
worked)
million
sq ft28 500 17 100
0.0006
(0.006)Turkey, 36%

294
MINERALS MINED IN THE PAST WITH RESOURCES AND RESERVES
ENERGY MINERALS
Lignite
1. Registered deposits and other resources of the Czech Republic
reserved registered deposits exhausted deposits and other resources
Principal areas of deposits presence:(Names of regions with mined deposits are indicated in bold type)
1 Vienna Basin 2 České Budějovice Basin 3 Czech part of the Zittau (Žitava) Basin
MINERALS CURRENTLY UNMINED IN THE CZECH REPUBLIC

295Minerals mined in the past with resources and reserves – Lignite
2. Basic statistical data of the Czech Republic as of December 31
Number of deposits; reserves; mine production
Year 2009 2010 2011 2012 2013
Deposits – total number 9 9 5 5 5
exploited 1 0 0 0 0
Total mineral reserves*, kt 975 261 975 261 997 229 997 229 997 229
economic explored reserves 203 780 203 780 619 652 619 652 619 652
economic prospected reserves 615 273 615 273 229 932 229 932 229 932
potentially economic reserves 156 208 156 208 147 645 147 645 147 645
exploitable (recoverable) 1 903 1 903 1 903 1 903 1 903
Mine production, kt 262 0 0 0 0
* See NOTE in the chapter Introduction above on a terminological difference between Czech official application of the term reserves and standard international application of the term. The relationship of domestic and foreign classifications of mineral reserves and resources is described in the separate chapter Mineral reserve and resource classification in the Czech Republic of this yearbook
Lignite mining ended in 2009.
Approved prognostic resources P1, P2, P3
Year 2009 2010 2011 2012 2013
P1, kt 232 867 232 867 232 867 169 262 177 351
P2 kt – – – 7 531 37 531
P3 – – – – –
3. Foreign trade
No separate tariff item exists for lignite.
4. World production and world market prices
World mine productionWorldwide, lignite production is included in brown coal (lignite) production.
Prices of traded commoditiesThere are no international market for lignite commodities as lignite is generally not traded outside a producing country.

296Minerals mined in the past with resources and reserves – Bar ite
Registered deposits and other resources are not mined
1 Běstvina 2 Bohousová 3 Křižanovice
INDUSTRIAL MINERALS
Barite
1. Registered deposits and other resources of the Czech Republic
reserved registered deposits exhausted deposits and other resources

297Minerals mined in the past with resources and reserves – Bar ite
2. Basic statistical data of the Czech Republic as of December 31
Number of deposits; reserves; mine production
Year 2009 2010 2011 2012 2013
Deposits – total number a) 3 3 3 3 3
exploited 0 0 0 0 0
Total mineral *reserves, kt 569 569 569 569 569
economic explored reserves 0 0 0 0 0
economic prospected reserves 0 0 0 0 0
potentially economic reserves 569 569 569 569 569
Mine production, kt 0 0 0 0 0
* See NOTE in the chapter Introduction above on a terminological difference between Czech official application of the term reserves and standard international application of the term. The relationship of domestic and foreign classifications of mineral reserves and resources is described in the separate chapter Mineral reserve and resource classification in the Czech Republic of this yearbooka) Deposits with registered barite reserves
3. Foreign trade
251110 – Natural barium sulphate (barite
2009 2010 2011 2012 2013
Import t 4 797 7 079 7 456 7 037 6 574
Export t 142 239 283 318 464
251120 – Natural barium carbonate (witherite)
2009 2010 2011 2012 2013
Import t 0.4 113 108 0.001 0
Export t 0 0 0 0 0
251110 – Natural barium sulphate (barite
2009 2010 2011 2012 2013
Average import prices CZK/t 6 807 6 497 7 494 8 181 9 023
Average export prices CZK/t 11 868 12 340 11 804 4 243 15 371
251120 – Natural barium carbonate (witherite)
2009 2010 2011 2012 2013
Average import prices CZK/t 11 111 8 849 9 583 N –
Average export prices CZK/t – – – – –

298Minerals mined in the past with resources and reserves – Bar ite
4. World production and world market prices
World mine productionWorld barite production in recent years was as follows:
2009 2010 2011 2012 2013e
World mine production of barite
(according to MCS), kt6 130 7 850 8 370 9 200 8 500
World mine production of barite
(according to WBD), kt7 633 9 179 9 242 10 440 N
e – preliminary values
According to MCS, the top ten producers in 2013 were:China 44 .7 % Turkey 3 .1 %India 17 .5 % Kazakhstan 2 .9 %Morocco 10 .0 % Mexico 1 .5 %USA 7 .8 % Vietnam 1 .1 %Iran 3 .9 % Peru 0 .9 %
The MCS estimated total world resources in all categories at 2 000 million tonnes, but identified resources at only 740 million tonnes.

299Minerals mined in the past with resources and reserves – Bar ite
Prices of traded commodities (according to IM)
Barite is traded in three different quality grades: as a weighting agent in drilling muds and as white paint-grade and chemical-grade barite.
Commodity/ Year 2009 2010 2011 2012 2013
Drilling grade, unground lump OCMA/API, bulk, specific gravity 4.20
FOB Chennai USD/t N 72–74 72–146 140–145 145–155
FOB Morocco USD/t 64–69 66–89 84–113 108–152 105–130
FOB China USD/t 57–72 64–75 72–127 127–148 120–140
C&F North Sea (Moroccan) USD/t 82–86 97–108 100–113 124–160 145–160
API, CIF Gulf Coast: Chinese
IndianUSD/t
87–118
75–100
97–108
105–112
100–150
107–170
140–162
157–171
147–154
157–171
Drilling-grade, ground
OCMA, bulk,
del. AberdeenGBP/t 77–78 77–98 95–105 95–105 95–105
OCMA, bulk,
del. Gt YamouthGBP/t 99–100 99–114 110–120 110–120 110–120
OCMA/API, bulk (15t):
FOB S. TurkeyUSD/t 135 125–135 125–135 130–155 150–155
SG 4.22, bagged, FOB
MoroccoUSD/t 110–128 120–147 135–147 135–147 110–170
Paint grade, white 96-98 % BaSO4:
350 mesh, 1–5 lots, del. UK GBP/t 195–220 195–220 195–220 195–220 195–220
Chinese, lump CIF Gulf Coast USD/t 180–240 230–240 230–260 235–290 235–275
325–350 mesh, 1–5 lots,
ex-works USAUSD/st N N N 315–400 315–400
Chemical grade
Chinese, CIF Gulf Coast USD/t 92–140 92–145 135–145 135–180 161–180
The price range includes the lowest and highest monthly price quotes for a given year.

300Minerals mined in the past with resources and reserves – Fluorspar
Registered deposits and other resources are not mined
1 Běstvina 2 Jílové u Děčína 3 Kovářská 4 Moldava
Fluorspar
1. Registered deposits and other resources of the Czech Republic
reserved registered deposits exhausted deposits and other resources

301Minerals mined in the past with resources and reserves – Fluorspar
2. Basic statistical data of the Czech Republic as of December 31
Number of deposits; reserves; mine production
Year 2009 2010 2011 2012 2013
Deposits – total number a) 4 4 4 4 4
exploited 0 0 0 0 0
Total mineral *reserves, kt 2 033 2 033 2 033 2 033 2 033
economic explored reserves 0 0 0 0 0
economic prospected reserves 0 0 0 0 0
potentially economic reserves 2 033 2 033 2 033 2 033 2 033
Mine production, kt 0 0 0 0 0
* See NOTE in the chapter Introduction above on a terminological difference between Czech official application of the term reserves and standard international application of the term. The relationship of domestic and foreign classifications of mineral reserves and resources is described in the separate chapter Mineral reserve and resource classification in the Czech Republic of this yearbooka) Deposits with registered fluorspar reserves
3. Foreign trade
252921 – Fluorspar, containing 97 wt % or less of calcium fluoride
2009 2010 2011 2012 2013
Import t 4 247 5 752 4 851 5 772 6 101
Export t 4 707 5 584 3 025 1 686 1 729
252922 – Fluorspar, containing more than 97 wt % of calcium fluoride
2009 2010 2011 2012 2013
Import t 4 379 8 743 10 971 9 616 11 031
Export t 1 431 5 003 7 539 7 948 8 993
252921 – Fluorspar, containing 97 wt % or less of calcium fluoride
2009 2010 2011 2012 2013
Average import prices CZK/t 4 358 4 969 6 455 6 298 6 620
Average export prices CZK/t 8 634 7 842 7 807 8 176 9 160
252922 – Fluorspar, containing more than 97 wt % of calcium fluoride
2009 2010 2011 2012 2013
Average import prices CZK/t 6 030 5 252 6 560 9 888 8 515
Average export prices CZK/t 9 030 8 650 9 955 12 640 12 272

302Minerals mined in the past with resources and reserves – Fluorspar
4. World production and world market prices
World mine productionWorld fluorspar production in recent years was as follows:
2009 2010 2011 2012 2013e
World mine production of fluorspar
(according to MCS), kt5 460 6 010 7 520 7 070 6 700
World mine production of fluorspar
(according to WBD), kt6 412 7 193 7 193 6 018 N
e – preliminary values
The following statistical data on the top five producers in 2013 are provided by the MCS:
The largest producer of fluorspar by far is China with a share of 64.2 %. Mexico ranks second with 18.5 %, followed by Mongolia with 5.2 % and South Africa with 2.7 %. The largest European producer was Spain, which accounted for only 1.6 % of world production. Leading producers also include the USA, which does not however publish statistical data on fluorspar.
Identified world resources are estimated at 500 million tonnes of calcium fluoride in fluorspar ores. World resources of phosphate rock contain approximately another 4.7 billion tonnes of calcium fluoride.

303Minerals mined in the past with resources and reserves – Fluorspar
Prices of traded fluorspar commodities (USD/t) according to IM
Two grades of fluorspar are listed in market quotations: filtercake for the production of hydrofluoric acid and metallurgical fluorspar.
Commodity/ Year 2009 2010 2011 2012 2013
Filtercake, bulk, for production of hydrofluoric acid
Mexican, < 5ppm As
FOB Tampico300–420 280–360 320–550 540–550 540–550
Mexican, FOB Tampico 260–350 260–290 290–450 400–450 350
Chinese, wet filtercake,
CIF Rotterdam310–350 310–370 340–650 500–650 310–330
Chinese,wet filtercake,
FOB China250–430 280–300 500–600 400–415 290–320
South African, dry basis,
FOB Durban230–300 230–310 330–350 380–450 380–450
Chinese, dry basis,
CIF US Gulf Port350–380 350–380 370–650 480–650 480–530
Metallurgical fluorspar
Chinese, min. 85 % CaF2,
CIF Rotterdam235–245 235–290 280–310 310 N
Mexican, FOB Tampico 140–195 140–200 170–270 230–270 230–270
Chinese, min.80 % CaF2, wet bulk,
FOB China130–140 130–220 230–331 305–331 200–220
Chinese, min. 85 % CaF2
CIF RotterdamN N 310–359 310–375 290–310
Chinese, min. 85 % CaF2, bulk, FOB
ChinaN N 359–381 359–385* 250–275*
* min. 90 % CaF2
The price range includes the lowest and highest monthly price quotes for a given year.

304Minerals mined in the past with resources and reserves – Graphite
Registered deposits and other resources are not mined
Amorphous graphite: Crystalline graphite:Mixed (from amorphous to crystalline) graphite:
1 Velké Vrbno-Konstantin 5 Český Krumlov-Městský vrch 8 Spolí
2 Bližná-Černá v Pošumaví 6 Lazec-Křenov
3 Český Krumlov-Rybářská ulice 7 Koloděje nad Lužnicí-Hosty
4 Velké Vrbno-Luční hora 2
Graphite
1. Registered deposits and other resources of the Czech Republic
reserved registered deposits exhausted deposits and other resources

305Minerals mined in the past with resources and reserves – Graphite
2. Basic statistical data of the Czech Republic as of December 31
Number of deposits; reserves; mine production
Year 2009 2010 2011 2012 2013
Deposits – total number 8 8 8 8 8
exploited 1 1 1 1 0
Total mineral *reserves, kt a) 14 159 14 159 14 159 14 159 14 159
economic explored reserves 1 321 1 321 1 321 1 321 1 106
economic prospected reserves 4 041 4 041 4 041 4 041 2 606
potentially economic reserves 8 797 8 797 8 797 8 797 10 447
Mine production, kt a) 3 0 0 0 0
* See NOTE in the chapter Introduction above on a terminological difference between Czech official application of the term reserves and standard international application of the term. The relationship of domestic and foreign classifications of mineral reserves and resources is described in the separate chapter Mineral reserve and resource classification in the Czech Republic of this yearbooka) Reserves and mine production are given for crude graphite (graphite “ore”); average graphite contents in the raw material range between 15 and 20 % (crystalline grade) and 25–35 % (amorphous grade), respectively
Approved prognostic resources P1, P2, P3
Year 2009 2010 2011 2012 2013
P1, kt 3 878 3 878 3 878 3 878 3 997
P2, kt 5 279 5 279 5 279 5 279 5 279
P3, kt 1 505 1 505 1 505 1 505 1 505
3. Foreign trade
2504 – Natural graphite
2009 2010 2011 2012 2013
Import t 2 679 3 634 5 145 4 757 5 632
Export t 2 151 3 155 3 418 3 109 2 674
2504 – Natural graphite
2009 2010 2011 2012 2013
Average import prices CZK/t 22 657 21 381 21 940 24 311 21 416
Average export prices CZK/t 28 905 25 880 31 649 37 539 39 286

306Minerals mined in the past with resources and reserves – Graphite
3801 – Artificial graphite; colloidal or semi-colloidal graphite; preparations based on graphite
2009 2010 2011 2012 2013
Import t 5 500 3 583 4 396 2 880 2 434
Export t 1 178 1 656 1 178 1 428 1 483
6903 – Other refractory ceramic goods (for example, retorts, crucibles, muffles, nozzles, plugs, supports, cupels, tubes, pipes, sheaths and rods)
2009 2010 2011 2012 2013
Import t 4 606 5 598 6 756 5 416 5 265
Export t 10 564 11 419 12 471 13 923 20 066
3801 – Artificial graphite; colloidal or semi-colloidal graphite; preparations based on graphite
2009 2010 2011 2012 2013
Average import prices CZK/t 27 187 35 737 35 931 50 275 55 170
Average export prices CZK/t 23 760 25 841 34 035 31 711 33 034
6903 – Other refractory ceramic goods (for example, retorts, crucibles, muffles, nozzles, plugs, supports, cupels, tubes, pipes, sheaths and rods)
2009 2010 2011 2012 2013
Average import prices CZK/t 98 596 99 956 86 450 97 406 105 012
Average export prices CZK/t 117 344 127 577 121 179 120 157 94 797

307Minerals mined in the past with resources and reserves – Graphite
4. World production and world market prices
World mine productionWorld graphite production has again been rising gradually after reaching its latest lowest level in 2009:
2009 2010 2011 2012 2013e
World mine production of graphite
(according to MCS), kt1 100 925 1 150 1 170 1 190
World mine production of graphite
(according to WBD), kt742 1010 1 166 1 193 N
e – preliminary values
In 2013, the largest producer by far was China with a 68.1 % share of production, followed by India with 13.4 %. China, Canada and Madagascar were the leading producers of flake graphite.
The world´s inferred resources of graphite exceed 800 million tonnes. In the EU, graphite is considered a strategic mineral. According to Industrial Minerals (February 2009), the following countries have the largest graphite reserves (in mill tonnes):
Crystalline graphite Amorphous graphiteChina 400 India 180Ukraine 100 China 100Madagascar 100 Mexico 100Sri Lanka 80 Sri Lanka 100Brazil 15 Austria 100 South Korea 100

308Minerals mined in the past with resources and reserves – Graphite
Prices of traded commodities (USD/t) according to IM
Commodity/ Year 2009 2010 2011 2012 2013
Crystalline graphite, large flake,
94–97 % C, +80 mesh, CIF main
European port*
950–1 350 1 250–2000 1 450–3 000 1 400–1 800 1 250–1 300
Crystalline graphite, medium
flake, 94–97 % C, +100–80
mesh CIF main European port
880–1 250 1 100–1 600 1 350–2 500 1 050–1 400 1 050–1 150
Crystalline graphite, fine,
94–97 % C, +100 mesh, CIF
main European port
620–1 100 700–1 700 1 250–2 400 1 200–1 600 850–950
Crystalline graphite, large flake,
90 % C,+80 mesh, CIF UK port*700–800 800–1 350 1 100–2 500 1 200–1 600 1 100–1 150
Crystalline graphite, medium
flake, 90 % C, +100–80 mesh,
CIF main European port*
650–780 700–1 300 1 050–2 000 950–1 200 900–1 000
Crystalline graphite, fine,
90 % C, –100 mesh, CIF main
European port
450–1 050 550–1 300 950–1 800 850–1 050 750–850
Crystalline graphite, medium
flake, 85–87 % C, +100–80 mesh,
CIF main European port
650–770 700–1 400 1 000–1 900 900–1 150 700–800
Amorphous graphite, powder,
80–85 % C, Chinese del Europe310–460 430–450 400–800 600–800 500–550
* in 2009 CIF UK port
The price range includes the lowest and highest monthly price quotes for a given year.

309Minerals mined in the past with resources and reserves – Copper
Registered deposits and other resources are not mined
Reserved registered deposits:
1 Křižanovice 3 Zlaté Hory-Hornické Skály
2 Kutná Hora 4 Zlaté Hory-východ
Exhausted deposits and other resources:
5in Krušné hory Mts. (Erzgebirge Mts.)
and Tisová7
in Krkonoše Mts. Piedmont Basin
and Intrasudetic Basin
6 Tři Sekery and surroundings 8 Staré Ransko
METALLIC ORES
Copper
1. Registered deposits and other resources of the Czech Republic
reserved registered deposits exhausted deposits and other resources

310Minerals mined in the past with resources and reserves – Copper
2. Basic statistical data of the Czech Republic as of December 31
Number of deposits; reserves; mine production
Year 2009 2010 2011 2012 2013
Deposits – total number a) 4 4 4 4 4
exploited 0 0 0 0 0
Total mineral *reserves, kt Cu 49 49 49 49 49
economic explored reserves 0 0 0 0 0
economic prospected reserves 0 0 0 0 0
potentially economic reserves 49 49 49 49 49
Mine production, kt Cu 0 0 0 0 0
* See NOTE in the chapter Introduction above on a terminological difference between Czech official application of the term reserves and standard international application of the term. The relationship of domestic and foreign classifications of mineral reserves and resources is described in the separate chapter Mineral reserve and resource classification in the Czech Republic of this yearbook a) deposits with registered Cu content
3. Foreign trade
2603 – Copper ores and concentrates
2009 2010 2011 2012 2013
Import t 1 0 0.001 16 93
Export t 0 0 0 7 4
2603 – Copper ores and concentrates
2009 2010 2011 2012 2013
Average import prices CZK/t 258 114 – 1 000 25 435 113 821
Average export prices CZK/t – – – 9 738 24 750
7402 – Unrefined copper
2009 2010 2011 2012 2013
Import t 116 91 86 55 112
Export t 24 7 1 N N

311Minerals mined in the past with resources and reserves – Copper
7402 – Unrefined copper
2009 2010 2011 2012 2013
Average import prices CZK/t 79 605 174 269 193 912 193 225 170 907
Average export prices CZK/t 97 858 185 656 6 000 000 N N
7403 – Refined copper and copper alloys
2009 2010 2011 2012 2013
Import t 24 320 10 506 9 540 18 558 34 932
Export t 14 606 14 627 13 492 21 848 52 726
7404 – Copper waste and scrap
2009 2010 2011 2012 2013
Import t 9 666 12 297 18 952 19 318 14 158
Export t 105 562 124 927 86 654 74 571 66 820
7403 – Refined copper and copper alloys
2009 2010 2011 2012 2013
Average import prices CZK/t 68 492 144 568 148 043 160 070 151 988
Average export prices CZK/t 108 761 135 058 160 395 158 336 149 799
7404 – Copper waste and scrap
2009 2010 2011 2012 2013
Average import prices CZK/t 77 378 113 233 132 373 121 375 121 997
Average export prices CZK/t 76 924 98 614 116 018 108 644 101 305
740311 – Copper cathodes and sections of cathodes unwrought
2009 2010 2011 2012 2013
Import t 20 696 5 298 4 962 16 455 32 291
Export t 10 628 11 082 10 347 20 566 51 079

312Minerals mined in the past with resources and reserves – Copper
740311 – Copper cathodes and sections of cathodes unwrought
2009 2010 2011 2012 2013
Average import prices CZK/t 58 097 148 406 158 838 162 026 154 143
Average export prices CZK/t 105 370 137 459 154 955 159 355 150 084
740321 – Copper-zinc base alloys, unwrought
2009 2010 2011 2012 2013
Import t 2 925 3 330 3 021 1 527 2 243
Export t 2 802 3 313 2 642 1 046 1 154
740322 – Copper-tin base alloys, unwrought
2009 2010 2011 2012 2013
Import t 97 277 245 192 53
Export t 1 082 102 71 132 98
740321 – Copper-zinc base alloys, unwrought
2009 2010 2011 2012 2013
Average import prices CZK/t 130 401 129 518 126 077 130 457 108 803
Average export prices CZK/t 127 860 126 691 125 465 138 262 141 639
740322 – Copper-tin base alloys, unwrought
2009 2010 2011 2012 2013
Average import prices CZK/t 183 113 123 581 192 082 128 013 281 980
Average export prices CZK/t 93 775 118 481 254 361 167 144 158 235

313Minerals mined in the past with resources and reserves – Copper
4. World production and world market prices
World mine productionWorld production of primary copper continued to increase and, according to preliminary MCS estimates, production in 2013 exceeded output in 2012 by one million tonnes.
2009 2010 2011 2012 2013e
World mine production of copper
(according to MCS), kt15 900 15 900 16 100 16 900 17 900
World mine production of copper
(according to WBD), kt15 859 16 256 16 133 16 827 N
e – preliminary values
Metal Bulletin (12 March 2012) published an overview of the world´s copper production capacities (kt)
Commodity/ Year 2011 2012 2013 2014
Hydrometallurgy (SX-BW) 4 655 4 751 4 837 5 227
Concentrates 15 649 16 123 16 978 18 378
Total mine production 20 304 20 874 21 815 23 605
Total metallurgical production 18 528 19 113 19 823 20 353
Elektrolytic production 19 155 20 116 20 981 21 551
Total refinery production 24 569 25 586 26 537 27 497
The largest producers in 2013 were:Chile 31.8 % Russia 5.2 %China 9.2 % Congo (Kinshasa) 5.0 %Peru 7.3 % Zambia 4.6 %USA 6.8 % Canada 3.5 %Australia 5.5 % Kazakhstan 2.5 %
World reserves are estimated at 690 million tonnes of metal in ore. The most significant resources are porphyry ores, whose identified resources were estimated at 1.8 billion tonnes and undiscovered resources at 3.1 billion tonnes by the USGS. Deep-sea nodules and submarine massive sulfide ores represent other large unconventional resources.

314Minerals mined in the past with resources and reserves – Copper
Prices of traded commoditiesAccording to the German summaries Deutschland—Rohstoffsituation 2009–2013 (D-R) and Metal Bulletin (MB), world copper prices (USD/t) were as follows:
Commodity/ Year 2009 2010 2011 2012 2013
Electrolytic Cu, grade A, min.
99.9 %, in LME warehouse, cash
(according to D-R)
5 149.04 7 534.18 8 820.53 7 949.44 N
Copper, grade A, LME cash
(according to MB)
7 345.50–
3 050.25
9 739.25–
6 090.75
6 784.50–
10 147.75
7 251.25–
8 656.50
6 637.25–
8 242.25
Copper, grade A, 3-month contract,
LME (according to MB)
7 377.00–
3 086.00
9 665.00–
6 125.00
6 812.00–
10 124.00
7 270.00–
8 647.00
6 676.00–
8 286.00
The price range according to MB includes the lowest and highest monthly price quotes for a given year.

315Minerals mined in the past with resources and reserves – Germanium
The registered deposit is not exploited
1 Lomnice u Sokolova
Germanium
1. Registered deposits and other resources of the Czech Republic
reserved registered deposits

316Minerals mined in the past with resources and reserves – Germanium
2. Basic statistical data of the Czech Republic as of December 31
Number of deposits; reserves; mine production
Year 2009 2010 2011 2012 2013
Deposits – total number 1 1 1 1 1
exploited 0 0 0 0 0
Total * reserves, t Ge 479 479 479 476 473
economic explored reserves 0 0 0 0 0
economic prospected reserves 0 0 0 0 0
potentially economic reserves 479 479 479 476 473
Mine production, t Ge 0 0 0 0 0
* See NOTE in the chapter Introduction above on a terminological difference between Czech official application of the term reserves and standard international application of the term. The relationship of domestic and foreign classifications of mineral reserves and resources is described in the separate chapter Mineral reserve and resource classification in the Czech Republic and its evolutional comparison with international classifications of this yearbook
3. Foreign trade
81129295 – Unwrought germanium, germanium powders; excluding waste and scrap
2009 2010 2011 2012 2013
Import kg 2 7 13 4 40
Export kg 0 0 0 < 1 1
81129295 – Unwrought germanium, germanium powders; excluding waste and scrap
2009 2010 2011 2012 2013
Average import prices CZK/kg 11 000 14 286 3 692 50 790 16 825
Average export prices CZK/kg – – – N 57 000

317Minerals mined in the past with resources and reserves – Germanium
4. World production and world market prices
World mine productionWorld germanium production in recent years was as follows:
2009 2010 2011 2012 2013e
World germanium production
(according to MCS), t120 118 118 150 155
World germanium production
(according to WBD), t53 63 66 111 N
e – preliminary values
The cited sources do not give any insight into their data, which differ considerably. It can only be assumed that the MCS records refinery production and the WBD only primary production. China was the world´s largest producer and consumer of germanium again in 2013. It accounted for 70 % of world production with existing refinery capacities operating at only 55 %, which amounted to 200 t/yr.
The most important recoverable resources of germanium are associated with zinc and Pb-Zn-Cu sulfide ores. However on a global scale, only 3 % of germanium contained in processed zinc concetrates are recovered. Another resource are coal deposits, with germanium being recovered from ash and flue dust during combustion. According to the Critical Metals Handbook (ed. G. Gunn, Wiley, 2014), China produces around 30 tonnes of germanium annually from these resources.
In 2012, the prices of germanium dioxide rose from 925 USD/kg in March to 1 375 USD/kg in September. The oxide prices did not change much in 2013. The prices of germanium metal increased in 2013 from 1 640 USD/kg to 1 875 USD/kg at the end of the year.
Average annual prices of germanium dioxide in USD/kg according to the German summaries Deutschland-Rohstoffsituation 2009–2013
2009 2010 2011 2012 2013
GeO2, min. 99.99 %, MB free market,
in warehouse Rotterdam768.68 640.23 1 219.61 1 214.32 1 313.54

318Minerals mined in the past with resources and reserves – Gold
Gold
1. Registered deposits and other resources of the Czech Republic
reserved registered deposits exhausted deposits and other resources
Registered deposits and other resources are not mined
1 Břevenec 6 Mokrsko 11 Suchá Rudná-střed
2 Jílové u Prahy 7 Mokrsko-východ 12 Vacíkov
3 Kašperské Hory 8 Podmoky 13 Voltýřov
4 Mikulovice u Jeseníka 9 Prostřední Lhota-Čelina 14 Zlaté Hory-východ
5 Modlešovice 10 Smolotely-Horní Líšnice 15 Zlaté Hory-Zlatý potok

319Minerals mined in the past with resources and reserves – Gold
2. Basic statistical data of the Czech Republic as of December 31
Number of deposits; reserves; mine production
Year 2009 2010 2011 2012 2013
Deposits – total number 15 15 15 15 15
exploited 0 0 0 0 0
Total mineral *reserves, kg Au 238 900 238 900 238 900 238 900 238 900
economic explored reserves 48 740 48 740 48 740 48 740 48 740
economic prospected reserves 28 644 28 644 28 644 28 644 28 644
potentially economic reserves 161 516 161 516 161 516 161 516 161 516
Mine production, kg Au 0 0 0 0 0
* See NOTE in the chapter Introduction above on a terminological difference between Czech official application of the term reserves and standard international application of the term. The relationship of domestic and foreign classifications of mineral reserves and resources is described in the separate chapter Mineral reserve and resource classification in the Czech Republic of this yearbook
Approved prognostic resources P1, P2, P3
Au metal in ores
Year 2009 2010 2011 2012 2013
P1, kg 60 221 60 221 60 221 60 221 60 221
P2, kg 65 846 65 846 65 846 65 846 52 246
P3, – – – – –
Au ore
Year 2009 2010 2011 2012 2013
P1, kt 16 700 16 700 16 700 16 700 16 700
P2, kt 20 341 20 341 20 341 20 341 23 191
P3, kt 2 850 2 850 2 850 2 850 –
3. Foreign trade
7108 – Gold in unwrought or semi-manufactured form, gold powder
2009 2010 2011 2012 2013
Import kg 2 915 3 693 20 268 5 291 6 823
Export kg 10 649 477 9 851 6 953 91 426

320Minerals mined in the past with resources and reserves – Gold
4. World production and world market prices
World mine productionTrend in the world´s primary gold production
2009 2010 2011 2012 2013e
Mine production of gold, t
(according to MCS)2 450 2 560 2 660 2 690 2 770
Mine production of gold, t
(according to WBD)2 504 2 616 2 621 2 701 N
e – preliminary values
According to MCS, the top ten countries in 2013 were:China 15.2 % South Africa 5.2 %Australia 9.2 % Canada 4.5 %USA 8.2 % Mexico 3.6 %Russia 7.9 % Uzbekistan 3.4 %Peru 5.4 % Ghana 3.1 %
The ranking provided by the WBD for 2012 was nearly identical, except that Ghana was ninth with 3.7 % and Uzbekistan tenth with 3.3 %.
The USGS estimated world reserves of gold in ore at 54 000 tonnes, of which more than 18 % are accounted for by Australia, around 11 % by South Africa, and about 9 % by Russia. By contrast, China´s reserves are estimated at only 3.5 %. The reserves of the USA and Ghana exceed 5.5 %. However, US gold resources are estimated at 66 000 tonnes of gold, of which nearly one-quarter is contained in porphyry copper deposits.
Prices of traded commoditiesAverage annual gold price in USD/tr oz (1 tr oz (troy ounce) = 31.1035 g) according to the German summaries Deutschland- Rohstoffsituation 2009–2013
Commodity/ Year 2009 2010 2011 2012 2013
99.9 %, fine, in London warehouse 972.97 1 225.46 1 569.52 1 668.54 1 410.80
7108 – Gold in unwrought or semi-manufactured form, gold powder
2009 2010 2011 2012 2013
Average import prices CZK/g 416 566 172 789 839
Average export prices CZK/g 71 3 187 227 409 47.6

321Minerals mined in the past with resources and reserves – Lead
Registered deposits and other resources are not mined
Reserved registered deposits:
1 Horní Benešov 4 Křižanovice 7 Ruda u Rýmařova-sever
2 Horní Město 5 Kutná Hora 8 Zlaté Hory-východ
3 Horní Město-Šibenice 6 Oskava
Exhausted deposits and other resources:
9 Březové Hory + Příbram-Bohutín 12 Havlíčkův Brod (Dlouhá Ves + Bartoušov + Stříbrné Hory)
10 Oloví 13 Ratibořské Hory + Stará Vožice
11 Stříbro 14 Černovice
Lead
1. Registered deposits and other resources of the Czech Republic
reserved registered deposits exhausted deposits and other resources

322Minerals mined in the past with resources and reserves – Lead
2. Basic statistical data of the Czech Republic as of December 31
Number of deposits; reserves; mine production
Year 2009 2010 2011 2012 2013
Deposits – total number a) 8 8 8 8 8
exploited 0 0 0 0 0
Total mineral *reserves, kt Pb 152 152 152 152 152
economic explored reserves 0 0 0 0 0
economic prospected reserves 0 0 0 0 0
potentially economic reserves 152 152 152 152 152
Mine production, kt Pb 0 0 0 0 0
* See NOTE in the chapter Introduction above on a terminological difference between Czech official application of the term reserves and standard international application of the term. The relationship of domestic and foreign classifications of mineral reserves and resources is described in the separate chapter Mineral reserve and resource classification in the Czech Republic of this yearbooka) Deposits with registered Pb content
Approved prognostic resources P1, P2, P3
Polymetallic (Pb – Zn ± Cu) ores
Year 2009 2010 2011 2012 2013
P1, kt 786 786 786 786 786
P2, kt 5 340 5 340 5 340 5 340 5 340
P3, – – – – –
3. Foreign trade
2607 – Lead ores and concentrates
2009 2010 2011 2012 2013
Import t 238 0 254 0.08 192
Export t 0 0 0 0.003 120
2607 – Lead ores and concentrates
2009 2010 2011 2012 2013
Average import prices CZK/t 15 653 500 000 354 331 626 506 48 036
Average export prices CZK/t 152 174 541 176 – 346 154 50 642

323Minerals mined in the past with resources and reserves – Lead
7801 – Unwrought lead
2009 2010 2011 2012 2013
Import t 65 846 82 402 35 971 60 258 104 330
Export t 70 071 32 863 21 104 23 623 27 893
7801 – Unwrought lead
2009 2010 2011 2012 2013
Average import prices CZK/t 34 426 43 444 45 535 43 874 46 206
Average export prices CZK/t 7 804 35 682 45 242 43 822 48 663
7802 – Lead waste and scrap
2009 2010 2011 2012 2013
Average import prices CZK/t 25 175 32 004 37 005 34 971 33 301
Average export prices CZK/t 26 561 33 899 39 418 31 118 28 207
7802 – Lead waste and scrap
2009 2010 2011 2012 2013
Import t 4 199 2 901 2 770 2 560 4 179
Export t 4 832 2 116 1 116 1 157 1 139

324Minerals mined in the past with resources and reserves – Lead
4. World production and world market prices
World mine productionAccording to MCS and WBD, global lead production in recent years was as follows:
2009 2010 2011 2012 2013e
World mine production of lead
(according to MCS), kt3 860 4140 4 700 5 170 5 400
World mine production of lead
(according to WBD), kt3 848 4 360 4 680
4 793N
e – preliminary values
In 2013, China accounted for more than 50 % of global production, specifically about 3 million tonnes. According to MCS, the top ten producers and their shares of production in 2013 were:China 55.6 % India 2.2 %Australia 12.7 % Bolivia 1.7 %USA 6.3 % Russia 1.7 %Peru 4.6 % Sweden 1.1 %Mexico 4.1 % South Africa 1.0 %
The USGS estimated world reserves at 89 million tonnes. Identified resources are listed at around 2 billion tonnes. Significant lead reserves have been demonstrated in association with polymetallic ore deposits in Australia, China, Ireland, Mexico, Peru, Portugal, Russia and in the USA (Alaska).
Prices of traded commoditiesWorld lead prices (USD/t) according to the German summaries Deutschland-Rohstoffsituation 2009–2013 (D-R) and Metal Bulletin (MB)
Commodity/ Year 2009 2010 2011 2012 2013
99.97 % Pb, LME
(according to D-R)1 722.24 2 147.81 2 401.21 2 067.29 N
Lead, LME cash
(according to MB)
2 447.25–
991.25
2 593.25–
1 558.25
1 791.25–
2 938.75
1 743.50–
2 339.75
1 948.50–
2 447.50
Lead, LME 3-month contract,
(according to MB)
2 489.00–
1 000.00
2 620.00–
1 580.50
1 832.00–
2 853.00
1 760.00–
2 342.00
1 961.00–
2 455.00
The price range according to MB includes the lowest and highest monthly price quotes for a given year.

325Minerals mined in the past with resources and reserves – Manganese
Registered deposits and other resources are not mined
1 Chvaletice 2 Chvaletice – tailing ponds
No 1 & No 2
3 Řečany – tailing pond
No 3
Manganese
1. Registered deposits and other resources of the Czech Republic
reserved registered deposits exhausted deposits and other resources

326Minerals mined in the past with resources and reserves – Manganese
* See NOTE in the chapter Introduction above on a terminological difference between Czech official application of the term reserves and standard international application of the term. The relationship of domestic and foreign classifications of mineral reserves and resources is described in the separate chapter Mineral reserve and resource classification in the Czech Republic of this yearbook
3. Foreign trade
2602 – Manganese ores and concentrates
2009 2010 2011 2012 2013
Import t 16 089 25 546 28 905 287 14 189
Export t 0 0.3 50 383 65
2602 – Manganese ores and concentrates
2009 2010 2011 2012 2013
Average import prices CZK/t 8 112 9 409 8 108 14 641 6 511
Average export prices CZK/t – 14 545 14 069 9 738 14 430
720211; 720219 – Ferro-manganese
2009 2010 2011 2012 2013
Import t 23 642 26 259 25 281 24 834 22 830
Export t 5 257 2 617 1 704 1 776 2 107
2. Basic statistical data of the Czech Republic as of December 31
Number of deposits; reserves; mine production
Year 2009 2010 2011 2012 2013
Deposits – total number 3 3 3 3 3
exploited 0 0 0 0 0
Total mineral *reserves, kt ores 138 801 138 801 138 801 138 801 138 801
economic explored reserves 0 0 0 0 0
economic prospected reserves 0 0 0 0 0
potentially economic reserves 138 801 138 801 138 801 138 801 138 801
Mine production, kt Mn 0 0 0 0 0

327Minerals mined in the past with resources and reserves – Manganese
8111 – Manganese and articles thereof, including waste and scrap
2009 2010 2011 2012 2013
Import t 2 229 1 014 911 521 629
Export t 177 6 24 12 34
2820 – Manganese oxides
2009 2010 2011 2012 2013
Import t 1 347 2 146 1 107 1205 962
Export t 331 44 55 218 24
8111 – Manganese and articles thereof, including waste and scrap
2009 2010 2011 2012 2013
Average import prices CZK/t 47 027 60 893 62 416 60 980 55 899
Average export prices CZK/t 52 096 58 599 65 337 79 561 39 706
2820 – Manganese oxides
2009 2010 2011 2012 2013
Average import prices CZK/t 22 542 22 605 22 278 21 756 20 088
Average export prices CZK/t 22 294 21 721 21 072 5 834 20 042
720230 – Ferrosilicomanganese
2009 2010 2011 2012 2013
Import t 34 425 39 793 45 035 39 572 45 719
Export t 1 892 4 560 1 754 3 711 4 676
720230 – Ferrosilicomanganese
2009 2010 2011 2012 2013
Average import prices CZK/t 23 992 26 142 24 500 24 025 22 286
Average export prices CZK/t 22 137 25 774 23 404 23 940 21 799
720211; 720219 – Ferro-manganese
2009 2010 2011 2012 2013
Average import prices CZK/t 26 432 29 897 26 716 24 121 23 545
Average export prices CZK/t 23 525 30 899 26 007 23 740 18 578

328Minerals mined in the past with resources and reserves – Manganese
4. World production and world market prices
World mine productionThe world´s primary production of manganese in mined ores in recent years was as follows:
2009 2010 2011 2012 2013e
World mine production of manganese
(according to MCS), kt10 800 13 900 16 000 15 800 17 000
World mine production of manganese
(according to WBD), kt12 388 16 767 19 073 18 910 N
e – preliminary values
According to MCS, South Africa had the largest share of production in 2013, amounting to nearly one-fourth, followed by Australia and China with roughly one-fifth. The following is a list of the top ten producers of primary manganese in 2013 according to the MCS:South Africa 22.4 % India 5.0 %Australia 18.2 % Kazakhstan 2.3 %China 18.2 % Ukraine 2.1 %Gabon 11.8 % Malaysia 1.5 %Brazil 8.2 % Mexico 1.2 %
According to WBD, Ghana still ranked among the top ten in 2012 with a share of 2.8 % and Mexico was eleventh with 1.0 %.
Land-based reserves of manganese in ore are estimated at about 570 million tonnes. South Africa accounts for around 75 % of resources and Ukraine for about 10 %. The USA as well as Russia do not have any suitable manganese deposits and rely on imports. Manganese nodules on the sea floor represent practically limitless resources.
Prices of traded commoditiesAccording to the summaries Deutschlend-Rohstoffsituation 2009–2013, the average world prices of manganese commodities in recent years were as follows:
Commodity/ Year 2009 2010 2011 2012 2013
Manganese, MB free market,
in warehouseUSD/t 20 786.67 2 549.17 3 316.46 2 786.67 2 319.71
Metallurgical ore, 48–50 % Mn,
max. 0.1 % P, FOB
USD/
/mtu5.33 7.78 5.93 4.88 N
Ferro-Manganese, basis
78 % Mn, standard 7.5 % C,
del. consumers´works
EUR/t 905.42 1 081.25 970.83 909.38 769.88
Notice: mtu – metric ton unit; 1 mtu = 1 % = 10 kg Mn in 1 tonne of ore

329Minerals mined in the past with resources and reserves – Silver
Silver
1. Registered deposits and other resources of the Czech Republic
reserved registered deposits exhausted deposits and other resources
Registered deposits and other resources are not mined
Reserved registered deposits:
1 Horní Benešov 4 Kutná Hora 7 Zlaté Hory-východ
2 Horní Město 5 Oskava
3 Horní Město-Šibenice 6 Ruda u Rýmařova-sever
Exhausted deposits and other resources:
8 Příbram surroundings 13 Rudolfov
9 Jáchymov surroundings 14 Stříbro
10 Havlíčkův Brod surroundings 15 Hrob + Mikulov
11 Jihlava surroundings 16 Nalžovské hory
12 Ratibořské hory + Stará Vožice 17 Vejprty + Hora sv. Kateřiny

330Minerals mined in the past with resources and reserves – Silver
2. Basic statistical data of the Czech Republic as of December 31
Number of deposits; reserves; mine production
Year 2009 2010 2011 2012 2013
Deposits – total number a) 7 7 7 7 7
exploited 0 0 0 0 0
Total mineral *reserves, t Ag 532 532 532 532 532
economic explored reserves 0 0 0 0 0
economic prospected reserves 0 0 0 0 0
potentially economic reserves 532 532 532 532 532
Mine production, t Ag 0 0 0 0 0
* See NOTE in the chapter Introduction above on a terminological difference between Czech official application of the term reserves and standard international application of the term. The relationship of domestic and foreign classifications of mineral reserves and resources is described in the separate chapter Mineral reserve and resource classification in the Czech Republic of this yearbooka) Deposits with registered Ag content
Approved prognostic resources P1, P2, P3
Ag metal in ores
Year 2009 2010 2011 2012 2013
P1, t 33 33 33 33 33
P2, t 4 4 4 4 4
P3, – – – – –
3. Foreign trade
261610 – Silver ores and concentrates
2009 2010 2011 2012 2013
Import kg 5 660 990 207 0 2 0
Export kg 2 990 205 3 2 1
261610 – Silver ores and concentrates
2009 2010 2011 2012 2013
Average import prices CZK/kg 64 347 – 4 500 –
Average export prices CZK/kg 6 000 357 11 667 11 000 37 000

331Minerals mined in the past with resources and reserves – Silver
7106 – Silver, unwrought or in semi-manufactured or powder form
2009 2010 2011 2012 2013
Import kg 163 482 430 226 1 499 355 147 233 868 439
Export kg 78 127 75 352 270 147 184 987 433 090
7106 – Silver, unwrought or in semi-manufactured or powder form
2009 2010 2011 2012 2013
Average import prices CZK/g 4.49 2.40 0.78 9.22 1.69
Average export prices CZK/g 9.87 13.02 12.30 15.38 5.72
4. World production and world market prices
World mine productionAccording to statistics, world production of primary silver in recent years was as follows:
2009 2010 2011 2012 2013e
World mine production of silver
(according to MCS), t21 800 23 100 23 300 25 500 26 000
World mine production of silver
(according to WBD), t22 427 23 441 23 521 25 097 N
e – preliminary values
According to MCS, the share of production of individual countries in 2013 was as follows:Mexico 20 .8 % Bolivia 4 .6 %China 15 .4 % Chile 4 .6 %Peru 13 .5 % Poland 4 .4 %Australia 6 .5 % USA 4 .2 %Russia 6 .5 % Canada 2 .8 %
The USGS estimated world reserves at 520 kt of silver in ore . Polymetallic ores accounted for nearly two-thirds of that amount, and silver and gold-silver ores for the rest .
Prices of traded commoditiesAccording to the German summaries Deutschland-Rohstoffsituation 2009–2013, the world silver price in USD/tr oz (1 tr oz (troy ounce) = 31 .1035 g) in recent years was as follows:
Commodity/ Year 2009 2010 2011 2012 2013
99.5 %, in LME warehouse 14.65 20.115 35.11 31.15 23.83

332Minerals mined in the past with resources and reserves – Tin
Registered deposits and other resources are not mined
1 Cínovec-jih 2 Krásno 3 Krásno-Horní Slavkov
Tin
1. Registered deposits and other resources of the Czech Republic
reserved registered deposits exhausted deposits and other resources

333Minerals mined in the past with resources and reserves – Tin
2. Basic statistical data of the Czech Republic as of December 31
Number of deposits; reserves; mine production
Year 2009 2010 2011 2012 2013
Deposits – total number a) 3 3 3 3 4
exploited 0 0 0 0 0
Total mineral *reserves, t Sn 163 809 163 809 163 809 163 809 164 299
economic explored reserves 0 0 0 0 0
economic prospected reserves 0 0 0 0 0
potentially economic reserves 163 809 163 809 163 809 163 809 163 809
Mine production, t Sn 0 0 0 0 0
* See NOTE in the chapter Introduction above on a terminological difference between Czech official application of the term reserves and standard international application of the term. The relationship of domestic and foreign classifications of mineral reserves and resources is described in the separate chapter Mineral reserve and resource classification in the Czech Republic of this yearbooka) Sn-W ore deposits
Approved prognostic resources P1, P2, P3
Sn – W ores
Year 2009 2010 2011 2012 2013
P1, kt 2 195 2 195 2 195 2 195 2 195
P2, – – – – –
P3, – – – – –
3. Foreign trade
2609 – Tin ores and concretates
2009 2010 2011 2012 2013
Import t 0 101 0 0.002 N
Export t 0 0.001 0 0 0.002
2609 – Tin ores and concretates
2009 2010 2011 2012 2013
Average import prices CZK/t – 841 – 500 000 0
Average export prices CZK/t – 2 000 000 1 000 – –

334Minerals mined in the past with resources and reserves – Tin
8001 – Unwrought tin
2009 2010 2011 2012 2013
Import t 569 449 652 631 1 449
Export t 81 275 17 7 2 037
8002 – Tin waste and scrap
2009 2010 2011 2012 2013
Import t 90 4 5 0.4 1
Export t 118 44 168 193 133
8001 – Unwrought tin
2009 2010 2011 2012 2013
Average import prices CZK/t 286 726 343 332 400 572 403 589 207 750
Average export prices CZK/t 256 503 376 223 464 074 330 661 465 680
8002 – Tin waste and scrap
2009 2010 2011 2012 2013
Average import prices CZK/t 67 536 92 672 176 397 124 638 485 614
Average export prices CZK/t 93 951 166 868 105 777 52 719 179 494

335Minerals mined in the past with resources and reserves – Tin
4. World production and world market prices
World mine productionWorld production of primary tin in recent years was as follows:
2009 2010 2011 2012 2013e
World mine production of tin (according
to MCS), kt260 265 244 240 230
World mine production of tin (according
to WBD), kt295 345 333 248 N
e – preliminary values
According to MCS, China was the largest producer and Indonesia the largest exporter in 2013. The top ten producers´ shares of production (not including the unpublished data for the USA) were as follows:China 43.5 % Burma 5.2 %Indonesia 17.4 % Australia 2.6 %Peru 11.3 % Vietnam 2.3 %Bolivia 7.8 % Congo (Kinshasa) 1.7 %Brazil 5.2 % Malaysia 1.6 %
World reserves (not including the USA and others) are estimated at 4 700 kt.
Prices of traded commoditiesAccording to the summaries Deutshland-Rohstoffsituation 2009–2013 (D-R) and Metal Bulletin (MB), the world´s tin prices in USD/t were as follows:
Commodity/ Year 2009 2010 2011 2012 2013
Min. 99.85 %, in LME warehouse,
cash (according to D-R)13 561.62 20 396.10 25 687.41 21 104.01 N
LME cash
(according to MB)
16 742.50–
10 052.50
27 575.00–
14 937.50
18 607.50–
33 252.50
17 637.50–
25 625.00
9 262.50–
25 175.00
LME 3-month contract
(according to MB)
16 795.00–
9 950.00
27 350.00–
15 000.00
18 700.00–
33 210.00
17 675.00–
25 700.00
19 300.00–
25 750.00
The price range according to MB includes the lowest and highest monthly price quotes for a given year.

336Minerals mined in the past with resources and reserves – Tungsten
Tungsten
1. Registered deposits and other resources of the Czech Republic
reserved registered deposits exhausted deposits and other resources
Registered deposits and other resources are not mined
1 Cínovec-jih 3 Krásno-Horní Slavkov
2 Kašperské Hory 4 Krásno-Horní Slavkov

337Minerals mined in the past with resources and reserves – Tungsten
2. Basic statistical data of the Czech Republic as of December 31
Number of deposits; reserves; mine production
Year 2009 2010 2011 2012 2013
Deposits – total number a) 4 4 4 4 4
exploited 0 0 0 0 0
Total mineral *reserves, t W 70 253 70 253 70 253 70 253 70 253
economic explored reserves 0 0 0 0 0
economic prospected reserves 0 0 0 0 0
potentially economic reserves 70 253 70 253 70 253 70 253 70 253
Mine production, t W 0 0 0 0 0
* See NOTE in the chapter Introduction above on a terminological difference between Czech official application of the term reserves and standard international application of the term. The relationship of domestic and foreign classifications of mineral reserves and resources is described in the separate chapter Mineral reserve and resource classification in the Czech Republic of this yearbooka) Sn‑W and W ore deposits
Approved prognostic resources P1, P2, P3
W metal in ores
Year 2009 2010 2011 2012 2013
P1, t 3 252 3 252 3 252 3 252 3 252
P2, t 10 703 10 703 10 703 10 703 10 703
P3, – – – – –
3. Foreign trade
2611 – Tungsten ores and concentrates
2009 2010 2011 2012 2013
Import kg 0 73 660 292 634 799 328 100 090
Export kg 0 0 0 0 20 000
2611 – Tungsten ores and concentrates
2009 2010 2011 2012 2013
Average import prices CZK/t – 9 14 12 12
Average export prices CZK/t – – – – 244

338Minerals mined in the past with resources and reserves – Tungsten
8101 – Tungsten and its products, including waste and scrap
2009 2010 2011 2012 2013
Average import prices CZK/kg 2 624 534 978 699 803
Average export prices CZK/kg 919 507 961 857 791
8101 – Tungsten and its products, including waste and scrap
2009 2010 2011 2012 2013
Import kg 13 458 259 357 369 249 969 114 506 720
Export kg 25 106 208 928 612 381 1 012 962 1 111 635
720280 – Ferro-tungsten and ferrosilicotungsten
2009 2010 2011 2012 2013
Import kg 34 092 42 732 83 918 39 116 14 701
Export kg 8 550 7 412 22 201 5 214 6 592
810196 – Tungsten wires
2009 2010 2011 2012 2013
Import kg 4 172 737 419 343 101 918 67 543 70 056
Export kg 6 430 8 756 32 881 7 193 10 080
720280 – Ferro-tungsten and ferrosilicotungsten
2009 2010 2011 2012 2013
Average import prices CZK/kg 406 491 520 546 698
Average export prices CZK/kg 479 525 517 836 797
810196 – Tungsten wires
2009 2010 2011 2012 2013
Average import prices CZK/kg 36 475 1 766 3 134 2 429
Average export prices CZK/kg 5 671 5 671 1 388 6 412 3 992

339Minerals mined in the past with resources and reserves – Tungsten
4. World production and world market prices
World mine productionWorld production of primary tungsten
2009 2010 2011 2012 2013e
Mine production, kt (according to MCS) 61.3 68.8 73.1 75.7 71.0
Mine production, kt (according to WBD) 60.8 77.6 82.3 81.1 N
e – preliminary values
MCS data on world production of primary tungsten in 2013 does not include the USA. Production and exports were dominated by China. As a result of the Chinese government´s measures restraining exports, the market is experiencing a shortage of tungsten, which is leading to expanded exploration and production in various parts of the world, primarily in EU countries. According to MCS, the leading producers´ shares of the world´s primary tungsten production in 2013 were:China 84.5 % Bolivia 1.7 %Russia 3.5 % Austria 1.1 %Canada 3.1 % Portugal 1.1 %
The WBD ranked Vietnam fifth in 2011 and 2012, and Rwanda and Portugal sixth in 2012 and 2011, respectively. Accordting to this source, the top ten countries´ shares of world tungsten production in 2012 were:China 83.4 % Rwanda 1.3 %Russia 4.6 % Portugal 0.9 %Canada 3.1 % Austria 0.9 %Bolivia 1.5 % Spain 0.5 %Vietnam 1.4 % Brazil 0.5 %
According to MCS, world tungsten reserves are estimated at 3 500 kt, of which 54 % are in the territory of China, 4.1 % in Canada, 3.6 % in Russia, and 2 % in the USA.
Prices of traded commoditiesAccording to the summaries Deutschland-Rohstoffdsituation 2009–2013, world prices of tungsten commodities in recent years were as follows:
Commodity/ Year 2009 2010 2011 2012 2013
Concentrate, min. 65 % WO3,
CIF main European port
USD/
mtu WO3150.00 150.00 150.00 149.50 N
Ferro-Tungsten, basis min.
75 % W, in warehouse
Rotterdam
USD/kg 26.71 31.48 48.69 48.67 45.37
Notice: mtu – metric ton unit; 1 mtu = 1% = 10 kg WO3 in 1 tonne of concentrate

340Minerals mined in the past with resources and reserves – Zinc
Zinc
1. Registered deposits and other resources of the Czech Republic
reserved registered deposits exhausted deposits and other resources
Registered deposits and other resources are not mined
Reserved registered deposits:
1 Horní Benešov 4 Křižanovice 7 Ruda u Rýmařova-sever
2 Horní Město 5 Kutná Hora 8 Zlaté Hory-východ
3 Horní Město-Šibenice 6 Oskava
Exhausted deposits and other resources:
9 Březové Hory + Příbram + Bohutín 11 Havlíčkův Brod (Dlouhá Ves + Bartoušov + Stříbrné Hory)
10 Stříbro 12 Staré Ransko

341Minerals mined in the past with resources and reserves – Zinc
2. Basic statistical data of the Czech Republic as of December 31
Number of deposits; reserves; mine production
Year 2009 2010 2011 2012 2013
Deposits – total number a) 9 8 8 8 8
exploited 0 0 0 0 0
Total mineral *reserves, kt Zn 477 472 472 472 472
economic explored reserves 0 0 0 0 0
economic prospected reserves 0 0 0 0 0
potentially economic reserves 477 472 472 472 472
Mine production, t Zn 0 0 0 0 0
* See NOTE in the chapter Introduction above on a terminological difference between Czech official application of the term reserves and standard international application of the term. The relationship of domestic and foreign classifications of mineral reserves and resources is described in the separate chapter Mineral reserve and resource classification in the Czech Republic of this yearbooka) Deposits with registered Zn content
3. Foreign trade
2608 – Zinc ores and concentrates
2009 2010 2011 2012 2013
Import t 1 5 37 3 4
Export t 0,3 0,3 0,9 0,3 3
2608 – Zinc ores and concentrates
2009 2010 2011 2012 2013
Average import prices CZK/t 355 799 57 930 39 643 129 520 148 826
Average export prices CZK/t 122 047 185 185 52 928 79 245 53 387
7901 – Unwrought zinc
2009 2010 2011 2012 2013
Import t 32 016 27 961 27 974 31 011 30 435
Export t 19 987 6 245 5 146 7 407 13 137

342Minerals mined in the past with resources and reserves – Zinc
7902 – Zinc waste and scrap
2009 2010 2011 2012 2013
Import t 2 434 900 909 583 187
Export t 2 717 4 800 4 189 4 452 3 375
7902 – Zinc waste and scrap
2009 2010 2011 2012 2013
Average import prices CZK/t 28 439 34 247 30 650 26 721 21 425
Average export prices CZK/t 19 855 23 258 25 683 26 508 25 233
7901 – Unwrought zinc
2009 2010 2011 2012 2013
Average import prices CZK/t 34 518 44 319 41 499 39 071 42 766
Average export prices CZK/t 33 777 36 341 30 964 36 531 41 257
4. World production and world market prices
World mine productionWorld production of primary zinc in recent years was as follows:
2009 2010 2011 2012 2013e
Mine production, kt (according to MCS) 11 200 12 000 12 800 13 500 13 500
Mine production, kt (according to WBD) 11 634 12 484 12 806 13 458 N
e – preliminary values
According to MCS, the shares of production in 2013 of the leading producers were as follows:China 37.0 % Mexico 4.4 %Australia 10.4 % Canada 4.1 %Peru 9.6 % Bolivia 3.0 %India 5.9 % Kazakhstan 2.7 %USA 5.6 % Ireland 2.4 %
The MCS etsimated world reserves at 250 million tonnes, of which 25 % were accounted for by Australia, around 17 % by China, and about 10 % by Peru. Identified resources are estimated at 1.9 billion tonnes.

343Minerals mined in the past with resources and reserves – Zinc
Prices of traded commoditiesAccording to the summaries Deutschland-Rohstoffsituation 2009–2013 (D-R) and Metal Bulletin (MB), world zinc prices in USD/t were as follows:
Commodity/ Year 2009 2010 2011 2012 2013
Special high grade, min. 99.995 %,
cash, in LME warehouse
(according to D-R)
1 654.69 2 160.36 2 192.90 1 947.73 N
Zinc, LME cash
(according to MB)
2 569.50–
1 059.25
2 634.25–
1 594.75
1 749.00–
2 545.25
1 759.25–
2 178.25–
1 783.75–
2 187.25
Zinc, LME 3-month contract
(according to MB)
2 596.00–
1 088.00
2 660.00–
1 618.00
1 770.00–
2 574.00
1 756.50–
2 065.55
1 820.50–
2 214.00
The price range according to MB includes the lowest and highest monthly price quotes for a given year.

344
MINERALS MINED IN THE PAST WITHOUT RESOURCES AND RESERVES
Antimony
Foreign trade
261710 – Antimony ores and concentrates
2009 2010 2011 2012 2013
Import kg 37 021 53 035 69 054 89 009 48 174
Export kg 0 0 0 0 N
8110 – Antimony and articles thereof, including waste and scrap
2009 2010 2011 2012 2013
Import t 54 75 64 31 42
Export t 12 19 0.02 0.5 N
261710 – Antimony ores and concentrates
2009 2010 2011 2012 2013
Average import prices CZK/kg 91 112 192 189 119
Average export prices CZK/kg – – 6 000 – N
8110 – Antimony and articles thereof, including waste and scrap
2009 2010 2011 2012 2013
Average import prices CZK/t 98 434 141 136 263 697 283 072 216 831
Average export prices CZK/t 117 657 143 763 238 095 339 623 N

345Minerals mined in the past without resources and reserves – Antimony
World production and world market prices
World mine productionTrend in the world´s primary antimony production in 2009–2013
2009 2010 2011 2012 2013e
Mine production of antimony, kt
(according to MCS)155 167 178 174 163
Mine production of antimony, kt
(according to WBD)129 150 149 163 N
e – preliminary values
China was by far the largest poducer of antimony ore and accounted for nearly 80 % of global production in 2013 (MCS). Russia ranked second with about 4 %. Other leading producers in 2013 were also Bolivia, Tajikistan and South Africa with shares of around 3 %.
According to MCS, world reserves are estimated at 1 800 kt, of which nearly 53 % is accounted for by China, around 19 % by Russia, 17.5 % by Bolivia. The MCS did not provide any data on US production and reserves of antimony ore.
Prices of traded commodities (USD/t) according to IM
Commodity/ Year 2009 2010 2011 2012 2013
Antimony trioxide, typically 99.5%,
5 tonne lots,
CIF Antwerp/Rotterdam
N N 12 000–14 600 8 750–12 850 9 000–1 000
Antimony trioxide, typically 99.5%,
20 tonne lots, FOB ChinaN N 12 000–14 500 9 500–12 800 9 000–10 100
Antimony trioxide, min. 99.65%,
ingot, CIF Rotterdam N N N 10 000–13 700 9 950–12 500
Antimony trioxide, min. 99.65%,
ingot, FOB ChinaN N N 11 200–17 000 9 550–10 800
The price range includes the lowest and highest monthly price quotes for a given year.

346Minerals mined in the past without resources and reserves – Arsenic
Arsenic
Foreign trade
280480 – Arsenic
2009 2010 2011 2012 2013
Import kg 232 56 19 27 6 032
Export kg 0 0 0 0 0
280480 – Arsenic
2009 2010 2011 2012 2013
Average import prices CZK/kg 1 819 11 661 9 000 9 148 102
Average export prices CZK/kg – – – – –
World production and world market prices
World mine productionThe world´s primary production of arsenic in recent years was as follows:
2009 2010 2011 2012 2013e
World production of arsenic, kt
(according to MCS)54.4 52.8 45.8 46.7 45.0
World production of arsenic, kt
(according to WBD)49.4 54.2 47.8 53.5 N
e – preliminary values
According to MCS, the leading producers of arsenic trioxide in 2013 were:China 55.6 % Russia 3.3 %Chile 22.2 % Belgium 2.2 %Morocco 15.6 %
Other producers, whose production data was not provided, also include Bolivia, Japan, Portugal, Mexico and Peru. According to WBD, the following countries accounted for the world´s primary production of arsenic in 2012:China 48.6 % Russia 2.8 %Chile 18.7 % Belgium 1.9 %Morocco 16.5 % Philippines 0.8 %Namibia 7.6 % Bolivia 0.2 %Kazakhstan 2.8 % Iran 0.2 %

347Minerals mined in the past without resources and reserves – Arsenic
Prices of traded commoditiesMetal Bulletin quoted prices as follow:
Commodity/ Year 2009 2010 2011 2012 2013
Arsenic, USD/lb 0.60–0.65 0.60–0.65 0.60–0.80 0.70–0.80 0.70–0.80
Note: lb – pound; 1 lb = 0,4536 kg
The MCS estimated global resources of arsenic contained in copper and lead ores at 11 million tonnes .

348Minerals mined in the past without resources and reserves – Cobalt
Cobalt
Foreign trade
2605 – Cobalt ores and concentrates
2009 2010 2011 2012 2013
Import kg 426 3 428 600 275 410
Export kg 7 000 0 0 0 0
8105 – Cobalt mattes and other intermediate products of cobalt metallurgy; cobalt and articles thereof, including waste and scrap
2009 2010 2011 2012 2013
Import t 220 60 60 74 60
Export t 10 9 17 14 24
2605 – Cobalt ores and concentrates
2009 2010 2011 2012 2013
Average import prices CZK/kg 937 357 1 535 1 596 1 515
Average export prices CZK/kg 43 – – – –
8105 – Cobalt mattes and other intermediate products of cobalt metallurgy; cobalt and articles thereof, including waste and scrap
2009 2010 2011 2012 2013
Average import prices CZK/t 167 820 939 289 1 038 238 910 368 938 381
Average export prices CZK/t 706 335 694 102 567 321 479 832 648 369

349Minerals mined in the past without resources and reserves – Cobalt
World production and world market prices
World mine productionStatistical data on world cobalt production according to MCS (t)
2009 2010 2011 2012 2013e
Mine production of cobalt
(according to MCS)72 300 89 500 109 000 103 000 120 000
Mine production of cobalt
(according to WBD)65 169 104 542 113 386 128 624 N
e – preliminary values
According to MCS statistics, the leading producers in 2013 were:DR Congo (Kinshasa) 42.5 % Zambia 4.3 %Canada 6.7 % Cuba 3.6 %China 5.9 % Brazil 3.3 %Russia 5.6 % New Caledonia 2.8 %Australia 5.4 % Morocco 1.8 %
According to MCS, world reserves of primary cobalt amount to 7 200 kt, of which around 50 % are in the DR Congo. Identified world terrestrial cobalt resources are estimated at 25 million tonnes.
Prices of traded commoditiesAnnual prices according to the summaries Deutschland-Rohstoffsituation
Commodity/ Year 2009 2010 2011 2012 2013
Cobalt, min. 99.8%, free
market, in warehouse,
Rotterdam
USD/kg 38.03 45.33 38.60 30.75 29.01

350Minerals mined in the past without resources and reserves – Iron
Iron
Foreign trade
2601 – Iron ores and concentrates
2009 2010 2011 2012 2013
Import t 4 809 745 5 936 926 7 365 406 5 866 844 6 268 059
Export t 0.1 8 984 1 098 1 797
7201 – Crude iron
2009 2010 2011 2012 2013
Import t 47 171 55 347 76 817 68 380 65 307
Export t 24 040 65 473 45 652 82 771 82 515
7204 – Ferrous waste and scrap, remelted scrap ingots or iron or steel
2009 2010 2011 2012 2013
Import t 379 381 403 373 473 843 477 439 554 034
Export t 1 443 523 1 823 724 2 056 046 2 052 360 1 911 717
2601 – Iron ores and concentrates
2009 2010 2011 2012 2013
Average import prices CZK/t 1 752 2 469 2 657 2 686 2 566
Average export prices CZK/t N 14 740 16 266 17 640 18 232
7201 – Crude iron
2009 2010 2011 2012 2013
Average import prices CZK/t 6 825 8 924 10 222 9 551 9 462
Average export prices CZK/t 6 575 9 550 10 285 8 585 8 190

351Minerals mined in the past without resources and reserves – Iron
7204 – Ferrous waste and scrap, remelted scrap ingots or iron or steel
2009 2010 2011 2012 2013
Average import prices CZK/t 4 540 6 048 7 489 7 845 7 193
Average export prices CZK/t 4 870 7 840 7 840 7 472 6 807
World production and world market prices
World mine productionWorld production of iron ore in recent years according to published statistics
2009 2010 2011 2012 2013e
World mine production of iron ore
(according to MCS), mill t2 240 2 590 2 940 2 930 2 950
World mine production of iron ore
(according to WBD), mill t1 110 1 283 1 411 1 408 N
e – preliminary values
According to MCS, the largest producers in 2013 were the following countries:China 44.7 % Ukraine 2.8 %Australia 18.0 % South Africa 2.3 %Brazil 13.5 % USA 1.8 %India 5.1 % Canada 1.4 %Russia 3.5 % Venezuela 1.0 %
The MCS point out that the data for China are based on the production of crude ore, rather than usable ore, as reported for other countries. There is a considerable discrepancy between the numbers of both statistics due to different methods of calculating the iron content of mined ores. This is confirmed by the fact that there is a correspondence in the discrepancy, which in terms of global production in 2012 amounts to 108 % and is nearly identical with the difference of 113 % in terms of the total production for the top ten countries. A corresponding difference amounting to 110 % also exists in the case of reserves, which the MCS list under separate columns for crude ore and iron content, amounting to 170 000 million tonnes of crude ore with a total iron content of 81 000 million tonnes, i.e. 48 % Fe. According to MCS, world resources are estimated at more than 230 billion tonnes of iron contained in more than 800 billion tonnes of crude ore, which represents an iron content of only 29 %.

352Minerals mined in the past without resources and reserves – Iron
Prices of traded commodities
Average annual prices of iron ore according to the summaries Deutschland-Rohstoffsituation
Commodity/ Year 2008 2009 2010 2011 2012
Iron ore, Hamersley fines,
64 % Fe, contract price,
FOB Australia/Japan
USc/mtu 108.90 N N N N
Iron ore, CVRD fines (SSF),
64.5 % Fe, FOB EuropeUSc/mtu 105.20 N N N N
Iron ore, fines, 63.5 % Fe, spot
price, CFR ChinaUSD/t N 152.37 175.22 133.80 N
Iron ore, any origin, spot price,
MBA (according to the World
Bank)
USD/dmt N N135.55–
187.18*
99.47–
147.64*
114.82–
154.64*
Notes: * The price range includes the lowest and highest monthly price quotes for a given year. mtu – metric ton unit; 1 mtu = 1% = 10 kg Fe in ore dmt – dry metric ton
Spot prices of iron ore according to Platts Market Data (USD/dmt)
Commodity/ Year 2011 2012 2013
Iron ore, any origin 135.54–187.18 99.47–147.64 114.82–154.64
The price range includes the lowest and highest monthly price quotes for a given year.
In view of the fact that the leading importers of iron ore are China, Japan and South Korea and the main suppliers Australia (the companies BHP Billiton, RTZ, FMG) and Brazil (Vale DR), vast amounts of iron ore, pellets and concentrates are transported by sea. In 2012, sea transport of iron ore exceeded 1 billion tonnes for the first time. It surpassed 1.1 billion tonnes in 2013.

353Minerals mined in the past without resources and reserves – Mercury
Mercury
Foreign trade
280540 – Mercury
2009 2010 2011 2012 2013
Import kg 4 319 2 561 4 385 2 676 3 260
Export kg 6 521 1 241 19 141 129
280540 – Mercury
2009 2010 2011 2012 2013
Average import prices CZK/kg 247 162 356 213 581
Average export prices CZK/kg 993 598 770 830 1 124
World production and world market prices
World mine productionWorld mine production of mercury (t)
2009 2010 2011 2012 2013e
World mine production of mercury
(according to MCS)1 920 2 250 2 010 1 810 1 810
World mine production of mercury
(according to WBD)1 916 3 955 3 887 1 850 N
e – preliminary values
The MCS listed world reserves of primary mercury at 94 kt and did not take into account the reserves of Spain´s Almaden Mine in particular, which by far exceed the reserves at other global deposits. World resources of primary mercury were estimated at 600 kt.
Prices of traded commoditiesAnnual prices according to the summaries Deutschland-Rohstoffsituation
Commodity/ Year 2009 2010 2011 2012 2013
Mercury, min. 99.99%, free
market, in warehouse
USD/
flask619.37 1 000.49 1 656.71 2 701.27 3 438.89
A flask of mercury is the equivalent of 34 kg.

354Minerals mined in the past without resources and reserves – Sulphur
Sulphur
Foreign trade
2503 – Sulphur of all kinds, other than sublimed, precipitated and colloidal
2009 2010 2011 2012 2013
Import t 20 986 14 761 14 947 3 848 54 002
Export t 20 153 12 227 949 1 852 9 195
2802 – Sulphur, sublimed or precipitated; colloidal sulphur
2009 2010 2011 2012 2013
Import t 71 032 82 355 93 461 39 458 27 869
Export t 83 429 316 253 N
2807 – Sulphuric acid
2009 2010 2011 2012 2013
Import t 33 519 34 206 35 531 25 480 68 076
Export t 56 145 43 778 46 371 45 123 29 465
2503 – Sulphur of all kinds, other than sublimed, precipitated and colloidal
2009 2010 2011 2012 2013
Average import prices CZK/t 5 703 9 314 11 068 14 777 5 020
Average export prices CZK/t 765 977 4 886 4 078 1 494
2802 – Sulphur, sublimed or precipitated; colloidal sulphur
2009 2010 2011 2012 2013
Average import prices CZK/t 602 1 136 2 684 3 384 2 845
Average export prices CZK/t 51 361 11 813 19 335 35 541 N

355Minerals mined in the past without resources and reserves – Sulphur
2807 – Sulphuric acid
2009 2010 2011 2012 2013
Average import prices CZK/t 1 055 1 379 1 421 2 121 1 819
Average export prices CZK/t 1 091 1 743 1 896 1 707 1 759
World production and world market prices
World mine productionWorld production of sulphur, primarily from the processing of liquid and gaseous hydrocarbons, has over the years had an upward trend. The trend in recent years was as follows:
2009 2010 2011 2012 2013e
World sulphur production
(according to MCS), kt67 900 68 100 70 500 68 100 69 000
World sulphur production
(according to WBD), kt59 868 61 947 61 200 66 346 N
e – preliminary values
The following is a list of the top ten producers in 2013:China 14.5 % Germany 5.5 %USA 13.2 % Japan 4.8 %Russia 10.6 % Kazakhstan 3.9 %Canada 8.7 % United Arab Emirates 2.9 %Saudi Arabia 5.9 % Iran 2.8 %
Reserves of sulphur in crude oil, naural gas and sulphide ores are large. As a result of the processing of crude oil and sulphides in industrial countries with limited mineral resources, production of sulphur is not strongly dependent on sulphur reserves (e.g. Germany). According to MCS, resources of elemental sulphur in evaporite and volcanic deposits and sulphur in the deposits of natural gas, crude oil, tar sands and sulphides amount to around 5 billion tonnes. The sulphur in gypsum and anhydrite is practically limitless. The MCS estimated that about 600 billion tonnes of sulphur is contained in coal and oil shale.

356
Prices of US sulphur USD/lt according to INTER-CHEM
Commodity/ Year 2009 2010 2011 2012
Alberta M. T. FOB 10–20 N 45 60–70
US West coast FOB 3–15 30–85 180–192 162,50–185
Houston del 5–15 75–145 170–205 145–157
Nola FOB 1–19 79–134 174–209 145–169
Florida, contract del 5–30 90–160 185–220 160–180
Tampa, spot FOB 20–80 N 230 165
Note: 1 lt (long ton) = 1.016 tonne

357
The registered deposit is not exploited
1 Cínovec-jih* 2 Krásno-Koník
Note:* Deposit of also potentially economic reserves of Sn-W ores and contents of Ta and Nb in experimental concentrates
MINERALS UNMINED IN THE PAST WITH RESOURCES AND RESERVES
Lithium, rubidium and cesium
Registered deposits and other resources of the Czech Republic
reserved registered deposits

358Minerals unmined in the past with resources and reserves – Lithium – rubidium – cesium
Basic statistical data of the Czech Republic as of December 31
Number of deposits; reserves; mine production
Year 2009 2010 2011 2012 2013
Deposits – total number 1 1 1 1 1
Exploited 0 0 0 0 0
Total *reserves, t Li 112 775 112 775 112 775 112 775 112 775
economic explored reserves 0 0 0 0 0
economic prospected reserves 0 0 0 0 0
potentially economic reserves 112 775 112 775 112 775 112 775 112 775
Mine production, t Li 0 0 0 0 0
* See NOTE in the chapter Introduction above on a terminological difference between Czech official application of the term reserves and standard international application of the term. The relationship of domestic and foreign classifications of mineral reserves and resources is described in the separate chapter Mineral reserve and resource classification in the Czech Republic and its evolutional comparison with international classifications of this yearbook
In the Czech Republic, it is possible to consider the entire Krušné hory Mts. as a lithium province. Around 300 million tonnes of ore with elevated lithium contents were identified in Cínovec and its surroundings alone. As for the potentially economic deposit of tin-tungsten ores of Cínovec-jih, 112,775 tonnes of lithium in 53.4 million tonnes of ore with an average lithium content of 0.117 % are recorded in the Balance of Reserves of Reserved Mineral Deposits of the Czech Republic. In addition, byproduct amounts of 56 kt of rubidium and 1.8 kt of cesium were also evaluated in this deposit. Beside the Balance of Reserves of Reserved Mineral Deposits of the Czech Republic Li reserves are estimated also at former deposits Cínovec-sever-lomová těžba (79 kt), Cínovec-starý závod (3.8 kt), Vernéřov u Aše (15.2 kt) and Krásno-Koník (2 kt).
Brine reserves with anomalous bromine and lithium contents were calculated at 453.6 million m³ in the mining lease of the Slaný deposit of bituminous coal. These groundwater reserves contain 123 kt of bromine, 15 kt of lithium and more than 18 million tonnes of NaCl.
Foreign trade
280519 – Lithium, potassium, rubidium, cesium
2009 2010 2011 2012 2013
Import kg 39 422 21 566 20 383 232 363 65 388
Export kg 205 0 117 1 097 1

359Minerals unmined in the past with resources and reserves – Lithium – rubidium – cesium
28369100 – Lithium carbonates
2009 2010 2011 2012 2013
Import kg 34 706 66 075 71 775 88 801 75 096
Export kg 116 1 208 1 738 2 284 2 095
28369100 – Lithium carbonates
2009 2010 2011 2012 2013
Average import prices CZK/kg 130 118 121 131 129
Average export prices CZK/kg 440 406 455 427 629
280519 – Lithium, potassium, rubidium, cesium
2009 2010 2011 2012 2013
Average import prices CZK/kg 351 744 862 58 168
Average export prices CZK/kg 122 – 316 39 2000
World production and world market prices
World mine productionWorld lithium production in recent years had an upward trend:
2009 2010 2011 2012 2013e
World mine production of lithium
(according to MCS), t18 800 28 100 34 100 35 000 35 000
World production of lithium oxide
(according to WBD), t34 594 51 422 62 231 73 276 N
e – preliminary value
According to MCS, world lithium production (not including the USA) in 2013 was distributed as follows:Chile 38.6 % Zimbabwe 3.1 % Australia 37.7 % Portugal 1.6 %China 11.4 % Brazil 0.4 %Argentina 8.6 %

360Minerals unmined in the past with resources and reserves – Lithium – rubidium – cesium
According to WBD, the USA ranked fifth in 2015 with a 4.1 % share of production. WBD statistics did not include Zimbabwe among lithium producers in 2012 at all. Data on world production of rubidium and cesium were not provided. According to MCS, Zimbabwe produced small quantities of cesium as a by-product of the processing of lithium ores.
According to MCS, Chile accounted for nearly 58 % and China for almost 27 % of world lithium reserves, which totaled 13 million tonnes. Australia (7.7 %) was next, followed by Argentina (6.5 %). Identified world resources of lithium, as listed in the MCS, amounted to 40 million tonnes, of which 9 million tonnes were accounted for by Bolivia, 7.5 million tonnes by Chile, and 6.5 million tonnes by Argentina. The resources of the USA and China were nearly identical, amounting to 5.5 and 5.4 million tonnes, respectively.
According to MCS, world reserves and resources of rubidium and cesium are unknown.
Prices of traded commodities containing lithium according to IM
Commodity/Year 2009 2010 2011 2012 2013
Petalite, 4.2% LiO2, FOB Durban USD/t 165–260 165–260 165–260 165–220 165–260
Spodumene concentrate,
> 7.25 LiO2, FOB West VirginiaUSD/st 620–700 650–700 400–770 720–770 N
Spodumene, glass trade,
5 % LiO2, FBO West VirginiaUSD/st 340–450 430–480 460–530 N N
Spodumene concentrate,
5 % LiO2, CIF USAUSD/st N N N 460–510 460–510
Spodumene concentrate.
7.5 % LiO2, CIF EuropeUSD/t N N N 750–800 750–800
Spodumene concentrate,
> 7.5 % LiO2, bulk, CIF AsiaUSD/t N N N 720–770 720–770*
Spodumene concentrate,
5 % LiO2, CIF AsiaUSD/t N N N 300–400 460–510*
Lithium carbonate, del
continental, USA large contractsUSD/lb 2.8–3 2.3–2.4 2.3–2.4 2.5–3 3–3.5
Lithium hydroxide, 56.5–57.5 %
LiOH, large contracts, packed
in drums or bags, CIF Europe
or USA
USD/kg N N N 6.5–7.5 5.5–7
Lithium hydroxide, Chinese
(56.5-57.5% LiOH), packed in
drums or bags, large contracts,
CIF Europe
USD/kg N N N 6–6.6 7–8
Notices: * CIF USA v USD/st st – short ton; 1 st = 0.9072 tonne lb – pound; 1 lb = 0.4536 kg The price range includes the lowest and highest monthly price quotes for a given year

361Minerals unmined in the past with resources and reserves – Molybdenum
Molybdenum
Registered deposits and other resources in the Czech Republic; basic statistical data of the Czech Republic as of December 31
In the Czech Republic, 80 million tonnes of prognostic resources (unapproved) of molybdenum ores with an average molybdenum content of 0.176 %, i.e. 14 037 tonnes of molybdenum, were estimated in the Hůrky locality in the Čistá-Jeseník Massif (L. Kopecký 1983).
Foreign trade
81029400 – Unwrought molybdenum, including bars, rods obtained by simple sintering
2009 2010 2011 2012 2013
Import kg 15 060 8 555 18 393 4 649 3 359
Export kg 4 443 3 160 14 409 213 936
81029400 – Unwrought molybdenum, including bars, rods obtained by simple sintering
2009 2010 2011 2012 2013
Average import prices CZK/kg 557 766 677 1 626 334
Average export prices CZK/kg 649 824 695 643 601
World production and world market prices
World mine productionAccording to statistics, world production of primary molybdenum in 2009–2013 was as follows:
2009 2010 2011 2012 2013e
World mine production of molybdenum
(according to MCS), kt221 242 264 259 270
World mine production of molybdenum
(according to WBD), kt226 242 254 254 N
e – preliminary value

362Minerals unmined in the past with resources and reserves – Molybdenum
According to MCS, the leading producers that accounted for global production in 2013 were:China 40.1 % Canada 3.3 %USA 25.9 % Armenia 2.4 %Chile 13.5 % Iran 2.3 %Peru 6.3 % Turkey 1.9 %Mexico 4.1 % Russia 1.7 %
The top three producers accounted for almost 80 % of the world´s molybdenum production. These three countries also have nearly 90 % of estimated world reserves, which amount to 11 million tonnes according to MCS. Identified resources are listed at 20 million tonnes, of which one-fourth are in the USA.
Prices of traded commoditiesAccording to the summaries Deutschland-Rohstoffsituation 2009–2013, world prices of molybdenum commodities (USD/kg) in recent years were as follows:
Commodity/Year 2009 2010 2011 2012 2013
Ferro-Molybdenum, basis 65–70 % Mo,
Europe, free market27.48 40.13 38.32 31.41 25.87
Molybdic oxide, drummed, Europe, free
market, in warehouse 25.34 35.07 34.32 28.16 22.80

363Minerals unmined in the past with resources and reserves – Rare ear ths
Rare earths
Registered deposits and other resources in the Czech Republic; basic statistical data of the Czech Republic as of December 31
In the Czech Republic, there are descriptions of estimated resources (unapproved) of rare earth oxides from various mineralisations and geological formations. For example, the cerium content in uranium ores of uranium-bearing sandstone of the Stráž block in the Bohemian Cretaceous Basin was evaluated at 4,750 tonnes of cerium. Anomalous rare earth oxide contents are also assumed to occur in the Hůrky locality in the Čistá-Jeseník Massif (along with resources of Mo, Ta, Nb, Zr, and Hf), in alkaline volcanic rocks in the České Středohoří, in volcanic rocks of the Šternberk-Horní Benešov belt in the Nízký Jeseník Mts., in graphitic phyllites of the Železné Hory Mts. Proterozoic, in argillitised tuffs of the Upper Silesian Basin etc.
Foreign trade
28461000 – Cerium compounds
2009 2010 2011 2012 2013
Import kg 88 136 94 438 86 832 284 075 84 059
Export kg 3 099 2 247 2 808 2 991 2 517
28053010 – Rare earth metals, scandium and yttrium, intermixed or interalloyed
2009 2010 2011 2012 2013
Import kg 200 3 597 4 270 2 780 150
Export kg 0 435 1 720 2 805 20
28461000 – Cerium compounds
2009 2010 2011 2012 2013
Average import prices CZK/kg 367 381 1 055 409 913
Average export prices CZK/kg 512 933 1 366 1 259 1 249
28053010 – Rare earth metals, scandium and yttrium, intermixed or interalloyed
2009 2010 2011 2012 2013
Average import prices CZK/kg 200 718 1 962 1 365 1 427
Average export prices CZK/kg – 423 1 982 1 484 2 050

364Minerals unmined in the past with resources and reserves – Rare ear ths
28053090 – Rare earth metals, scandium and yttrium, not intermixed or interalloyed
2009 2010 2011 2012 2013
Import kg 29 11 698 30 428 139 375
Export kg 2 1 3 3 2
28053090 – Rare earth metals, scandium and yttrium, not intermixed or interalloyed
2009 2010 2011 2012 2013
Average import prices CZK/kg 11 862 577 638 5 871 3 667
Average export prices CZK/kg 159 000 1 000 2 000 1 333 7 000
World production and world market prices
World mine productionStatistical data on world production of rare earths for the past five years
2009 2010 2011 2012 2013e
World mine production, t
(according to MCS)133 000 133 000 111 000 110 000 110 000
World production of concentrates, t
(according to WBD)132 244 122 140 100 261 103 942 N
e – preliminary values
In view of the close numbers, the content of rare earth oxides was taken into account in both cases. The MCS listed the top five largest producers for 2013:China 90.9 % Russia 2.2 %USA 3.6 % Australia 1.8 %India 2.6 %
According to WBD statistics, China´s share of production in 2012 was decisive, amounting to 91.4 %, followed by second-ranked Australia with 5.4 % and Russia in third with 2.1 %. The USA ranked fourth with a share of 0.8 %.
The MCS estimated world reserves at 140 million tonnes, of which 55 million tonnes are in China and 22 million tonnes in Brazil.

365Minerals unmined in the past with resources and reserves – Rare ear ths
The MCS listed the data on the production of yttrium separately . Its production in recent years was as follows:
2009 2010 2011 2012 2013e
World production of yttrium oxide, t 8 900 8 900 8 900 7 100 7 100
e – preliminary values
China was by far the largest producer in 2013 with a share of 98 .6 % .
Prices of traded commoditiesAccording to the summaries Deutschlad-Rohstoffsituation 2009–2013, world prices (USD/kg) of commodities with rare earths in recent years were as follows:
Commodity/Year 2009 2010 2011 2012 2013
Cerium oxide, 99 %, bulk, FOB China N 20.17 98.44 24.97 7.90
According to Industrial Minerals, the prices of rare earth oxides (USD/kg) were as follows:
Commodity/Year 2009 2010 2011 2012 2013
Rare earth Ce
oxides, Dy
min. 99 %, Eu
large purchases, La
FOB China Nd
Pr
Sm
3.2–4.60
N
450–495
5.2–8.0
14.50–145
14.50–145
N
3.2–53
N
490–610
5.80–53
19.50–80
19–76
N
52–90
N
3650–4300
50–95
240–320
85–235
N
16–21
890–1000
2020–2300
15–21
95–105
95–105
60–80
4–6
310–350
700–900
4–6
40–60
75–90
5–7
The price range includes the lowest and highest monthly price quotes for a given year .

366Minerals unmined in the past with resources and reserves – Selenium, tel lur ium
Selenium, tellurium
Registered deposits and other resources in the Czech Republic; basic statistical data of the Czech Republic as of December 31
In the Czech Republic unapproved prognostic resources of Se, in the Zn-Pb-Cu deposit Zlaté Hory-západ, were evaluated tentatively at more than 13 tonnes (K . Stuchlíková – I . Frolíková 1988) .
Foreign trade
280490 – Selenium
2009 2010 2011 2012 2013
Import kg 3 750 5 807 5 513 10 940 6 003
Export kg 1 200 1 200 350 > 0 511
28045090 – Tellurium
2009 2010 2011 2012 2013
Import kg 3 25 26 14 2
Export kg 0 0 0 0 1
280490 – Selenium
2009 2010 2011 2012 2013
Average import prices CZK/kg 905 1 612 2 468 2 402 1 556
Average export prices CZK/kg 887 1 694 2 471 > 2 000 1 705
28045090 – Tellurium
2009 2010 2011 2012 2013
Average import prices CZK/kg 5 000 24 560 16 462 19 143 18 500
Average export prices CZK/kg – – – – 48 000

367Minerals unmined in the past with resources and reserves – Selenium, tel lur ium
World production and world market prices
World mine productionStatistical data on the production of selenium and tellurium are very fragmentary. The only data available in terms of a time series were provided by the WBD for tellurium in 2008–2012.
2008 2009 2010 2011 2012
World production of tellurium according
to WBD, t226 242 254 254 N
In view of the fact that selenium and tellurium are by-products of the processing of copper ores, information on production and resources are based on the status of copper ore deposits. According to MCS, the largest producer of selenium in 2012 and 2013 was Japan, followed by Germany and Belgium. According to WBD, 2 175 tonnes of selenium were produced in 2012 and the leading producers were: Germany 29.9 % Kazakhstan 6.0 %Japan 9.9 % Sweden 4.6 %Belgium 9.2 % Mexico 4.4 %Russia 6.7 % Finland 4.3 %Canada 6.6 % Poland 4.1 %
The WBD lists the following five producers of tellurium for 2012:USA 37.6 % Canada 8.3 %Japan 26.3 % Sweden 5.3 %Russia 22.6 %
The MCS estimated world reserves of selenium at 120 kt, of which about 20 % are accounted for by China and roughly 17 % by Russia.
The MCS estimated world reserves of tellurium at 24 kt. Peru and the USA account for the biggest share, rougly 15 %.
Prices of global commodities According to the summaries Deutschland-Rohstoffsituation 2009–2013, the average world prices of selenium (USD/kg) were as follows:
Commodity/Year 2009 2010 2011 2012 2013
Selenium, min. 99.5 %, free market 50.85 82.10 136.24 114.33 72.95
Some data in the summaries indicate that tellurium prices peaked in 2011, fluctuating around 350 USD/kg. In 2012, the world´s tellurium prices ranged between 100–300 USD/kg and between 100–140 USD/kg in 2013.

368Minerals unmined in the past with resources and reserves – Tantalum, niobium
Tantalum, niobium
Registered deposits and other resources in the Czech Republic; basic statistical data of the Czech Republic as of December 31
In the Czech Republic, prognostic resources (unapproved) were evaluated at 3,238 tonnes in uranium deposits and uranium-bearing sandstone of the Stráž block in the Bohemian Cretaceous Basin (along with TR, Zr and Hf), and another 568 tonnes in the Hůrky locality in the Čistá-Jeseník Massif (along with Mo, TR, Zr and Hf), where 57 tonnes of prognostic tantalum resources were also calculated. Recoverable contents of tantalum and niobium are also known to occur in tungsten and tin concentrates, which were recovered experimentally during the exploration of the tin-tungsten ore deposit of Cínovec-jih (along with Li, Rb and Cs).
Foreign trade
26159010 – Tantalum and niobium ores and concentrates
2009 2010 2011 2012 2013
Import kg 0 0 100 20 122 2 604
Export kg 0 0 0 19 878 75
810320 – Unwrought tantalum
2009 2010 2011 2012 2013
Import kg 105 657 240 040 173 469 145 368 184 971
Export kg 50 096 76 647 79 048 60 940 81 263
26159010 – Tantalum and niobium ores and concentrates
2009 2010 2011 2012 2013
Average import prices CZK/kg – – 120 425 91
Average export prices CZK/kg – – – 421 61
810320 – Unwrought tantalum
2009 2010 2011 2012 2013
Average import prices CZK/kg 7 348 8 426 11 710 10 935 9 530
Average export prices CZK/kg 6 839 6 642 5 972 8 830 9 528

369Minerals unmined in the past with resources and reserves – Tantalum, niobium
World production and world market prices
World mine productionWorld production of tantalum and niobium in 2009–2013 was as follows:
2009 2010 2011 2012 2013e
World production of tantalum (according to MCS), t 665 681 767 670 786
World production of niobium (according to MCS), t 62 900 62 900 63 400 87 969 59 400
2009 2010 2011 2012 2013e
World production of tantalum (according to WBD), t 976 772 786 934 N
World production of niobium (according to WBD), t 93 498 67 979 69 580 87 969 N
e – preliminary values
According to WBD, the largest producers of niobium in 2012 were:Brazil 93 .5 % DR Congo 0 .22 %Canada 5 .5 % Rwanda 0 .2 %Russia 0 .51 %
According to MCS, Brazil accounted for 88 .2 % and Canada for 9 .8 % of world niobium production in 2013 .
As published by the WBD, the leading producers of tantalum in 2012 were:Rwanda 28 .2 % Nigeria 8 .4 %DR Congo 21 .5 % Russia 3 .2 %Brazil 12 .6 % Mozambique 2 .6 %Ethiopia 12 .6 % Bolivia 1 .4 %Burundi 8 .6 % Malaysia 1 .0 %
With regard to tantalum production in 2013, the MCS ranked Rwanda (31.8 %) in first place as well . DR Congo (18 .6 %) was next, followed by Mozambique (14 .6 %), Brazil (12 .4 %) and China (7.6 %). World tantalum (identified) resources are reported to about 260 ths t Ta (USGS 2012 Minerals Yearbook) and reserves of niobium in leading world producers to 4 100 ths t in Brazil and 200 ths t in Canada (MCS 2014) .
Prices of traded commodities
2009 2010 2011 2012 2013
Tantalite ore, USD/t Ta2O5* 81–99 81 84–245 207–273 273–178
Ferroniobium, USA import, USD/t** 37 298 37 781 41 825 43 658 44 000
* – based on InfoMine.com and MetalPrices.com charts** – MCS data
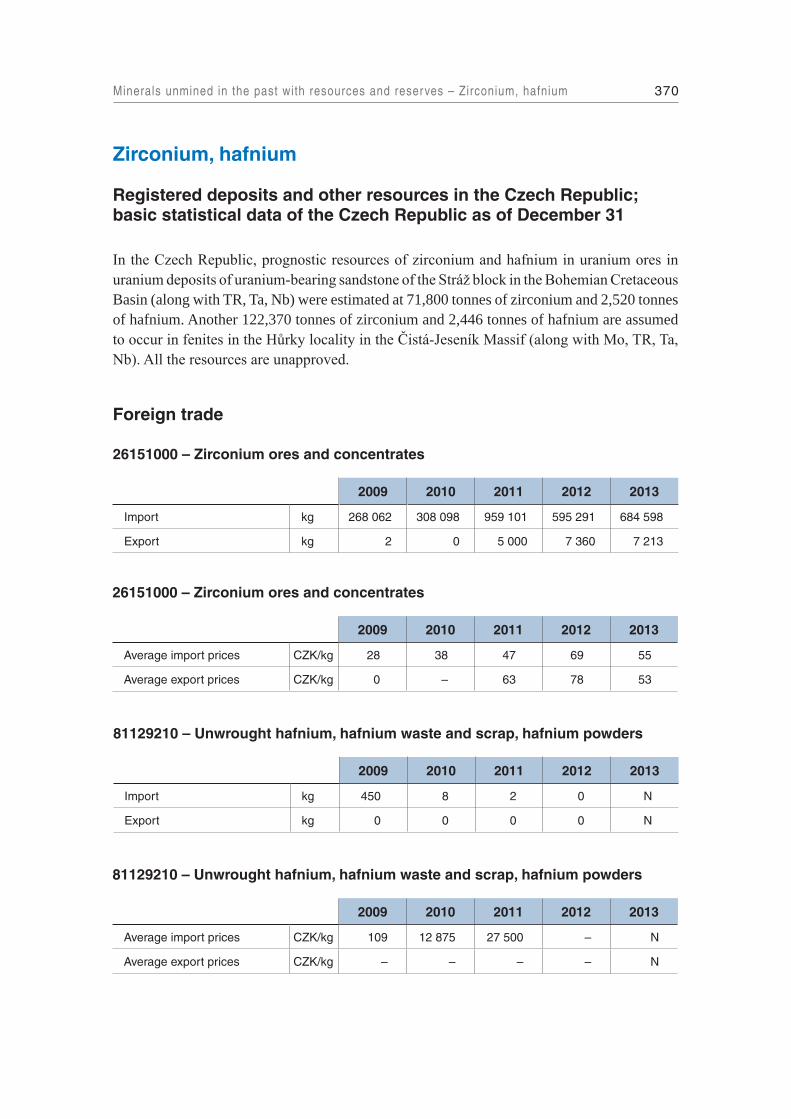
370Minerals unmined in the past with resources and reserves – Zirconium, hafnium
Zirconium, hafnium
Registered deposits and other resources in the Czech Republic; basic statistical data of the Czech Republic as of December 31
In the Czech Republic, prognostic resources of zirconium and hafnium in uranium ores in uranium deposits of uranium-bearing sandstone of the Stráž block in the Bohemian Cretaceous Basin (along with TR, Ta, Nb) were estimated at 71,800 tonnes of zirconium and 2,520 tonnes of hafnium. Another 122,370 tonnes of zirconium and 2,446 tonnes of hafnium are assumed to occur in fenites in the Hůrky locality in the Čistá-Jeseník Massif (along with Mo, TR, Ta, Nb). All the resources are unapproved.
Foreign trade
26151000 – Zirconium ores and concentrates
2009 2010 2011 2012 2013
Import kg 268 062 308 098 959 101 595 291 684 598
Export kg 2 0 5 000 7 360 7 213
81129210 – Unwrought hafnium, hafnium waste and scrap, hafnium powders
2009 2010 2011 2012 2013
Import kg 450 8 2 0 N
Export kg 0 0 0 0 N
26151000 – Zirconium ores and concentrates
2009 2010 2011 2012 2013
Average import prices CZK/kg 28 38 47 69 55
Average export prices CZK/kg 0 – 63 78 53
81129210 – Unwrought hafnium, hafnium waste and scrap, hafnium powders
2009 2010 2011 2012 2013
Average import prices CZK/kg 109 12 875 27 500 – N
Average export prices CZK/kg – – – – N

371Minerals unmined in the past with resources and reserves – Zirconium, hafnium
World production and world market prices
World mine productionStatistical data on zirconium production provided by the MCS
2009 2010 2011 2012 2013e
World production, kt 1 160 1 250 1 620 1 460 1 440
e – preliminary values
The largest producers in 2013 were Australia with a share of 41.6 %, South Africa in second place with 25 %, and China third with 9.7 %.
The USGS estimated world reserves at 67 million tonnes, of which nearly two-thirds are in Australia. Quantitative estimates of world resources of both elements were not available.
Prices of traded commoditiesThe average annual prices of zircon in USD/t (according to the summaries Deutschland-Rohstoffsituation 2009–2013) were as follows:
Commodity/Year 2009 2010 2011 2012 2013
Zircon, standard, bulk shipments,
FOB Australia875.83 850.21 1 720.83 2 393.75 1 375.00

372Minerals unmined in the past with resources and reserves – Zirconium, hafnium
The following prices (USD/t) were provided by Industrial Minerals:
Commodity/Year 2009 2010 2011 2012 2013
Zircon, bulk shipments, standard, FOB Australia
825–900 850–950 900–2 600 2 000–2 150 1 250–1 550
Zircon, bulk shipments, premium, FOB Australia
875–950 800–1 050 1 100–2 640 2100–2 300 1 350–1 550
Zircon, bulk shipments, standard, FOB USA 775–860 830–890 850–2 750 2 550–2 750 2 550–2 750
Zircon, bulk shipments, premium, FOB USA 775–990 880–1 020 950–3 000 2 600–3 000 2 600–3 000
Zircon, ceramic grade, bulk shipments, FOB South Africa
750–880 825–890 1 100–2 650 2 300–2 650 2 300–2 650
Micronised zircon, 99.5 % < 4 μ, average particle size < 0,95 μ, C&F Asia
1 415–1 465 1 100–1 445 2 750–2 800 2 750–2 800 2 750–2 800
Fused zirconia, monoclinic,refractory/abrasive, contract price, CIF main European port
4 100–4 400 4 100–5 200 6 500–7 800 6 500–7 800 6 500–7 800
Fused zirconia, monoclinic,ceramic pigment grade, contract price, CIF main European port
N N N 3 800–4 800 3 800–4 800
Fused zirconia, monoclinic, structural ceramic/electronic grade, contract price, CIF main European port
N N N 4 600–6 000 4 600–6 000
Fused zirconia, monoclinic, technical ceramic grade, contract price, CIF main European port
N N N 15 900–21 000 15 900–21 000
Fused zirconia, stabilised, refractory grade, contract price, CIF main European port
N N N 6 500–7 800 6 500–7 800
Fused zirconia, stabilised, technical ceramic grade, contract price, CIF main European port
N N N 5 000–10 000 5 000–10 000
Zircon opacifier, micronised, 100 % < 6 microns, average 1–2 microns, bagged, CFR Asia
N N N 2 845–3 400 2 845–3 400
Zircon opacifier, micronised, 100 % < 6 microns, average 1–2 microns, bagged, ex-works Europe
N N N 2 770–3 400 2 770–3 400
Baddeleyite, ceramic grade (98 % ZrO2 + HfO2), contract price, CIF main European port
3 000–3 300 3 000–3 300 N 3 000–3 300 3 000–3 300
Baddeleyite, refractory/abrasive grade, contract price, CIF main European port
2 500–3 100 2 500–3 100 N 2 500–3 100 2 500–3 100
Baddeleyite, ceramic pigment grade, contract price, CIF main European port
N N N 3 200–3 500 3 200–3 500
Notices: micron (μ) – micrometre (μm); 1 μm = 1/1 000 000 mThe price range includes the lowest and highest monthly price quotes for a given year.

373
MINERALS UNMINED IN THE PAST WITHOUT RESOURCES AND RESERVES
INDUSTRIAL MINERALS
Andalusite, kyanite, sillimanite, mullite
Foreign trade
250850 – Andalusite, kyanite and sillimanite
2009 2010 2011 2012 2013
Import t 4 227 3 682 4 089 4 451 7 986
Export t 1 2 10 16 3
250860 – Mullite
2009 2010 2011 2012 2013
Import t 502 776 829 612 1 152
Export t 0.7 0.4 28 140 0.4
250850 – Andalusite, kyanite and sillimanite
2009 2010 2011 2012 2013
Average import prices CZK/t 10 451 10 114 10 440 10 681 9 925
Average export prices CZK/t 14 286 19 512 29 110 10 816 31 343
250860 – Mullite
2009 2010 2011 2012 2013
Average import prices CZK/t 29 097 23 495 23 726 19 688 23 773
Average export prices CZK/t 22 069 40 000 12 532 25 015 57 778
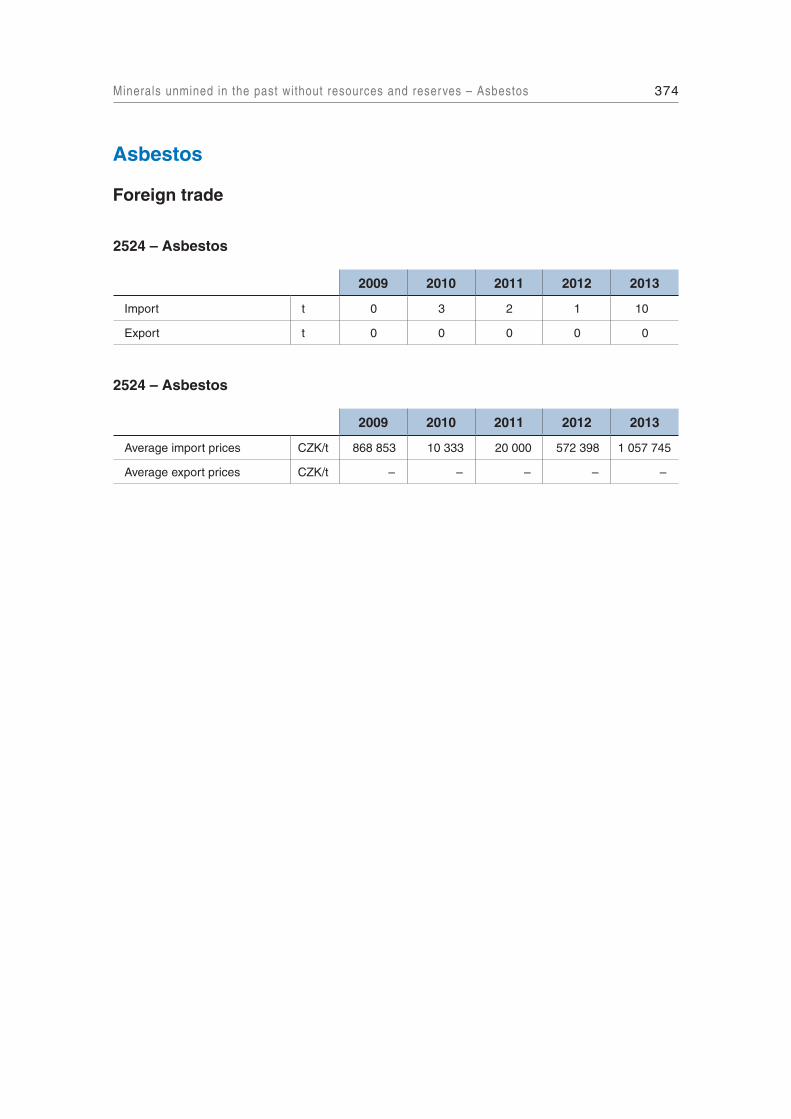
374Minerals unmined in the past without resources and reserves – Asbestos
Asbestos
Foreign trade
2524 – Asbestos
2009 2010 2011 2012 2013
Import t 0 3 2 1 10
Export t 0 0 0 0 0
2524 – Asbestos
2009 2010 2011 2012 2013
Average import prices CZK/t 868 853 10 333 20 000 572 398 1 057 745
Average export prices CZK/t – – – – –

375Minerals unmined in the past without resources and reserves – Magnesite
Magnesite
Foreign trade
251910 – Natural magnesium carbonate (magnesite)
2009 2010 2011 2012 2013
Import t 3 460 7 108 4 579 5 270 3386
Export t 10 8 4 0.003 0.006
251990 – Magnesia*, fused, dead-burned, other magnesium oxides
2009 2010 2011 2012 2013
Import t 38 046 38 891 40 982 43 239 46 433
Export t 3 718 3 803 7 093 5 998 4 691
Note: * – MgO
251910 – Natural magnesium carbonate (magnesite)
2009 2010 2011 2012 2013
Average import prices CZK/t 4 498 5 426 7 534 5 938 3 798
Average export prices CZK/t 189 740 200 870 68 241 153 846 607 143
251990 – Magnesia*, fused, dead-burned, other magnesium oxides
2009 2010 2011 2012 2013
Average import prices CZK/t 8 434 8 771 8 329 12 482 8 712
Average export prices CZK/t 8 131 10 501 9 457 9 995 10 808
Note: * – MgO

376Minerals unmined in the past without resources and reserves – Per l i te
Perlite
Foreign trade
25301010 – Perlite
2009 2010 2011 2012 2013
Import t 4 528 0 0 0 N
Export t 114 0 0 0 N
25301010 – Perlite
2009 2010 2011 2012 2013
Average import prices CZK/t 3 966 – – – N
Average export prices CZK/t 44 716 – – – N

377Minerals unmined in the past without resources and reserves – Rock salt
Rock salt
Foreign trade
2501 – Salt (inclusive table and denaturated salt), and pure sodium chloride; also in water solution
2009 2010 2011 2012 2013
Import t 711 503 960 330 865 911 564 702 1 046 592
Export t 40 055 51 290 41 680 25 882 79 400
2501 – Salt (inclusive table and denaturated salt), and pure sodium chloride; also in water solution
2009 2010 2011 2012 2013
Average import prices CZK/t 1 459 1 480 1 439 1 562 1 386
Average export prices CZK/t 3 133 2 900 3 152 4 304 2 902

378Minerals unmined in the past without resources and reserves – Talc
Talc
Foreign trade
2526 – Natural steatite; talc
2009 2010 2011 2012 2013
Import t 9 406 9 570 12 754 8 826 9 749
Export t 182 169 297 214 269
2526 – Natural steatite; talc
2009 2010 2011 2012 2013
Average import prices CZK/t 7 089 6 639 5 851 5 588 8 036
Average export prices CZK/t 14 726 16 148 13 094 17 664 17 409

379Minerals unmined in the past without resources and reserves – Other raw materials
Other raw materials used in industrial fertilizers production
Foreign trade
3102 – Nitrogenous fertilizers
2009 2010 2011 2012 2013
Import t 429 687 556 146 652 708 645 779 691 551
Export t 540 846 579 923 582 234 596 569 485 196
2510 – Natural phosphates
2009 2010 2011 2012 2013
Import t 559 15 021 13 165 210 35
Export t 817 1 0.1 0.1 1
2809 – Phosphoric oxides and acids
2009 2010 2011 2012 2013
Import t 3 328 3 091 3 289 6 172 4 557
Export t 34 028 46 290 51 186 > 33 817 55 215
3102 – Nitrogenous fertilizers
2009 2010 2011 2012 2013
Average import prices CZK/t 4 426 4 388 5 599 6 102 6 265
Average export prices CZK/t 4 678 4 010 5 593 5 922 5 717
2510 – Natural phosphates
2009 2010 2011 2012 2013
Average import prices CZK/t 7 242 4 802 7 251 19 871 13 057
Average export prices CZK/t 27 807 N 55 944 8 000 18 723
2809 – Phosphoric oxides and acids
2009 2010 2011 2012 2013
Average import prices CZK/t 20 132 20 068 19 504 10 753 11 293
Average export prices CZK/t 17 621 14 054 16 446 ≠16 458 17 698

380Minerals unmined in the past without resources and reserves – Other raw materials
3103 – Phosphatic fertilizers
2009 2010 2011 2012 2013
Import t 10 848 17 269 17 769 23 076 16 252
Export t 895 1 098 920 275 304
3104 – Potassic fertilizers
2009 2010 2011 2012 2013
Import t 41 560 87 735 90 669 79 028 70 847
Export t 7 027 4 234 4 707 3 861 3 322
3105 – Fertilizers containing several elements
2009 2010 2011 2012 2013
Import t 53 757 100 466 116 802 133 272 144 562
Export t 17 494 18 031 15 497 17 263 7 117
3103 – Phosphatic fertilizers
2009 2010 2011 2012 2013
Average import prices CZK/t 6 375 6 419 7 963 9 141 8 033
Average export prices CZK/t 5 735 8 948 14 261 16 532 20 036
3104 – Potassic fertilizers
2009 2010 2011 2012 2013
Average import prices CZK/t 14 129 7 949 8 843 9 587 9 320
Average export prices CZK/t 15 532 19 122 19 349 21 026 27 249
3105 – Fertilizers containing several elements
2009 2010 2011 2012 2013
Average import prices CZK/t 9 446 8 713 10 677 11 835 10 980
Average export prices CZK/t 9 445 8 214 11 141 11 595 23 527

381Minerals unmined in the past without resources and reserves – Aluminium
2606 – Aluminium ores and concentrates
2009 2010 2011 2012 2013
Import t 9 875 33 795 32 555 27 514 24 765
Export t 589 1 97 2 5
281820 – Aluminium oxide (other than synthetic corundum)
2009 2010 2011 2012 2013
Import t 6 011 7 473 8 045 7 735 9 094
Export t 3 069 3 785 97 4 069 5 389
2606 – Aluminium ores and concentrates
2009 2010 2011 2012 2013
Average import prices CZK/t 3 386 2 973 3 172 4 000 4 000
Average export prices CZK/t 14 321 31 915 6 420 616 758 37 960
281820 – Aluminium oxide (other than synthetic corundum)
2009 2010 2011 2012 2013
Average import prices CZK/t 21 717 21 361 22 542 23 206 21 695
Average export prices CZK/t 6 385 6 464 8 499 10 199 7 863
METALLIC ORES
Aluminium
Foreign trade

382Minerals unmined in the past without resources and reserves – Aluminium
7601 – Raw (unwrought) aluminium
2009 2010 2011 2012 2013
Import t 171 248 222 566 242 861 218 551 238 915
Export t 59 988 51 489 53 610 60 943 65 007
7602 – Aluminium waste and scrap
2009 2010 2011 2012 2013
Import t 50 381 61 805 87 218 103 580 81 478
Export t 49 145 71 562 89 711 86 004 56 311
7601 – Raw (unwrought) aluminium
2009 2010 2011 2012 2013
Average import prices CZK/t 37 064 46 311 49 495 46 776 45 057
Average export prices CZK/t 33 487 45 935 48 020 44 291 44 984
7602 – Aluminium waste and scrap
2009 2010 2011 2012 2013
Average import prices CZK/t 20 709 31 521 32 354 30 937 30 213
Average export prices CZK/t 22 742 32 565 32 593 29 862 27 634
281830 – Aluminium hydroxide
2009 2010 2011 2012 2013
Import t 6 493 9 534 10 062 8 893 9 574
Export t 88 77 27 29 26
281830 – Aluminium hydroxide
2009 2010 2011 2012 2013
Average import prices CZK/t 9 329 7 034 7 013 9 631 9 752
Average export prices CZK/t 13 036 15 120 21 611 18 527 15 749

383Minerals unmined in the past without resources and reserves – Beryl l ium
Beryllium
Foreign trade
811212 – Unwrought beryllium, beryllium powders
2009 2010 2011 2012 2013
Import kg 0 1 0 0 3
Export kg 0 0 0 0 N
811212 – Unwrought beryllium, beryllium powders
2009 2010 2011 2012 2013
Average import prices CZK/kg – 2 000 – – 49 000
Average export prices CZK/kg – – – – N

384Minerals unmined in the past without resources and reserves – Bismuth
Bismuth
Foreign trade
81060010 – Unwrought bismuth, including waste and scrap, powders
2009 2010 2011 2012 2013
Import kg 50 557 94 522 267 387 108 014 83 334
Export kg 51 17 945 2 295 4 172 2 885
81060090 – Wrought bismuth, articles of bismuth, excluding unwrought bismuth, waste, scrap and powders
2009 2010 2011 2012 2013
Import kg 2 142 11 452 1 708 2 691 19 319
Export kg 407 1 087 1 188 > 221 6 414
81060010 – Unwrought bismuth, including waste and scrap, powders
2009 2010 2011 2012 2013
Average import prices CZK/kg 315 375 214 429 364
Average export prices CZK/kg 686 277 392 310 324
81060090 – Wrought bismuth, articles of bismuth, excluding unwrought bismuth, waste, scrap and powders
2009 2010 2011 2012 2013
Average import prices CZK/kg 699 506 2 405 1 552 545
Average export prices CZK/kg 1 484 1 339 2 183 ≠ 8185 750

385Minerals unmined in the past without resources and reserves – Cadmium
Cadmium
Foreign trade
810720 – Unwrought cadmium, cadmium powders
2009 2010 2011 2012 2013
Import kg 43 67 697 18 141 58
Export kg 0 0 < 1 0 0
810720 – Unwrought cadmium, cadmium powders
2009 2010 2011 2012 2013
Average import prices CZK/kg 2 674 3 015 264 10 1 069
Average export prices CZK/kg – – 1 000 – –

386Minerals unmined in the past without resources and reserves – Chromium
Chromium
Foreign trade
2610 – Chromium ores and concentrates
2009 2010 2011 2012 2013
Import t 8 244 7 975 8 032 8 413 6 897
Export t 369 764 1 410 1 061 839
811881 – Unwrought chromium
2009 2010 2011 2012 2013
Import kg 0 0 0 0 0
Export kg 0 0 0 0 0
2610 – Chromium ores and concentrates
2009 2010 2011 2012 2013
Average import prices CZK/t 9 191 9 164 11 210 10 255 9 752
Average export prices CZK/t 5 912 4 336 7 534 7 088 7 225
811881 – Unwrought chromium
2009 2010 2011 2012 2013
Average import prices CZK/kg – – – – –
Average export prices CZK/kg – – – – –

387Minerals unmined in the past without resources and reserves – Gall ium
81129289 – Unwrought gallium, gallium powders
2009 2010 2011 2012 2013
Import kg 9 4 11 4 3
Export kg 1 0 0 0 0
81129289 – Unwrought gallium, gallium powders
2009 2010 2011 2012 2013
Average import prices CZK/kg 1 267 2 200 27 090 42 250 17 667
Average export prices CZK/kg 2 300 – – – –
Gallium
Foreign trade
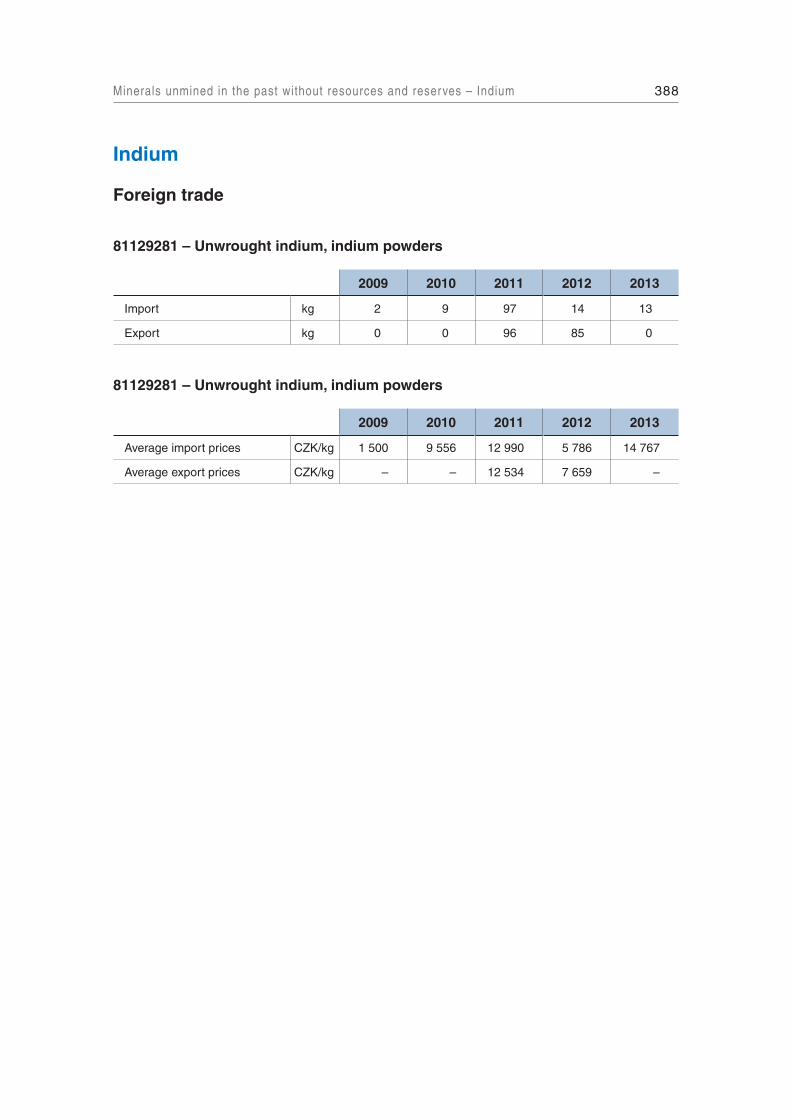
388Minerals unmined in the past without resources and reserves – Indium
Indium
Foreign trade
81129281 – Unwrought indium, indium powders
2009 2010 2011 2012 2013
Import kg 2 9 97 14 13
Export kg 0 0 96 85 0
81129281 – Unwrought indium, indium powders
2009 2010 2011 2012 2013
Average import prices CZK/kg 1 500 9 556 12 990 5 786 14 767
Average export prices CZK/kg – – 12 534 7 659 –

389Minerals unmined in the past without resources and reserves – Magnesium
Magnesium
Foreign trade
810411 – Unwrought magnesium, containing at least 99.8 % by weight of magnesium
2009 2010 2011 2012 2013
Import t 892 1 992 1 449 12 456 2 056
Export t 179 0,2 0 0,2 17
810419 – Unwrought magnesium, containing less than 99.8 % by weight of magnesium
2009 2010 2011 2012 2013
Import t 545 754 647 7 615 719
Export t 5 486 5 914 7 699 7 147 8 118
810411 – Unwrought magnesium, containing at least 99.8 % by weight of magnesium
2009 2010 2011 2012 2013
Average import prices CZK/t 55 579 55 849 57 946 64 644 59 244
Average export prices CZK/t 72 226 215 569 – 84 000 95 705
810419 – Unwrought magnesium, containing less than 99.8 % by weight of magnesium
2009 2010 2011 2012 2013
Average import prices CZK/t 95 232 87 246 85 681 94 541 93 410
Average export prices CZK/t 55 809 47 030 48 092 52 691 60 197

390Minerals unmined in the past without resources and reserves – Nickel
Nickel
Foreign trade
2604 – Nickel ores and concentrates
2009 2010 2011 2012 2013
Import t 7 7 14 6 129
Export t 180 254 268 20 151
7502 – Unwrought nickel
2009 2010 2011 2012 2013
Import t 2 165 2 560 3 757 2 799 2 367
Export t 228 126 273 724 1 667
2604 – Nickel ores and concentrates
2009 2010 2011 2012 2013
Average import prices CZK/t 319 651 400 000 376 438 464 688 310 710
Average export prices CZK/t N N 3 407 352 128 314 198
7502 – Unwrought nickel
2009 2010 2011 2012 2013
Average import prices CZK/t 386 745 450 766 432 625 368 258 317 661
Average export prices CZK/t 230 220 352 907 471 424 318 601 284 929

391Minerals unmined in the past without resources and reserves – Thall ium
Thallium
Foreign trade
811251 – Unwrought thallium
2009 2010 2011 2012 2013
Import kg 0 1 < 1 0 0
Export kg 0 0 0 0 4
811251 – Unwrought thallium
2009 2010 2011 2012 2013
Average import prices CZK/kg – 4 000 > 17 000 – –
Average export prices CZK/kg – – – – 2 750

392Minerals unmined in the past without resources and reserves – Thor ium
Thorium
Foreign trade
28443061 – Thorium bars, rods, angles, shapes, sections, wire, sheets, strips
2009 2010 2011 2012 2013
Import kg 41 959 4 0 < 1 < 1
Export kg 360 0 0 < 1 0
28443069 – Thorium other, not crude, waste, scrap, bars, rods, shapes, wire, sheets
2009 2010 2011 2012 2013
Import kg 1 0 < 1 0 < 1
Export kg 0 0 0 0 0
28443061 – Thorium bars, rods, angles, shapes, sections, wire, sheets, strips
2009 2010 2011 2012 2013
Average import prices CZK/kg 46 3 250 – > 1 280 000 > 82 000
Average export prices CZK/kg 47 – – > 354 000 –
28443069 – Thorium other, not crude, waste, scrap, bars, rods, shapes, wire, sheets
2009 2010 2011 2012 2013
Average import prices CZK/kg 5 000 – 2 000 – 2 000
Average export prices CZK/kg – – – – –

393Minerals unmined in the past without resources and reserves – Thor ium
28443099 – Thorium salts
2009 2010 2011 2012 2013
Import kg 0 0 0 1 1
Export kg 0 0 0 0 0
28443099 – Thorium salts
2009 2010 2011 2012 2013
Average import prices CZK/kg – – – 5 000 3 000
Average export prices CZK/kg – – – – –

394Minerals unmined in the past without resources and reserves – Titanium
Titanium
Foreign trade
2614 – Titanium ores and concentrates
2009 2010 2011 2012 2013
Import t 140 394 155 505 146 778 98 050 100 317
Export t 452 2 378 504 684 758
8108 – Titanium and products of it, including waste and scrap
2009 2010 2011 2012 2013
Import t 925 1 030 1 341 1 723 1 886
Export t 340 359 268 390 369
2614 – Titanium ores and concentrates
2009 2010 2011 2012 2013
Average import prices CZK/t 3 395 3 236 3 876 7 947 6 467
Average export prices CZK/t 20 254 5 935 23 369 55 468 48 398
8108 – Titanium and products of it, including waste and scrap
2009 2010 2011 2012 2013
Average import prices CZK/t 564 007 541 650 645 106 507 213 464 455
Average export prices CZK/t 110 433 90 892 133 014 139 101 255 165

395Minerals unmined in the past without resources and reserves – Vanadium
81129291 – Unwrought vanadium, vanadium powders, excluding waste and scrap
2009 2010 2011 2012 2013
Import kg 0 0 0 1 1 928
Export kg 236 0 0 0
81129291 – Unwrought vanadium, vanadium powders, excluding waste and scrap
2009 2010 2011 2012 2013
Average import prices CZK/kg – – – 4 000 285
Average export prices CZK/kg 297 – – – –
Vanadium
Foreign trade

MINERAL COMMODITY SUMMARIES OF THE CZECH REPUBLIC
2014 Yearbook
Published by the Czech Geological SurveyPrague 2014Printed by the Czech Geological Survey Klárov 131/3, 118 21 Praha 1First edition, 396 pages03/9 446-408-15
ISSN 1801-6707ISBN 978-80-7075-883-0The publication was supported by the financial contribution from the Ministry of the Environment of the Czech Republic